whole genome amplification of bacterial dna ...639656/fulltext01.pdf · whole genome amplification...
TRANSCRIPT

1
Whole genome amplification of bacterial DNA: Identification of SHV-, LEN- and OPK-genes with SP6 and
T7 sequence tagged PCR amplicons
Ulrika Svensson Diploma Work for candidate degree in biomedicine performed at IBK,
Faculty of Health Sciences, Linköping University
Supervisor: Hans-Jürg Monstein, IBK

2
Abstract Background The chromosomal gene SHV-1 of Klebsiella Pneumoniae is a β-lactamase gene from which many extended spectrum β-lactamase (ESBL) genes is thought to have developed. The frequent occurance of this gene in K. pneumoniae has lead to the assumption that it is present on the chromosome of all K. pneumoniae. However, some findings reveal a number of K. pneumoniae that lacks this specific gene but instead possess SHV-1’s close relatives LEN or OKP. The three different β-lactamase genes are supposedly unequally distributed among the three phylogentically different groups Kp1, Kp2 and Kp3 of K. pneumoniae. The aim of this study was PCR detection of β-lactamase genes in K. pneumoniae with a universal primer for SHV, LEN and OKP, and identification by sequencing and bioinformatic analysis. Methods and Materials Twenty clinical isolates of K. pneumoniae, 1 clinical isolate of K. oxytoca and six reference strains were included in various PCR amplification assays. Initially, PCR was carried out with an old primer pair specific for only the SHV gene, to reveal if any of the clinical isolates were SHV negative. To examine whether it was possible to target the β-lactamase gene in all of the clinical isolates, a new universal primer was designed to target not only SHV, but also LEN and OKP, The new primer was provided with sequence tags to allow sequencing of the clinical isolates and reference strains. The nucleic sequence information was used to create a phylogenetical tree and to observe the relationship among the different β-lactamase genes. In addition, the universal primer was tested with a PCR master mix containing the enzyme Uracil-N-Glycosylas, UNG, which is used for decontamination. The decontaminating ability of UNG was also tested in a PCR amplification assay. Results Seventeen out of the twenty one clinical isolates were SHV positive in the PCR amplification assays with the SHV specific primer. All of the clinical isolates (except for K. oxytoca) including the six reference strains were positive with PCR when a new universal primer was used. After sequencing and sequence analysis, it was established that the two out of the three SHV negative strains possessed β-lactamase gene LEN and one possessed β-lactamase gene OPK. The combination of the universal primer and the master mix containing UNG was successful, and UNG proved to be efficient in eliminating contamination. Discussion The phylogenetical tree showed resemblance with phylogenetical trees from previous studies of the β-lactamase genes in K. pneumoniae. This supports the theory that the chromosomal β-lactamase gene in K. pneumoniae is either of SHV, LEN or OKP type.

3
1. INTRODUCTION.............................................................................................................. 5 1.1 CHROMOSOMAL β-LACTAMASES IN KLEBSIELLA PNEUMONIAE ................ 5
1.1.1 β-lactame antibiotics ................................................................................................. 5 1.1.2 Different classes of β-lactamases .............................................................................. 6 1.1.3 Chromosomally encoded β-lactamases in Klebsiella pneumoniae ........................... 7 1.1.4 Bioinformatics........................................................................................................... 8
1.2 PCR .................................................................................................................................. 8 1.2.1 Fidelity ...................................................................................................................... 9 1.2.2 Reaction Conditions ................................................................................................ 10 1.2.3 PCR and contamination........................................................................................... 11
1.3 PRIMER DESIGN ......................................................................................................... 12 1.3.1 Primer length ........................................................................................................... 12 1.3.2 Nucleotide composition........................................................................................... 12 1.3.3 Primer dimer formation and secondary structures .................................................. 13 1.3.4 Primer sequence 3’ end ........................................................................................... 13 1.3.5 Degenerate primers ................................................................................................. 14
1.4 MULTIPLE DISPLACEMENT AMPLIFICATION..................................................... 14 Aim................................................................................................................................... 17
2. METHODS AND MATERIALS......................................................................................... 18 2.1 Flowchart of methods..................................................................................................... 18 2.2 BACTERIAL STRAINS................................................................................................ 19 2.3 AUTOMATED DNA ISOLATION............................................................................... 19 2.4 MULTIPLE DISPLACEMENT AMPLIFICATION..................................................... 19 2.5 DETECTION OF blaSHVA IN K. PNEUMONIAE ..................................................... 20
2.5.1Annealing temperature optimization of old primers ................................................ 20 2.5.2 Amplification of blaSHV in clinical isolates of K. pneumoniae............................. 20 2.6 DETECTION OF blaSHV, blaLEN AND blaOKP IN K. PNEUMONIAE ............... 20 2.6.1 Design of universal primers .................................................................................... 20 2.6.2 Annealing temperature optimization of universal primers...................................... 21 2.6.3 Amplification of blaSHV, blaLEN and blaOKP in clinical isolates of K. pneumoniae ...................................................................................................................... 21
2.7 NUCLEIC SEQUENCE ANALYSIS OF PCR AMPLICONS ..................................... 21 2.8 PCR WITH UNIVERSAL PRIMERS AND HOTSTAR Taq DNA POLYMERASE . 22
2.8.1 Optimiztion of MgCl2 and annealing temperature .................................................. 22 2.8.2 Detection of blaSHV, blaLEN and blaOKP with Hot Start Taq Polymerase ......... 22 2.8.3 Verification of Uracil-N-Glycosylas activity .......................................................... 23
2.9 COMPARATIVE PERFORMANCE OF WHOLE CELL DNA FROM FROZEN BACTERIAL STRAINS AND EXTRACTED DNA FROM CULTURED STRAINS IN A MDA-ASSAY ...................................................................................................................... 23 2.10 ANALYSIS OF AMPLIFICATION PRODUCTS IN PCR ........................................ 24
3. RESULTS............................................................................................................................. 25 3.1 Detection of blaSHV in K. pneumoniae......................................................................... 25 3.2 Detection of blaSHV, blaLEN and blaOKP in K. pneumoniae ..................................... 25 3.3 Nucleic sequence analysis of PCR amplicons................................................................ 25 3.4 PCR with universal primers and HotStar Taq DNA Polymerase................................... 27
3.4.1 Verification of Uracil-N-Glycosylas activity .......................................................... 27 3.5 Comparison of whole cell DNA from frozen bacterial strains and extracted DNA from cultured strains in MDA....................................................................................................... 28
4. DISCUSSION ...................................................................................................................... 28 4.1 Chromosomally encoded β-lactamases in K. pneumoniae............................................. 28

4
4.2 PCR with universal primers and HotStar Taq DNA Polymerase................................... 31 4.2.1 Verification of UNG activity................................................................................... 32
4.3 Comparison of whole cell DNA from frozen bacterial strains and extracted DNA from cultured strains in MDA....................................................................................................... 32
Acknowledgements .................................................................................................................. 34 References ................................................................................................................................ 35
Web pages ............................................................................................................................ 36 Appendix 1 ............................................................................................................................... 37 Appendix 2 ............................................................................................................................... 39

5
1. INTRODUCTION
1.1 CHROMOSOMAL β-LACTAMASES IN KLEBSIELLA PNEUMONIAE
1.1.1 β-lactame antibiotics The bactericidal activity of β-lactames has since its discovery revolutionized the treatment of
bacterial infections both in humans and in animals. The basic structure of the four groups of
β -lactame antibiotics includes the β-lactame ring and various substituents (figure 1) that give
different properties (1). Many bacteria had developed enzymes called β-lactamases, to avoid
being inavticated by β-lactames long before the beginning of antibiotic therapy. This could be
explained by the fact that many antibiotics, like β-lactames, are naturally existing compounds
in the environment which would benefit microorganisms carrying the enzymes. Another
explanation is that enzymes that confer resistance to β-lactames also have another physical
role besides inactivating β-lactames (2). β-lactamases are able to hydrolyze the β-lactame
ring, which is absolutely essential for bactericidal activity. When the ring is hydrolyzed, it
forms penicilloic which cannot damage the bacteria. Nearly all gram-negative bacteria have a
chromosomally encoded β-lactamase that hydrolyses predominantly cephalosporins but also
to some extent penicillins The enzyme is not always necessary expressed, but its expression is
significantly increased when the bacterium is exposed to β-lactames, and a single mutation
can cause it to be expressed at high levels constantly (1). Bacterial genes that confer
resistance to antibiotics, like genes encoding β-lactamases, can be exchanged between
bacteria by transformation, transduction or conjugation. This may not occur frequently under
normal circumstances but antibiotic pressure causes a more effective exhange of resistance
genes (3).

6
Figure 1
The basic structures of the four
groups of β-lactame antibiotics (1).
From Rang, Dale, Ritter and Moore
Pharmacology 5th edition, p 640.
1.1.2 Different classes of β-lactamases Because of their extreme efficiency as antibiotics, penicillins and cephalosporins are widely
used to treat many sorts of bacterial infections. An unwanted side effect of this heavy usage is
increased resistance to β-lactame antibiotics due to β-lactamases. Already in the 1960s, there
was a need for β-lactamase stable β-lactames, which is why broad spectrum penicillins were
developed and entered the market. Unfortunately it did not take long for the first cases of
broad spectrum resistance to emerge among bacteria. Many β-lactamases were identified,
some plasmid mediated and other chromosomal, with different hydrolytic profiles and
different susceptibility patterns (4).
The most widespread broad spectrum β-lactamases were plasmid mediated TEM (from a
greek patient named Temoneira) of unknown origin, and SHV (from sulphydryl variable)
which is an allelic variant of the chromosomal β-lactamase SHV-1 in K. pneumoniae (3). To
overcome treatment failure because of broad spectrum β-lactamases, broad spectrum β-
lactamase stable β-lactames, also called third generation cephalosporines or oxyimino-
cephalosporins, were developed in the 1970s. These include for example cefuroxime,
ceftriaxone, ceftazidime and cefepime, and were first not hydrolyzed by broad spectrum β-
lactamases (5). When a SHV-1 derivative, named SHV-2, that hydrolyzed not only broad

7
spectrum β-lactames but also third generation cephalosporins, was discovered in 1982, it
became the first extended broad spectrum β-lactamase. Mutants of TEM-1 were discovered,
that were also capable of inactivating third generation cephalosporins (4). The TEM-1 and
SHV-1 derivatives had an extended β-lactamase activity because of the ability to hydrolyze
third generation cephalosporins, compared to their progenitors, only capable of inactivating
broad spectrum β-lactames (5). The name extended spectrum β-lactamase, ESBL, was used to
describe these mutants that are increasing in number and have grown to over 200. Another
gene was also found to give rise to this type of resistance, which was named CTX-M
(cefotaximase). The ESBLs encoded by different variants of CTX-M has increased lately (4).
Today, the classifications of β-lactamases most often used are the Ambler system which is
based on similarities in amino acid sequence, and the Bush-Jacoby-Medeiros system based
upon functional activities. The Ambler system groups β-lactamases into four groups, A, B, C
and D. Class A, C and D are serine hydrolases and class B are metalloenzymes that require
zinc for their enzymatic activities (3). Most ESBLs belong to group A (6). In the Bush-
Jacoby-Medeiros system every β-lactamase is given a number , as an example, ESBLs are
found in group 2be (7).
1.1.3 Chromosomally encoded β-lactamases in Klebsiella pneumoniae While the origin of TEM-genes remains unknown, it is almost certain that plasmid-borne
SHV, which have given rise to ESBL phenotype, comes from the chromosome of the gram
negative rod K. pneumoniae (4). While some rapports show that all K.pneumoniae carries the
SHV-1 gene on their chromosome (8,9), question remains if this is really true. Other
researchers claim to have found K.pneumoniae that lack this species-specific gene (2).
According to these findings, the SHV-negative K.pneumoniae carries one of two other
chromosomal β-lactamase genes with similar degrees of resistance to broad spectrum
penicillins, namely LEN or OKP. blaSHV, blaLEN and blaOKP (bla for β-lactamase) are
closely related gene families and the diversification from a common ancestor has presumably
occurred as a long-term evolutionary process. The evolution of the three different β-lactamase
families appears to have occurred in parallel with the development of the three phylogenetic
groups Kp1, Kp2 and Kp3 identified in K. pneumoniae (2). K. pneumoniae of genotype Kp1
corresponds to SHV and Kp2 and Kp3 corresponds to blaOKP and blaLEN respectively. The
blaOKP gene family is more heterogeneous than the other two and is divided into two
subfamilies, OKP-A and OKP-B. 90% of all clinical isolates from European hospitals consist

8
of K. pneumoniae of genotype Kp1 and thus SHV is present on the chromosome of most
K.pneumoniae in Europe but not all (2).
Accordingly, K.pneumoniae strains carry either a chromosomally located blaSHV, blaLEN or
blaOKP gene. This is an important clinical issue to be considered when using blaSHV-
genotyping analysis by means of PCR amplification. Since nucleotide sequences differs
between these phylogenetically different subgroups, a primer based on the blaSHV sequence
that is meant to be universal for all K.pneumoniae might not be universal at all if some
K.pneumoniae actually posses blaLEN or blaOKP genes. This would result in false negatives
and incorrect bacterial speciation of K.pneumoniae.
1.1.4 Bioinformatics Besides conventional culture methods, genotyping methods such as PCR are valuable
methods for detecting antibiotic resistance genes (3). PCR detection of resistance genes
requires information about the nucleid acid sequences to be amplified. Such information can
be found in biological databases, which are used to store and organize information collected
from research projects involving DNA, RNA and protein analysis. GenBank at the National
Center for Biotechnology Information (NCBI) is one of the biggest sequence databases, which
does not only store sequence data but also related sequence information. This information
includes references to the original articles in PubMed and information about species based on
DNA sequences and phylogenetic trees (10). This type of related information is very
important when evaluating the quality of the data, since retrieved data are not always
trustworthy.
1.2 PCR Prokaryotic and eukaryotic cells have a bidirectionell mechanism of DNA replication. This is
a process which is very complex and involves many different enzymes. This cellular process
has to be carefully regulated since the result is replication of the cellular genome and
proliferation of cells (11). The polymerase chain reaction, PCR, uses only the basic concept of
this complex process. Amplifiaction of a DNA region of interest is accomplished by cycles of
melting at high temperature and synthesis at a lower temperature. The components needed for
a successful PCR reaction are reaction buffer, deoxynucleotides, sequence specific
9
oligonucleotide primers, a thermostable DNA polymerase and template DNA which contains
the region to be amplified (12).
To start the reaction, the temperature is set to 94 -95 °C. This temperature provides enough
energy for the hydrogen bonds between the base pairs to break, and as a result the DNA
duplex forms two separate strands. This process is called denaturation. Templates rich in GC
content may require a higher temperature since the GC contains three hydrogen bonds while
AT contains only two (11). Denaturation of the duplex is very important for the next step to
proceed, which is annealing at ambient temperatures. During this step, primers hybridize to a
single stranded DNA (ssDNA) region flanking the region of intereset. The primers are added
in excess to the reaction to ensure that the primers will bind to the ssDNA before the two
strands reassociate. If the two DNA strands are not separated at this point, it is impossible for
the primers to anneal. After annealing, the temperature is raised to 72 °C which makes the
polymerase elongate the primers at the 3’ ends using deoxynucleotides as building blocks
(12). It is easy to understand why the polymerase has to be able to tolerate high temperatures.
The most widely used DNA-polymerase, Taq, comes from Thermus aquaticus (a bacterium
that lives in hot springs) and maintains its catalytic function throughout the whole PCR
reaction (11).
During the first cycles, the primers have to search for their complementary region on the
template DNA, but since the concentration of primers is relatively high this is not a problem.
As the copies of product with a region complementary to the primer increases this search is
made easier and the amplification becomes exponential. This amplification cannot go on
forever because of changes of the relative concentrations of some of the components of the
reaction. When all of the polymerase is occupied with synthesizing DNA, a big part of the
deoxynucleotides is used and the ratio between primers and products is remarkably reduced,
continuous cycles can lead to undesired products. This is why a standard PCR reaction should
not include more than 30-35 cycles of heating and cooling (12).
1.2.1 Fidelity The 3’→5’-exonuclease activity, a feature exhibited by almost all DNA-polymerases is a way
to avoid the incorporation of the wrong nucleotides during in vivo replication. This means that
when an incorrect base is incorporated at the 3’ end, the end of the duplex melts and is

10
transferred to the 3’→5’-exonuclease site where it is removed. This mechanism is called
proofreading and it is the first line of defence in preventing mutations during DNA replication
in vivo (11). The use of DNA polymerases with 3’→5’-exonuclease activity in PCR allows
correction of errors and thus gives a higher fidelity (12).
1.2.2 Reaction Conditions The ion, annealing temperature and pH conditions in a PCR reaction, sometimes referred to as
stringency, determine the specificity and efficiency of the reaction (13). The PCR-buffer
contains many different ions with Mg2+ being the most important one. Mg2+ is a DNA
polymerase cofactor involved in binding of DNA, template and nucleotides in the reaction
(14). The buffer also controls the pH in the reaction. If pH is to low, the bases become
protonated and start to repel each other. At high pH, the bases are deprotonated which also
leads to repulsion (11).
Although the buffer composition is important, the annealing temperature is the main
stringency factor (15). The annealing temperature determines whether the primer anneals only
to sequences with perfect homology or if it is also allowed to anneal to sequences that are not
perfectly complementary. If the annealing temperature is high, only sequence specific
annealing is allowed. Mismatching between primers and templates require a lower annealing
temperature because mismatched nucleotides are not as stable as perfectly matched ones.
Thus, the temperature decides how much mismatching is tolerated. Once the primer has
annealed to its’ target region, whether the binding is perfect or just partially complementary,
the polymerase can initiate DNA synthesis at that site. The polymerase can not tell if there is
total sequence homology or not between the primer and template (unless there are mismatches
at the 3’ end) it will simply start polymerization from any template DNA with a primer
annealed to it. Mispriming causes non-specific sequences that may be amplified and disturb
the reaction and the overall result. The annealing temperature of a reaction depends of the Tm
of the primers. Tm is defined as the temperature at which half of the primers in the reaction are
annealed to the target region. Several formulae can be used for calculating Tm. The
nucleotides G and C increase Tm more than A and T and this is explained by the different
numbers of hydrogen bonds discussed earlier. As different formulae will give different values
of Tm they can only be used as guidelines when selecting an annealing temperature. Ideally,
optimization of annealing temperature for a specific reaction is carried out using a thermal
cycler with a gradient heat block facility (12).
11
1.2.3 PCR and contamination Since a PCR reaction is set up to amplify small amounts of specific DNA very small
quantities of contaminating DNA can be amplified as well. Especially carry over
contamination from earlier PCRs can cause big problems. Substituting dUTP for dTTP and
adding the enzyme uracil N-glycosylase (UNG) in a reaction mixture is one way of avoiding
the problem of carry over contamination. Thus, all amplification products will contain
deoxyuracil bases instead of thymines, while the template DNA and primers still contain
thymines. If a mixture contains carry over contamination and is incubated with UNG before
PCR, this enzyme hydrolyzes uracil glycosidic bonds causing them to break during the
temperature cycles of the reaction. Even if some of them do not break, polymerases cannot
continue polymerization when encountering these sites and they are forced to stop. As a
result, no previous amplification product can be further amplified. The UNG enzyme has to
be inactivated at high temperature to ensure that new reaction products are not destroyed as
well (12). Longer PCR products are more efficiently destroyed by UNG simply because they
contain more dUTPs. Short products may not contain enough dUTP to be eliminated by UNG.
This is an effective method for eliminating carry over contamination, yet simple as it just
requires the addition of dUTP, UNG and an activation step. Unfortunately, the enzyme can
regain some of its’ catalytic activity at lower temperature and destroy the new amplification
products. It is therefore important to store dUTP-containing DNA at -20ºC (16).
Exogenous contamination includes DNA from other genomes and plasmids that may be found
at pipettors, ice, in the air or at laboratory surfaces. In addition to chlorine and ethanol, ultra-
violet irradiation can be used for cleaning laboratory equipment from such exogenous
contamination. UV irradiation inactivates dried DNA by damaging pyrimidines. When
exposed to UV light, pyrimidines form pyrimidine dimers that cannot be elongated by
polymerase. The UV irradiation must have a certain light intensity to be able to destroy dried
DNA and this intensity can only be obtained if the object to be decontaminated is
perpendicular to the light source. This is impossible because of the shape of most objects,
which is why UV-irradiation cannot be used for complete decontamination. It should also be
kept in mind that not all DNA fragments contain enough pyrimidines close to one another to
make pyrimidine dimers (17).

12
1.3 PRIMER DESIGN In order for a PCR to work efficiently, picking out the right primers is crucial. The primers
should be homologous to the flanking regions of the DNA sequence to be amplified. The
sequence where primer annealing occurs should be unique to avoid non specific hybridization
(18). When a primer is used to amplify a group of related sequences, for example β-lactamase
family of genes, the primer targets have to be universal for the whole family. In order to
distinguish between the different members of the gene family, the primer hybridization sites
must also encompass a rather large portion of the gene to guarantee that regions that vary in
sequence are amplified (19). A multiple alignment provides a very easy method for
determining the level of conservation among nucleotide or protein sequences. The alignment
is a table, where the rows represent the sequence name and the sequence, and the columns
corresponds to a position in the alignment. It is possible to align nucleotide sequences
alongside with a primer to see where the primer is located on the template and to decide
whether the primer has enough sequence homology to be appropriate for amplification of that
sequence (20). To construct alignments, commercial as well as free web resources can be
used.
Once the primers have hybridized with their regions, DNA elongation proceeds from the 3’
end of the primer generating two daughter strands. The performance of the primers can be
affected in many ways.
1.3.1 Primer length The length of the primer and the annealing temperature has a great influence on the specificity
in a PCR. If the primer is long, it will take more time for it to anneal to the DNA leading to
fewer primed templates during annealing. This will result in an increase of amplified product
at the end of the reaction i e reduced efficiency. A primer that is more than 25 nt long is
defined as a long primer. A shorter primer, 18-24 bases long will bind more quickly to the
template and generates higher specificity and efficiency. This is the length used in most
standard PCRs (18).
1.3.2 Nucleotide composition The composition of the primers is also important because it affects the Tm of the primers and
the Tm has an effect on the annealing of the reaction. If a primer contains a lot of G and C the
Tm will automatically be higher. This is why the two primers in a primer pair must contain a
somewhat equal amount of G and C. If one of them has a high Tm and the other one a

13
significantly lower one this will reduce the efficiency and specificity of the reaction. The
result of a not well matched Tm within a primer pair at high annealing temperature can make
the primer with low Tm partly or completely unable to hybridize to its target DNA. If a low
annealing temperature is used to suit the primer with low annealing temperature, the primer
with high Tm has a higher chance of mispriming (18).
An ideal primer contains roughly 50% GC and has Tm in the range of 56-62°C. The
distribution of the nucleotides should be somewhat evenly distributed as repetitive sequences
or sequences with the same nucleotide can cause the primers to slip on the template (12).
Several free resources are offered on the internet to help calculate the Tm of a given primer.
The Tm of a given primer varies somewhat depending on which computer resource is used.
The reason for this is that different programs uses different algorithms for it’s calculations
(18).
1.3.3 Primer dimer formation and secondary structures Another important aspect of primers is their tendency to form hetero- and homodimers as a
result of complementary 3’ ends. Heterodimers refers to the result of the formation of a dimer
between the sense and antisense primer while a homodimer consists two elongated sense or
antisense primers. This type of structure can cause large amounts of small PCR product since
a primer dimer is efficiently extended by polymerase. Also, less of the desired PCR product is
formed because the polymerase is occupied amplifying the primer dimers. A primer can even
hybridize with itself, and form hairpins because of internal complementarity. If secondary
structures are stable at annealing temperature, this can lead to a failed reaction because they
make it impossible for primers to anneal to the DNA template. However, a small degree of
internal complementarity is inevitable and is usually tolerated in a reaction (12). The free
resources on the internet that can be used to calculate the Tm of primers are also a great help
when analyzing possible primer dimers and secondary structures.
1.3.4 Primer sequence 3’ end The whole primer sequence does not have to be completely complementary to the template
strand, but it is essential the the 3’ end of the primer does not contain any mismatches. The
binding has be perfect counting from the 3-4 last nucleotides at the 3’ end because that is
where elongation occurs (18). Perfect matching between the template and the 5’ end is not

14
equally important and that is why additions of restriction sites, promoter sequences and
sequences that allow joining of PCR products are made at that end (12).
1.3.5 Degenerate primers Sometimes, it might be desired to amplify related DNA sequences that express some degree
of heterogeneity in one reaction. In that case, it might be impossible to design one primer pair
that matches all of the different base alterations. One solution to this problem is to synthesize
degenerate primers. This could be done by making a primer pool, where either A, G, C or T is
incorporated at one or more specific locations in the primer (21). A simpler method is to use
degenerate bases that can base pair with two or three nucleotides or universal bases that can
hybridize with any one of the four bases (12, 21). An example of a degenerate base is inosine,
which possesses the property of hybridizing with A, C and T (22). Universal bases may
destabilize some reactions, especially if they are located at the ends of the primer. Also, if
they are evenly distributed within primer they tend to destabilize the system more than if they
are placed close together. Degenerate nucleotides are less destabilizing and can be used in
systems that are more sensitive to destabilization. Since perfect homology between the 3’ end
of the primer and its’ template is required for a successful reaction, no degenerate or universal
bases should be placed within this region. The number of degenerate or universal bases should
also stay within certain limits, not more than three grouped substitutions should be made (23).
1.4 MULTIPLE DISPLACEMENT AMPLIFICATION Access to sufficient high quality DNA template is important in PCR amplification assays.
Amplifying high molecular weight DNA prior to a PCR-reaction can be done with a Whole
Genome Amplification technique called multiple displacement amplification (MDA) (24).
MDA involves denaturation of the two intertwined strands at 95ºC. Following addition of a
chemically modified random hexamer primer and proof-reading φ29 DNA polymerase, the
amplification is carried out at 30 ºC, which makes MDA an isothermal reaction (24). In a
living cell, unwinding of the two DNA-strands is accomplished by specific helicases and
origin binding proteins. Binding of helicase and and other replication associated proteins
maintain the template in a conformation optimal for copying by DNA polymerase. The region
at which these different proteins come together is called the replication fork (11). The
replication fork must move along the duplex and unwind it in order for DNA polymerase to
synthesize the complementary strand. However, the DNA polymerase used in MDA, a

15
polymerase isolated from the phage φ29, does not require the replication associated proteins
to invade the replication fork for it’s activity. To initiate replication, φ29 DNA polymerase
uses a protein primer which attaches the first nucleotide to the hydroxyl of a specific serin of
the priming protein. The binding of φ29 DNA polymerase is exceptionally tight. Two other
important features of this enzyme, related to its’ binding capacity, are outstanding
processivity and strand-displacement syntheses. High processivity means that the enzyme as a
high affinity for the template strand. When the binding is very tight, the polymerase will
synthesize more DNA before it lets go of the template. It is common for a polymerase to add
about 10-50 nt before it is dissociated from the template, but φ29 DNA polymerase can add
70 000 nt. This is one of the reasons why MDA is capable of producing high molecular
weight DNA. However, the length of the DNA product is also a result of strand-displacement
synthesis. Strand-displacement synthesis enables φ29 DNA polymerase to invade dsDNA that
lies in its way and initiate a new replication fork. One theory suggests that the polymerase
forms a tunnel through which the template DNA must pass before it reaches the
polymerization domain. Since dsDNA is to big to fit into the tunnel, one strand has to be
displaced. The displaced template then provides the random hexamer primers with more
templates. Since primers has attached to both strands after denaturation of the DNA, the
strand displacement synthesis causes branching of ssDNA at multiple positions. This
mechanism is called hyper-branching (figure 2) and it renders an exponential amplification
(24, 25).
The φ29 DNA polymerase does not only display a very processive polymerase activity, but
also a 3’→ 5’-exonuclease activity. Only when the right nucleotide is inserted it provides a
substrate for polymerase to continiue the extension. When using φ29 DNA polymerase in a
MDA reaction, this mechanism increases the fidelity of DNA replication because mispaired
nucleotides are removed and replaced with the right ones. Since the exonuclease activity of
φ29 DNA polymerase acts preferentially on single stranded DNA, this would cause
degradation of primers in the MDA reaction. To protect primers from degradation by the
proofreading mechanism, the primers are provided with two phosphothioate linkages at the 3’
end (25). With this problem solved, the result of the exonuclease activity is highly accurate
DNA replication and maintenance of genetic information in MDA (26).

16
Figure 2. When the φ29 DNA polymerase meets dsDNA that lies in it’s way, one strand is
displaced. Random hexamer primes can hybridize with the displaced ssDNA at more than
one place, which gives the polymerase the opportunity to start replication at several
positions (24). From Hughes and Lasken, Whole Genome Amplification, p 5.

17
Aim
The aim of this study was to design a universal primer pair that could amplify the β-lactamase
genes blaSHV, blaLEN and blaOPK in clinical isolates of K. pneumoniae and blaSHV
reference strains. Primers will be provided with 5’-sequence tags to allow sequencing of the
different β-lactamase sequences, omitting tedious cloning procedures prior to DNA sequence
analysis. The sequence information will be used to construct a phylogenetic tree to observe a
possible phylogenetic relationship among the blaSHV, blaLEN and blaOPK genes

18
2. METHODS AND MATERIALS
2.1 Flowchart of methods
DNA from clinical isolates and reference strains
Extraction from reference strains
Extraction from clinical isolates
Multiple displacement amplification
Multiple displacement amplification
PCR with new primers
Purification of amplified DNA
DNA sequencing
PCR with SP6 and T7 sequence tagged amplicons
Bioinformatic analysis

19
2.2 BACTERIAL STRAINS Twenty K. pneumoniae strains and one Klebsiella oxytoca strain with ESBL phenotype were
studied (Appendix 1, Table 4). All strains were isolated from clinical specimen at the
University Hospital in Linköping between 2001-2007. Six reference strains known to carry
blaSHV genes were added to the study (Appendix 1, Table 5).
2.3 AUTOMATED DNA ISOLATION All 27 strains were grown on chromogenic agar plates and incubated at 35 ºC over night.
From each strain, five colonies were harvested in 200 µL PBS buffer. After 5000g
centrifugation for 5 minutes, the pellet was resuspended in 200 µL fresh PBS buffer
(Substrate department, Linköping University Hospital). DNA was extracted using Biorobot®
EZ1, the EZ1 DNA Tissue Kit and the EZ1 DNA Tissue Card (Qiagen, Hilden Germany).
The principle behind this method is binding of DNA to magnetic particles in a solution, and
then separation from the cell lysates with a magnet. After washing, pure DNA is obtained in
an elution buffer. The final eluation volume was 100 µL.
2.4 MULTIPLE DISPLACEMENT AMPLIFICATION MDA was performed using a GenomiPhi V2 DNA amplification kit according to the
supplier’s recommendation (GE-Healthcare, Uppsala Sweden). The amplification was
performed in a PTC-100TM programmable thermal controller, version 6.0 (MJ-Research Inc;
SDS, Falkenberg, Sweden). Denaturation was achived by adding 1 µL of DNA from the
extraction to 9 µL sample buffer containing random hexamer primers and dNTPs, and
incubation at 95ºC for 3 minutes. Following the addition of 1 µL φ29 DNA polymerase and 9
µL of reaction buffer, amplification was performed at 30ºC for 90 minutes. Inactivation of the
polymerase was achieved by incubation at 65ºC for 10 minutes. MDA DNA was suspended in
80 µL H2O and stored at -20ºC.

20
2.5 DETECTION OF blaSHVA IN K. PNEUMONIAE
2.5.1 Annealing temperature optimization of old primers Optimization of annealing temperature with an old primer pair (Appendix 1, Table 1, set 1)
was carried out with only three reference strains, 1204 SHV-2, J53 SHV-2 and J53 SHV-1
(provided by dr D Livermore) in a thermal cycler with a gradient heat block facility
(eppendorf Mastercycler Gradient). HotStarTaq Master Mix (Qiagen) with 2mM MgCl2 was
mixed with 10 pmol of each primer and 1 µL MDA DNA to a final reaction volume of 25 µL.
The cycling conditions for this PCR are given in Appendix 1, Table 2, programme 1.
2.5.2 Amplification of blaSHV in clinical isolates of K. pneumoniae For identification of blaSHV in the 21 clinical isolates (Table 4) a PCR amplification assay
was set up. HotStarTaq Master Mix (Qiagen) with 2mM MgCl2 was used in a final reaction
volume 25 µL. A negative control with no DNA template was also run. 10 pmol of each
primer in primer set 1 (Table 1) was used. The PCR was performed in eppendorf Mastercycler
Gradient. PCR programme 2 (Appendix 1, Table 2) was used.
2.6 DETECTION OF blaSHV, blaLEN AND blaOKP IN K. PNEUMONIAE
2.6.1 Design of universal primers For amplification of blaSHV, blaLEN and blaOKP in the 21 clinical isolates, new primers
(table 1, sets 2-5) were designed that were universal for all three sequences. The new primers,
ordered from Invitrogen, were also constructed to amplify a larger segment of the genes than
the previous primer pair (table 1, set 1). Primer design was based on the alignment of the
blaSHV, blaLEN and blaOKP sequences available at GenBank, NCBI. SHV sequence
accession numbers and references were obtained from the Lahey Clinic Website.
Corresponding information on the blaLEN and blaOKP sequences were found at the Pasteur
Institute Website. Accession numbers used in this study can be found in Appendix 2.
Alignment analysis was carried out using CLC free workbench version 3. Primer sets 2-3
(Table 1) were constructed by CLC Combined Workbench and the antisense primers of set 4
and 5 were designed manually. For analysis of GC content, Tm, secondary structures and
primer dimer formation, OligoAnalyzer 3.1 was used.

21
2.6.2 Annealing temperature optimization of universal primers The optimal annealing temperature for the new universal primers was determined by using a
thermal cycler with a gradient heat block facility (eppendorf Mastercycler Gradient). Only
reference strains 1204 SHV-2, J53 SHV-2 and J53 SHV-1 were used in the annealing
temperature optimization. HotStarTaq Master Mix (Qiagen) with 2mM MgCl2 was mixed
with 10 pmol of each primer (set 2-5, Table 1) and 1 µL MDA DNA template for a final
reaction volume of 25 µL. PCR was run according to programme 1 in Table 2.
2.6.3 Amplification of blaSHV, blaLEN and blaOKP in clinical isolates of K. pneumoniae Since set 4 (Table 1) appeared to be the most favourable primer in amplification the reference
strains, this primer set was selected for amplification of blaSHV, blaLEN and blaOKP in the
clinical isolates. The final concentrations and reaction volumes were exactly the same as in
the annealing temperature optimization. PCR was performed according to programme 2,
Table 2.
2.7 NUCLEIC SEQUENCE ANALYSIS OF PCR AMPLICONS
Sequence analysis was carried out by using tag-specific sequencing primers. Testing for
suitable sequence tags considering primer dimer formation and secondary structure was done
with OligoAnalyzer. The primer pair chosen was set 4, table 1 and the sequence tags selected
were SP6 and T7. Because of the expected length of the product, two sequence tags were
used, one for each primer. This was thought to facilitate the editing of the sequences. The
sequence tagged primers (Table 1, set 6) were ordered from Invitrogen. The six reference
strains and all clinical isolates were included in the reaction. PCR programme 2 (Table 2) and
eppendorf Mastercycler Gradient was used.
To remove unused primer and nucleotides from the DNA prior to sequencing, ExoSAP_IT®
(USB Corporation) was used. 2 µL of ExoSAP_IT was mixed with 5 µL of PCR product for a
combined reaction volume of 7 µL. Remaining primers and nucleotides were degraded by

22
incubation at 37ºC for 15 minutes in eppendorf Thermomixer comfort. Inactivation of
ExoSAP_IT was achieved at 80ºC for 15 minutes on Block Thermostat from Grant. The DNA
was vacuum dried for 2 hours in HETOVAC CT110 (High Technology of Scandinavia)
before sequencing. The SP6 and T7 sequence tagged amplicons were analyzed according to
the Sanger dideoxy chain-termination method by a DNA-sequencing service
(http://www.mwg-biotech.com). Editing and joining of sequences were accomplished with
CLC free workbench version 3.1. A BlastN search was made from the sequence database at
NCBI for each sequence. All sequences derived from PCR amplicons were aligned with all
blaSHV, blaLEN and blaOKP sequences found at NBCI GenBank. Phylogenetic trees were
obtained using CLC free workbench version 3.1 and the UPGMA method.
2.8 PCR WITH UNIVERSAL PRIMERS AND HOTSTAR Taq DNA POLYMERASE
2.8.1 Optimiztion of MgCl2 and annealing temperature For verification of the new primer (set 4, Table 1), PCR was performed with another master
mix. The DNA polymerase used was HotStart Taq DNA Polymerase (Fermentas life
Sciences). Just like the polymerase in HotStarTaq Master Mix (Qiagen, Hilden Germany),
this polymerase possesses a hot start function (i e. is activated at the initial denaturation step
of PCR), but it lacks a detectable 3’→5’ proofreading exonuclease activity. The optimal
concentration of MgCl2 and the most advantageous annealing temperature was determined by
an optimization assay in eppendorf Mastercycler Gradient. The concentrations of MgCl2 were
varying from 1,5mM-2,5mM and the different annealing temperatures were ranging from
50,0ºC-62,5ºC. The template used was 1204 SHV-2. 2,5 units of HotStart Taq buffer, 0,2 mM
of each dNTP, 10 pmol of each primer (set 5, table 1) 1 unit of HotStart Taq polymerase, 1
unit of Uracil-N-Glycosylase and 10 µL of template MDA DNA was mixed for a final
reaction volume of 25 µL. The cycling conditions for this PCR are given in Table 2,
programme 3.
2.8.2 Detection of blaSHV, blaLEN and blaOKP with Hot Start Taq Polymerase The four K. pneumoniae strains earlier typed with PCR as negative for blaSHV (strains 92,
184, 205 and 265, Table 4), and two strains typed as positive (strains 1 and 138, Table 4) were

23
run in two PCR amplification assays. Reference strain 1204 SHV-2 was included. Each
amplification assay was carried out with primer set 4 (Table 1). 2, 5 units of HotStart Taq
buffer, 0,2 mM of each dNTP, 10 pmol of each primer, 2,5 mM MgCl2, 1 unit of HotStart Taq
polymerase and 1 µL of template MDA DNA was mixed for a final reaction volume of 25
µL. The two amplification assays were identical except for the addition of 1 unit of Uracil-N-
Glycosylas in one of the master mixes. This was done to reveal if the addition of UNG caused
any difference in band intensity. Cycling conditions are given in Table 2, programme 4.
2.8.3 Verification of Uracil-N-Glycosylas activity PCR amplification was set up to determine the enzymatic activity of UNG. To detect the
maximal capacity of the enzyme, a gradient (Appendix 1, Table 3) with different
concentrations of purified PCR amplicons, containing uracil instead of thymine was prepared.
PCR amplicons were purified with GFXTM PCR DNA and Band Purification Kit (Amersham
Biosciences). Eighteen µL of a PCR amplicon and 500 µL of capturing buffer was added to a
column placed in a sample tube. Purification was carried out according to the manufacturers’
instructions. The final eluation volume was 50 µL. The concentration of DNA in the sample
was measured in an eppendorf cuvette in BioPhotometer to 100 ng DNA/µL. A gradient
ranging from 8,25 ng – 8,25x10⁻⁷ ng of purified PCR amplicons was prepared. The different
amounts served as template in eight different reactions tubes. One sample with DNA
containing thymine and one sample with no template were run in parallel. Two master mixers
were prepared, one containing UNG and one without UNG, to detect possible differences.
Ten pmol of each primer was added to 1 unit of UNG, 2,5 mM MgCl2, 1 unit of Hot Start Taq
DNA polymerase, 0,2 mM of each dNTP, 12,5 units of Hot Start Taq DNA Buffer for a final
reaction volume of 25 µL. The second master mix had the exact same reaction volume and
final concentrations, but no UNG was added. PCR was performed according to programme 4,
Table 2.
2.9 COMPARATIVE PERFORMANCE OF WHOLE CELL DNA FROM FROZEN BACTERIAL STRAINS AND EXTRACTED DNA FROM CULTURED STRAINS IN A MDA-ASSAY A comparison was made to examine whether DNA extracted from cultured bacteria served
better as a template in MDA than DNA from bacteria in freeze medium stored at -70ºC. A

24
few bacterial colonies from freeze medium was suspended in 200 µL PBS buffer (Substrate
Department, Linköping University Hospital). Ten µL of MDA reaction buffer was then added
to 1 µL of PBS buffer with bacteria. The extracted DNA used was collected from the
automated DNA isolation described earlier. The bacterial strains used were the 21 clinical
isolates (Table 4) and reference strain 1204 SHV-2 (Table 5). MDA was performed exactly as
described in section 2.3. HotStarTaq Master Mix (Qiagen) with 2mM MgCl2 was mixed with
10 pmol of each primer and 1 µL MDA DNA template for a final reaction volume of 25 µL.
PCR was performed according to programme 2, Table 2.
2.10 ANALYSIS OF AMPLIFICATION PRODUCTS IN PCR
All amplification products in the PCR assays described were analysed by electrophoresis in
pre-cast 2% or 1.2% agarose gels (E-gel, Invitrogen) with ethidium bromide, and visualised
by ultraviolet light. GeneRuler 50bp DNA Ladder from Fermentas was used as a ladder.

25
3. RESULTS
3.1 Detection of blaSHV in K. pneumoniae PCR amplification of reference strains 1204 SHV-2, J53 SHV-2 and J53 SHV-1 (Table 5),
using primer set 1 (table 1) and primer annealing temperature gradient within the range 50ºC-
62ºC, revealed an optimal annealing temperature 58ºC for 1204 SHV-2 and J53 SHV-2, and
50ºC-62ºC for J53 SHV-1.
Agarose gel electrophoresis showed presence of a 800 bp band (presumably the blaSHV gene)
in all but four of the clinical isolates (strains 92, 184, 205 and 265) in addition to the three
reference strains. Strain 1 (Table 4) showed presence of a very weak band.
3.2 Detection of blaSHV, blaLEN and blaOKP in K. pneumoniae PCR amplification and primer annealing temperature gradient of control strains and primer
pairs 2-5 (table 1) showed a PCR product for each reference strain and an optimal annealing
temperature at 58ºC-59ºC for all primers. Primer pair 4 (table 1) was chosen to detect blaSHV
and possibly blaLEN and blaOKP in the 21 clinical isolates. The agarose gel showed presence
of an amplicon in all but one isolate (strain 265, K. oxytoca) indicating that blaSHV was
present in all K. pneumoniae, or that the primer indeed had targeted blaSHV in 17 clinical
isolates and blaLEN or blaOKP in three of the isolates.
3.3 Nucleic sequence analysis of PCR amplicons Sequence analysis from both directions allowed establishing the nucleotide sequence of a 797
bp portion of the β-lactamase gene in all six reference strains and all clinical isolates of K.
pneumoniae (Table 4, strains 1-230). The sequence corresponds to 93 % of the gene length.
The phylogenetic tree analysis showed three distinct groups of nucleotide sequence (figure 2).
The SHV group was the largest group and included the six reference strains and all clinical
isolates except strains 92, 184 and 205. Strain 184 and 205, isolated from the same patient
formed a second group and strain 92 alone formed a third group. Since the second group
showed more relatedness to the blaSHV group, this group was assumed to have the
chromosomal blaLEN gene. Strain 184 and 205 were aligned with all blaLEN nucleotide
sequences available at GenBank NBCI and showed a 100 % homology with LEN-11. Strain
92, assumed to be of blaOKP-type, was aligned with all blaOKP nucleotide sequences found
at GenBank NBCI. It could not be perfectly matched with any of the sequences but it was

26
obviously belonging to the OKP-B subgroup, with its closest relative being OKP-B-6. Strain
265 (Table 4) is not included in the tree analysis.
Figure 2. Phylogeny of the chromosomal β-lactamase genes in the 20 clinical isolates of K.
pneumoniae (Table 4, strains 1-230) and reference strains J53 SHV1, J53SHV2, ATCC11296
SHV11, 1204 SHV2, ATCC13883 SHV1 and ATCC700603 SHV18 (Table 5). Type strains
LEN-11 and OKP-B-6 with accession numbers ( from GenBank at NBCI) are indicated with
arrows.
←
←
27
3.4 PCR with universal primers and HotStar Taq DNA Polymerase No visible amplification products were present at MgCl2 concentrations of 1,5 mM-1,75mM.
Weak amplicons were detectable at a concentration of 2,0 mM but only at higher
temperatures. The most favourable conditions for HotStar Taq DNA Polymerase in
combination with set 4 (Table 3) appeared to be a MgCl2 of 2,5 mM and an annealing
temperature of 58ºC.
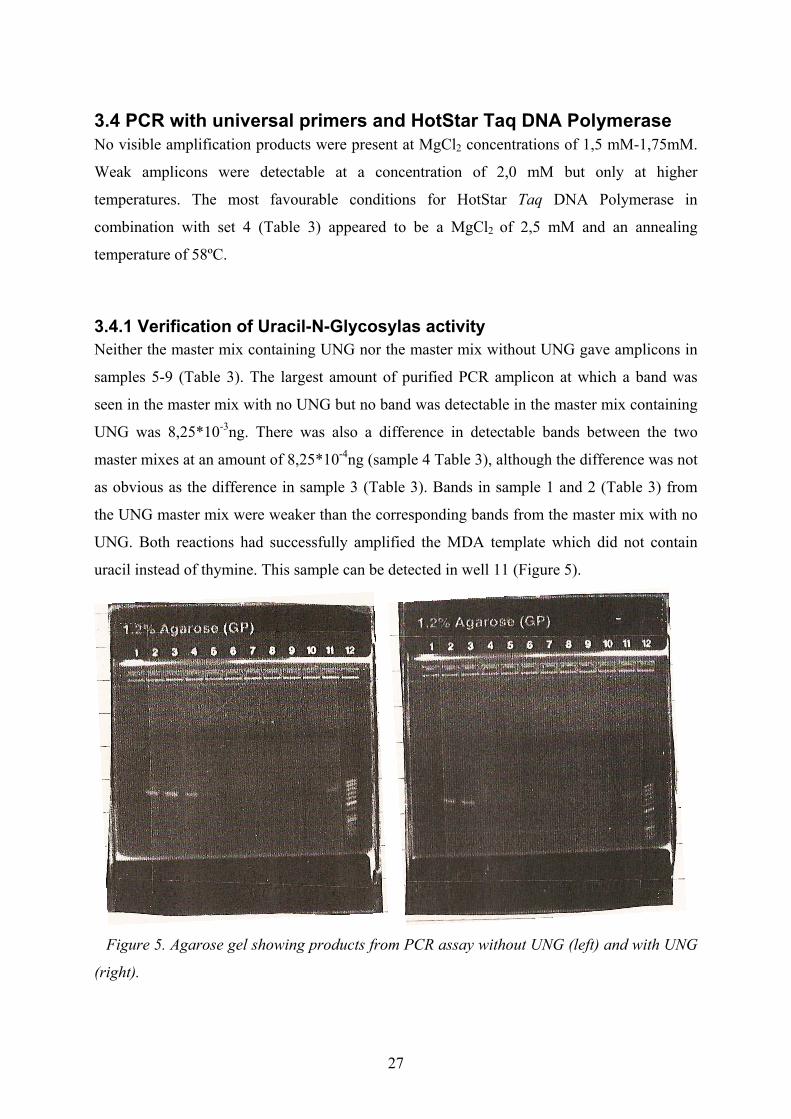
3.4.1 Verification of Uracil-N-Glycosylas activity Neither the master mix containing UNG nor the master mix without UNG gave amplicons in
samples 5-9 (Table 3). The largest amount of purified PCR amplicon at which a band was
seen in the master mix with no UNG but no band was detectable in the master mix containing
UNG was 8,25*10-3ng. There was also a difference in detectable bands between the two
master mixes at an amount of 8,25*10-4ng (sample 4 Table 3), although the difference was not
as obvious as the difference in sample 3 (Table 3). Bands in sample 1 and 2 (Table 3) from
the UNG master mix were weaker than the corresponding bands from the master mix with no
UNG. Both reactions had successfully amplified the MDA template which did not contain
uracil instead of thymine. This sample can be detected in well 11 (Figure 5).
Figure 5. Agarose gel showing products from PCR assay without UNG (left) and with UNG
(right).
28
3.5 Comparison of whole cell DNA from frozen bacterial strains and extracted DNA from cultured strains in MDA Whole cell DNA from K. pneumoniae clinical isolate 184 (Table 4) and the K. oxytoca
clinical isolate (strain 265 Table 4) had not been amplified, and the amplification product
from clinical strain 205 (Table 4) was very weak. The remaining K. pneumoniae strains and
reference strain 1204 SHV-2 had all been successfully amplified. The amplicons from the
whole cell DNA revealed more distinct and even bands than amplicons from the extracted
DNA.
4. DISCUSSION
4.1 Chromosomally encoded β-lactamases in K. pneumoniae Extended and broad spectrum betalactamases derived from the SHV-1 family of class A β-
lactamases are assumed to have developed by separation from the chromosome of
K.pneumoniae (2). Whether the same blaSHV allele is ubiquitous in all K.pneumoniae, a
theory supported by some researchers (8, 9) is however a debateable question. In 2001, the
phylogenetic diversity of K. pneumoniaeae was examined and it was revealed that K.
pneumoniae isolates from 13 different countries fell into three clusters, named KpI, KpII and
KpIII. Eighty percent of all isolates fell into cluster one, and thus belonged to KpI. The
remaining 20% was equally divided between KpII and KpIII (28). In 2004, Haeggman et al.
29
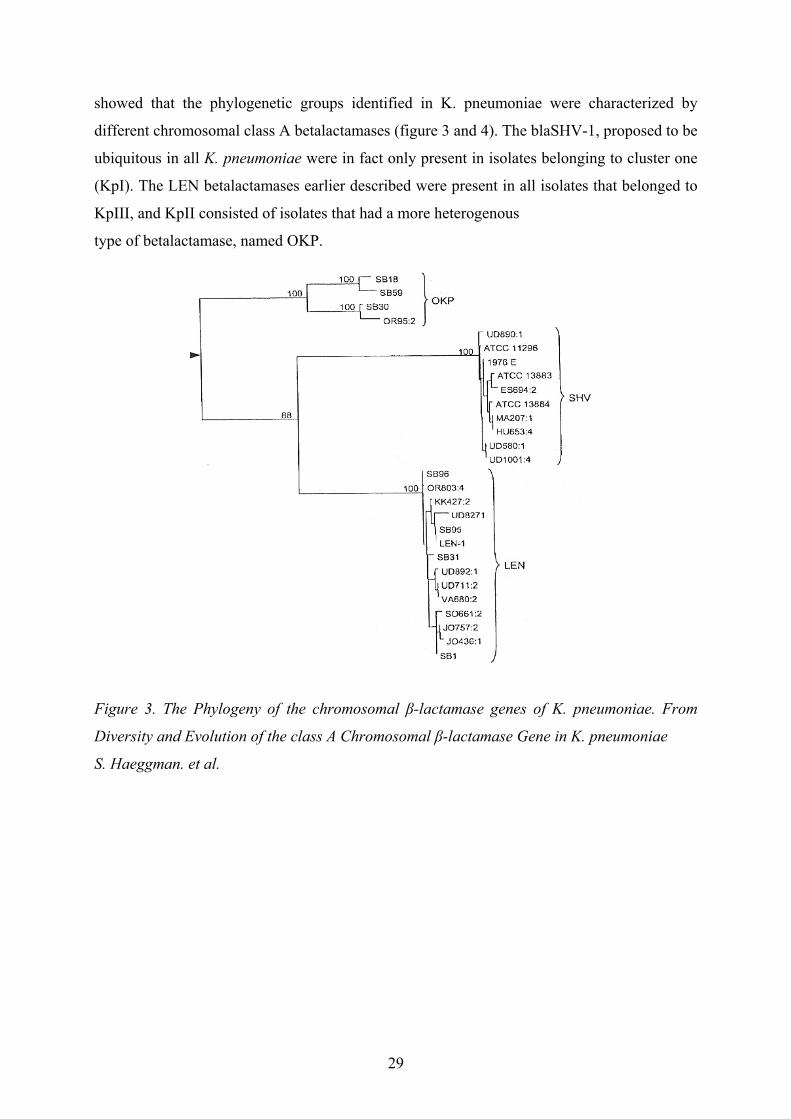
showed that the phylogenetic groups identified in K. pneumoniae were characterized by
different chromosomal class A betalactamases (figure 3 and 4). The blaSHV-1, proposed to be
ubiquitous in all K. pneumoniae were in fact only present in isolates belonging to cluster one
(KpI). The LEN betalactamases earlier described were present in all isolates that belonged to
KpIII, and KpII consisted of isolates that had a more heterogenous
type of betalactamase, named OKP.
Figure 3. The Phylogeny of the chromosomal β-lactamase genes of K. pneumoniae. From
Diversity and Evolution of the class A Chromosomal β-lactamase Gene in K. pneumoniae
S. Haeggman. et al.

30
Figure 4. The three phylogenetic groups Kp1, Kp2 and Kp3 of K. pneumoniae The phylogeny
of Kp1, Kp2 and Kp3 corresponds to the phylogeny of the three β-lactamase genes blaSHV,
blaLEN and blaOKP in Figure 3. From Diversity and Evolution of the class A Chromosomal
β-lactamase Gene in K. pneumoniae S. Haeggman. et al.
PCR amplification of the 21 clinical isolates (Table 4, strains 1-265) and 6 SHV reference
strains (Table 5), with a primer specific for blaSHV resulted in amplification in 17 of the
isolates (Table 4, all strains except 92, 184, 205 and 265) and all 6 of the reference strains.
The lack of an amplicon in strains 92, 184 and 205 was either a result of absence of blaSHV
or unfavourable PCR conditions. Since an annealing temperature gradient had been carried
out, and an analysis of the primer target region did not show any significant variation between
different blaSHV genes, the negative result in these three strains was most likely caused by
absence blaSHV. No PCR amplicon was found in sample 265, which was in accordance with
the theory that the genes blaSHV, blaLEN and blaOKP are species specific for K.
pneumoniae.
New primers were designed to target a region about 100 bp downstream the target of the
blaSHV specific primer. This target region on the chromosomal betalactamase gene showed
more sequence conservation between the 3 β-lactamase genes blaSHV, blaLEN and blaOP
than the target region of the blaSHV specific primer. Since the primers were successful in

31
amplifying all isolates, including the 6 reference strains, this supports the theory that the
chromosomally encoded betalactamase in K. pneumoniae does not always belong the blaSHV
gene family. The nucleotide sequence analysis and the UPGMA tree analysis showed that 17
out of the 20 clinical isolates included in the tree analysis and all 6 reference strains fell into
the same cluster. Since the reference strains were previously known to carry blaSHV and the
17 clinical isolates had been positive in the amplification assay using only the SHV-specific
primers, this cluster was obviously the blaSHV group. To determine whether all of these
isolates belong to the phylogenetic group KpI, a portion of the gene representative of this
group, for example housekeeping genes gyr or mdh must be sequenced and analysed (2). A
second cluster, consisting of two isolates from the same patient, was more closely related to
the blaSHV group than the third group, which consisted of only one strain.
A tree analysis of the reference strains and all blaSHV nucleotide sequences available at
NBCI GenBank (accession numbers are available in Appendix 2) showed very poor bootstrap
values, which indicated that all sequences were not compatible. Therefore, the tree was not
reliable and the blaSHV genes from each individual strain could not be determined. An
alignment of all blaLEN sequences available at NBCI GenBank and the two isolates from the
second cluster revealed a 100 % homology with LEN-11. A tree analysis of all blaLEN
nucleotide sequences showed satisfactory bootstrap values. Since blaLEN and blaOKP are not
ESBL genes (27), the ESBL phenotype of the strains that had been typed positive for blaLEN
or blaOKP but negative for blaSHV, was questioned. A new susceptibility test was
performed which revealed a non -ESBL phenotype in these strains (19).
4.2 PCR with universal primers and HotStar Taq DNA Polymerase The experiment with HotStar Taq Polymerase proved that a universal primer was able to
perform amplification in a simpler master mix than HotStarTaq Master Mix. The HotStar Taq
DNA Polymerase kit is supplied with UNG, for elimination of carry over contamination.
Initially, this experiment included TrueStar Taq DNA Polymerase kit, also from Fermentas.
For unknown reasons, the TrueStar Taq DNA Polymerase in combination with UNG failed to
give amplification products in repeated assays. Thus, TrueStar Taq DNA Polymerase kit was
replaced with the HotStar Taq DNA Polymerase kit. The activity of the HotStar Taq DNA
Polymerase appeared to be unaffected by UNG.

32
4.2.1 Verification of UNG activity A comparison of the master mix containing UNG and the master mix with no UNG revealed
bands at lower concentrations in the master mix with no UNG. This proves that UNG indeed
does reduce carry over contamination. Bands were detectable in samples 1 and 2 from the
UNG master mix and in samples 1-4 from the master mix with no UNG. However, at lower
concentrations, no difference could be seen between the two master mixes, probably as a
result of too low DNA inputs. These results suggests that the capacity of one unit of UNG to
eliminate carry over contamination containing uracil instead of thymine lies somewhere in the
range 8,25*10-4 ng – 8,25*10-3ng. The weaker bonds in sample 1 and 2 (Table 3) from the
UNG master mix indicates enzymatic activity as well. The MDA DNA had remained
unaffected throughout the reaction, which implies that UNG had not regained its activity at
lower temperatures. It would have been interesting to do this experiment with a template of a
different size than the contaminating PCR amplicon but with the same primer annealing sites,
in the same test tubes as the contamination gradient. Because of the different sizes of the
template and the contaminating PCR amplicon, the products would have appeared as different
bands on the agarose gel. The presence of a “real” template in combination with
contamination and UNG probably has an effect on the contamination detection limits, since
the contaminating PCR amplicon and and the template competes for the DNA polymerase
and primers.
4.3 Comparison of whole cell DNA from frozen bacterial strains and extracted DNA from cultured strains in MDA There are several methods for extracting DNA from cells. In this study, extraction was
performed with Biorobot® EZ1, a method that relies upon the binding of DNA to magnetic
particles and separation of DNA and the cell lysates by a magnet. Since the extraction is
automated, and all components needed for the extraction are included in a DNA tissue kit
provided from the manufacturer, the sources of contamination are limited. However, when
extracted DNA was compared to non-extracted DNA in MDA followed by PCR it seems as
extraction is an unnecessary procedure in this case. The bands on the gel were in fact more
distinct when the DNA had not been extracted from the bacterial cells. The whole cell DNA
had lead to a failed amplification in two strains. Interestingly, the failed amplifications with
non-extracted DNA were restricted to blaLEN sequences. The strains positive for blaLEN
came from the same patient, and according to the results from the sequence analysis, they

33
were carrying the same gene. These strains were extremely mucoid when cultured and that is
probably why extraction of DNA is needed prior to MDA and PCR.
The conclusion from this study is that K. pneumoniae have SHV, LEN or OKP β-lactamase
genes. The members within these three gene families can be targeted with a universal primer
with and without sequence tags. The phylogeny of the β-lactamase genes in this study
resembles the phylogeny of the K. pneumoniae β-lactamase genes from a previous study. The
universal primer was efficient in PCR with a pre-prepared master mix as well as with a
simpler master mix containing the enzyme UNG. UNG proved to be capable of eliminating
contamination containing uracil instead of thymine. MDA DNA was used as a template in all
PCR reactions, why an analysis of starting material in MDA was carried out. Results revealed
that extracted DNA from cultured bacteria serves better as starting material in MDA than
whole cell DNA.

34
Acknowledgements I would like to thank Hans-Jürg Monstein for excellent supervision and guidance during this project. I would also like to thank Maria Tärnberg for excellent guidance in the laboratory work, bioinformatics and discussion of the results. Thank you Anna Ryberg and Marjan Nosouhi Dehnoei for answering all my questions for and helping me with laboratory equipment as well as bioinformatics.

35
References 1. Rang, H, Dale., M, Ritter., J M, Moore, P K. (2004). Pharmacology 5th edition:
Churchill Livingstone. P 639-644. 2. Haeggman, S., Löfdahl S., Paauw, A., Verhoef, J., Brisse, S.(2004). Diversity and
Evolution of the Class A Chromosomal Beta-Lactamase Gene in Klebsiella pneumoniae. Antimicrobial Agents and Chemotherapy, July, Vol, 48, No 7. P 2400-2408.
3. Sundsfjord, A., Simonsen G S,. Haldorsen B C,. Haaheim, H,. Hjelmevoll, S,. Littauer, P,. Dahl K H,. (2004). Genetic Methods for detection of antimicrobial resistance. APMIS 112. P 815-837.
4. Livermore D M. (2008). Defining an extended-spectrum β-lactamase. Clinical Microbiology and Infectious Diseases, CMI, 14 (Suppl. 1) P 3-10.
5. Paterson D L. (2006). Resistance in Gram-Negative Bacteria: Enterobacteriaceae. The American Journal of Medicine, Vol 119 (6A) P 20-28.
6. Bradford P A,. (2001) Extended-Spectrum β-lactamases in the 21st century: Characterization, Epidemology and Detection of This Important Resistance Threat. American Society for Microbiology, Clinical Microbiology Reviews, October (14) 4 : P 933-951.
7. Bush, K,. Jacoby G A,. Medeiros, A A. (1995). A Functional Classification Scheme for β-lactamases and its Correlation with Molecular Structure. Antimicrobial Agents and Chemotherapy, June Vol 39, No. 6. P 1211-1233.
8. Livermore, D M. & Babini, G S. (2000) Letters to the Editor: Are SHV β-lactamases Universal in Klebsiella pneumoniae? Antimicrobial Agents and Chemotherapy, Aug, Vol. 44, No. 8. P 2230.
9. Chang, F,. Siu, L K,. Fung, C,. Huang, M,. Ho, M. (2001). Diversity of SHV and TEM β-lactamases in Klebsiella pneumoniae: Gene Evolution in Northern Taiwan and Two Novel β-lactamases, SHV-25 and SHV-26. Antimicrobial Agents and Chemotherapy, Sept, Vol 45, No 9. P 2407-2413.
10. CLC Bio (homepage on the internet) Aarhus C Denmark. Bioinformatics Explained: Biological Databases. Updated February 12 2008. Cited March 3 2008. Avaliable from http://www.clcbio.com/index.php?id=1238
11. Lodish, H., Berk, A., Matsudaira, P., Kaiser C., Krieger M., Scott M., Lawrence Zipursky., S, Darnell J. (2003). Molecular Cell Biology 5th ed: W. H Freeman and Company, New York. P 104-105, 133-135, 962.
12. McPherson M. J. & Moller S. G. (2000). PCR: BIOS Scientific Publishers Limited P. 4-16, 26-31, 67-70, 79-83.
13. Cha, R & Thilly W G. Specifity, Efficiency and Fidelity of PCR. In Dieffenbach, C W & Dveksler G S. PCR Primer, A Laboratory Manual: Cold Spring Harbor Laboratory Press.1995. P 37-39.
14. Qiagen (homepage on the internet) Solna Sweden. Genotyping: Critical success factors and new technologies for PCR and RT-PCR. Updated August 2007. Cited March 24 2008. Avaliable from
http://www1.qiagen.com/products/byapplication/genotyping/Brochures.aspx 15. Roux, K H. Optimization and Troubleshooting in PCR. In Dieffenbach, C W &
Dveksler G S. PCR Primer, A Laboratory Manual: Cold Spring Harbor Laboratory Press.1995. P 53. Hughes, S &.Lasken, R. (2005). Whole Genome Amplification, Oxfordshire: Scion publishing Ltd. P. 4-6, 99-109, 119-120
16. .Hartley, J L & Rashtchian, A. Enzymatic Control of Carryover Contamination in PCR. In Dieffenbach, C W & Dveksler G S. PCR Primer, A Laboratory Manual: Cold Spring Harbor Laboratory Press 1995. P23-27.

36
17. Cone, R W & Fairfax. Ultraviolet Irradiation of Surfaces to Reduce PCR Contamination. In Dieffenbach, C W & Dveksler G S. PCR Primer, A Laboratory Manual: Cold Spring Harbor Laboratory Press. 1995.P 31-34.
18. Dieffenbach, C W,. Lowe T,. Dveksler, G S,. General Concepts for Primer Design. In Dieffenbach, C W & Dveksler G S. PCR Primer, A Laboratory Manual: Cold Spring Harbor Laboratory Press.1995. P 133-138
19. Personal communication with M. Tärnberg. February, March 20. CLC Bio (homepage on the internet) Aarhus C Denmark. Bioinformatics Explained:
Multiple Alignments. Updated April 9, 2008. Cited February 12 2008. Avaliable from http://www.clcbio.com/index.php?id=1273
21. Kwok, S,. Chang, S,. Sninsky, J,.Wang A. Deisgn and Use of Mismatched and Denegerate Primers. In Dieffenbach, C W & Dveksler G S. PCR Primer, A Laboratory Manual: Cold Spring Harbor Laboratory Press.1995. P 147-150.
22. Othsuka, E,. Mathsuki, S,. Ikehara, M,. Takahashi, Y,.Matsubara, M. (1985). An Alternative Approach to Deoxynucleotides as Hybridization Probes by Insertation of Deoxyinosine at Ambigous Codon Positions. The Journal of Biological Chemistry, Vol 260. No. 5, Issue of March 10. P 2605-2608.
23. GlenResearch (homepage on the internet) Sterling Virginia, USA. New Universal and Degenerate Bases. Updated June 1995. Cited March 4 2008. Avaliable from http://www.glenresearch.com/GlenReports/GR8-1.pdf
24. Lasken, R. Multiple displacement amplification of genomic DNA. In Hughes, S &.Lasken, R. Whole Genome Amplification, Oxfordshire: Scion publishing Ltd 2005. P 99-109.
25. Lage, J M. & Lizardi,, P M. Introduction to whole genome amplification. In Hughes, S &.Lasken, R. Whole Genome Amplification, Oxfordshire: Scion publishing Ltd 2005. P 4-5.
26. C, Garmendia,. Bernad, A,. Esteban, J A,. Blanco, L,. Salas, M. (1992) The Bacteriophage φ29, a Proofreading Enzyme. The Journal of Biological Chemistry, Vol 267, No. 4, Issue of February 5. P 2594-2599.
27. Fevre, C,. Passet, V,. Weill, X,. Grimont P,. Brisse, S.(2005). Variants of the Klebsiella pneumoniae OKP Chromosomal Beta-Lactamase Are Divided into Two
Main Groups, OKP-A and OKP-B. Antimicrobial Agents and Chemotherapy, December, Vol. 49, No. 12. P 5149-5152.
28. Brisse, S & Verhoef, J. (2001) Phylogenetic diversity of Klebisella pneumoniae and Klebsiella ocytoca clinical isolates revealed by randomly amplified polymorphic DNA, gyrA and parC genes sequencing and automated ribotyping. International Journal of Systematic and Evolutionary Microbiology, 51. P 915-924.
Web pages Web pages used for gene accession numbers and nucleotide sequences:
Lahey Clinic Website: www.lahey.org/Studies Pasteur Institute Website:
http://www.pasteur.fr/recherche/genopole/PF8/betalact_en.html GenBank, NCBI website: www.ncbi.nlm.nih.gov/ Web page used in primer design:
OligoAnalyzer 3.1: http://eu.idtdna.com/analyzer/Applications/OligoAnalyzer/

37
Appendix 1 Table 1. Primers used in PCR
*Provided by Paterson DL, International Klebsiella Study group
** Base position 1 refers to Lahey Clinic Website, the first nucleotide in amino acid at position 5. Table 2. PCR programs 30 cycles
.
30 cycles
Activation
of UNG
Initial
Denaturation Denaturation Annealing Extension Final Extension
4 37ºC 10min 95ºC 10min 94ºC 30s 58ºC 30s 72ºC 1 min 72ºC 10 min
Set Primer Nucleotide sequence 5'→3' direction Amplicon size (bp) Target
Target region (bp)**
1 blaSHV.se* ATGCGTTATDTTCGCCTGTG 753 blaSHV 1-20
blaSHV.as*
TGCTTTGTTATTCGGGCCAA
734-754
2 CLC1.se GCGTTATRTTCGCCTGTG 854 blaSHV, blaLEN, blaOKP 3-20
CLC1.as
GYTGCCAGTGCTCGATCA
839-856
3 CLC2.se TTCGCCTGTGYMTTATCTCCCT 845 blaSHV, blaLEN, blaOKP 10-32
CLC2.as
YTGCCAGTGCTCGATCAG
838-855
4 blaSHV.se ATGCGTTATDTTCGCCTGTG 854 blaSHV, blaLEN, blaOKP 1-20
US.as
TGCCAGTGCTCGATCAGCG
836-854
5 blaSHV.se ATGCGTTATDTTCGCCTGTG 860 blaSHV, blaLEN, blaOKP 1-20
US2.as
TAGCGYTGCCAGTGCTCGAT
841-860
6 SP6+blaSHV.se CATTTAGGTGACACTATAGATGCGTTATDTTCGCCTGTG 854 blaSHV, blaLEN, blaOKP 1-20
T7+US.as
TAATACGACTCACTATAGGGTGCCAGTGCTCGATCAGCG
836-854
PCR
programme
Initial
Denaturation Denaturation Annealing Extension
Final
extension
1 95ºC 15 min 94ºC 30s 50ºC-62,5ºC 30s 72ºC 1 min 72ºC 10 min
2 95ºC 15 min 94ºC 30s 58ºC 30s 72ºC 1 min 72ºC 10 min
3 95ºC 2 min 94ºC 30s 50ºC-62,5ºC 30s 72ºC 1 min 72ºC 10 min

38
Table 3. A gradient of different amounts of purified PCR amplicons, containing uracil instead of thymines, used in the verification of UNG activity. Sample: 1 2 3 4 5 6 7 8 Amount of purified PCR amplicon (ng) 8,25 0,825 8,25*10-2 8,25*10-3 8,25*10-4 8,25*10-5 8,25*10-6 8,25*10-7 Well on agarose gel (Figure 5) 2 3 4 5 6 7 8 9 Table 4. Clinical isolates used in the study Table 5. Reference strains used in the study.
Clinical isolate Bacterium Specimen
1 K.pneumoniae Urine 18 K.pneumoniae Upper airway 19 K.pneumoniae Urine 23 K.pneumoniae Hygiene screening 33 K.pneumoniae Urine 43 K.pneumoniae Faeces 73 K.pneumoniae Exudates 92 K.pneumoniae Hygiene screening 103 K.pneumoniae Hygiene screening 106 K.pneumoniae Urine 110 K.pneumoniae Hygiene screening 132 K.pneumoniae Urine 137 K.pneumoniae Hygiene screening 138 K.pneumoniae Hygiene screening 143 K.pneumoniae Hygiene screening 179 K.pneumoniae Urine 184 K.pneumoniae Exudates 185 K.pneumoniae Urine 205 K.pneumoniae Exudates 230 K.pneumoniae Hygiene screening 265 K. oxytoca Urine
Reference strain 1205 SHV-2 J53 SHV-1 J53 SHV-2
ATCC11296 SHV-12 ATCC13883 SHV-1
ATCC700603 SHV-19

39
Appendix 2 P30896 SHV-3 AY259119 SHV-44 X53817 SHV-2a X98105 SHV-12 AF148851 SHV-2 AF547625 SHV-45 X55640 SHV-5 DQ328802 SHV-86 AJ863560 SHV-55 AF535128 SHV-40 AY037779 SHV-33 AM176554 SHV-79 AF227204 SHV-26 EF3733970 SHV-94 AF467947 SHV-36 DQ193536 SHV-89 AJ866283 SHV-60 DQ013287 SHV-70 AF299299 SHV-28 EU024485 SHV-102 AF293345 SHV-27 EU274581 SHV-104 AM176556 SHV-81 AF148850 SHV-1 EU155018 SHV-101 AAL68926 SHV-35 EF373971 SHV-96 AM176558 SHV-83 AF164577 SHV-13 AJ866284 SHV-61 AF535129 SHV-41 X98101 SHV-11 AY223863 SHV-57 EU032604 SHV-103 AY263404 SHV-48 AY277255 SHV-31 EF37372 SHV-95 AY288916 SHV-50 EF373973 SHV-97 AY037778 SHV-46 ECU20270 SHV-7 AY661885 SHV-30
AF132290 SHV18 AF226622 SHV14 AF301532 SHV-29 TCC700603 SHV-18 DQ174304 SHV-66 DQ174304 SHV-64 EU342351 SHV-63 AY289548 SHV-51 AY079099 SHV-38 DQ322460 SHV-85 AM176549 SHV-74 AF072684 SHV-16 DQ1744308 SHV-69 DQ174305 SHV-65 AM176549 SHV-78 AF072684 SHV-24 EF373969 SHV-93 AM176650 SHV-75 AM176652 SHV-77 ECU92041 SHV-8 AF208796 SHV-25 AF535130 SHV-42 AM176557 SHV-82 DQ174307 SHV-67 AM176555 SHV-80 DQ836922 SHV-92 AY528718 SHV-49 AJ866285 SHV-62 AM176547 SHV-72 AM176548 SHV-73 AY790341 SHV-43 AJ011428 SHV-15 AM176546 SHV-71 AY036620 SHV-34 AF467948 SHV-37 AM176551 SHV-76 S82452 SHV-9
X04515 LEN1 AY037780 LEN2 AY130286 LEN3 AY130287 LEN4 AY633109 LEN5 AY265890 LEN6 AJ635425 LEN7 AJ635424 LEN8 AJ635405 LEN9 AJ635419 LEN10 AJ635417 LEN11 AJ635406 LEN12 AY265889 LEN14 AF425105 LEN15 AY743417 LEN16 EF205593 LEN17 AM051152 OKP-B-3 AM051153 OKP-B-4 AM051159 OKP-B-9 AJ635402 OKP-B-1 AM051151 OKP-B-2 AY512506 OKP-B-5 AY850171 OKP-B-6 AM051160 OKP-B-10 AY825330 OKP-B-13 AM051156 OKP-B-7 AM051157 OKP-B-8 AM051161 OKP-B-11 DQ995288 OKP-B-14 AJ635401 OKP-A-1 AM051142 OKP-A-4 AJ635404 OKP-A-2 AM051147 OKP-A-8 AM051140 OKP-A-3 AM051148 OKP-A-9 AM051149 OKP-A-10 AM051143 OKP-A-5 AM051144 OKP-A-6 AM051145 OKP-A-7 AJ635420 OKP-B-12
ACCESSION NUMBERS USED FOR SHV, LEN AND OKP GENES

40