novel whole genome amplification for difficult and … whole genome amplification for difficult and...
TRANSCRIPT
Novel Whole Genome Amplification for Difficult and Limited TemplatesChad T. Brueck, Lukasz D. Nosek, Shaukat Rangwala, Clyde R. Brown,
Ernest J. Mueller, Rafael Valdes-Camin, Kevin J. Kayser
MOgene, LC893 North Warson Rd., St. Louis, MO 63141
Sigma-Aldrich Biotechnology 2909 Laclede Ave., St. Louis, MO 63103
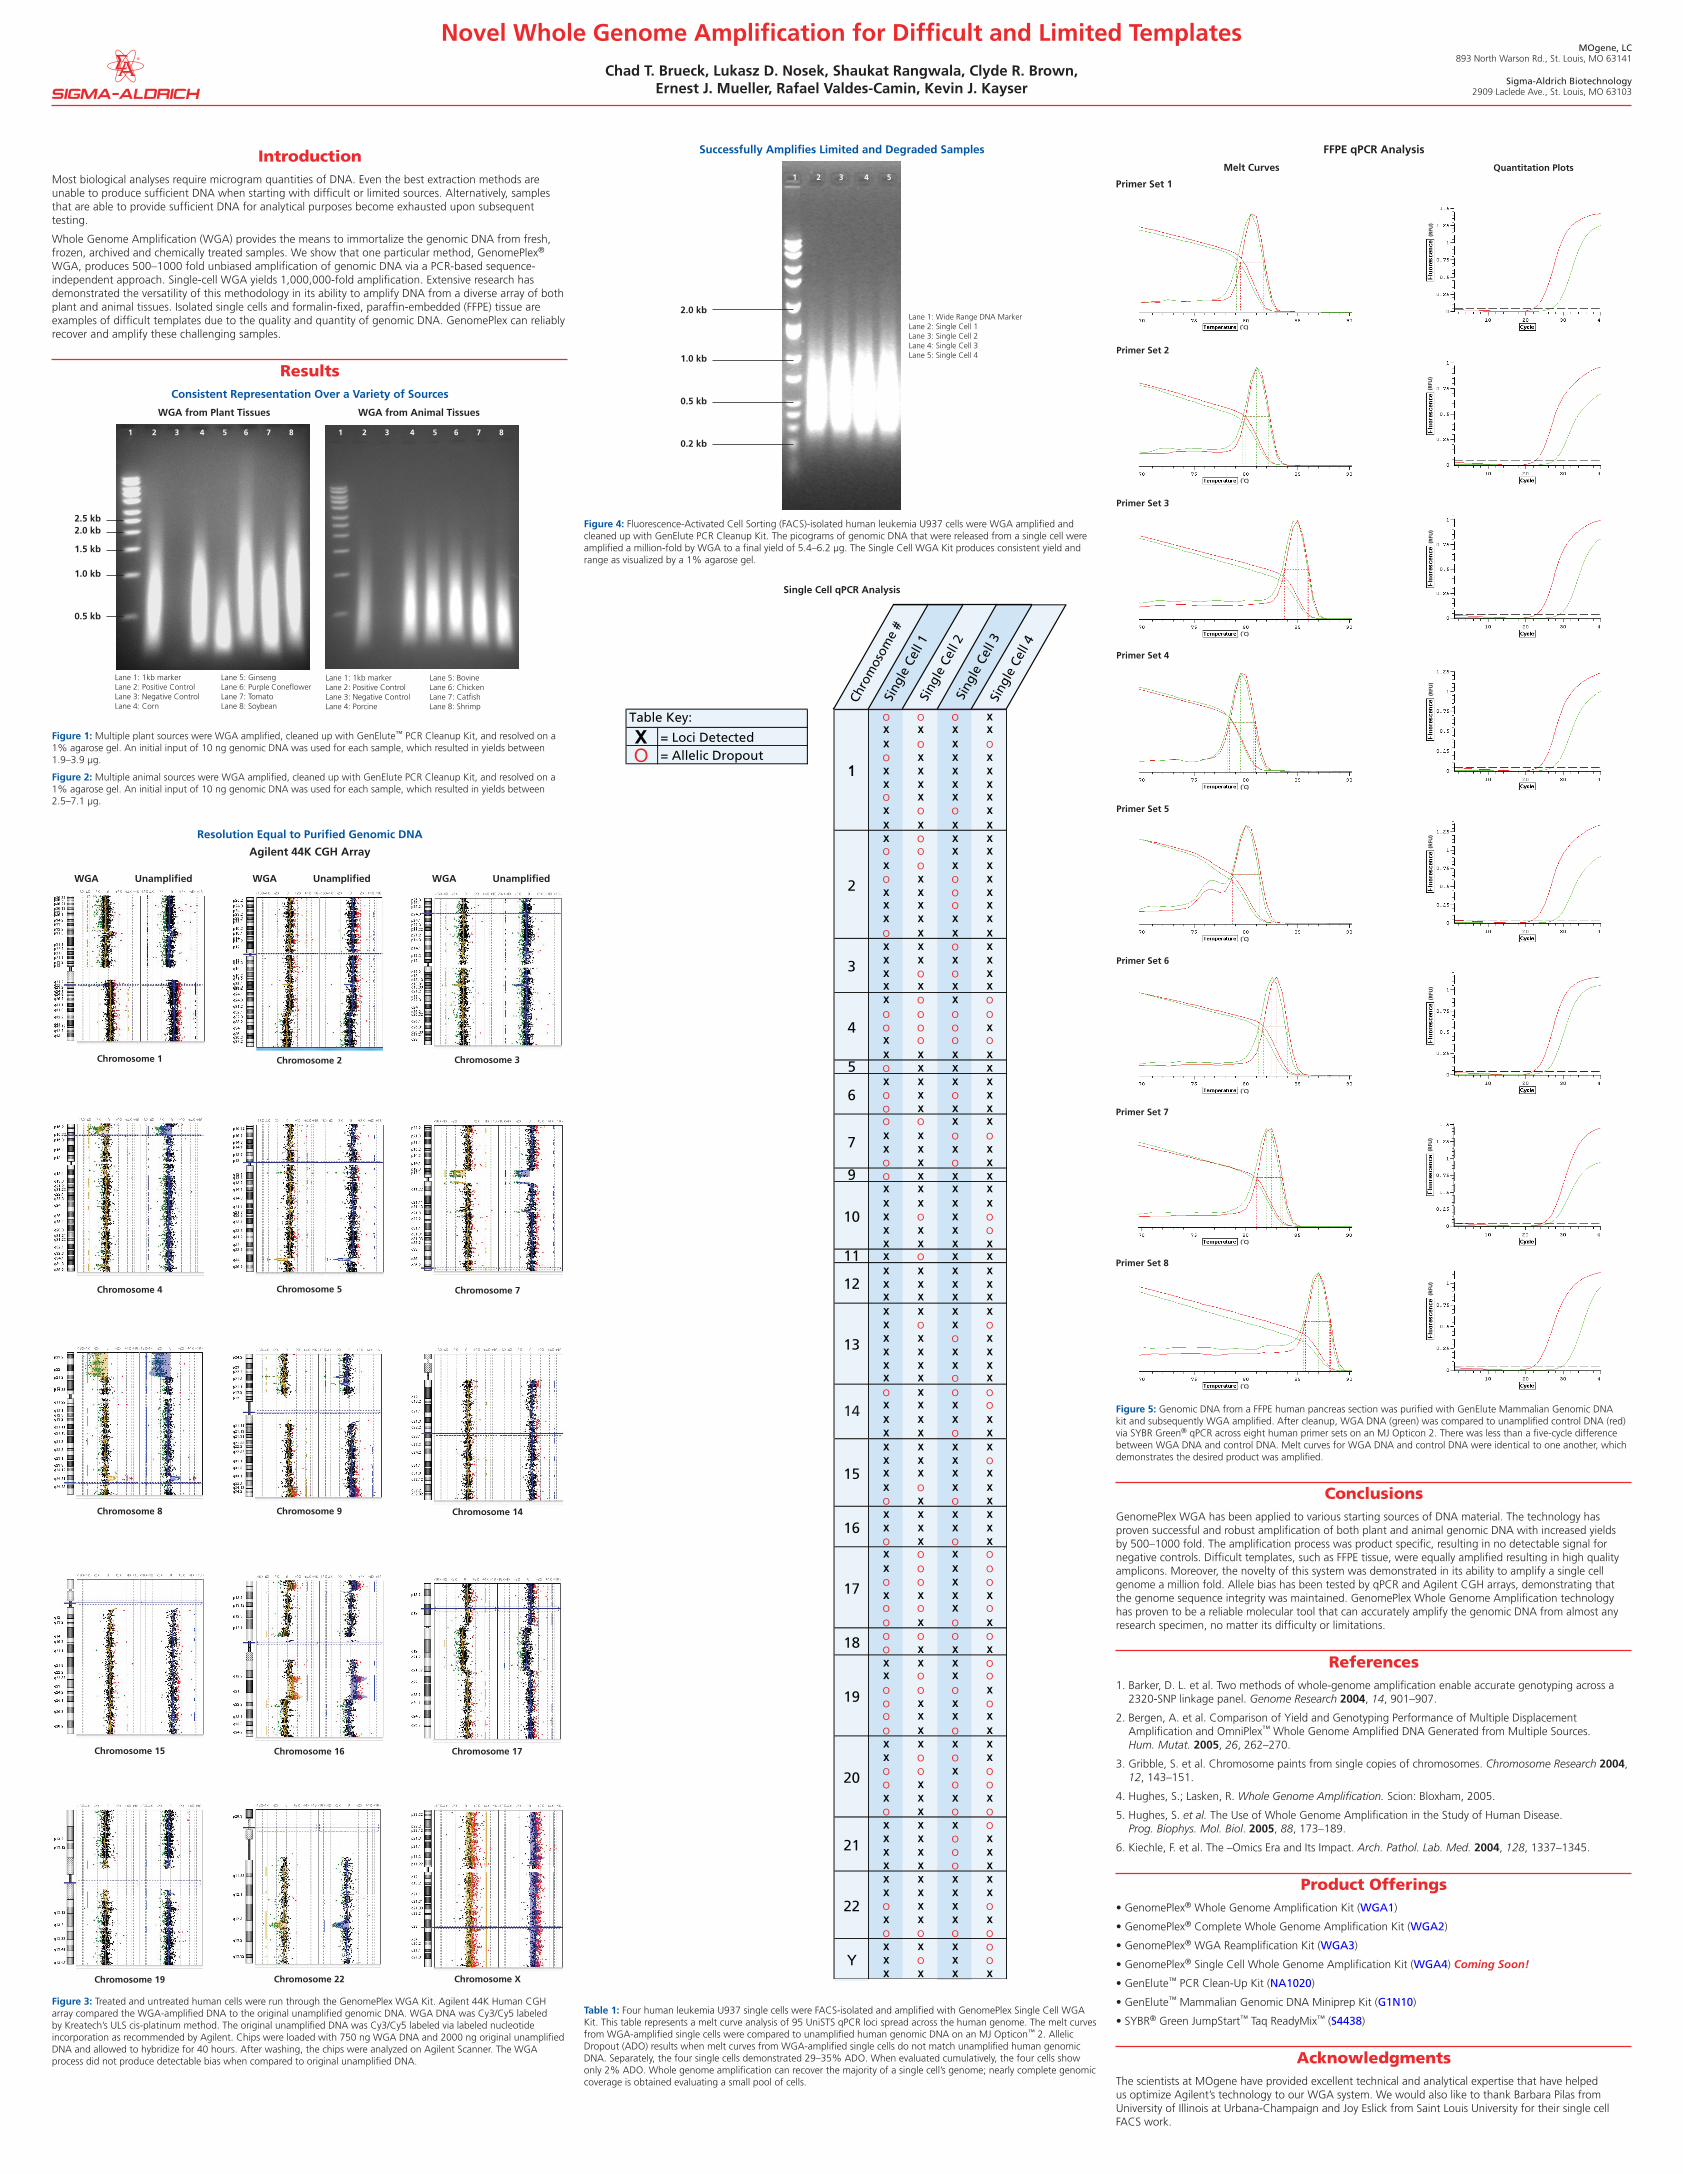
Successfully Amplifies Limited and Degraded Samples
Figure 4: Fluorescence-Activated Cell Sorting (FACS)-isolated human leukemia U937 cells were WGA amplified and cleaned up with GenElute PCR Cleanup Kit. The picograms of genomic DNA that were released from a single cell were amplified a million-fold by WGA to a final yield of 5.4–6.2 µg. The Single Cell WGA Kit produces consistent yield and range as visualized by a 1% agarose gel.
Single Cell qPCR Analysis
1
O O O XX X X XX O X O
O X X XX X X XX X X XO X X XX O O XX X X XX O X XO O X XX O X XO X O XX X O XX X O XX X X XO X X XX X O XX X X XX O O XX X X XX O X O
O O O O
O O O XX O O O
X X X X5 O X X X
X X X XO X O XO X X XO O X XX X O O
X X X XO X O X
9 O X X XX X X XX X X XX O X O
X X X O
X X X X11 X O X X
X X X XX X X XX X X XX X X XX O X O
X X O XX X X XX X X XX X O XO X O O
X X X O
X X X XX X O X
1
2
3
4
6
7
10
12
13
14
XO
= Loci Detected= Allelic Dropout
Table Key:
X X X XX X X O
X X X XX O X XO X O XX X X XX X X XO X O XX O X O
X O X O
O O X O
X X X XO O X O
O X O XO O O O
O X X XX X X O
X O X O
O O O XO X X O
O X X XO X O XX X X XX O O XO O X O
O X O O
X X X XO X O O
X X X O
X X O XX X O XX X O XX X X XX X X XO X X O
X X X XO O O O
X X X O
X O X O
X X X X
15
16
21
22
Y
17
18
19
20
Chro
mos
ome
#Si
ngle
Cel
l 1
Sing
le C
ell 3
Sing
le C
ell 4
Sing
le C
ell 2
Table 1: Four human leukemia U937 single cells were FACS-isolated and amplified with GenomePlex Single Cell WGA Kit. This table represents a melt curve analysis of 95 UniSTS qPCR loci spread across the human genome. The melt curves from WGA-amplified single cells were compared to unamplified human genomic DNA on an MJ Opticon™ 2. Allelic Dropout (ADO) results when melt curves from WGA-amplified single cells do not match unamplified human genomic DNA. Separately, the four single cells demonstrated 29–35% ADO. When evaluated cumulatively, the four cells show only 2% ADO. Whole genome amplification can recover the majority of a single cell’s genome; nearly complete genomic coverage is obtained evaluating a small pool of cells.
Figure 5: Genomic DNA from a FFPE human pancreas section was purified with GenElute Mammalian Genomic DNA kit and subsequently WGA amplified. After cleanup, WGA DNA (green) was compared to unamplified control DNA (red) via SYBR Green® qPCR across eight human primer sets on an MJ Opticon 2. There was less than a five-cycle difference between WGA DNA and control DNA. Melt curves for WGA DNA and control DNA were identical to one another, which demonstrates the desired product was amplified.
ConclusionsGenomePlex WGA has been applied to various starting sources of DNA material. The technology has proven successful and robust amplification of both plant and animal genomic DNA with increased yields by 500–1000 fold. The amplification process was product specific, resulting in no detectable signal for negative controls. Difficult templates, such as FFPE tissue, were equally amplified resulting in high quality amplicons. Moreover, the novelty of this system was demonstrated in its ability to amplify a single cell genome a million fold. Allele bias has been tested by qPCR and Agilent CGH arrays, demonstrating that the genome sequence integrity was maintained. GenomePlex Whole Genome Amplification technology has proven to be a reliable molecular tool that can accurately amplify the genomic DNA from almost any research specimen, no matter its difficulty or limitations.
References1. Barker, D. L. et al. Two methods of whole-genome amplification enable accurate genotyping across a
2320-SNP linkage panel. Genome Research 2004, 14, 901–907.
2. Bergen, A. et al. Comparison of Yield and Genotyping Performance of Multiple Displacement Amplification and OmniPlex™ Whole Genome Amplified DNA Generated from Multiple Sources. Hum. Mutat. 2005, 26, 262–270.
3. Gribble, S. et al. Chromosome paints from single copies of chromosomes. Chromosome Research 2004, 12, 143–151.
4. Hughes, S.; Lasken, R. Whole Genome Amplification. Scion: Bloxham, 2005.
5. Hughes, S. et al. The Use of Whole Genome Amplification in the Study of Human Disease. Prog. Biophys. Mol. Biol. 2005, 88, 173–189.
6. Kiechle, F. et al. The –Omics Era and Its Impact. Arch. Pathol. Lab. Med. 2004, 128, 1337–1345.
Product Offerings• GenomePlex® Whole Genome Amplification Kit (WGA1)
• GenomePlex® Complete Whole Genome Amplification Kit (WGA2)
• GenomePlex® WGA Reamplification Kit (WGA3)
• GenomePlex® Single Cell Whole Genome Amplification Kit (WGA4) Coming Soon!
• GenElute™ PCR Clean-Up Kit (NA1020)
• GenElute™ Mammalian Genomic DNA Miniprep Kit (G1N10)
• SYBR® Green JumpStart™ Taq ReadyMix™ (S4438)
AcknowledgmentsThe scientists at MOgene have provided excellent technical and analytical expertise that have helped us optimize Agilent’s technology to our WGA system. We would also like to thank Barbara Pilas from University of Illinois at Urbana-Champaign and Joy Eslick from Saint Louis University for their single cell FACS work.
Lane 1: 1kb markerLane 2: Positive ControlLane 3: Negative ControlLane 4: Corn
Lane 5: GinsengLane 6: Purple ConeflowerLane 7: TomatoLane 8: Soybean
Lane 1: 1kb markerLane 2: Positive ControlLane 3: Negative ControlLane 4: Porcine
Lane 5: BovineLane 6: ChickenLane 7: CatfishLane 8: Shrimp
Chromosome 1 Chromosome 2 Chromosome 3
Chromosome 4 Chromosome 5 Chromosome 7
Chromosome 8 Chromosome 9 Chromosome 14
Chromosome 15 Chromosome 16 Chromosome 17
Chromosome 19 Chromosome 22 Chromosome X
2.5 kb2.0 kb
1.5 kb
1.0 kb
0.5 kb
IntroductionMost biological analyses require microgram quantities of DNA. Even the best extraction methods are unable to produce sufficient DNA when starting with difficult or limited sources. Alternatively, samples that are able to provide sufficient DNA for analytical purposes become exhausted upon subsequent testing.
Whole Genome Amplification (WGA) provides the means to immortalize the genomic DNA from fresh, frozen, archived and chemically treated samples. We show that one particular method, GenomePlex® WGA, produces 500–1000 fold unbiased amplification of genomic DNA via a PCR-based sequence-independent approach. Single-cell WGA yields 1,000,000-fold amplification. Extensive research has demonstrated the versatility of this methodology in its ability to amplify DNA from a diverse array of both plant and animal tissues. Isolated single cells and formalin-fixed, paraffin-embedded (FFPE) tissue are examples of difficult templates due to the quality and quantity of genomic DNA. GenomePlex can reliably recover and amplify these challenging samples.
ResultsConsistent Representation Over a Variety of Sources
WGA from Plant Tissues WGA from Animal Tissues
Figure 1: Multiple plant sources were WGA amplified, cleaned up with GenElute™ PCR Cleanup Kit, and resolved on a 1% agarose gel. An initial input of 10 ng genomic DNA was used for each sample, which resulted in yields between 1.9–3.9 µg.
Figure 2: Multiple animal sources were WGA amplified, cleaned up with GenElute PCR Cleanup Kit, and resolved on a 1% agarose gel. An initial input of 10 ng genomic DNA was used for each sample, which resulted in yields between 2.5–7.1 µg.
Resolution Equal to Purified Genomic DNA
Agilent 44K CGH Array
Figure 3: Treated and untreated human cells were run through the GenomePlex WGA Kit. Agilent 44K Human CGH array compared the WGA-amplified DNA to the original unamplified genomic DNA. WGA DNA was Cy3/Cy5 labeled by Kreatech’s ULS cis-platinum method. The original unamplified DNA was Cy3/Cy5 labeled via labeled nucleotide incorporation as recommended by Agilent. Chips were loaded with 750 ng WGA DNA and 2000 ng original unamplified DNA and allowed to hybridize for 40 hours. After washing, the chips were analyzed on Agilent Scanner. The WGA process did not produce detectable bias when compared to original unamplified DNA.
1 2 3 4 5 6 7 8 1 2 3 4 5 6 7 8
2.0 kb
1.0 kb
0.5 kb
0.2 kb
Lane 1: Wide Range DNA MarkerLane 2: Single Cell 1Lane 3: Single Cell 2Lane 4: Single Cell 3Lane 5: Single Cell 4
Primer Set 8
Primer Set 7
Primer Set 6
Primer Set 5
Primer Set 4
Primer Set 3
Primer Set 2
Primer Set 1 1 2 3 4 5
Melt Curves Quantitation Plots
WGA Unamplified WGA Unamplified WGA Unamplified
(°C)
(°C)
(°C)
(°C)
(°C)
(°C)
(°C)
(°C)
(RFU
)(R
FU)
(RFU
)(R
FU)
(RFU
)(R
FU)
(RFU
)(R
FU)
FFPE qPCR Analysis