who owns the twin cities?
TRANSCRIPT
RESEARCH REPORT
Who Owns the Twin Cities? An Analysis of Racialized Ownership Trends in Hennepin and Ramsey Counties
Yonah Freemark Eleanor Noble Yipeng Su
June 2021
M E T R O P O L I T A N H O U S I N G A N D C O M M U N I T I E S P O L I C Y C E N T E R
ABOUT THE URBAN INSTITUTE
The nonprofit Urban Institute is a leading research organization dedicated to developing evidence-based insights
that improve people’s lives and strengthen communities. For 50 years, Urban has been the trusted source for
rigorous analysis of complex social and economic issues; strategic advice to policymakers, philanthropists, and
practitioners; and new, promising ideas that expand opportunities for all. Our work inspires effective decisions
that advance fairness and enhance the well-being of people and places.
Copyright © June 2021. Urban Institute. Permission is granted for reproduction of this file, with attribution to the
Urban Institute. Cover image by Proper Studios for the Urban Institute.
Contents Acknowledgments iv
Who Owns the Twin Cities? 1
Key Takeaways 1
Property Ownership: One Reflection of Equitable Access to Wealth 3
Examining Ownership Patterns as a Barometer of Neighborhood Health and Wealth 3
Methods 9
Homeownership Patterns Show Growing Gaps between Households Based on Race 11
Overall Ownership Trends 11
Comparing Change Based on Neighborhood Type 14
The Rise of the Investor Landlord in the Twin Cities Metropolitan Region 19
Increasing LLC Ownership of Rental Properties over the Past Two Decades 20
Investor Landlords Target SFR Investment in Low-Income and BIPOC Neighborhoods 27
Implications of Our Findings 35
Future Research Directions 38
Notes 39
References 40
About the Authors 42
Statement of Independence 43
i v A C K N O W L E D G M E N T S
Acknowledgments This report was funded by the McKnight Foundation. We are grateful to them and to all our funders,
who make it possible for Urban to advance its mission.
The views expressed are those of the authors and should not be attributed to the Urban Institute,
its trustees, or its funders. Funders do not determine research findings or the insights and
recommendations of Urban experts. Further information on the Urban Institute’s funding principles is
available at urban.org/fundingprinciples.
We thank Kimberly Burrowes and Michael Neal for their extensive review and support throughout
the editing process. We also appreciate the opportunity to present on this research to the Renters and
Rental Market Crisis Working Group and the Housing Finance Policy Center at Urban. We also thank
our partners in this research in the Twin Cities, including the Alliance, the Family Housing Fund, the
Center for Economic Inclusion, and the Center for Urban and Regional Affairs.
Who Owns the Twin Cities? In the Twin Cities, housing, economic mobility, and racial equity are inextricably linked. The region is
home to the largest Black-white homeownership gap in the nation; rising rents; increasing racialized
displacement; and limited opportunities for Black, Indigenous, and people of color (BIPOC) and low-
income communities to build wealth through property ownership. In this report, we examine racial
gaps in homeownership and displacement as well as the increasing prominence of corporate single-
family rental (SFR) property ownership. This investigation identifies trends at both the neighborhood
and county levels and is designed to explore existing conditions. In doing so, we aim to help
community organizations and local governments achieve neighborhood stability and equitable
recovery in the years ahead.
The growing racial disparities in income, financial stability, and economic opportunity across the
Minnesota Twin Cities region have been exacerbated by the COVID-19 pandemic. To help
decisionmakers, residents, and researchers in Hennepin and Ramsey Counties better identify
homeownership and rental patterns, we examine two key questions essential to understanding
residential location and ownership. First, we ask how homeownership patterns vary by race and over
time.1 Second, we examine who owns rental properties, with a particular focus on ownership by large
investors from outside of the region. We use several quantitative methods, integrating data from the
US Census Bureau and from county property records. This work is the product of a partnership
between the Urban Institute, the Alliance, the Family Housing Fund, and the Center for Economic
Inclusion, with support from the McKnight Foundation.
Key Takeaways
◼ The Twin Cities have largest Black-white homeownership gap of any metropolitan region in
the nation, and that gap has worsened dramatically since 2000. This stark divide in
homeownership reflects broader patterns of racialized wealth and income inequality in the
region.
1 We chose to use the term BIPOC when describing aggregated groups of people of color but recognize that
there are no uniform experiences or outcomes within these groups. Due to a lack of reliable and quality data at
the neighborhood-level, we were unable to highlight the pressing housing disparities facing the many Indigenous,
Asian, South Asian, and immigrant communities across the Twin Cities metro region.
2 W H O O W N S T H E T W I N C I T I E S ?
◼ Homeownership among Black families has declined most in neighborhoods where higher-
income families of all races are arriving. Neighborhoods that are attracting new high-income
residents are displacing lower-income residents (who are more likely to be people of color) in
the process. Although rising rents in these gentrifying neighborhoods increase the likelihood
of evictions for existing renters, this research suggests that Black homeowners in these areas
are also displaced, further widening the Black-white homeownership gap. Existing
homeowners face rising property values and higher property taxes and thus a greater
likelihood of being housing cost burdened or subject to foreclosure.
◼ An increasing share of housing units in the Twin Cities is made up of SFRs. As in other
metropolitan areas throughout the nation, the region has experienced a dramatic rise in the
share of single-family units that are rented out rather than owned by their residents. We
estimate that the number of SFR units has more than doubled between 2005 and 2020, from
around 22,000 to over 48,000 homes in Hennepin and Ramsey counties alone.
◼ Corporate landlords have invested massively in SFRs in the two counties, disproportionately
purchasing in neighborhoods with more low-income and BIPOC residents and decreasing
homeownership rates. North Minneapolis and much of central St. Paul have experienced a
rapid rise in their shares of SFRs owned by investor landlords, which we define as LLC (limited
liability company), corporate, or individual investor rental property owners with at least three
single-family homes in their portfolios. Homeownership has also declined in these
neighborhoods over the past two decades, and now over 10 percent of housing in them is SFR
units owned by investors.
◼ The net effect of changing property ownership patterns is a shift of wealth out of the
neighborhood. Over the past 15 years, the amount of property wealth held by local
homeowners of single-family homes declined in the two counties despite a growing
population. Investors have picked up the slack, siphoning away billions of dollars of local
property value in single-family homes that are now rented.
◼ Local policymakers should identify best practices to close the Black-white homeownership
gap. Local governments must work to ensure neighborhood stability is prioritized and Black
families are provided increased opportunities to purchase their own homes. Options include
increased homeownership counseling, financial aid to prevent foreclosures, and improved
information about appropriate mortgage terms.
◼ New solutions are necessary to prioritize alternatives to investor property ownership that
keep wealth in communities and ensure renters are treated fairly. Although SFRs may offer
W H O O W N S T H E T W I N C I T I E S ? 3
moderate-income families an opportunity to live in convenient, comfortable neighborhoods,
they also may be contributing to reduced homeownership and may subject tenants to
precarious conditions. Local governments should work to ensure renters have protection
against unjust eviction, and state and national governments should ensure investor landlords—
particularly large, corporate entities, are regulated and taxed in a manner that reflects their
impact on society.
Property Ownership: One Reflection of Equitable Access
to Wealth
Examining Ownership Patterns as a Barometer of Neighborhood Health and Wealth
For low-, moderate-, and middle-income residents in the US, homeownership has become the primary
pathway to achieving financial stability and success. Property ownership makes up a larger share of
wealth for these households than stocks or other assets.1 Homeownership also provides a degree of
security: an owned home is more stable for many residents than rental units, which are subject to
increasing costs over time and eviction.
Homeownership, however, does not guarantee stability: the foreclosure of millions of homes
during the Great Recession was a clear demonstration of that. Moreover, the distribution of both
homeownership and property ownership today is the product of a shift from an already uneven base.
Even for Black families who have been able to purchase a home, their ability to build wealth is limited.
Neal, Choi, and Walsh (2020) note that median housing equity among Black owners was $60,000 in
2018 compared with $74,000 for Latinx owners and $118,000 for white owners.2 Black house
owners, on average, own lower-value homes and hold more mortgage debt.
Homeownership was always more accessible to whiter and wealthier individuals in the United
States because of a racist real-estate system, a discriminatory legal system, and uneven access to
wealth. The ability of BIPOC to purchase a home was severely limited by law throughout the country
until the second half of the 20th century. The 1968 Fair Housing Act was designed to eliminate
discrimination, but parts of the law have been enforced unevenly, such as its goal of “affirmatively
2 Our team has decided to use the terms Black and Latinx when referring to African-American and Black people
and to Hispanic and Latino/a people, respectively.
4 W H O O W N S T H E T W I N C I T I E S ?
furthering fair housing.” In the decades since the Fair Housing Act was passed, BIPOC have continued
to face discrimination (both legal and illegal) by public and private actors.
Throughout the United States, BIPOC continue to have lower homeownership rates than white
people (Cahill and Franklin 2013), and economic differences alone fail to explain this growing inequity.
Although variation in income, marital status, access to parental support, credit scores, and (to some
degree) location are correlated with homeownership rates, about 17 percent of the Black-white
homeownership gap remains unexplained by demographic indicators (Hilber and Liu 2008; Oberg
2017).2 Educational differences (once controlling for income) are also not associated with variation in
level of homeownership (Choi 2020; Choi et al. 2019). Preexisting racial and ethnic wealth gaps are
magnified through the property ownership system as white people are able to take advantage of
higher personal incomes and family resources to conserve their wealth through homeownership to a
degree that Black families cannot.
The Great Recession reinforced those preexisting inequalities. After several decades of the gap
between Black and white homeownership declining, it has grown over the past decade, reaching 30.2
percentage points in 2017, a year in which only 41.8 percent of Black households owned their own
homes (Choi et al. 2019). In their study of how the homeownership gap changed between 2005 and
2011, Seah and Fesselmeyer (2017) show that the people most likely to be affected by changing
economic and housing-market conditions were those Black families who, based on their
demographics, were considering whether to buy a home. In other words, the changing
homeownership gap had a lot to do with many prospective homebuyers being kept out of the
marketplace.
Changing levels of homeownership may also reflect gentrification and displacement in certain
neighborhoods. Such communities, which are hotbeds of investment and thus rising housing prices
(both for renting and buying), are also challenging environments for vulnerable people, including both
renters and owners. Brummet and Reed (2019) show that less-educated renter families living in
neighborhoods experiencing gentrification are more likely to move and that higher-educated families
who stay in place are likely to pay higher rents after gentrification occurs. Though homeowners may
see property value increases from gentrification, they may also experience increased property taxes
(making it more difficult for them to remain in place). Moreover, because of rising values, those to
whom they sell their homes are less likely to be families with low incomes or BIPOC.
W H O O W N S T H E T W I N C I T I E S ? 5
HOMEOWNERSHIP AND THE STARK RACIAL WEALTH GAP IN THE TWIN CITIES
These racialized property ownership trends have stark negative impacts in the Twin Cities. Although
the area is frequently lauded as one of the nation’s most affordable places to rent and buy,3 this
characteristic only holds for white middle- and upper-class residents (Horowitz et al. 2021). The region
has the widest racialized gap in homeownership among metropolitan areas across the country: a 51
percentage-point difference between white and Black households.4 By comparison, the Charleston,
South Carolina, region only has a 15 percentage-point gap in homeownership. One explanation for
these differences is the collection of choices made by local municipalities about their land use. Choi
and colleagues (2019), for example, found that Black homeownership is higher in metropolitan areas
with more building permits (themselves a reflection of less restrictive land-use rules), and white
homeownership is higher in those regions with more segregation, which itself is a product of
inadequate access to affordable housing in some neighborhoods.
These trends affect other people of color as well. For example, in Hennepin County in 2019,
Latinx families had median household incomes that just two-thirds those of white families, according
to the US Census Bureau. Less disposable income means Latinx families are less likely to be able to
buy homes, and the types of housing they are able to rent is lower quality on average. Disparities in
intergenerational wealth held among and between different racial and ethnic groups also drives this
divide. In Minnesota, white households hold a median net worth of $211,000, Asian households in the
25th percentile hold $17,000, and Asian households in the 50th percentile hold close to $358,000.
Together, these circumstances reinforce limited access to opportunity among BIPOC. Certain
communities restrict housing supply, particularly the production of new affordable housing, through
the use of exclusionary zoning and the decision to limit the availability of subsidies for low-income
renters. These same communities then “hoard” wealth, collecting disproportionate tax revenues to
better fund public services such as schools. People and communities who are left out of this cycle
suffer from higher rates of poverty and poorer services (Freemark, Steil, and Thelen 2020; Freemark
and Steil 2021).
These real-estate market conditions also affect the economic success and wealth-building
potential of entire BIPOC communities and neighborhoods in the Twin Cities. Perry, Rothwell, and
Harshbarger (2018) found that homes in majority-Black neighborhoods in the metropolitan region are
valued over 20 percent less than similar homes in neighborhoods where less than 1 percent of
residents are Black, even after adjusting for neighborhood characteristics and housing conditions.
Unfortunately, homes in these neighborhoods are often both undervalued and overtaxed, with
research suggesting that the mismatch between high real-estate assessments (and subsequent
6 W H O O W N S T H E T W I N C I T I E S ?
property taxes) and low market values result in higher housing cost burdens for Black and Latinx
homeowners in Minnesota (Horowitz et al. 2021). And amid higher cost burdens, lower mortgage
rates, and higher prices (owing to the larger growth in low-priced homes), Black homeowners have a
lower propensity to refinance, which would help alleviate this burden (Gerardi, Willen, and Zhang
2020).
THE FINANCIALIZATION OF SINGLE-FAMILY RENTAL OWNERSHIP
The rising racialized gap in homeownership parallels recent changes in the way investments are made
in housing. The nation’s stock of single-family homes has always included a rental component, though
the share that was rented out fell until the mid-2000s, at which point 87 percent of such houses were
owned by their residents (Reid, Sanchez-Moyano, and Galante 2018). Most SFRs were owned by
small-scale local investors with just a few homes in their portfolios (Mills, Molloy, and Zarutskie 2019).
Beginning in the mid-2000s and especially following the Great Recession, however, this
characteristic of single-family homeownership began to change, especially in certain Sunbelt regions
targeted for investment. Large-scale corporations have invested billions of dollars in small-scale rental
properties, mostly in the form of single-family homes (Colburn, Walter, and Pfeiffer 2020). They took
advantage of the ample supply of property for sale in the wake of the foreclosure crisis; tighter
mortgage financing rules; and a decrease in management costs made possible by advances in
technology (Mills, Molloy, and Zarutskie 2019). Their investment in “distressed” properties ramped up
quickly. In Atlanta, for example, this type of investment increased from 5 percent of single-family
home sales in 2006 to 25 percent by 2008 and about 20 percent by 2012 (Immergluck and Law 2014).
This type of buy-to-rent investment may have begun to fall as a portion of sales after that point (Mills,
Molloy, and Zarutskie 2019).
The investment in SFRs must be differentiated from the broader market for multifamily housing.
The growth in the multifamily rental housing stock was largely a product of new construction, though
a small number of existing condominium buildings have switched to rental. On the other hand, the
growth in SFRs was largely caused by a shift in tenure. Investors did not build new units but largely
bought existing, owned homes and converted them to rentals.
These large-scale, professional investors differ from resident-homeowners and the individual
investors or small-scale landlords that preceded them. National investors tend to have more
bargaining power and better information than owner-occupiers and thus purchase such homes at
lower prices. They often target existing lower-quality houses for renting out, as compared to choices
homeowners would make for themselves (Cohen and Harding 2020). By 2019, large investors
W H O O W N S T H E T W I N C I T I E S ? 7
(sometime referred to as real estate owners), often in the form of real estate investment trusts, had
acquired 200,000 homes throughout the country, totaling about $30 billion in assets. Some of the
largest firms include Invitation Homes, American Homes 4 Rent, and Tricon (Colburn, Walter, and
Pfeiffer 2020). Many of these firms were financed by large investments by Fannie Mae, which
provided loans for these organizations (Goodman and Kaul 2017).
Pfeiffer, Schafran, and Wegmann (2020) show that 47 million US inhabitants now reside in such
units, more than the 19 million who live in two- to four-unit apartment buildings or the 42 million who
live in larger apartment structures. The people who live in such SFRs are uniquely vulnerable in some
ways. Families in SFRs often have children and live in poverty (Pfeiffer, Schafran, and Wegmann
2020). Plus, unlike in other types of apartment units, SFRs are rarely protected through federal means-
based rental supports. Although single-family homes account for 40 percent of the nation’s rentals,
they only account for 21 percent of those supported by federal housing programs (such as Housing
Choice Vouchers, which use means testing to ensure their users pay a maximum of only 30 percent of
income to rent). In other words, poor families in such homes may be more likely to be paying too much
for housing, and they may be more likely to face eviction because they are unable to pay rent.
In the process of reshaping the housing market, large investment firms have bought up homes
from distressed homeowners, literally reducing the homeownership rate as a business practice. They
took advantage of a large share of residents who technically own their homes but were mired in debt
(Haughwout, Peach, and Tracy 2010). These processes are shifting ownership away from
neighborhoods, creating a wealth suction that deprives low- and moderate-income people of the
ability to build wealth within their own communities (Shelton 2018a). Though much of the investment
has been made in fast-growing regions most affected by the foreclosure crisis (notably in the Sunbelt)
investors have also bought into housing markets in regions such as the Twin Cities, as we show in this
report.
The neighborhood and household-level consequences of these sorts of investments are important
concerns for communities worried that a shift from homeownership to rental could mean rising crime,
poorly maintained housing, and less civic engagement among locals (Ihlanfeldt and Yang 2020).
Scholars have investigated these issues with varying conclusions. From a positive perspective, SFRs
may offer moderate- and middle-income families the opportunity to live in larger, more comfortable
dwellings in a more diverse set of neighborhoods (Magder and Goodman 2015). Cohen and Harding
(2020) find that increased investor ownership of single-family homes is associated with a small
positive effect on the property values of surrounding residences. Mills, Molloy, and Zarutskie (2019),
too, emphasize that corporate investment in single-family homes has produced benefits, such as home
8 W H O O W N S T H E T W I N C I T I E S ?
renovations (eased by the economies of scale made possible by the investors’ large portfolios),
reduced neighborhood vacancies, and otherwise quicker community recovery from the housing crisis.
They also did not find an increase in rents resulting from these investments.
On the other hand, some consequences of corporate investment in SFRs are concerning. Large-scale
investment in certain neighborhoods has been shown to increase average area home prices, meaning
access to buying has become more difficult for potential family homeowners. At the same time, new
investors are more likely than other types of property owners to evict their renters (Mills, Molloy, and
Zarutskie 2019). The net consequence may be increased instability for both home-owning and renting
families with low incomes.
Even so, Ihlanfeldt and Yang (2020) find that a 1 percent increase in the share of single-family
units that are rentals in a neighborhood reduces surrounding house values 1.9 percent. They
disaggregate these effects by neighborhood, finding negative impacts were stronger in suburbs and
communities with higher population densities. This finding suggests that the rise of SFR investing
could be worsening the gaps in wealth between rich and poor areas of metropolitan areas.
In an in-depth study of residents of investor-owned SFRs in Southern California, Fields (2014)
finds that tenants rarely made contact with landlords (since most transactions were via electronic
means). Moreover, she finds that tenants suffered from poor management, higher rent increases, and
more evictions, particularly in low-income neighborhoods. This may be caused by investor
shareholders demanding extreme cost cuts in pursuit of additional revenue (Immergluck 2018). In her
examination of Atlanta, Fields (2014) finds that rents increased dramatically after the first year of
tenant occupancy. All in all, the data on the community impact of investor ownership is mixed, with
some studies finding positive outcomes and others suggesting negative results.
In this report, we seek to further explore how the racialized homeownership gap and the rise of
investment in SFRs manifest in communities. We use the example of the Twin Cities region, selected
because of its known large homeownership gap between Black and white families. We ask the
following: What are the neighborhood-by-neighborhood differences in the gap? Have those
neighborhood differences been magnified by broader trends related to gentrification and
displacement? What link is there between the homeownership gap and the rise in institutional
investment in SFRs? And do these trends point to potential strategies to relief the current pandemic-
related crisis?
Our report proceeds as follows. First, we describe the methods we used to investigate these
questions. Second, we show how homeownership patterns have changed over the past 20 years in the
W H O O W N S T H E T W I N C I T I E S ? 9
Twin Cities. Third, we investigate the rise of investor ownership of SFRs. Finally, we conclude by
identifying the implications of our findings and point to potential future research directions.
Methods
In this work, we engage in two general types of analysis: A review of demographic data to identify
trends in homeownership across neighborhoods, and a review of property data to evaluate the
presence of investors—particularly large corporate landlords—as a share of overall housing stock
owners. We focus on Hennepin and Ramsey Counties because of the ready availability of property-
level data and the fact that these represent both central city (Minneapolis and St. Paul) and suburban
conditions. These two counties represented 49.9 percent of the overall population of the
Minneapolis–St. Paul–Bloomington, Minnesota-Wisconsin metropolitan area as of 2019.
For the first element of the analysis, we compile data from the US Census Bureau between 2000
and 2018 for all census tracts within Hennepin and Ramsey Counties (using decennial data for 2000
and 2010 and American Community Survey data for 2014 to 2018). The data incorporate information
about household incomes, the race and ethnicity of each head of household, and the share of
households by tenure (renting or owning). This data collection allows us to identify patterns of
homeownership across different neighborhoods. In this analysis we rely on 2018 tracts, reclassifying
2000 and 2010 tracts as appropriate to ensure geographical consistency in tract definitions over time.
We also leverage a classification system developed by the Institute on Metropolitan Opportunity
(2019) to evaluate whether trends in changes in homeownership are occurring in neighborhoods
experiencing abandonment, displacement, growth, or the concentration of low-income families.
Next, we analyze parcel-level property assessment data extracts from 2005, 2010, 2015, and
2020 in both Hennepin and Ramsey Counties (and sourced from both jurisdictions) to understand
variations in the rise of investor landlords in SFR ownership. For this study, we define and identify an
investor landlord as any property owner with identifying information in property or taxpayer records
linking it to LLC or corporate ownership, and with at least three single-family residential units in its
ownership.
Anonymous shell companies have historically been able withhold information on the individuals
who control and profit from these LLCs, which has made analyses attempting to understand the
landscape of landlords notoriously difficult. Our corporate landlord measure includes local small-scale
landlords who formed LLCs, because this broad definition manages to capture the LLC offshoots
1 0 W H O O W N S T H E T W I N C I T I E S ?
meant to obscure ownership, but it does not include landlords with one or two single-family homes
that they are renting out. Although a recent California bill would collect and make this ownership
information publicly available,5 currently, the landlords, investors, and shell companies that own the
approximate 18 million SFR units nationwide can largely go unnamed.
To help uncover ownership patterns, we use assessor data. We created a series of variables in
partnership with the University of Minnesota Center for Urban and Regional Affairs to identify
whether a parcel was purchased by large-scale investors and to better understand the potential threat
of wealth transfer from individual Hennepin and Ramsey County residents to other communities. Our
team used a combination of land-use codes, homestead exemptions, and text mining on parcel
ownership and taxpayer fields to create approximated classifications of a parcel’s tenure, ownership,
and relative owner location. We made the following assumptions:
▪ Tenure: Because of the lack of reliable data on a parcel’s tenure status, or whether it was
owned or a rented over time, we created a tenure proxy variable. A parcel was deemed a
rental if it was (1) in an area with a residential land-use designation and (2) not homesteaded
(a tax exemption for owners who live on the property).6
▪ Ownership classification: We used land-use codes and tax exemptions (and conducted text
mining on fields with identifying information such as owner and taxpayer names and
addresses) to create different ownership categories. These include flags for parcels owned by
LLCs, corporations, cooperatives, private educational institutions, nonprofits, utilities, and the
public.
▪ Owner location: A property’s taxpayer address was used as a proxy variable to determine
where an owner was located. We used a combination of geocoding the taxpayer address and
additional text analysis to create designations that determined whether a parcel (1) was owner
occupied or (2) had an owner in the same zip code, within the seven-county metro region, or
outside of the seven-county metro region.
▪ Number of units per owner: We chose to limit investor ownership to just those owners with
at least three single-family residential properties. To conduct this analysis, we used a
combination of clustering, fuzzy matching, and manual cleaning to group parcels with taxpayer
addresses or clean owner names and identify which SFRs were owned by investors with at
least three SFR properties in their portfolios. This minimum property ownership threshold was
designed to exclude small-scale landlords who may have created an LLC for one or two rental
properties. This also excluded owners who may have moved to a new address but kept their
old home for rent instead of selling it to another homebuyer. Investors with at least three
properties were operating the SFRs as a business at scale.
W H O O W N S T H E T W I N C I T I E S ? 1 1
After data cleaning, we compared the two datasets, evaluating our findings about large-scale
property ownership within the context of what we found related to neighborhood trends, such as in
terms of neighborhoods experiencing displacement or low-income concentration.
Throughout our analysis process, we engaged with local stakeholders, including the Alliance, the
Family Housing Fund, and the Center for Economic Inclusion, to ensure the particularities of the Twin
Cities region were being appropriately explored and understood.
Our analysis is limited to Hennepin and Ramsey Counties and thus should not be interpreted as
generalizable to other parts of the Twin Cities, Minnesota, or the nation. It is limited in that it relies on
a series of proxy variables to assess corporate ownership, which means we may not be accurately
measuring these data. Moreover, our data are limited to publicly available information provided by the
US Census Bureau and county assessors; a more detailed analysis incorporating privately available
data might produce somewhat different results.
Homeownership Patterns Show Growing Gaps between
Households Based on Race
In this first section, we explore patterns of homeownership by race in Hennepin and Ramsey Counties.
Our findings, similar to the national trends and in concordance with established facts about the Twin
Cities region’s homeownership gaps, are that the difference in access to wealth building through
homeownership between Black and white families is large and growing. Our new analysis adds that
this growth in the homeownership gap is occurring in variegated, uneven ways: some neighborhoods
are actually experiencing a decline in the gap over time. We also compare our findings related to
homeownership with data related to neighborhood change.
Overall Ownership Trends
Since 2000, the trends in the two counties demonstrate a continued high level of homeownership
among white households, a low level among Black households, and a moderate level among Latinx
households. As shown in figure 1, since 2000, the white-household homeownership rate has remained
relatively constant at around 70 percent. This rate increased somewhat in the 2000s and declined
somewhat in the 2010s, but the stability over that period is remarkable.
1 2 W H O O W N S T H E T W I N C I T I E S ?
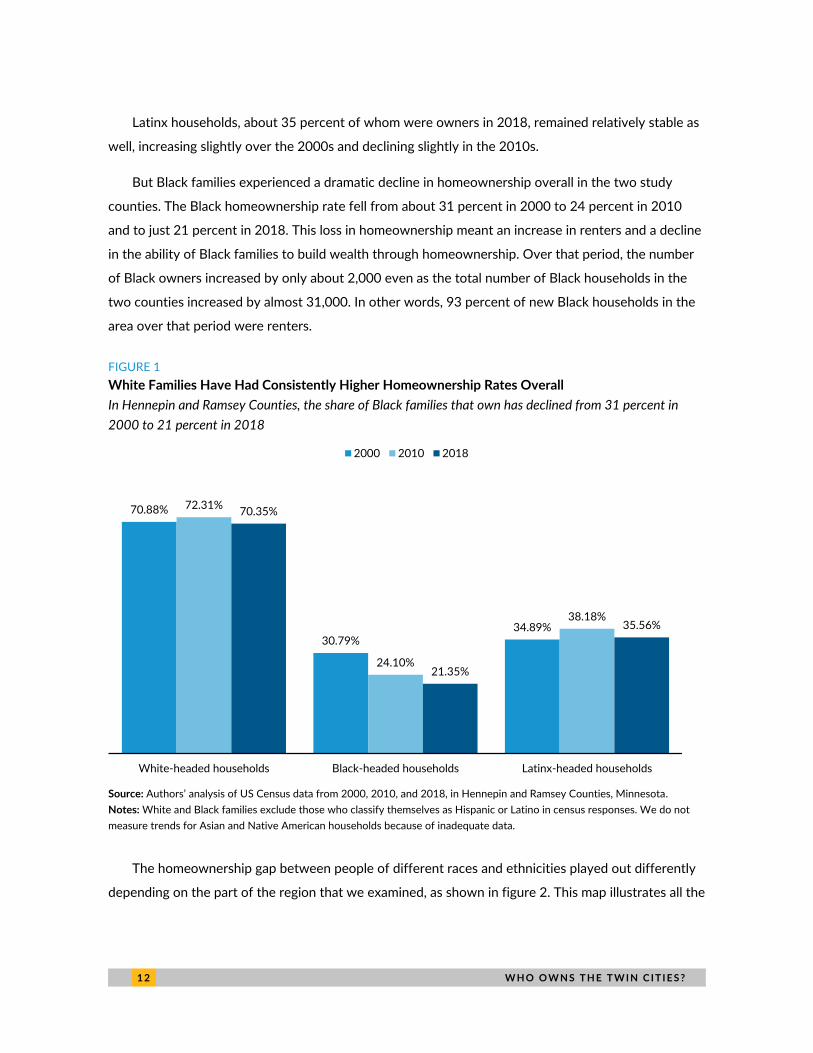
Latinx households, about 35 percent of whom were owners in 2018, remained relatively stable as
well, increasing slightly over the 2000s and declining slightly in the 2010s.
But Black families experienced a dramatic decline in homeownership overall in the two study
counties. The Black homeownership rate fell from about 31 percent in 2000 to 24 percent in 2010
and to just 21 percent in 2018. This loss in homeownership meant an increase in renters and a decline
in the ability of Black families to build wealth through homeownership. Over that period, the number
of Black owners increased by only about 2,000 even as the total number of Black households in the
two counties increased by almost 31,000. In other words, 93 percent of new Black households in the
area over that period were renters.
FIGURE 1
White Families Have Had Consistently Higher Homeownership Rates Overall
In Hennepin and Ramsey Counties, the share of Black families that own has declined from 31 percent in
2000 to 21 percent in 2018
Source: Authors’ analysis of US Census data from 2000, 2010, and 2018, in Hennepin and Ramsey Counties, Minnesota.
Notes: White and Black families exclude those who classify themselves as Hispanic or Latino in census responses. We do not
measure trends for Asian and Native American households because of inadequate data.
The homeownership gap between people of different races and ethnicities played out differently
depending on the part of the region that we examined, as shown in figure 2. This map illustrates all the
70.88%
30.79%34.89%
72.31%
24.10%
38.18%
70.35%
21.35%
35.56%
White-headed households Black-headed households Latinx-headed households
2000 2010 2018
W H O O W N S T H E T W I N C I T I E S ? 1 3
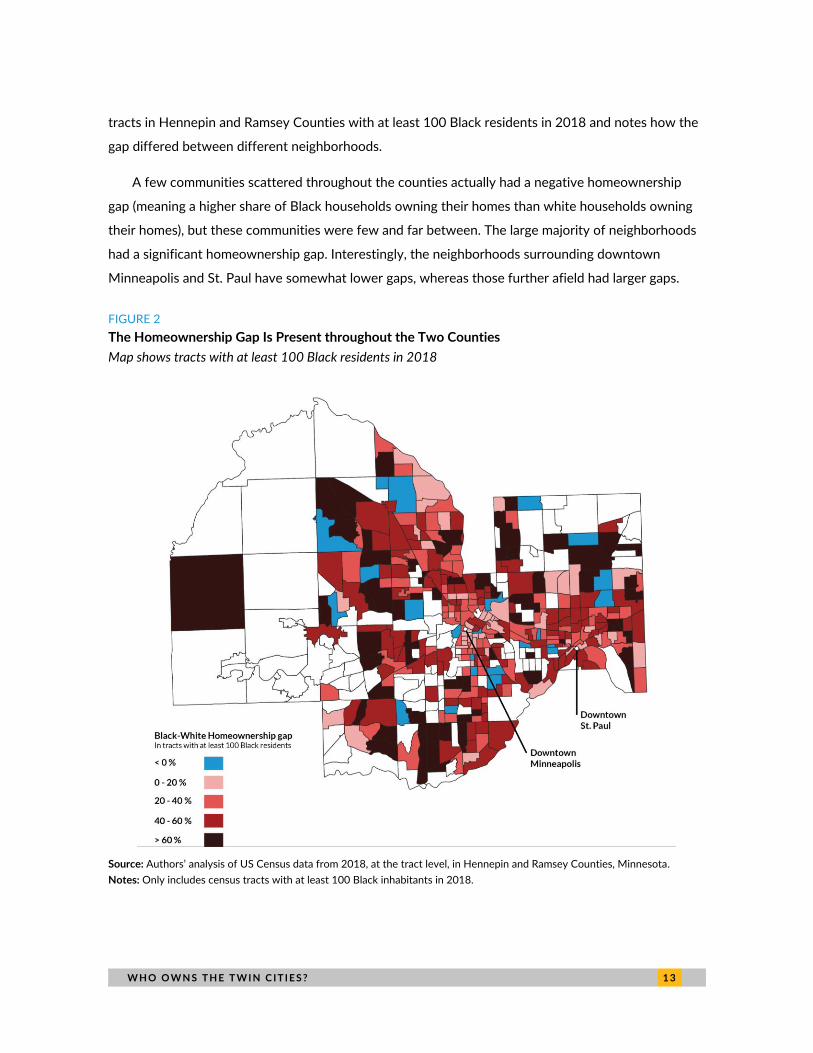
tracts in Hennepin and Ramsey Counties with at least 100 Black residents in 2018 and notes how the
gap differed between different neighborhoods.
A few communities scattered throughout the counties actually had a negative homeownership
gap (meaning a higher share of Black households owning their homes than white households owning
their homes), but these communities were few and far between. The large majority of neighborhoods
had a significant homeownership gap. Interestingly, the neighborhoods surrounding downtown
Minneapolis and St. Paul have somewhat lower gaps, whereas those further afield had larger gaps.
FIGURE 2
The Homeownership Gap Is Present throughout the Two Counties
Map shows tracts with at least 100 Black residents in 2018
Source: Authors’ analysis of US Census data from 2018, at the tract level, in Hennepin and Ramsey Counties, Minnesota.
Notes: Only includes census tracts with at least 100 Black inhabitants in 2018.
1 4 W H O O W N S T H E T W I N C I T I E S ?
Comparing Change Based on Neighborhood Type
How do these trends differ based on the demographic composition of affected neighborhoods? We
compared the homeownership gaps by race and ethnicity in 2000, 2010, and 2018 in neighborhoods
based on whether the neighborhoods were majority white people or majority people of color.
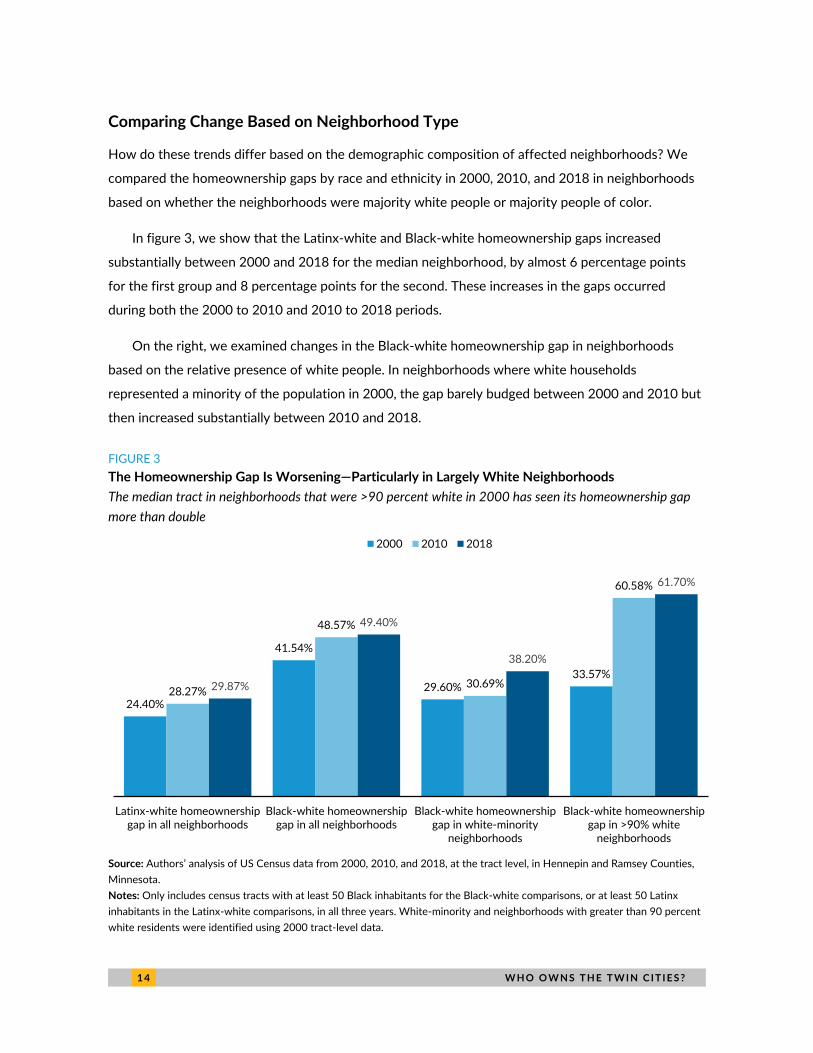
In figure 3, we show that the Latinx-white and Black-white homeownership gaps increased
substantially between 2000 and 2018 for the median neighborhood, by almost 6 percentage points
for the first group and 8 percentage points for the second. These increases in the gaps occurred
during both the 2000 to 2010 and 2010 to 2018 periods.
On the right, we examined changes in the Black-white homeownership gap in neighborhoods
based on the relative presence of white people. In neighborhoods where white households
represented a minority of the population in 2000, the gap barely budged between 2000 and 2010 but
then increased substantially between 2010 and 2018.
FIGURE 3
The Homeownership Gap Is Worsening—Particularly in Largely White Neighborhoods
The median tract in neighborhoods that were >90 percent white in 2000 has seen its homeownership gap
more than double
Source: Authors’ analysis of US Census data from 2000, 2010, and 2018, at the tract level, in Hennepin and Ramsey Counties,
Minnesota.
Notes: Only includes census tracts with at least 50 Black inhabitants for the Black-white comparisons, or at least 50 Latinx
inhabitants in the Latinx-white comparisons, in all three years. White-minority and neighborhoods with greater than 90 percent
white residents were identified using 2000 tract-level data.
24.40%
41.54%
29.60%33.57%
28.27%
48.57%
30.69%
60.58%
29.87%
49.40%
38.20%
61.70%
Latinx-white homeownershipgap in all neighborhoods
Black-white homeownershipgap in all neighborhoods
Black-white homeownershipgap in white-minority
neighborhoods
Black-white homeownershipgap in >90% white
neighborhoods
2000 2010 2018
W H O O W N S T H E T W I N C I T I E S ? 1 5
In neighborhoods where white people were the large majority in 2000 (over 90 percent of the
population), the gap grew massively between 2000 and 2010. These neighborhoods (defined at the
tract level) had a population of about 275,000 in 2000; they grew to 295,000 in 2018. Indeed, these
majority-white neighborhoods were the communities where the divergence in access to homeownership
by race was most dramatic. At the same time, these neighborhoods experienced some integration over
that period, increasing from about 2 percent Black in 2000 to 5.3 percent in 2018 on average. That
integration occurred through a rise in rental units that attracted a more diverse group of residents.
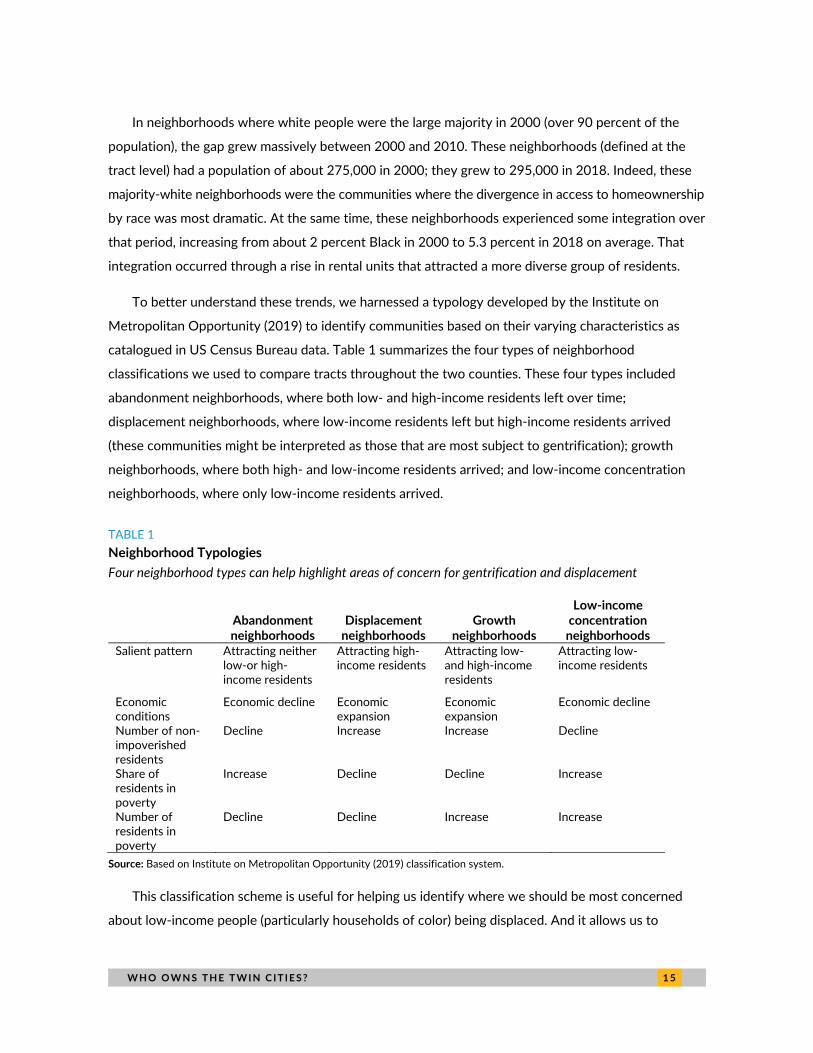
To better understand these trends, we harnessed a typology developed by the Institute on
Metropolitan Opportunity (2019) to identify communities based on their varying characteristics as
catalogued in US Census Bureau data. Table 1 summarizes the four types of neighborhood
classifications we used to compare tracts throughout the two counties. These four types included
abandonment neighborhoods, where both low- and high-income residents left over time;
displacement neighborhoods, where low-income residents left but high-income residents arrived
(these communities might be interpreted as those that are most subject to gentrification); growth
neighborhoods, where both high- and low-income residents arrived; and low-income concentration
neighborhoods, where only low-income residents arrived.
TABLE 1
Neighborhood Typologies
Four neighborhood types can help highlight areas of concern for gentrification and displacement
Abandonment neighborhoods
Displacement neighborhoods
Growth neighborhoods
Low-income concentration neighborhoods
Salient pattern Attracting neither low-or high-income residents
Attracting high-income residents
Attracting low- and high-income residents
Attracting low-income residents
Economic conditions
Economic decline Economic expansion
Economic expansion
Economic decline
Number of non-impoverished residents
Decline Increase Increase Decline
Share of residents in poverty
Increase Decline Decline Increase
Number of residents in poverty
Decline Decline Increase Increase
Source: Based on Institute on Metropolitan Opportunity (2019) classification system.
This classification scheme is useful for helping us identify where we should be most concerned
about low-income people (particularly households of color) being displaced. And it allows us to
1 6 W H O O W N S T H E T W I N C I T I E S ?
consider whether changes in homeownership are related to overall trends of displacement and
gentrification.
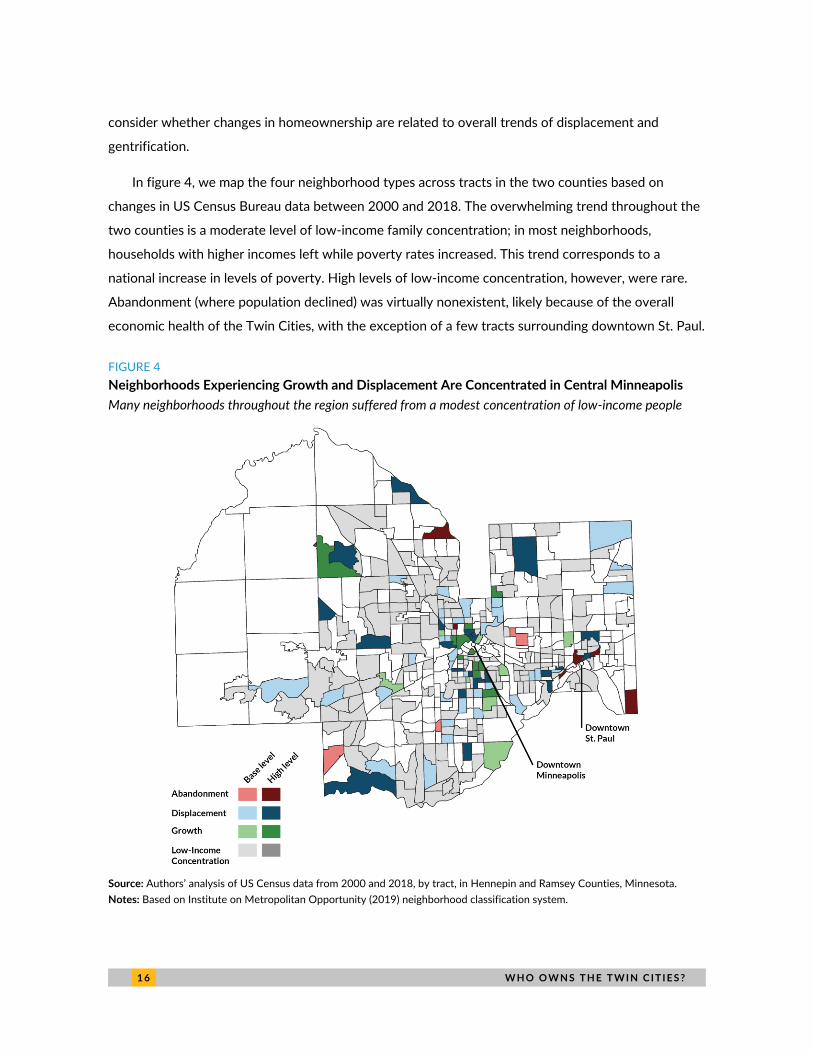
In figure 4, we map the four neighborhood types across tracts in the two counties based on
changes in US Census Bureau data between 2000 and 2018. The overwhelming trend throughout the
two counties is a moderate level of low-income family concentration; in most neighborhoods,
households with higher incomes left while poverty rates increased. This trend corresponds to a
national increase in levels of poverty. High levels of low-income concentration, however, were rare.
Abandonment (where population declined) was virtually nonexistent, likely because of the overall
economic health of the Twin Cities, with the exception of a few tracts surrounding downtown St. Paul.
FIGURE 4
Neighborhoods Experiencing Growth and Displacement Are Concentrated in Central Minneapolis
Many neighborhoods throughout the region suffered from a modest concentration of low-income people
Source: Authors’ analysis of US Census data from 2000 and 2018, by tract, in Hennepin and Ramsey Counties, Minnesota.
Notes: Based on Institute on Metropolitan Opportunity (2019) neighborhood classification system.
W H O O W N S T H E T W I N C I T I E S ? 1 7
The map also allows us to identify areas of growth and displacement. From that perspective,
central Minneapolis and the corridor southeast of downtown (along the Blue/Hiawatha light rail line)
stand out. Those communities featured many tracts that experienced high levels of and displacement.
These findings suggest that these communities are those that most threaten the ability of low-income
households of color to remain in place over time.
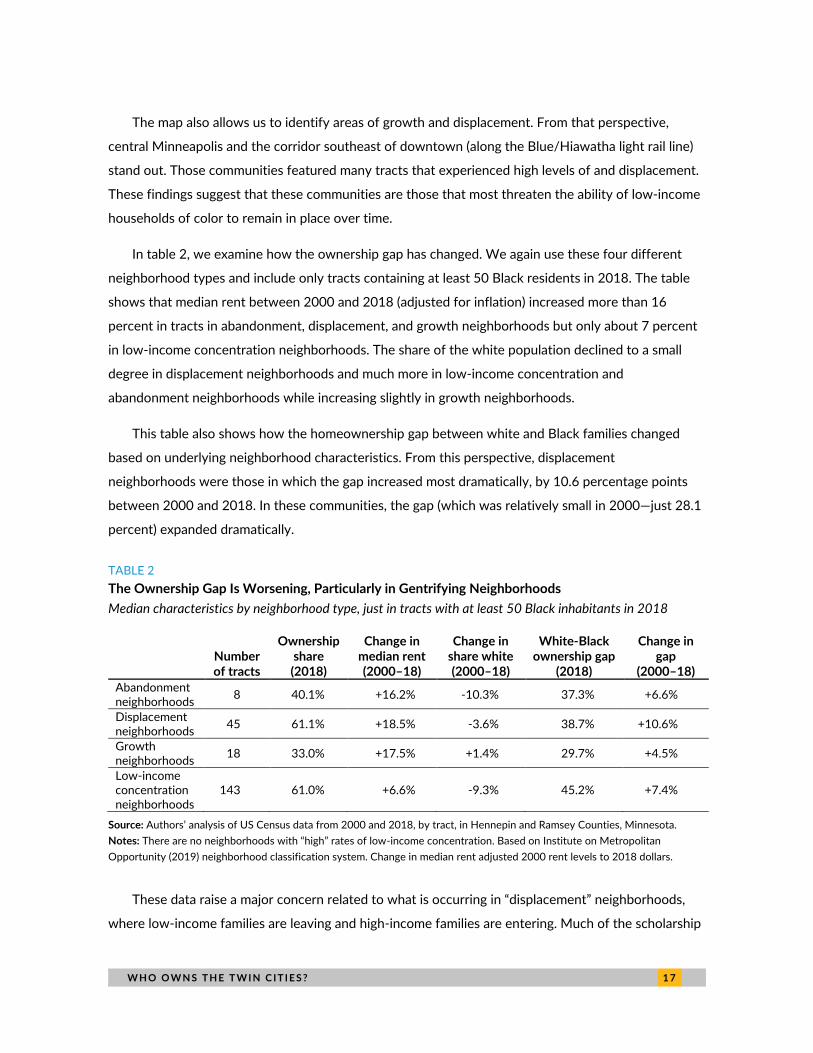
In table 2, we examine how the ownership gap has changed. We again use these four different
neighborhood types and include only tracts containing at least 50 Black residents in 2018. The table
shows that median rent between 2000 and 2018 (adjusted for inflation) increased more than 16
percent in tracts in abandonment, displacement, and growth neighborhoods but only about 7 percent
in low-income concentration neighborhoods. The share of the white population declined to a small
degree in displacement neighborhoods and much more in low-income concentration and
abandonment neighborhoods while increasing slightly in growth neighborhoods.
This table also shows how the homeownership gap between white and Black families changed
based on underlying neighborhood characteristics. From this perspective, displacement
neighborhoods were those in which the gap increased most dramatically, by 10.6 percentage points
between 2000 and 2018. In these communities, the gap (which was relatively small in 2000—just 28.1
percent) expanded dramatically.
TABLE 2
The Ownership Gap Is Worsening, Particularly in Gentrifying Neighborhoods
Median characteristics by neighborhood type, just in tracts with at least 50 Black inhabitants in 2018
Number of tracts
Ownership share (2018)
Change in median rent (2000–18)
Change in share white (2000–18)
White-Black ownership gap
(2018)
Change in gap
(2000–18)
Abandonment neighborhoods
8 40.1% +16.2% -10.3% 37.3% +6.6%
Displacement neighborhoods
45 61.1% +18.5% -3.6% 38.7% +10.6%
Growth neighborhoods
18 33.0% +17.5% +1.4% 29.7% +4.5%
Low-income concentration neighborhoods
143 61.0% +6.6% -9.3% 45.2% +7.4%
Source: Authors’ analysis of US Census data from 2000 and 2018, by tract, in Hennepin and Ramsey Counties, Minnesota.
Notes: There are no neighborhoods with “high” rates of low-income concentration. Based on Institute on Metropolitan
Opportunity (2019) neighborhood classification system. Change in median rent adjusted 2000 rent levels to 2018 dollars.
These data raise a major concern related to what is occurring in “displacement” neighborhoods,
where low-income families are leaving and high-income families are entering. Much of the scholarship
1 8 W H O O W N S T H E T W I N C I T I E S ?
on displacement has indicated that a major concern is that renter households are being displaced: with
the arrival of higher-income families, they face higher rents or their properties are sold to homeowners.
Yet these data tell another component of this story. They show that we should be concerned not
only by the displacement of renters but also by the displacement of homeowners of color in these
communities. In places where gentrification and displacement are occurring, the share of Black
households who own their homes declined. Indeed, in those neighborhoods, between 2000 and 2018,
the number of Black owners declined too, by more than 600—a 23 percent fall (despite a large increase
in Black inhabitants across the region). As such, homeownership was being replaced by tenancy, and
homeownership alone was not enough to ensure that families of color could remain in place over time.
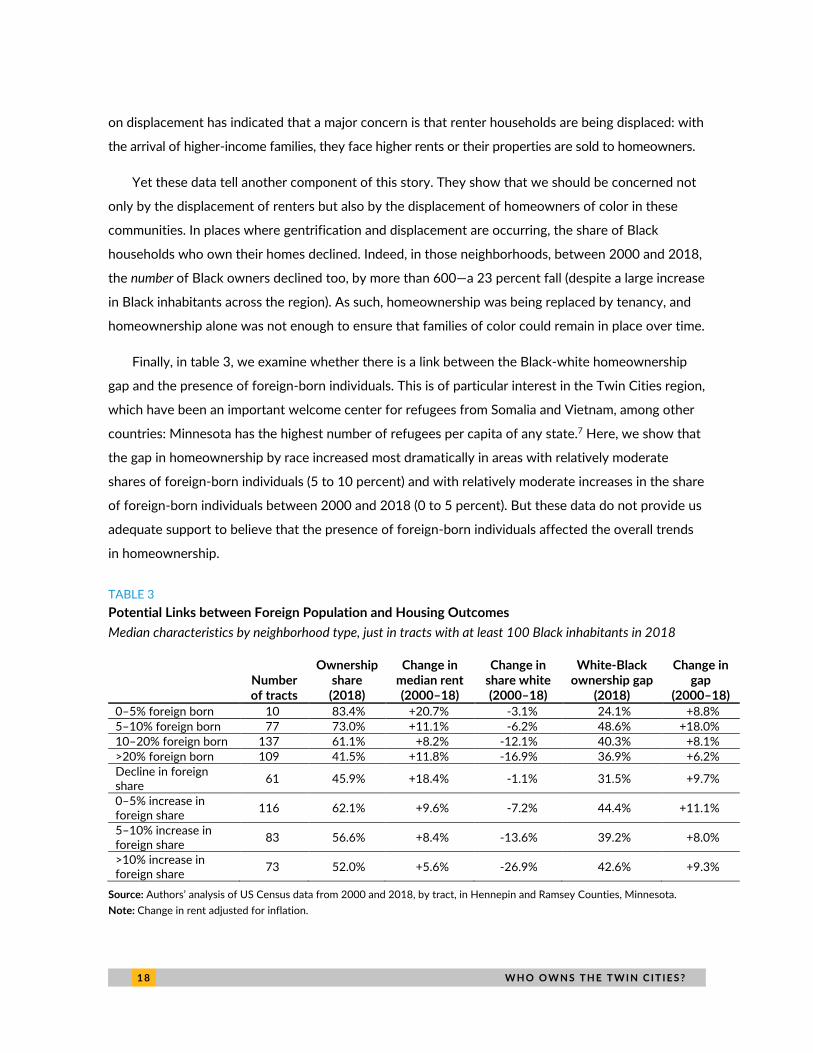
Finally, in table 3, we examine whether there is a link between the Black-white homeownership
gap and the presence of foreign-born individuals. This is of particular interest in the Twin Cities region,
which have been an important welcome center for refugees from Somalia and Vietnam, among other
countries: Minnesota has the highest number of refugees per capita of any state.7 Here, we show that
the gap in homeownership by race increased most dramatically in areas with relatively moderate
shares of foreign-born individuals (5 to 10 percent) and with relatively moderate increases in the share
of foreign-born individuals between 2000 and 2018 (0 to 5 percent). But these data do not provide us
adequate support to believe that the presence of foreign-born individuals affected the overall trends
in homeownership.
TABLE 3
Potential Links between Foreign Population and Housing Outcomes
Median characteristics by neighborhood type, just in tracts with at least 100 Black inhabitants in 2018
Number of tracts
Ownership share (2018)
Change in median rent (2000–18)
Change in share white (2000–18)
White-Black ownership gap
(2018)
Change in gap
(2000–18)
0–5% foreign born 10 83.4% +20.7% -3.1% 24.1% +8.8%
5–10% foreign born 77 73.0% +11.1% -6.2% 48.6% +18.0%
10–20% foreign born 137 61.1% +8.2% -12.1% 40.3% +8.1%
>20% foreign born 109 41.5% +11.8% -16.9% 36.9% +6.2%
Decline in foreign share
61 45.9% +18.4% -1.1% 31.5% +9.7%
0–5% increase in foreign share
116 62.1% +9.6% -7.2% 44.4% +11.1%
5–10% increase in foreign share
83 56.6% +8.4% -13.6% 39.2% +8.0%
>10% increase in foreign share
73 52.0% +5.6% -26.9% 42.6% +9.3%
Source: Authors’ analysis of US Census data from 2000 and 2018, by tract, in Hennepin and Ramsey Counties, Minnesota.
Note: Change in rent adjusted for inflation.
W H O O W N S T H E T W I N C I T I E S ? 1 9
To further explore these data, we ran a series of regressions to try to identify the impact of
different local characteristics on the presence of or increase in the white-Black homeownership gap.
We considered population density, the share of the population that is white, household incomes, rent
levels, and more. In this analysis, we found little to support any specific explanation, though we found
that the gap was somewhat lower in neighborhoods with higher levels of population density, once
controlling for other neighborhood characteristics.
When we conducted a series of regressions on the change in the white-Black homeownership gap
over time, we similarly found little clear explanation for why some neighborhoods but not others saw
increases in the gap. The one variable that stood out was the share of households that owned in 2018.
In areas with higher levels of homeownership overall, the white-Black homeownership gap increased
to a statistically significant degree from 2000 to 2018.
The Rise of the Investor Landlord in the Twin Cities
Metropolitan Region
In the previous sections, we explored the manner by which patterns of homeownership have changed
over time in Hennepin and Ramsey Counties. These findings show that the large Black-white
homeownership gap in the Twin Cities is growing and that changes in the gap vary based on the
neighborhoods impacted. Specifically, communities experiencing gentrification and displacement are
also those in which Black homeownership appears to be particularly threatened.
Although some theories point to the preferences and policies that drive individual actors (particularly
high-income white residents) to buy homes in gentrifying neighborhoods, our research also highlights
the role of rental property investors in exacerbating lost homeownership and wealth opportunities for
BIPOC residents in the Twin Cities. Large-scale corporate investors, in particular, have purchased
homes from vulnerable owners potentially facing foreclosure. This process may lead to homeowners
either becoming renters in their neighborhoods (potentially in their previously owned home) or simply
moving elsewhere.
In this section, we analyze parcel-level data in Hennepin and Ramsey Counties to explore how
ownership patterns have changed over the period from 2005 to 2020. We find that single-family
homes in the two counties are increasingly being rented out (rather than owned) and that the owners
of those single-family homes are increasingly corporate or LLC investors located outside of the Twin
Cities region.
2 0 W H O O W N S T H E T W I N C I T I E S ?
Increasing LLC Ownership of Rental Properties over the Past Two Decades
We examined all of the parcels dedicated for residential use in Hennepin and Ramsey Counties, with
the goal of identifying the presence of investors and the tenure of properties (rental or ownership).
This examination was in the context of an overall decline in homeownership that occurred between
2000 and 2018 in the Twin Cities as well as nationwide.
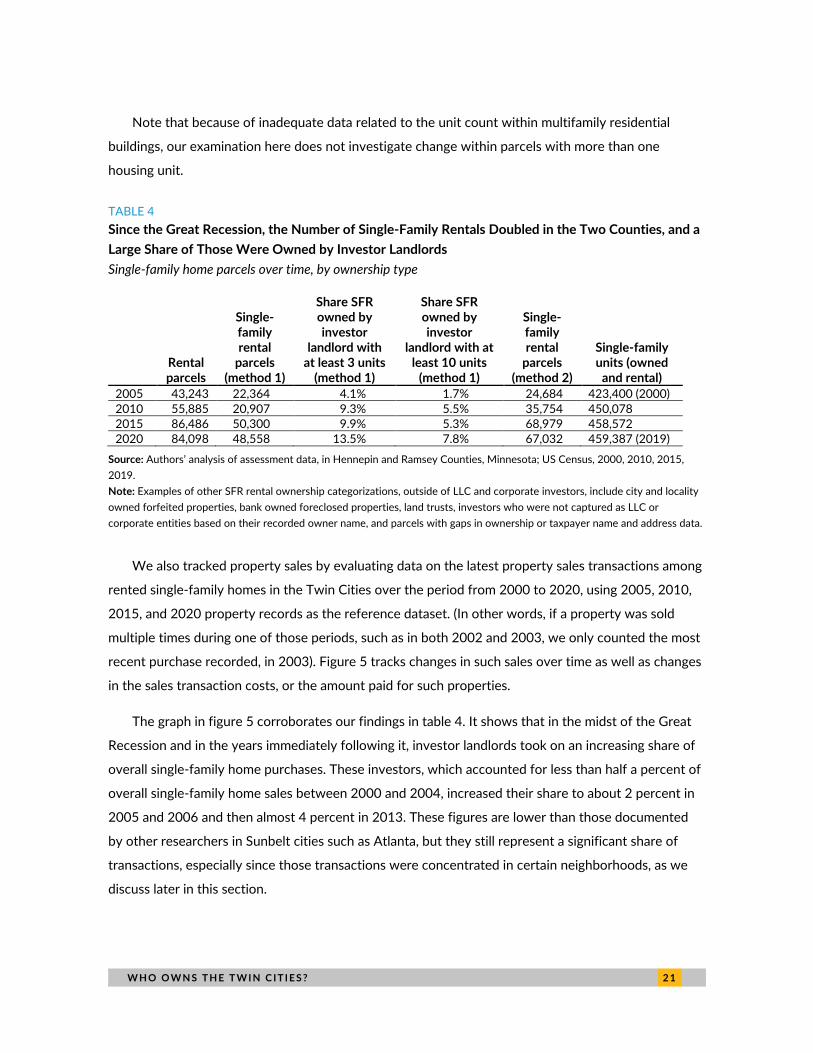
In table 4, we explore the key characteristics of rental properties throughout the two counties.
Between 2005 and 2020, the number of parcels that we estimate were dedicated to renting rather
than owning roughly doubled, from 43,000 to 84,000. Among these rental parcels, the number that
were made up of single-family homes increased more dramatically comparatively. Because of
limitations on data quality, we calculated single-family parcels using two methods. The first, more
conservative method shows an increase from 22,000 to 49,000 units between 2005 and 2020; the
second, less conservative method shows an increase from 25,000 to 67,000. The former method
matches Census Bureau statistics closely, so we use that method throughout the rest of this report.8
Either way, the number of single-family homes being rented out rather than owned by homeowners
increased dramatically over the past two decades, and their share of the overall rental market also
expanded.
We also estimated the share of SFRs that were owned by investor landlords, again according to
the more conservative method noted previously. We find a major increase in investor ownership over
time, from about 4 percent of SFRs in 2005 to 14 percent in 2020 at the same time as the overall
number of SFRs increased. Among larger investors, those with at least 10 units increased their share
from 2 to 8 percent. The remainder of the SFR units were likely owned by owners with only one or
two units in their portfolios. Our approach may be underestimating the share owned by large property
investors, though, because such owners may have been operating under various shell corporations or
tax addresses that we may not have identified as a single owner of multiple parcels in our calculations.
In total, the number of SFR units more than doubled, even as the stock of single-family homes in
the two counties increased by only 8.5 percent from 2000 to 2019; rental units increased their share
of all single-family homes from about 5 percent in 2005 to at least 10 percent in 2020. This increase
was primarily a reflection of tenure change rather than of new construction of homes designed to be
rented from the outset. This indicates that (as we might expect given national trends) housing
property ownership in the Twin Cities, too, is increasingly dominated by investor landlords.
W H O O W N S T H E T W I N C I T I E S ? 2 1
Note that because of inadequate data related to the unit count within multifamily residential
buildings, our examination here does not investigate change within parcels with more than one
housing unit.
TABLE 4
Since the Great Recession, the Number of Single-Family Rentals Doubled in the Two Counties, and a
Large Share of Those Were Owned by Investor Landlords
Single-family home parcels over time, by ownership type
Rental parcels
Single-family rental
parcels (method 1)
Share SFR owned by investor
landlord with at least 3 units
(method 1)
Share SFR owned by investor
landlord with at least 10 units
(method 1)
Single-family rental
parcels (method 2)
Single-family units (owned
and rental)
2005 43,243 22,364 4.1% 1.7% 24,684 423,400 (2000)
2010 55,885 20,907 9.3% 5.5% 35,754 450,078
2015 86,486 50,300 9.9% 5.3% 68,979 458,572
2020 84,098 48,558 13.5% 7.8% 67,032 459,387 (2019)
Source: Authors’ analysis of assessment data, in Hennepin and Ramsey Counties, Minnesota; US Census, 2000, 2010, 2015,
2019.
Note: Examples of other SFR rental ownership categorizations, outside of LLC and corporate investors, include city and locality
owned forfeited properties, bank owned foreclosed properties, land trusts, investors who were not captured as LLC or
corporate entities based on their recorded owner name, and parcels with gaps in ownership or taxpayer name and address data.
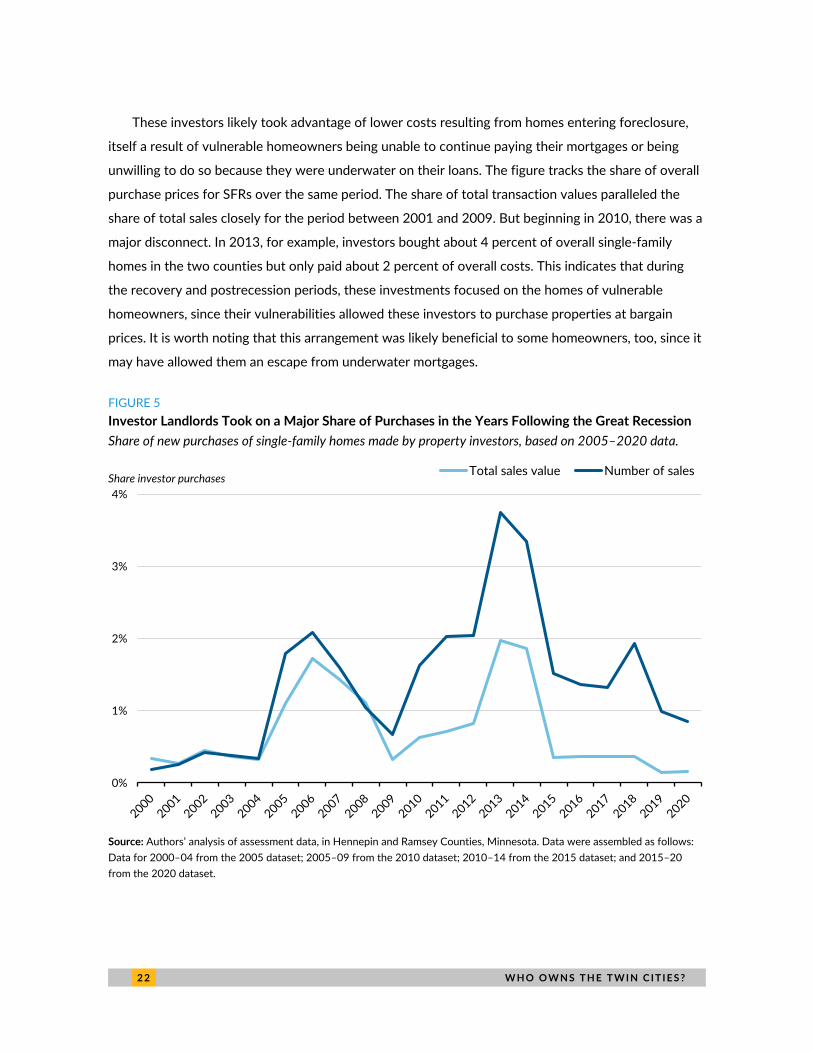
We also tracked property sales by evaluating data on the latest property sales transactions among
rented single-family homes in the Twin Cities over the period from 2000 to 2020, using 2005, 2010,
2015, and 2020 property records as the reference dataset. (In other words, if a property was sold
multiple times during one of those periods, such as in both 2002 and 2003, we only counted the most
recent purchase recorded, in 2003). Figure 5 tracks changes in such sales over time as well as changes
in the sales transaction costs, or the amount paid for such properties.
The graph in figure 5 corroborates our findings in table 4. It shows that in the midst of the Great
Recession and in the years immediately following it, investor landlords took on an increasing share of
overall single-family home purchases. These investors, which accounted for less than half a percent of
overall single-family home sales between 2000 and 2004, increased their share to about 2 percent in
2005 and 2006 and then almost 4 percent in 2013. These figures are lower than those documented
by other researchers in Sunbelt cities such as Atlanta, but they still represent a significant share of
transactions, especially since those transactions were concentrated in certain neighborhoods, as we
discuss later in this section.
2 2 W H O O W N S T H E T W I N C I T I E S ?
These investors likely took advantage of lower costs resulting from homes entering foreclosure,
itself a result of vulnerable homeowners being unable to continue paying their mortgages or being
unwilling to do so because they were underwater on their loans. The figure tracks the share of overall
purchase prices for SFRs over the same period. The share of total transaction values paralleled the
share of total sales closely for the period between 2001 and 2009. But beginning in 2010, there was a
major disconnect. In 2013, for example, investors bought about 4 percent of overall single-family
homes in the two counties but only paid about 2 percent of overall costs. This indicates that during
the recovery and postrecession periods, these investments focused on the homes of vulnerable
homeowners, since their vulnerabilities allowed these investors to purchase properties at bargain
prices. It is worth noting that this arrangement was likely beneficial to some homeowners, too, since it
may have allowed them an escape from underwater mortgages.
FIGURE 5
Investor Landlords Took on a Major Share of Purchases in the Years Following the Great Recession
Share of new purchases of single-family homes made by property investors, based on 2005–2020 data.
Source: Authors’ analysis of assessment data, in Hennepin and Ramsey Counties, Minnesota. Data were assembled as follows:
Data for 2000–04 from the 2005 dataset; 2005–09 from the 2010 dataset; 2010–14 from the 2015 dataset; and 2015–20
from the 2020 dataset.
0%
1%
2%
3%
4%
Total sales value Number of salesShare investor purchases
W H O O W N S T H E T W I N C I T I E S ? 2 3
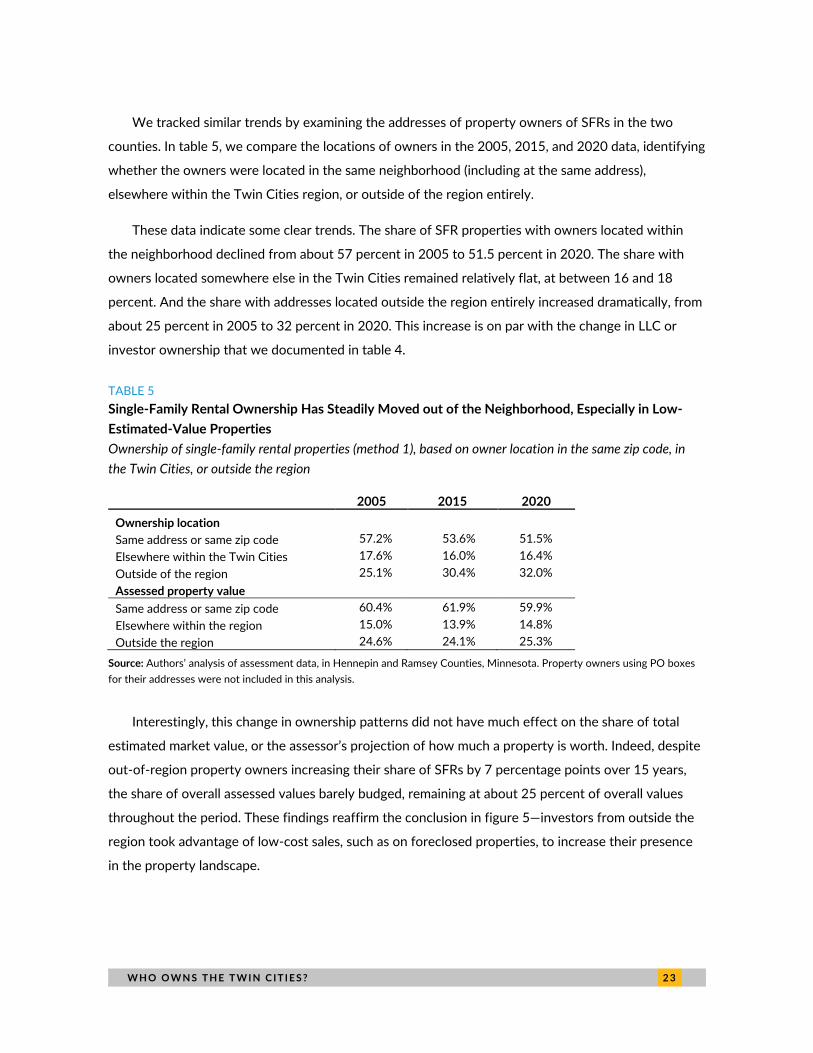
We tracked similar trends by examining the addresses of property owners of SFRs in the two
counties. In table 5, we compare the locations of owners in the 2005, 2015, and 2020 data, identifying
whether the owners were located in the same neighborhood (including at the same address),
elsewhere within the Twin Cities region, or outside of the region entirely.
These data indicate some clear trends. The share of SFR properties with owners located within
the neighborhood declined from about 57 percent in 2005 to 51.5 percent in 2020. The share with
owners located somewhere else in the Twin Cities remained relatively flat, at between 16 and 18
percent. And the share with addresses located outside the region entirely increased dramatically, from
about 25 percent in 2005 to 32 percent in 2020. This increase is on par with the change in LLC or
investor ownership that we documented in table 4.
TABLE 5
Single-Family Rental Ownership Has Steadily Moved out of the Neighborhood, Especially in Low-
Estimated-Value Properties
Ownership of single-family rental properties (method 1), based on owner location in the same zip code, in
the Twin Cities, or outside the region
2005 2015 2020
Ownership location
Same address or same zip code 57.2% 53.6% 51.5%
Elsewhere within the Twin Cities 17.6% 16.0% 16.4%
Outside of the region 25.1% 30.4% 32.0%
Assessed property value
Same address or same zip code 60.4% 61.9% 59.9%
Elsewhere within the region 15.0% 13.9% 14.8%
Outside the region 24.6% 24.1% 25.3%
Source: Authors’ analysis of assessment data, in Hennepin and Ramsey Counties, Minnesota. Property owners using PO boxes
for their addresses were not included in this analysis.
Interestingly, this change in ownership patterns did not have much effect on the share of total
estimated market value, or the assessor’s projection of how much a property is worth. Indeed, despite
out-of-region property owners increasing their share of SFRs by 7 percentage points over 15 years,
the share of overall assessed values barely budged, remaining at about 25 percent of overall values
throughout the period. These findings reaffirm the conclusion in figure 5—investors from outside the
region took advantage of low-cost sales, such as on foreclosed properties, to increase their presence
in the property landscape.
2 4 W H O O W N S T H E T W I N C I T I E S ?
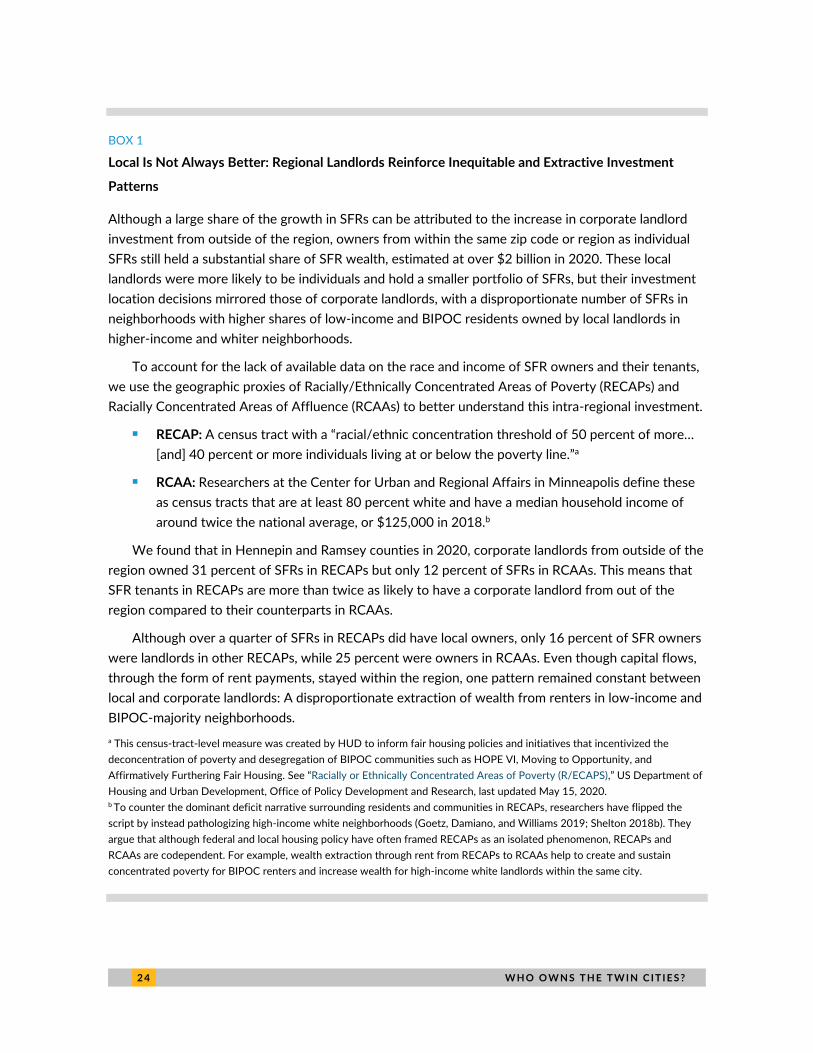
BOX 1
Local Is Not Always Better: Regional Landlords Reinforce Inequitable and Extractive Investment
Patterns
Although a large share of the growth in SFRs can be attributed to the increase in corporate landlord
investment from outside of the region, owners from within the same zip code or region as individual
SFRs still held a substantial share of SFR wealth, estimated at over $2 billion in 2020. These local
landlords were more likely to be individuals and hold a smaller portfolio of SFRs, but their investment
location decisions mirrored those of corporate landlords, with a disproportionate number of SFRs in
neighborhoods with higher shares of low-income and BIPOC residents owned by local landlords in
higher-income and whiter neighborhoods.
To account for the lack of available data on the race and income of SFR owners and their tenants,
we use the geographic proxies of Racially/Ethnically Concentrated Areas of Poverty (RECAPs) and
Racially Concentrated Areas of Affluence (RCAAs) to better understand this intra-regional investment.
◼ RECAP: A census tract with a “racial/ethnic concentration threshold of 50 percent of more…
[and] 40 percent or more individuals living at or below the poverty line.”a
◼ RCAA: Researchers at the Center for Urban and Regional Affairs in Minneapolis define these
as census tracts that are at least 80 percent white and have a median household income of
around twice the national average, or $125,000 in 2018.b
We found that in Hennepin and Ramsey counties in 2020, corporate landlords from outside of the
region owned 31 percent of SFRs in RECAPs but only 12 percent of SFRs in RCAAs. This means that
SFR tenants in RECAPs are more than twice as likely to have a corporate landlord from out of the
region compared to their counterparts in RCAAs.
Although over a quarter of SFRs in RECAPs did have local owners, only 16 percent of SFR owners
were landlords in other RECAPs, while 25 percent were owners in RCAAs. Even though capital flows,
through the form of rent payments, stayed within the region, one pattern remained constant between
local and corporate landlords: A disproportionate extraction of wealth from renters in low-income and
BIPOC-majority neighborhoods.
a This census-tract-level measure was created by HUD to inform fair housing policies and initiatives that incentivized the
deconcentration of poverty and desegregation of BIPOC communities such as HOPE VI, Moving to Opportunity, and
Affirmatively Furthering Fair Housing. See “Racially or Ethnically Concentrated Areas of Poverty (R/ECAPS),” US Department of
Housing and Urban Development, Office of Policy Development and Research, last updated May 15, 2020. b To counter the dominant deficit narrative surrounding residents and communities in RECAPs, researchers have flipped the
script by instead pathologizing high-income white neighborhoods (Goetz, Damiano, and Williams 2019; Shelton 2018b). They
argue that although federal and local housing policy have often framed RECAPs as an isolated phenomenon, RECAPs and
RCAAs are codependent. For example, wealth extraction through rent from RECAPs to RCAAs help to create and sustain
concentrated poverty for BIPOC renters and increase wealth for high-income white landlords within the same city.
W H O O W N S T H E T W I N C I T I E S ? 2 5
In total, out-of-region investors accounted for roughly $1.8 billion in assessed property value in
SFR homes in 2000, increasing to $3.4 billion in 2020 (adjusted for inflation; the total assessed value
for such units was $13.3 billion in 2020). But this assessed value likely underestimates the rental
income coming into properties located outside the region. After all, a home bought on the market at a
low price because of a foreclosure can still command market-rate rental prices. As such, the changes in
parcel ownership shown in table 5 likely reflect an increase in the amount of rental payments—a form
of property-based wealth—being transferred out of the Twin Cities region and toward owners located
in other parts of the country. We can identify similar trends when examining property ownership
among areas of concentrated wealth and poverty (box 1).
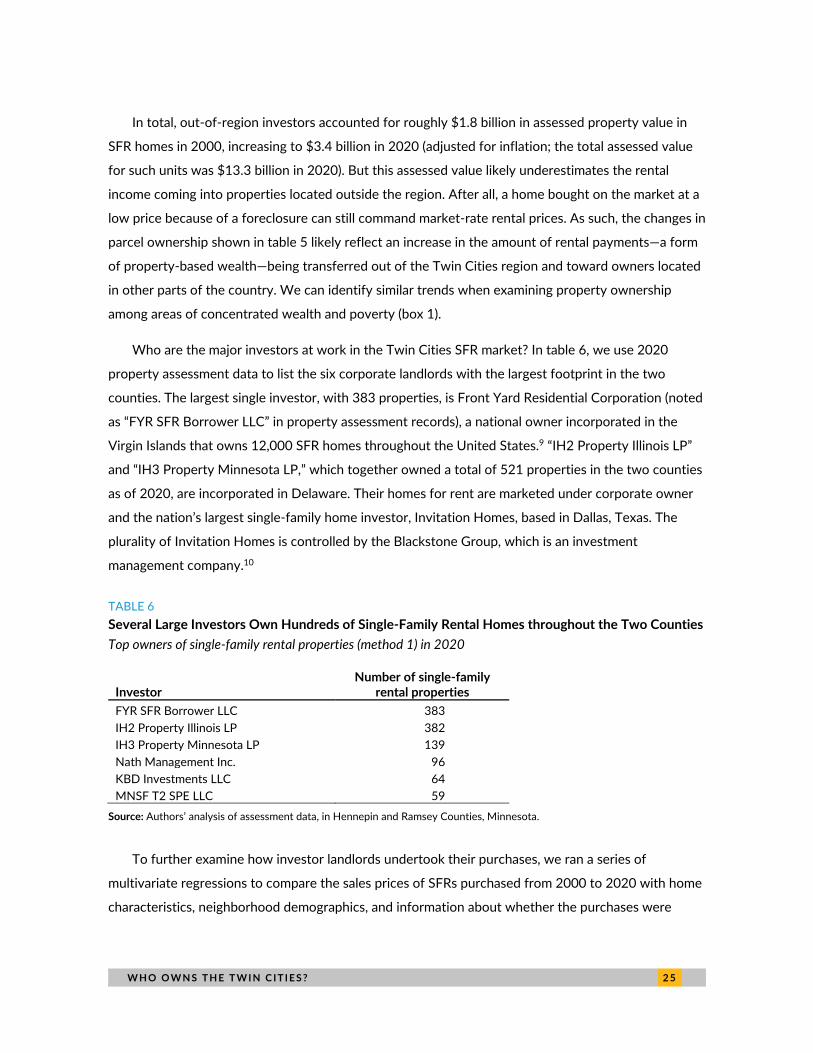
Who are the major investors at work in the Twin Cities SFR market? In table 6, we use 2020
property assessment data to list the six corporate landlords with the largest footprint in the two
counties. The largest single investor, with 383 properties, is Front Yard Residential Corporation (noted
as “FYR SFR Borrower LLC” in property assessment records), a national owner incorporated in the
Virgin Islands that owns 12,000 SFR homes throughout the United States.9 “IH2 Property Illinois LP”
and “IH3 Property Minnesota LP,” which together owned a total of 521 properties in the two counties
as of 2020, are incorporated in Delaware. Their homes for rent are marketed under corporate owner
and the nation’s largest single-family home investor, Invitation Homes, based in Dallas, Texas. The
plurality of Invitation Homes is controlled by the Blackstone Group, which is an investment
management company.10
TABLE 6
Several Large Investors Own Hundreds of Single-Family Rental Homes throughout the Two Counties
Top owners of single-family rental properties (method 1) in 2020
Investor Number of single-family
rental properties
FYR SFR Borrower LLC 383
IH2 Property Illinois LP 382
IH3 Property Minnesota LP 139
Nath Management Inc. 96
KBD Investments LLC 64
MNSF T2 SPE LLC 59
Source: Authors’ analysis of assessment data, in Hennepin and Ramsey Counties, Minnesota.
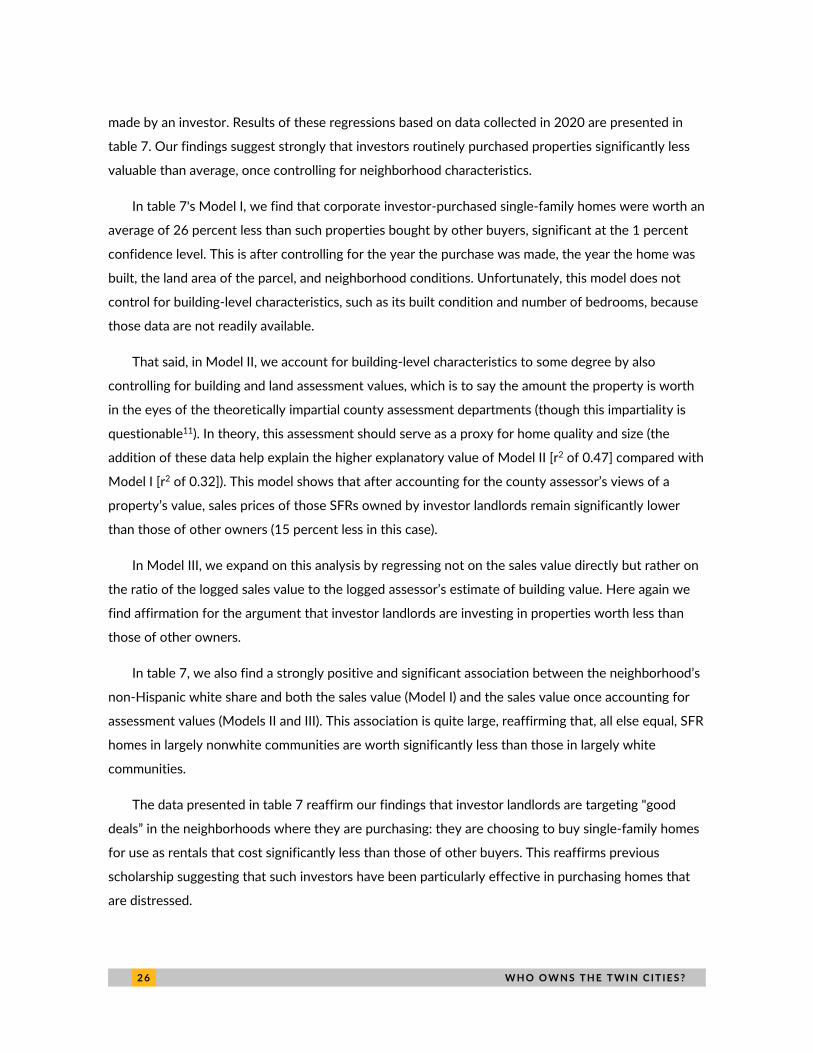
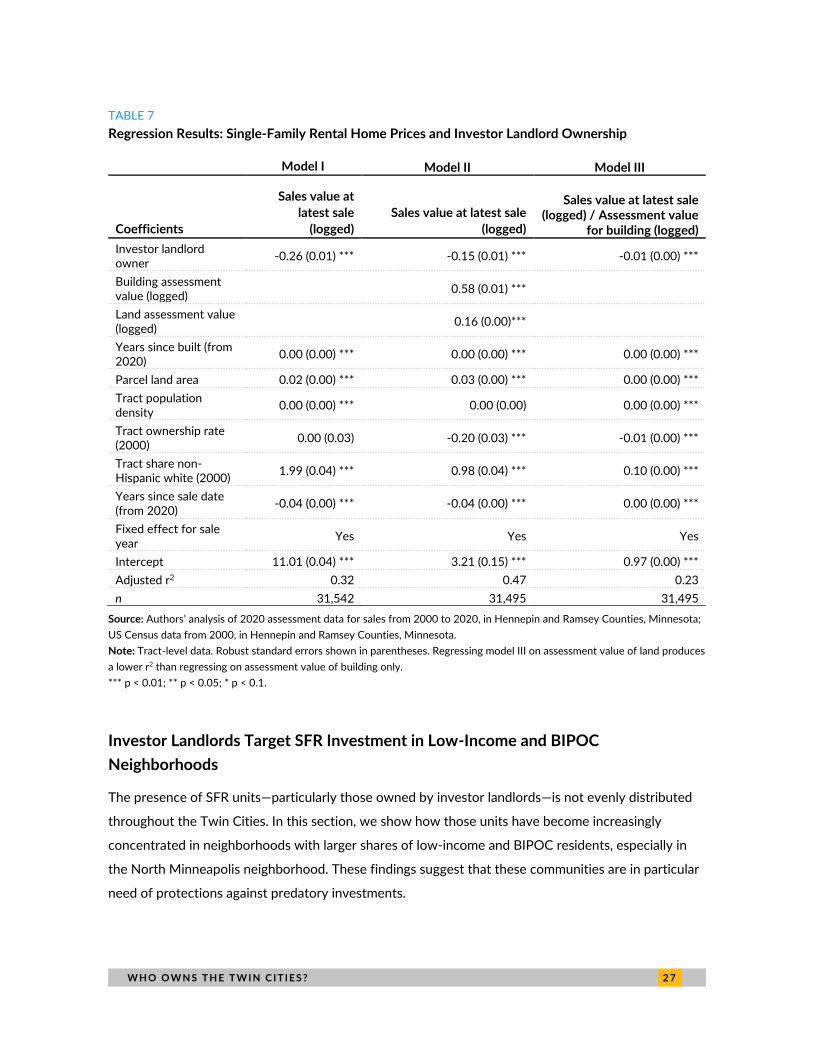
To further examine how investor landlords undertook their purchases, we ran a series of
multivariate regressions to compare the sales prices of SFRs purchased from 2000 to 2020 with home
characteristics, neighborhood demographics, and information about whether the purchases were
2 6 W H O O W N S T H E T W I N C I T I E S ?
made by an investor. Results of these regressions based on data collected in 2020 are presented in
table 7. Our findings suggest strongly that investors routinely purchased properties significantly less
valuable than average, once controlling for neighborhood characteristics.
In table 7's Model I, we find that corporate investor-purchased single-family homes were worth an
average of 26 percent less than such properties bought by other buyers, significant at the 1 percent
confidence level. This is after controlling for the year the purchase was made, the year the home was
built, the land area of the parcel, and neighborhood conditions. Unfortunately, this model does not
control for building-level characteristics, such as its built condition and number of bedrooms, because
those data are not readily available.
That said, in Model II, we account for building-level characteristics to some degree by also
controlling for building and land assessment values, which is to say the amount the property is worth
in the eyes of the theoretically impartial county assessment departments (though this impartiality is
questionable11). In theory, this assessment should serve as a proxy for home quality and size (the
addition of these data help explain the higher explanatory value of Model II [r2 of 0.47] compared with
Model I [r2 of 0.32]). This model shows that after accounting for the county assessor’s views of a
property’s value, sales prices of those SFRs owned by investor landlords remain significantly lower
than those of other owners (15 percent less in this case).
In Model III, we expand on this analysis by regressing not on the sales value directly but rather on
the ratio of the logged sales value to the logged assessor’s estimate of building value. Here again we
find affirmation for the argument that investor landlords are investing in properties worth less than
those of other owners.
In table 7, we also find a strongly positive and significant association between the neighborhood’s
non-Hispanic white share and both the sales value (Model I) and the sales value once accounting for
assessment values (Models II and III). This association is quite large, reaffirming that, all else equal, SFR
homes in largely nonwhite communities are worth significantly less than those in largely white
communities.
The data presented in table 7 reaffirm our findings that investor landlords are targeting "good
deals” in the neighborhoods where they are purchasing: they are choosing to buy single-family homes
for use as rentals that cost significantly less than those of other buyers. This reaffirms previous
scholarship suggesting that such investors have been particularly effective in purchasing homes that
are distressed.
W H O O W N S T H E T W I N C I T I E S ? 2 7
TABLE 7
Regression Results: Single-Family Rental Home Prices and Investor Landlord Ownership
Model I Model II Model III
Coefficients
Sales value at
latest sale
(logged)
Sales value at latest sale
(logged)
Sales value at latest sale (logged) / Assessment value
for building (logged)
Investor landlord owner
-0.26 (0.01) *** -0.15 (0.01) *** -0.01 (0.00) ***
Building assessment value (logged)
0.58 (0.01) ***
Land assessment value (logged)
0.16 (0.00)***
Years since built (from 2020)
0.00 (0.00) *** 0.00 (0.00) *** 0.00 (0.00) ***
Parcel land area 0.02 (0.00) *** 0.03 (0.00) *** 0.00 (0.00) ***
Tract population density
0.00 (0.00) *** 0.00 (0.00) 0.00 (0.00) ***
Tract ownership rate (2000)
0.00 (0.03) -0.20 (0.03) *** -0.01 (0.00) ***
Tract share non-Hispanic white (2000)
1.99 (0.04) *** 0.98 (0.04) *** 0.10 (0.00) ***
Years since sale date (from 2020)
-0.04 (0.00) *** -0.04 (0.00) *** 0.00 (0.00) ***
Fixed effect for sale year
Yes Yes Yes
Intercept 11.01 (0.04) *** 3.21 (0.15) *** 0.97 (0.00) ***
Adjusted r2 0.32 0.47 0.23
n 31,542 31,495 31,495
Source: Authors’ analysis of 2020 assessment data for sales from 2000 to 2020, in Hennepin and Ramsey Counties, Minnesota;
US Census data from 2000, in Hennepin and Ramsey Counties, Minnesota.
Note: Tract-level data. Robust standard errors shown in parentheses. Regressing model III on assessment value of land produces
a lower r2 than regressing on assessment value of building only.
*** p < 0.01; ** p < 0.05; * p < 0.1.
Investor Landlords Target SFR Investment in Low-Income and BIPOC
Neighborhoods
The presence of SFR units—particularly those owned by investor landlords—is not evenly distributed
throughout the Twin Cities. In this section, we show how those units have become increasingly
concentrated in neighborhoods with larger shares of low-income and BIPOC residents, especially in
the North Minneapolis neighborhood. These findings suggest that these communities are in particular
need of protections against predatory investments.
2 8 W H O O W N S T H E T W I N C I T I E S ?
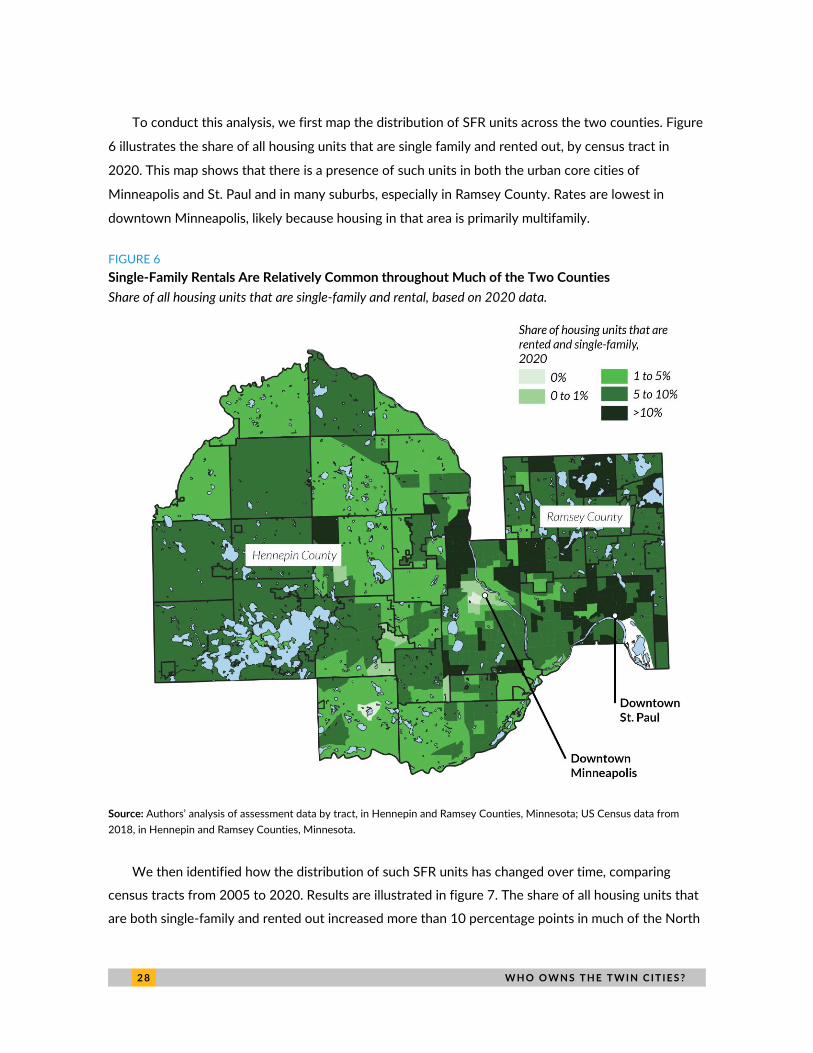
To conduct this analysis, we first map the distribution of SFR units across the two counties. Figure
6 illustrates the share of all housing units that are single family and rented out, by census tract in
2020. This map shows that there is a presence of such units in both the urban core cities of
Minneapolis and St. Paul and in many suburbs, especially in Ramsey County. Rates are lowest in
downtown Minneapolis, likely because housing in that area is primarily multifamily.
FIGURE 6
Single-Family Rentals Are Relatively Common throughout Much of the Two Counties
Share of all housing units that are single-family and rental, based on 2020 data.
Source: Authors’ analysis of assessment data by tract, in Hennepin and Ramsey Counties, Minnesota; US Census data from
2018, in Hennepin and Ramsey Counties, Minnesota.
We then identified how the distribution of such SFR units has changed over time, comparing
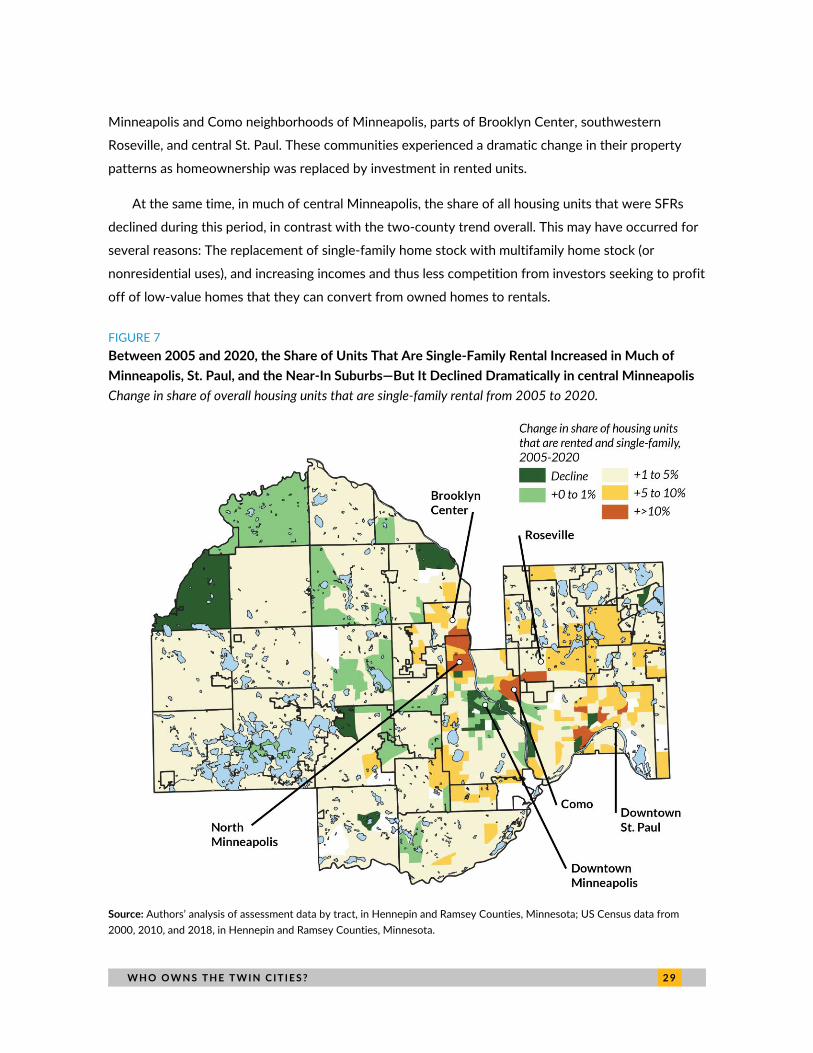
census tracts from 2005 to 2020. Results are illustrated in figure 7. The share of all housing units that
are both single-family and rented out increased more than 10 percentage points in much of the North
W H O O W N S T H E T W I N C I T I E S ? 2 9
Minneapolis and Como neighborhoods of Minneapolis, parts of Brooklyn Center, southwestern
Roseville, and central St. Paul. These communities experienced a dramatic change in their property
patterns as homeownership was replaced by investment in rented units.
At the same time, in much of central Minneapolis, the share of all housing units that were SFRs
declined during this period, in contrast with the two-county trend overall. This may have occurred for
several reasons: The replacement of single-family home stock with multifamily home stock (or
nonresidential uses), and increasing incomes and thus less competition from investors seeking to profit
off of low-value homes that they can convert from owned homes to rentals.
FIGURE 7
Between 2005 and 2020, the Share of Units That Are Single-Family Rental Increased in Much of
Minneapolis, St. Paul, and the Near-In Suburbs—But It Declined Dramatically in central Minneapolis
Change in share of overall housing units that are single-family rental from 2005 to 2020.
Source: Authors’ analysis of assessment data by tract, in Hennepin and Ramsey Counties, Minnesota; US Census data from
2000, 2010, and 2018, in Hennepin and Ramsey Counties, Minnesota.
3 0 W H O O W N S T H E T W I N C I T I E S ?
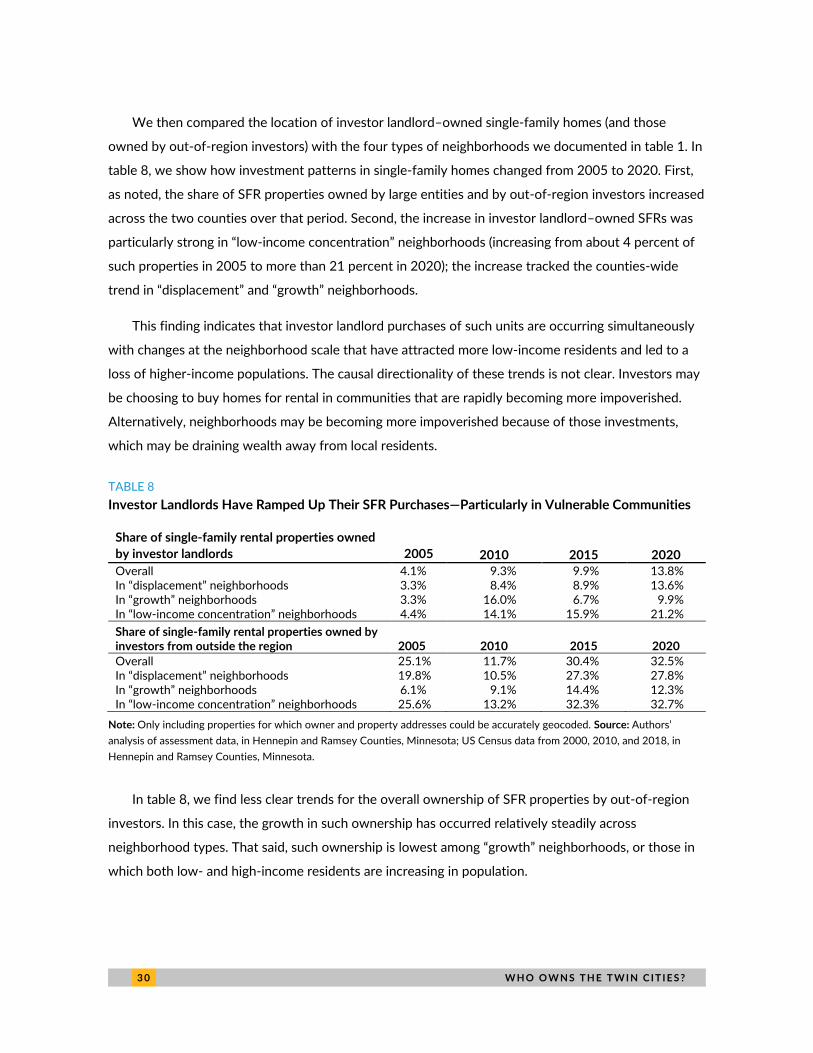
We then compared the location of investor landlord–owned single-family homes (and those
owned by out-of-region investors) with the four types of neighborhoods we documented in table 1. In
table 8, we show how investment patterns in single-family homes changed from 2005 to 2020. First,
as noted, the share of SFR properties owned by large entities and by out-of-region investors increased
across the two counties over that period. Second, the increase in investor landlord–owned SFRs was
particularly strong in “low-income concentration” neighborhoods (increasing from about 4 percent of
such properties in 2005 to more than 21 percent in 2020); the increase tracked the counties-wide
trend in “displacement” and “growth” neighborhoods.
This finding indicates that investor landlord purchases of such units are occurring simultaneously
with changes at the neighborhood scale that have attracted more low-income residents and led to a
loss of higher-income populations. The causal directionality of these trends is not clear. Investors may
be choosing to buy homes for rental in communities that are rapidly becoming more impoverished.
Alternatively, neighborhoods may be becoming more impoverished because of those investments,
which may be draining wealth away from local residents.
TABLE 8
Investor Landlords Have Ramped Up Their SFR Purchases—Particularly in Vulnerable Communities
Share of single-family rental properties owned
by investor landlords 2005 2010 2015 2020
Overall 4.1% 9.3% 9.9% 13.8% In “displacement” neighborhoods 3.3% 8.4% 8.9% 13.6% In “growth” neighborhoods 3.3% 16.0% 6.7% 9.9% In “low-income concentration” neighborhoods 4.4% 14.1% 15.9% 21.2%
Share of single-family rental properties owned by investors from outside the region 2005 2010 2015 2020
Overall 25.1% 11.7% 30.4% 32.5% In “displacement” neighborhoods 19.8% 10.5% 27.3% 27.8% In “growth” neighborhoods 6.1% 9.1% 14.4% 12.3% In “low-income concentration” neighborhoods 25.6% 13.2% 32.3% 32.7%
Note: Only including properties for which owner and property addresses could be accurately geocoded. Source: Authors’
analysis of assessment data, in Hennepin and Ramsey Counties, Minnesota; US Census data from 2000, 2010, and 2018, in
Hennepin and Ramsey Counties, Minnesota.
In table 8, we find less clear trends for the overall ownership of SFR properties by out-of-region
investors. In this case, the growth in such ownership has occurred relatively steadily across
neighborhood types. That said, such ownership is lowest among “growth” neighborhoods, or those in
which both low- and high-income residents are increasing in population.
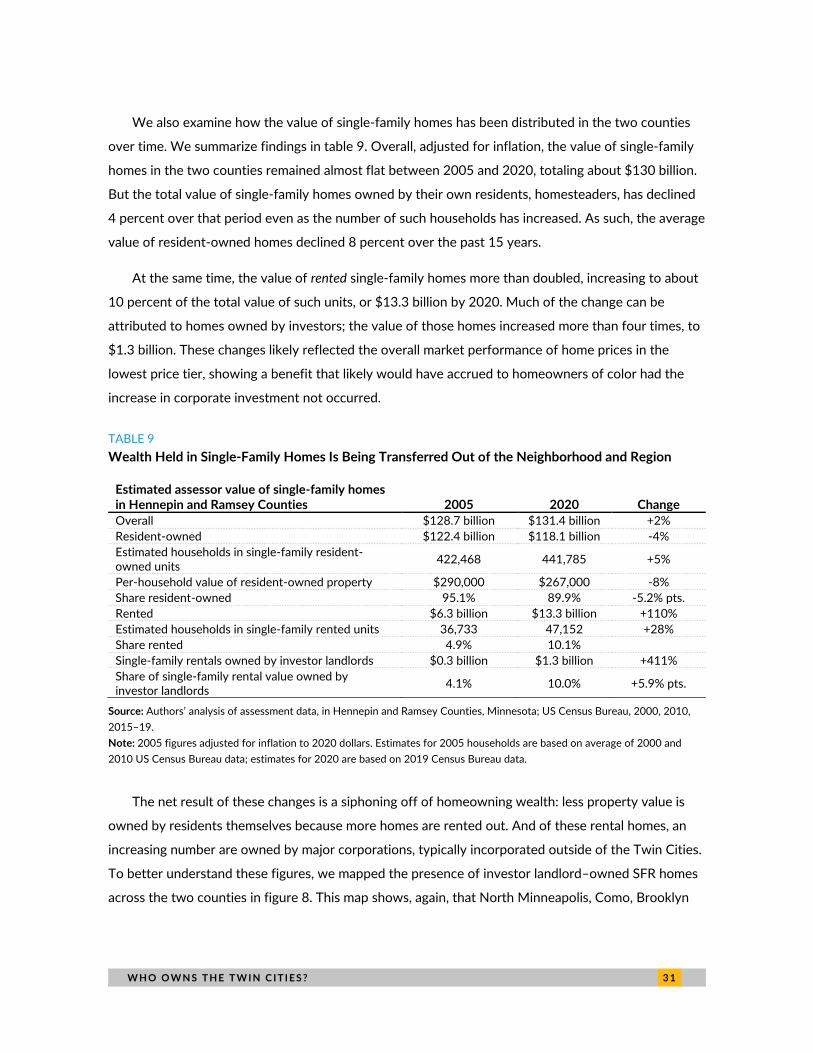
W H O O W N S T H E T W I N C I T I E S ? 3 1
We also examine how the value of single-family homes has been distributed in the two counties
over time. We summarize findings in table 9. Overall, adjusted for inflation, the value of single-family
homes in the two counties remained almost flat between 2005 and 2020, totaling about $130 billion.
But the total value of single-family homes owned by their own residents, homesteaders, has declined
4 percent over that period even as the number of such households has increased. As such, the average
value of resident-owned homes declined 8 percent over the past 15 years.
At the same time, the value of rented single-family homes more than doubled, increasing to about
10 percent of the total value of such units, or $13.3 billion by 2020. Much of the change can be
attributed to homes owned by investors; the value of those homes increased more than four times, to
$1.3 billion. These changes likely reflected the overall market performance of home prices in the
lowest price tier, showing a benefit that likely would have accrued to homeowners of color had the
increase in corporate investment not occurred.
TABLE 9
Wealth Held in Single-Family Homes Is Being Transferred Out of the Neighborhood and Region
Estimated assessor value of single-family homes in Hennepin and Ramsey Counties 2005 2020 Change
Overall $128.7 billion $131.4 billion +2%
Resident-owned $122.4 billion $118.1 billion -4%
Estimated households in single-family resident-owned units
422,468 441,785 +5%
Per-household value of resident-owned property $290,000 $267,000 -8%
Share resident-owned 95.1% 89.9% -5.2% pts.
Rented $6.3 billion $13.3 billion +110%
Estimated households in single-family rented units 36,733 47,152 +28%
Share rented 4.9% 10.1%
Single-family rentals owned by investor landlords $0.3 billion $1.3 billion +411%
Share of single-family rental value owned by investor landlords
4.1% 10.0% +5.9% pts.
Source: Authors’ analysis of assessment data, in Hennepin and Ramsey Counties, Minnesota; US Census Bureau, 2000, 2010,
2015–19.
Note: 2005 figures adjusted for inflation to 2020 dollars. Estimates for 2005 households are based on average of 2000 and
2010 US Census Bureau data; estimates for 2020 are based on 2019 Census Bureau data.
The net result of these changes is a siphoning off of homeowning wealth: less property value is
owned by residents themselves because more homes are rented out. And of these rental homes, an
increasing number are owned by major corporations, typically incorporated outside of the Twin Cities.
To better understand these figures, we mapped the presence of investor landlord–owned SFR homes
across the two counties in figure 8. This map shows, again, that North Minneapolis, Como, Brooklyn
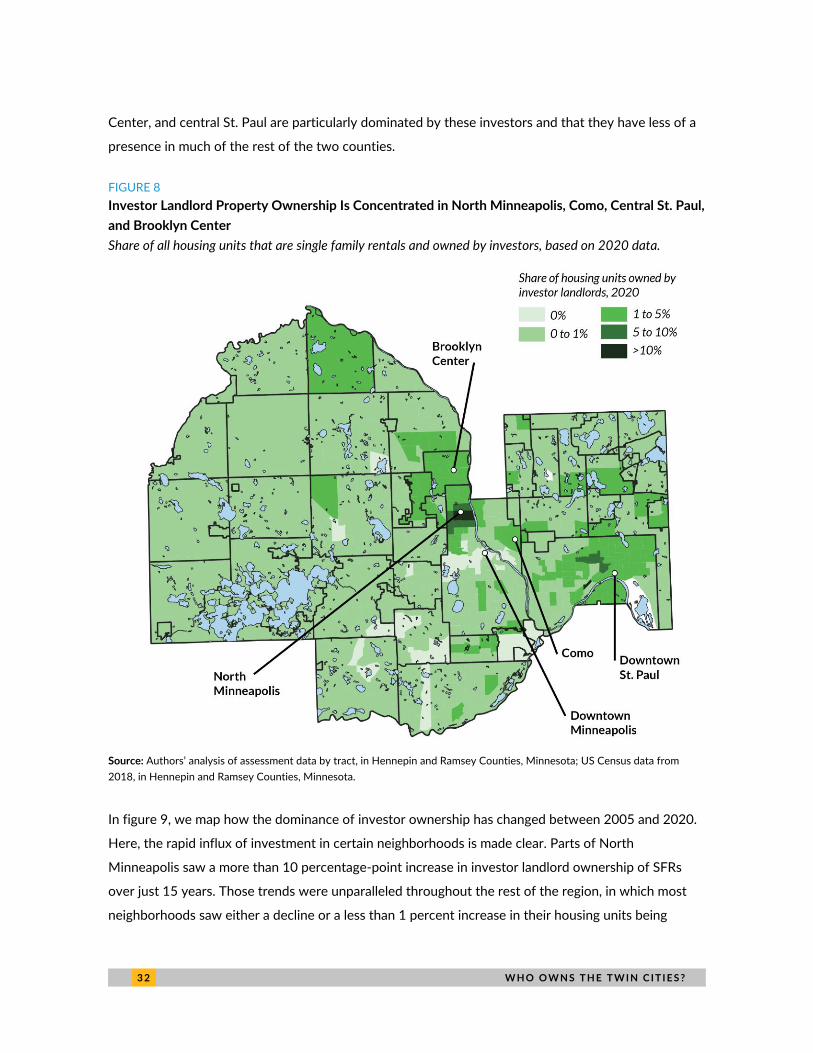
3 2 W H O O W N S T H E T W I N C I T I E S ?
Center, and central St. Paul are particularly dominated by these investors and that they have less of a
presence in much of the rest of the two counties.
FIGURE 8
Investor Landlord Property Ownership Is Concentrated in North Minneapolis, Como, Central St. Paul,
and Brooklyn Center
Share of all housing units that are single family rentals and owned by investors, based on 2020 data.
Source: Authors’ analysis of assessment data by tract, in Hennepin and Ramsey Counties, Minnesota; US Census data from
2018, in Hennepin and Ramsey Counties, Minnesota.
In figure 9, we map how the dominance of investor ownership has changed between 2005 and 2020.
Here, the rapid influx of investment in certain neighborhoods is made clear. Parts of North
Minneapolis saw a more than 10 percentage-point increase in investor landlord ownership of SFRs
over just 15 years. Those trends were unparalleled throughout the rest of the region, in which most
neighborhoods saw either a decline or a less than 1 percent increase in their housing units being
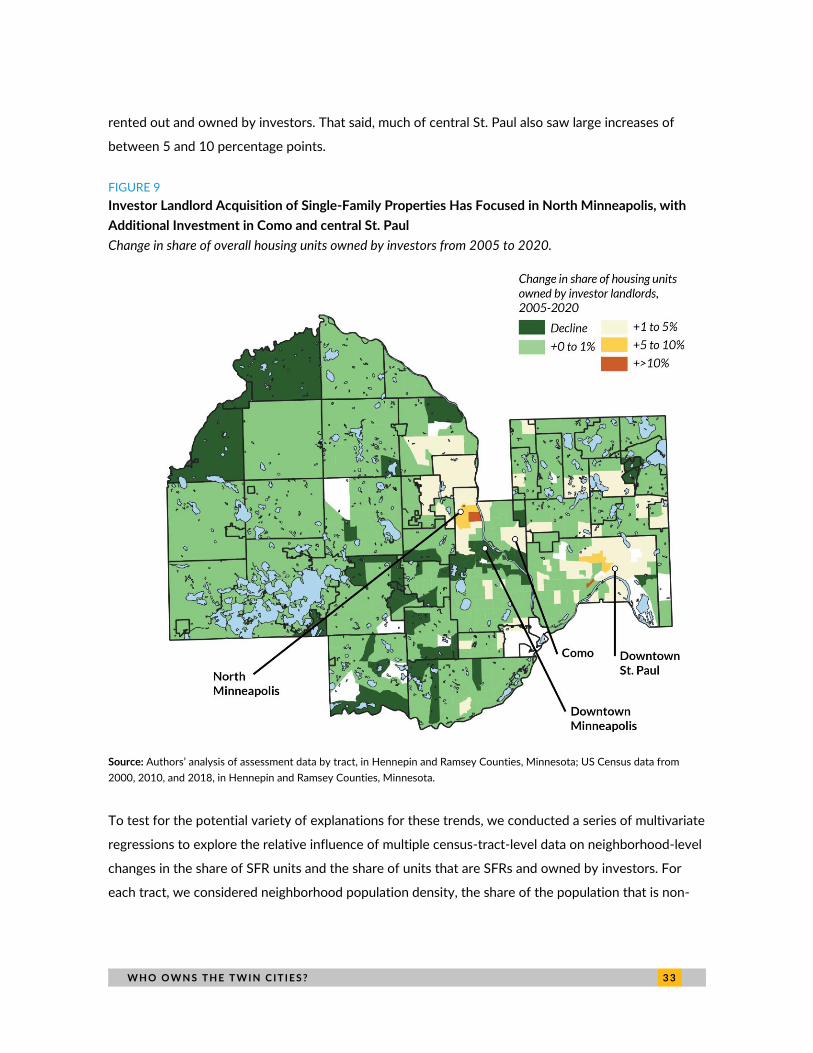
W H O O W N S T H E T W I N C I T I E S ? 3 3
rented out and owned by investors. That said, much of central St. Paul also saw large increases of
between 5 and 10 percentage points.
FIGURE 9
Investor Landlord Acquisition of Single-Family Properties Has Focused in North Minneapolis, with
Additional Investment in Como and central St. Paul
Change in share of overall housing units owned by investors from 2005 to 2020.
Source: Authors’ analysis of assessment data by tract, in Hennepin and Ramsey Counties, Minnesota; US Census data from
2000, 2010, and 2018, in Hennepin and Ramsey Counties, Minnesota.
To test for the potential variety of explanations for these trends, we conducted a series of multivariate
regressions to explore the relative influence of multiple census-tract-level data on neighborhood-level
changes in the share of SFR units and the share of units that are SFRs and owned by investors. For
each tract, we considered neighborhood population density, the share of the population that is non-
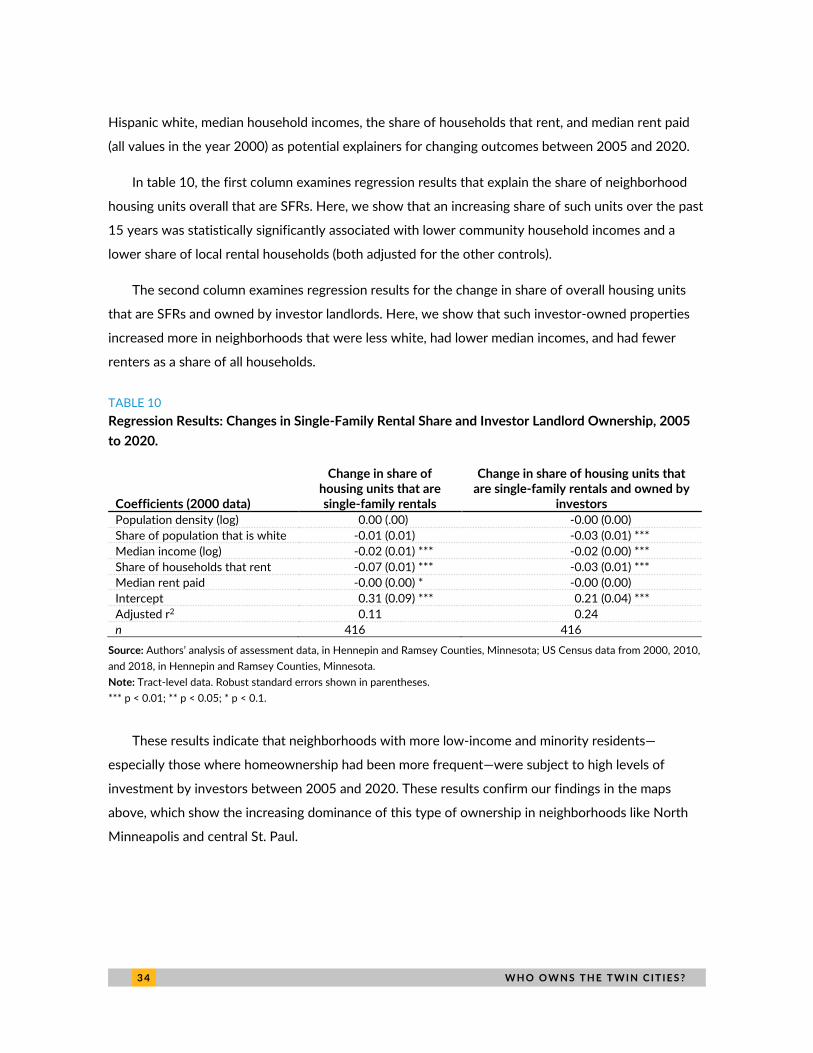
3 4 W H O O W N S T H E T W I N C I T I E S ?
Hispanic white, median household incomes, the share of households that rent, and median rent paid
(all values in the year 2000) as potential explainers for changing outcomes between 2005 and 2020.
In table 10, the first column examines regression results that explain the share of neighborhood
housing units overall that are SFRs. Here, we show that an increasing share of such units over the past
15 years was statistically significantly associated with lower community household incomes and a
lower share of local rental households (both adjusted for the other controls).
The second column examines regression results for the change in share of overall housing units
that are SFRs and owned by investor landlords. Here, we show that such investor-owned properties
increased more in neighborhoods that were less white, had lower median incomes, and had fewer
renters as a share of all households.
TABLE 10
Regression Results: Changes in Single-Family Rental Share and Investor Landlord Ownership, 2005
to 2020.
Coefficients (2000 data)
Change in share of housing units that are single-family rentals
Change in share of housing units that are single-family rentals and owned by
investors
Population density (log) 0.00 (.00) -0.00 (0.00)
Share of population that is white -0.01 (0.01) -0.03 (0.01) ***
Median income (log) -0.02 (0.01) *** -0.02 (0.00) ***
Share of households that rent -0.07 (0.01) *** -0.03 (0.01) ***
Median rent paid -0.00 (0.00) * -0.00 (0.00)
Intercept 0.31 (0.09) *** 0.21 (0.04) ***
Adjusted r2 0.11 0.24
n 416 416
Source: Authors’ analysis of assessment data, in Hennepin and Ramsey Counties, Minnesota; US Census data from 2000, 2010,
and 2018, in Hennepin and Ramsey Counties, Minnesota.
Note: Tract-level data. Robust standard errors shown in parentheses.
*** p < 0.01; ** p < 0.05; * p < 0.1.
These results indicate that neighborhoods with more low-income and minority residents—
especially those where homeownership had been more frequent—were subject to high levels of
investment by investors between 2005 and 2020. These results confirm our findings in the maps
above, which show the increasing dominance of this type of ownership in neighborhoods like North
Minneapolis and central St. Paul.
W H O O W N S T H E T W I N C I T I E S ? 3 5
Implications of Our Findings
Like many communities throughout the United States, the Twin Cities are striving to become more
equitable, inclusive places where people of all backgrounds have access to affordable housing and
where people can build wealth through homeownership. These are key processes on the path toward
achieving a more inclusive recovery from the COVID-19 crisis. This health emergency has, in some
ways, only further exacerbated the preexisting inequalities between families based on their race.
Many of the root causes of a racialized gap in homeownership, such as differences in income, access
to family wealth, and a history of systemic racism, have only been entrenched. As a result, new policy
solutions are necessary to fill the gap.
Our research builds on the growing consensus that considerable work remains for the Twin Cities
region to achieve these important goals. The Black-white gap in homeownership is growing as Black
families are increasingly unable to find the means to own their own homes. This gap is a particular
concern in the gentrifying neighborhoods in central Minneapolis, where people of color who own and
rent their own homes are being displaced by whiter, wealthier inhabitants, and in the vulnerable low-
income neighborhoods of North Minneapolis, Como, and central St. Paul, where investor landlords
have increasingly replaced single-family homeownership with rental homes.
Our analysis of property data shows the growing impact of investors in the SFR market in
Hennepin and Ramsey Counties. Though these conditions are not as extreme as has been experienced
in much of the US Sunbelt, certain vulnerable neighborhoods have been hit hard by these trends.
These investors have contributed to a large increase in the share of single-family homes that are
rented out. Their approach to investment seems to be targeting undervalued housing stock, and the
ultimate result is a redistribution of wealth related to housing from homeowners living in the
community—many of whom are people of color—to large corporations located elsewhere in the
country (sometimes even incorporated outside the United States altogether).
The gap in homeownership between Black and white households must be addressed. In recent
research from the Urban Institute, McCargo, Choi, and Golding (2019) and McCargo and Choi (2020)
recommend the following strategies to build up the wealth of Black families through homeownership:
◼ Implementing a restorative housing wealth program for Black families and other people of
color to reduce debt and support new homeowners, particularly in the neighborhoods that
have experienced the most rapid rise in SFRs and corporate ownership.
◼ Equalizing the costs and benefits of homeownership for Black households.
3 6 W H O O W N S T H E T W I N C I T I E S ?
◼ Providing new financing options, such as small-dollar mortgages for purchase and renovation,
for Black homeowners, and providing down-payment assistance, while requiring banks to
ensure equitable service to all communities.
◼ Improving outreach, information, and counseling to prospective and existing homeowners,
aiding families in an effort to avoid foreclosure, and monitoring neighborhood-level home
values to identify areas of concern—especially those neighborhoods that are undergoing
gentrification and displacement trends.
◼ Building fair housing and antiracist testing into home valuation and appraisals, including into
the technologies underpinning them.
◼ Expanding relief for existing homeowners and creating a stimulus program to prevent further
erosion among existing Black homeowners.
◼ Allowing local governments, neighborhood nonprofits, and community land banks to leverage
a right of first refusal for any single-family home property sale, allowing communities to
maintain neighborhood wealth even in the context of individual foreclosures.
Simply increasing the level of homeownership among Black families, however, would be
inadequate to fully address the large and growing racialized wealth gaps that characterize life in the
Twin Cities today. Research into home values indicates that neighborhoods that are “marked as Black”
may inhibit home price increases. For example, in their study of Atlanta neighborhoods, Markley and
colleagues (2020) find that home values in Black-majority communities declined, even as those in
white neighborhoods increased. The result has been a furthering of the wealth gap, despite the
presence of Black homeownership. A similar study finding home appreciation for both Black and white
homeowners across 15 metropolitan areas found that Black family–owned homes increased in
percentage value more than white family–owned homes overall, though the nominal value of the
Black family–owned homes increased significantly less than those owned by white families. That said,
had more Black families been able to purchase homes during that period, the ultimate effect would
have been higher wealth among those households (Immergluck, Earl, and Powell 2019). The trends are
clear: Homeownership among Black families in the Twin Cities must be reinforced to ensure they
benefit from property ownership as much as their white peers do.
One essential way to begin to tackle the homeownership crisis is to target corporate-owned SFRs
as potential sites for new future wealth building among BIPOC in some of the most vulnerable
communities of the Twin Cities. Ferrer (2021), Fields (2014), and Graziani and colleagues (2020) point
to some key potential levers the public sector and others can take in this direction:
◼ At the local level
W H O O W N S T H E T W I N C I T I E S ? 3 7
» Limit the size and concentration of holdings of landlords using housing as investment
vehicles. One option could be to cap the number of properties a single real-estate
investment trust can own (this may require state legislation).
» Enact a progressive gross receipts tax (windfall tax) designed to discourage the
accumulation of large real-estate portfolios within a single jurisdiction. This would tax
revenue earned by businesses—in this case, rental revenue from SFRs—progressively,
easing the burden on small landlords but increasing costs for large-scale corporate
entities.
» Expand the foreclosure registry program, aiming to proactively intervene to support
distressed homeowners. This would include reaching out to homeowners that have been
served notices of defaults and deterring speculative investors from pressuring existing
homeowners on the financial brink from selling.
◼ At the state level
» Implementing an out-of-state transactions fee that targets landlords incorporated outside
of Minnesota, a characteristic that applies to most of the large corporate investors in
SFRs. Funds raised through this mechanism could be directed toward affordable housing
efforts.
» Regulating the real-estate industry to stop the consolidation of real-estate transactions.
The state could prevent corporate actors from buying several foreclosed homes together
at a single auction and instead prioritize investments by local governments and affordable
housing nonprofits. California’s recent SB 1079 is a model of this kind of law.
◼ At the federal level
» Creating new resources to support lower-income households. This could be done through
the implementation of a financial transaction fee on rental bonds. The federal government
could collect funds from this source to support new affordable housing construction,
tenant-based vouchers for use by renters, and homeownership support for BIPOC
families.
» Unearthing data about large-scale corporate investors in housing, providing a national
database that is free to use for governments and researchers. This would further expose
the degree to which these investors are altering the real-estate market in key
communities.
These policies can only be undertaken through action by government stakeholders at the local,
state, and federal levels. Without intervention, however, vulnerable families are likely to bear the
brunt of the postpandemic real-estate market, which may include, yet again, a significant uptick in
investors purchasing homes from families who lost their jobs and in corporate owners increasing
evictions in communities where unemployment has increased.

3 8 W H O O W N S T H E T W I N C I T I E S ?
Future Research Directions
We are aware of several additional research questions that would further boost our understanding of
housing affordability in the Twin Cities, particularly its relationship with low-income people of color.
One issue worth further investigation is building-by-building affordability. More such information
could help identify apartments whose owners are most likely to displace current residents who are
low-income people of color. Proprietary datasets such as CoStar provide property-level data on
average rents, building age, quality, number of units, and renter turnover. These data could provide
additional insight into issues like building rental affordability and help target individual parcels most at
risk of future rent increases, but this research is outside of this investigation.
We also need a better understanding of where homeowning people of color who are being
displaced are headed. Do they stay in the neighborhood, just moving to rental properties? Or do they
leave to greener pastures elsewhere in the region or somewhere else in the United States?
Understanding such movements is essential for targeting our full awareness of why people move into
some neighborhoods and others move out.
Finally, we are interested in exploring the trajectory of change for individual housing units over
time. What are the specific housing characteristics that are most likely to lead to an investor buying up
a single-family home? Is foreclosure a major explanation? And what happens to the rent of such
investor-owned homes? Does it increase dramatically and lead more quickly to eviction? From this
perspective, we can do more to understand the ultimate social and community outcomes that derive
from these changes, such as alterations in overall demographic composition and changes in local
culture.
N O T E S 3 9
Notes
1 Odeta Kushi, “Homeownership Remains Strongly Linked to Wealth-Building,” First American blog. November 5,
2020, https://blog.firstam.com/economics/homeownership-remains-strongly-linked-to-wealth-building.
2 Caitlin Young, “These Five Facts Reveal the Current Crisis in Black Homeownership,” Urban Wire, July 31, 2019,
https://www.urban.org/urban-wire/these-five-facts-reveal-current-crisis-black-homeownership
3 Derek Thompson, “The Miracle of Minneapolis,” The Atlantic, March 15, 2015.
4 Alanna McCargo and Sarah Strochak, “Mapping the Black Homeownership Gap” Urban Wire, February 26, 2018,
https://www.urban.org/urban-wire/mapping-black-homeownership-gap
5 See AB-1199, “Homes for Families and Corporate Monopoly Transparency Excise Tax: Qualified Property:
Reporting Requirements,” CA Gen. Assemb., Reg. Sess. (2021).
https://leginfo.legislature.ca.gov/faces/billNavClient.xhtml?bill_id=202120220AB1199.
6 The homestead exemption, which provides property tax relief to resident-homeowners, does not apply to
homes with a value of more than $413,000 as of 2021, which means that some homeowners in the counties
may have no financial reason to apply for the exemption in their property tax filings. Even so, the Minnesota
Department of Revenue and county assessor’s offices across the state encourage all property owners to apply
for the homestead exemption, even if they do not qualify, since there are other programs and bank loans for
which it may be necessary (Information provided by Jessi Glancey, Training and Outreach Coordinator with the
Minnesota Department of Revenue, through email correspondence with the authors, May 18, 2021). As such,
we are reasonably confident that the use of the homesteading exemption as a proxy for homeownership is
reasonable. Moreover, as we show later in this report, our estimates of the number of rental properties (based
on the homestead exemption data) line up closely with US Census data on this issue.
7 “Refugees in Minnesota: Quick Facts,” Immigrant Law Center of Minnesota, March 27, 2018,
https://www.ilcm.org/latest-news/refugees-in-minnesota-quick-facts/.
8 County assessment data are not entirely reliable in terms of identifying the number of units within each building.
9 See the Front Yard Residential website at https://www.frontyardresidential.com/.
10 Mary Ellen Podmolik, “Wall Street Moving in on American Dream,” Chicago Tribune. December 15, 2013.
11 Debra Kamin, “Black Homeowners Face Discrimination in Appraisals,” New York Times. August 25, 2020.
4 0 R E F E R E N C E S
References Brummett, Quentin, and Davin Reed. 2019. The Effects of Gentrification on the Well-Being and Opportunity of
Original Resident Adults and Children. Philadelphia: Federal Reserve Bank of Philadelphia.
Cahill, Meagan E., and Rachel S. Franklin. 2013. “The Minority Homeownership Gap, Home Foreclosure, and
Nativity: Evidence from Miami-Dade County.” Journal of Regional Science 53 (1): 91–117.
Choi, Jung Hyun. 2020. “Breaking Down the Black-White Homeownership Gap.” Washington, DC: Urban
Institute.
Choi, Jung Hyun, Alanna McCargo, Michael Neal, Laurie Goodman, and Caitlin Young. 2019. “Explaining the
Black-White Homeownership Gap: A Closer Look at Disparities across Local Markets.” Washington, DC: Urban
Institute.
Cohen, Jeffrey P., and John P. Harding. 2020. “The Bargaining and Contagion Effects of Investors in Single Family
Residential Properties: The Case of Denver Colorado.” Journal of Real Estate Finance Economics.
Colburn, Gregg, Rebecca J. Walter, and Deirdre Pfeiffer. 2020. “Capitalizing on Collapse: An Analysis of
Institutional Single-Family Rental Investors.” Urban Affairs Review.
Ferrer, Alexander. 2021. Beyond Wall Street Landlords: How Private Equity in the Rental Market Makes Housing
Unaffordable, Unstable, and Unhealthy. Los Angeles: Strategic Actions for a Just Economy.
Fields, Desiree. 2014. The Rise of the Corporate Landlord: The Institutionalization of the Single-Family Rental Market
and Potential Impact on Renters. New York: Right to the City, Homes for All.
Freemark, Yonah, Justin Steil, and Kathleen Thelen. 2020. “Varieties of Urbanism: A Comparative View of
Metropolitan Fragmentation and Inequality.” Politics & Society 48 (2): 235–74.
Freemark, Yonah, and Justin Steil. 2021. “Local Power and the Location of Subsidized Renters in Comparative
Perspective: Public Support for Low- and Moderate-Income Households in the United States, France, and the
United Kingdom.” Housing Studies.
Gerardi, Kristopher, Paul Willen, and David Zhang. 2020. “Mortgage Prepayment, Race, and Monetary Policy.”
Working paper. Boston: Federal Reserve Bank of Boston.
Goetz, Edward G., Anthony Damiano, and Rashad A. Williams. 2019. “Racially Concentrated Areas of Affluence: A
Preliminary Investigation.” Cityscape: A Journal of Policy Development and Research 21 (1): 99–123.
Goodman, Laurie, and Karan Kaul. 2017. “Fannie Mae’s Financing of Single-Family Rentals: Good Pilot, but Plenty
to Think About.” Washington, DC: Urban Institute.
Graziani, Terra, Joel Montano, Ananya Roy, and Pamela Stephens. 2020. “Who Profits from Crisis? Housing Grabs
in Times of Recovery.” Los Angeles: UCLA Luskin Institute for Inequality and Democracy.
Haughwout, Andrew, Richard Peach, and Joseph Tracy. 2010. “The Homeownership Gap.” Current Issues in
Economics and Finance 16 (5).
Horowitz, Ben, Libby Starling, Kim Eng Ky, and Alene Tchourumoff. 2021. “Systemtic Racism Haunts
Homeownership Rates in Minnesota.” Minneapolis: Federal Reserve Bank of Minneapolis.
Hilber, Christian A.L., and Yingchun Liu. 2008. Explaining the Black-White Homeownership Gap: The role of Own
Wealth, Parental Externalities and Locational Preferences. Journal of Housing Economics 17: 152–74.
Ihlanfeldt, Keith, and Cynthia Fan Yang. 2020. “Not in My Neighborhood: The Effects of Single-Family Rentals on
Home Values.” Tallahassee: Florida State University.
R E F E R E N C E S 4 1
Immergluck, Dan. 2018. “The Rise of Single-Family Rentership in the Sunbelt Metropolis.” Housing Policy Debate
28 (5): 814–29.
Immergluck, Dan, and Jonathan Law. 2014. “Investing in Crisis: The Methods, Strategies, and Expectations of
Investors in Single-Family Foreclosed Homes in Distressed Neighborhoods.” Housing Policy Debate 24 (3): 568–
93.
Immergluck, Dan, Stephanie Earl, and Allison Powell. 2019. Black Homebuying after the Crisis: Appreciation and
Segregation Patterns in Fifteen Large Metropolitan Areas.” City & Community 18 (3): 983–1002.
Institute on Metropolitan Opportunity. 2019. “American Neighborhood Change in the 21st Century.” Minneapolis:
University of Minnesota Law School.
Magder, Dan, and Laurie Goodman. 2015. “Single-Family Rentals: A New Approach to Affordable Housing.”
Washington, DC: Urban Institute.
Markley, Scott N., Taylor J. Hafley, Coleman A. Allums, Steven R. Holloway, and Hee Cheol Chung. 2020. “The
Limits of Homeownership: Racial Capitalism, Black Wealth, and the Appreciating Gap in Atlanta.” International
Journal of Urban and Regional Research 44 (2): 310–28.
McCargo, Alanna, and Jung Hyun Choi. 2020. “Closing the Gaps: Building Black Wealth Through
Homeownership.” Washington, DC: Urban Institute.
McCargo, Alanna, Jung Hyun Choi, and Edward Golding. 2019. “Building Black Homeownership Bridges: A Five-
Point Framework for Reducing the Racial Homeownership Gap.” Washington, DC: Urban Institute.
Mills, James, Raven Molloy, and Rebecca Zarutskie. 2019. “Large-Scale Buy-to-Rent Investors in the Single-Family
Housing Market: The Emergence of a New Asset Class.” Real Estate Economics 47 (2): 399–430.
Neal, Michael, Jung Hyun Choi, and John Walsh. 2020. Before the Pandemic, Homeowners of Color Faced Structural
Barriers to the Benefits of Homeownership. Washington, DC: Urban Institute.
Oberg, Phillip Michael. 2017. “The Housing Bubble and the Evolution of the Homeownership Gap.” Quarterly
Review of Economics and Finance 65: 25–35.
Perry, Andre M., Jonathan Rothwell, and David Harshbarger. 2018. “The Devaluation of Assets in Black
Neighborhoods.” Washington, DC: Brookings Institution.
Pfeiffer, Deirdre, Alex Schafran, and Jake Wegmann. 2020. “Vulnerability and Opportunity: Making Sense of the
Rise in Single-Family Rentals in US Neighbourhoods.” Housing Studies.
Reid, Caroline K., Rocio Sanchez-Moyano, and Carol J. Galante. 2018. “The Rise of Single-Family Rentals after the
Foreclosure Crisis: Understanding Tenants Perspectives.” Berkeley: University of California Berkeley, Terner
Center.
Seah, Kiat Ying, and Eric Fesselmeyer. 2017. “Estimating and Decomposing Changes in the White-Black
Homeownership Gap from 2005 to 2011.” Urban Studies 54 (1): 119–36.
Shelton, Taylor. 2018a. “Mapping Dispossession: Eviction, Foreclosure and the Multiple Geographies of Housing
Instability in Lexington, Kentucky.” Geoforum 97: 281–91.
———. 2018b. “Rethinking the RECAP: Mapping the Relational Geographies of Concentrated Poverty and
Affluence in Lexington, Kentucky.” Urban Geography 39 (7): 1070–91.
4 2 A B O U T T H E A U T H O R S
About the Authors
Yonah Freemark is a senior research associate at the Metropolitan Housing and Communities Policy
Center at the Urban Institute. His research focuses on the intersection of land use, affordable housing,
and transportation. He has published peer-reviewed scholarship in numerous journals, including Urban
Affairs Review, Politics & Society, Housing Policy Debate, and the Journal of the American Planning
Association.
Previously, Freemark worked for Chicago’s Metropolitan Planning Council and has written for the
New York Times, Next City, and CityLab, among others. He holds master’s degrees in both city planning
and in transportation, as well as a PhD in urban studies from MIT.
Eleanor Noble is a research assistant in the Metropolitan Housing and Communities Policy Center.
Her research interests include housing affordability, evictions, and zoning and land use. Her past
projects have examined the landscape of landlords in North Minneapolis and public transit use and
perception by transgender and gender nonconforming riders. Noble graduated from Macalester
College with a BA in geography, a minor in data science, and a concentration in urban studies.
Yipeng Su is a research associate in the Metropolitan Housing and Communities Policy Center. Her
research interests include housing, economic development, and the intersection between urban
planning and technology. She is skilled in quantitative research methods and recently joined Urban’s
Racial Equity Analytics Lab to provide research and technical support to researchers across Urban. She
holds a master’s degree in public administration from New York University’s Wagner Graduate School
of Public Service
STATEMENT OF INDEPENDENCE
The Urban Institute strives to meet the highest standards of integrity and quality in its research and analyses and
in the evidence-based policy recommendations offered by its researchers and experts. We believe that operating
consistent with the values of independence, rigor, and transparency is essential to maintaining those standards.
As an organization, the Urban Institute does not take positions on issues, but it does empower and support its
experts in sharing their own evidence-based views and policy recommendations that have been shaped by
scholarship. Funders do not determine our research findings or the insights and recommendations of our experts.
Urban scholars and experts are expected to be objective and follow the evidence wherever it may lead.
500 L’Enfant Plaza SW
Washington, DC 20024
www.urban.org