where do we grow from here? - world of 7 billion
TRANSCRIPT

A Quick Trip to 7 Billion: Where Do We Grow From Here?
Concept:Our current global society ishealthier, wealthier, and bettereducated than in years past, yetwe continue to grow at a ratethat is unsustainable for Earth’sfinite resources. Luckily, thereare things that can be done tohelp stabilize our population,protect the global environment,and promote human dignity andwell-being.Objectives:Students will be able to:- Recognize the impact our popu-lation has on the environmentand understand the balancebetween population and naturalresources is important.- Develop individual, community,and global approaches for stabi-lizing global population.Subjects:Civics/Government, Economics,Environmental Science,Geography, Health, History,Science, Social Studies, Women’sStudiesSkills:Critical thinking, interpreting andanalyzing graphs and charts,problem solving, conductingresearch, working in a coopera-tive groupMethod:Through individual and groupwork, students investigate howour numbers shape the worldaround us and how our actionstoday will impact our future pop-ulation growth.
©2014 Population Connection A Quick Trip to 7 Billion: Where Do We Grow From Here
Introduction:The charts and graphs on the “Where do we grow from here” side ofthe poster show some of the ways that our human numbers arestraining our ability to depend on the natural resources that supportour most basic needs. Overall, we are healthier, wealthier, and bettereducated than ever before, yet there are still great challenges aheadfor our global family. We continue to deplete our natural resources atan unsustainable rate, nearly half of us still live on less than $2 a dayand our population is expected to continue growing through much ofthis century. However, there are things that can be done to help stabi-lize our population, protect the global environment and promotehuman dignity and well-being. In this activity, students will think criti-cally about how our human numbers have shaped the world aroundus and how our actions will impact our future growth.Materials: Computer with Internet access“A Quick Trip to 7 Billion” e-posterStudent Worksheets (“Where do we Grow From Here” and “7 Billion Solutions - What Can be Done?)Part 1: Where do we Grow From Here?Procedure:1. Direct students to our website, www.Worldof7Billion.org/teacher-resources/wall-chart. Allow students time to read the information,interpret the charts and graphs, and answer the questions on the student worksheet.2. Go over the answers as a class and discuss the following questions:a. Why do you think per capita consumption of meat has increased over the years? Do you think the demand will continue to increase? Why or why not? What might be the environmental impacts of more or less meat consumption in the future?
Answers will vary. Per capita meat consumption has increased, in part, because more people can afford to eat more meat.Generally, as income rises, so does meat consumption. This is like-ly to continue as emerging economies produce a larger middleclass. Environmental impacts of meat consumption include: clear-cutting forest for pastures and cropland to grow feed; greenhousegas emissions (methane), fertilizer and pesticide runoff, andwater use to raise cattle and grain for feed (it’s estimated thatabout half of all clean water worldwide is used to raise livestock).

©2014 Population Connection A Quick Trip to 7 Billion: Where Do We Grow From Here, page 2
b. The per capita use of paper and paperboard has steadily increased. What factors might haveled to this increase and do you think this trend will continue? What might this mean for thefuture?Answers will vary. An increase may be the result of more global industry, an increase in overallglobal wealth and consumerism has led to more packaging. With more people using electronicmedia, we may see a decline in this trend in the future.c. Dead zones occur in highly populated coastal areas, which is where there is also the highest concentration of aquatic life. What human behavior has led to the increase in the number of dead zones over the years? What do dead zones mean for aquatic life? While dead zones can occur naturally, most of the dead zones in the world today are the result of human behavior. Dead zones can be caused by use of fertilizers and pesticides, as well as runoff from sewage and urban land use. Fish, crabs, and clams cannot live in dead zones.d. The spike in the number of malnourished people in the world in 2009 was a result of anincrease in food prices around the world. What events or situations might cause food prices to rise? Could we prevent this from happening again? How? Food prices might rise if there is a drought, or other natural disasters that limit crop productionFood prices can also be affected by oil prices - when oil prices spike, the cost of fertilizers, foodproduction, and food transportation increases, leading to an increase in price. Students mightalso mention the use of crops for biofuels, like ethanol. Answers will vary regarding if and howwe could prevent a spike in food costs in the future.
Part 2: 7 Billion Solutions: What Can be Done?Procedure:In this portion of the activity, students brainstorm what can be done on both a global and localscale to help stabilize global population. 1. Give each student a copy of the worksheet, “Where do we grow from here?” 2. Divide students into small groups (4 or 5 students per group) and assign each group one of the 4 questions to work on (you may have multiple groups working on the same question - that’s okay). This will be their “Expert Group,” meaning they are all “experts” on this question.3. As they answer the question, students should share ideas and keep notes. Each student in the group is responsible for recording the answers as they will need to be able to share their answers with others. After all groups are finished with their question:3. Instruct students to form new groups that consist of at least one person from each Expert Group (one person from Question 1, one person from Question 2, etc.) This new group will be their“Sharing Group.” 4. Have students take turns sharing and discussing the answers to their questions in their new group. Students should record the answers that are shared within the group.

©2014 Population Connection
QUESTION 1:The UN estimates that world population will be over 10 billion by 2100. How might your life oryour children’s lives be different if this is true? What advancements do you think would have to bemade in education, medicine, environmental issues, and food and water supply in order to supporta global community of 10 billion people? What about 15.8 billion?We will live in a more crowded world and we will have to share our resources even more than we dotoday. There will be a greater risk of civil conflict as a result of resource competition, a risk of pro-gressing climate change along with its environmental implications, and greater risk of food and watershortages. Students may mention the need for better distribution of food and clean water, more effi-cient growth of food (using less water and/or land), more equitable food distribution, use and develop-ment of renewable energy sources, medical advancements in immunizations and sanitation.
QUESTION 2:What might influence which population projection we end up with in 2100? Most of our population growth today is occurring in developing countries. Our projection will dependon our ability to bring down the birth rates in these countries. It will also depend on the trends in moredeveloped countries – will countries that have reached replacement level fertility continue to have 2-child families?
QUESTION 3:Most population growth today is happening in less developed countries where birth rates are high.Look at the graphs for the UN’s three scenarios of population growth and the information in the“What Can be Done” and “Demographic Tale” sections of the poster. Based on this information, whatdo think we could do as a global society to help slow population growth in developing countries? Our ability to improve the living conditions in these developing countries will dictate our futuregrowth. Educating women, increasing life expectancy, decreasing infant mortality rates, and providingaccess to comprehensive family planning will all help to stabilize our population growth.
QUESTION 4:Research and discuss ways that YOU can be a part of the solution. Looking at the poster, can youthink of things that you and the people in your community could do to help slow population growthin developing countries and ensure that Earth’s finite resources will be able to support our globalfamily? Answers could relate to supporting micro-lending projects that allow more children (especially girls)to attend school, supporting organizations that encourage family planning, learning about projectsrelated to increased food production/distribution and water sanitation, discussing the issues sur-rounding population growth with your friends and family, being conscientious of your energy use andusing renewable energy wherever possible, cutting back on your meat and paper consumption.
A Quick Trip to 7 Billion: Where Do We Grow From Here, page 3

©2014 Population Connection
Name: ____________________________________ Date:_______________________________A Quick Trip to 7 Billion
Student Worksheet: Where do we grow from here?Go to our website, www.Worldof7Billion.org/teacher-resources/wall-chart. First, read through the textand interpret the charts and graphs. Based on the information on the poster, work individually orwith a partner to answer the following questions.1. Look at the diagram of the Demographic Transition Model. Countries in Stage 1 have little to no population growth. Why is this true? Looking at Stage 2, we see high birth rates and falling death rates, leading to population growth. What might cause a country’s death rate to decrease? 2. Look at Stage 3 of the Demographic Transition model. What is happening to birth rates? Whatmight explain this? 3. Look at the graphs for paper and meat consumption. How might these graphs be related to the increase in ocean dead zones, and to the depletion of Caribbean coral reefs and tropical rainforest? 4. In 2005, about what percent of the current population was under moderate water shortage? What percent was under extreme water shortage? Why might an increasing population lead to a higher percentage of our global population facing chronic water shortage?5. Look at the graph titled, “Energy Use Uneven Across the Globe.” What trends do you notice? How much more energy does the average North American consume versus an average Bangladeshi?6. Look at the graph titled, “Women’s Education and Fertility.” What can you tell about the relation-ship between women’s education level and fertility rates? What might be the reason for this? 7. Look at the graph for “Improving Child Health in Low Income Countries.” In recent years, we have seen the most gains in child health through an increase in vaccinations, while advancementsin basic sanitation and access to clean water have only been modest. Do you think that there is a reason for this?
A Quick Trip to 7 Billion: Where Do We Grow From Here, page 4
©2014 Population Connection A Quick Trip to 7 Billion: Where Do We Grow From Here, page 5
Name: ____________________________________ Date:_______________________________A Quick Trip to 7 Billion
Student Worksheet: 7 Billion Solutions - What Can Be Done?
What will you become the expert on? Circle one: QUESTION 1:The UN estimates that world population will be over 10 billion by 2100. How might your life or your children’s lives be different if this is true? What advancements do you think would have to be made in education, medicine, environmental issues, and food and water supply in order to support a global community of 10 billion people? What about 15.8 billion?QUESTION 2:What might influence which population projection we end up with in 2100?QUESTION 3:Most population growth today is happening in less developed countries where birth rates are high. Look at the graphs for the UN’s three scenarios of population growth, and the information in the “What Can be Done” and “Demographic Tale” sections of the poster. Based on this information, what do think we could do as a global society to help slow population growth in developing countries?QUESTION 4: Research and discuss ways related to this topic that YOU can be a part of the solution. Looking at the poster, can you think of things that you and the people in your community could do to help slow population growth in developing countries and ensure that Earth’s finite resources will be able to support our global family? In your group, discuss the answer to the question you circled above. In the space below, recordnotes from your group conversation. You will share these notes with others in your next group. Feelfree to conduct additional research to help you answer the question -- look at the “ResearchResources” listed on www.Worldof7Billion.org under the Student Video Contest tab. Additionalresources include: www.fao.org; www.who.int; and http://ngm.nationalgeographic.com/7-billion.My Notes:
Name: _____________________________________ Date:_______________________________A Quick Trip to 7 Billion
Student Worksheet: 7 Billion Solutions - What Can Be Done?
In the spaces below, record the answers from the other experts in your group.Question ____
Question ____
Question ____
©2014 Population Connection A Quick Trip to 7 Billion: Where Do We Grow From Here, page 6
A Quick Trip to 7 Billion
Student Worksheet Answers
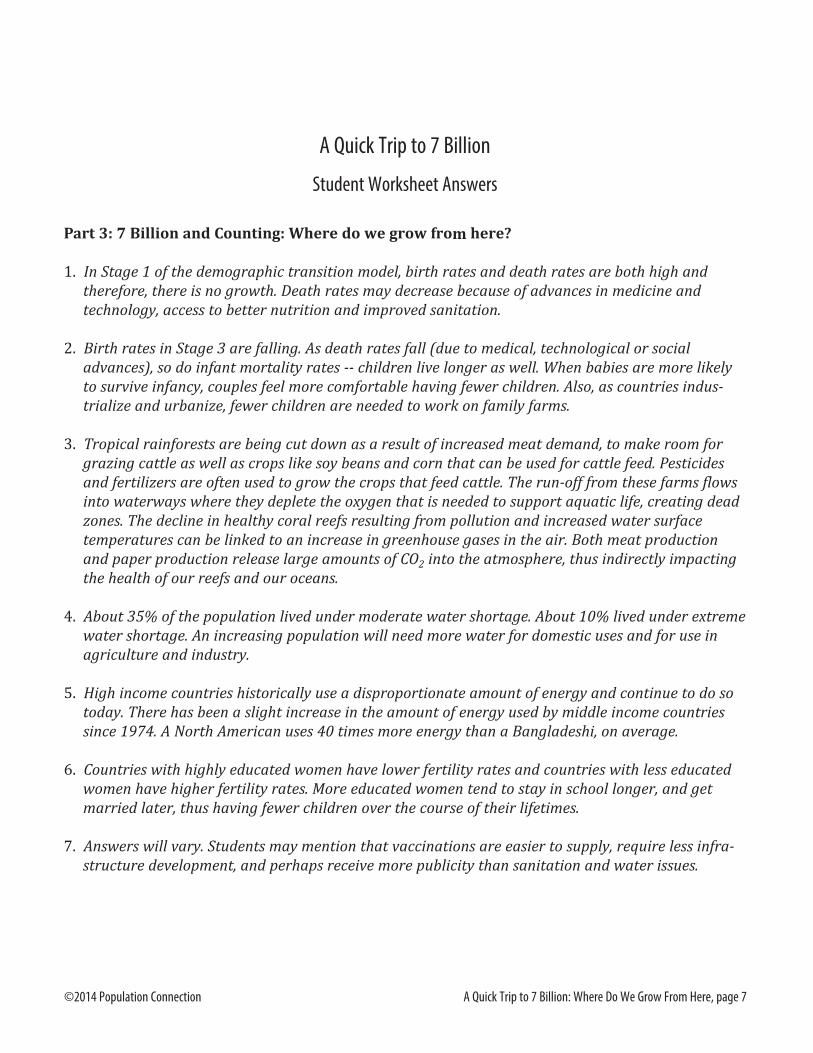
Part 3: 7 Billion and Counting: Where do we grow from here?1. In Stage 1 of the demographic transition model, birth rates and death rates are both high and therefore, there is no growth. Death rates may decrease because of advances in medicine and technology, access to better nutrition and improved sanitation.2. Birth rates in Stage 3 are falling. As death rates fall (due to medical, technological or social advances), so do infant mortality rates -- children live longer as well. When babies are more likely to survive infancy, couples feel more comfortable having fewer children. Also, as countries indus-trialize and urbanize, fewer children are needed to work on family farms.3. Tropical rainforests are being cut down as a result of increased meat demand, to make room for grazing cattle as well as crops like soy beans and corn that can be used for cattle feed. Pesticidesand fertilizers are often used to grow the crops that feed cattle. The run-off from these farms flowsinto waterways where they deplete the oxygen that is needed to support aquatic life, creating deadzones. The decline in healthy coral reefs resulting from pollution and increased water surface temperatures can be linked to an increase in greenhouse gases in the air. Both meat production and paper production release large amounts of CO2 into the atmosphere, thus indirectly impacting the health of our reefs and our oceans.4. About 35% of the population lived under moderate water shortage. About 10% lived under extreme water shortage. An increasing population will need more water for domestic uses and for use in agriculture and industry.5. High income countries historically use a disproportionate amount of energy and continue to do so today. There has been a slight increase in the amount of energy used by middle income countries since 1974. A North American uses 40 times more energy than a Bangladeshi, on average.6. Countries with highly educated women have lower fertility rates and countries with less educated women have higher fertility rates. More educated women tend to stay in school longer, and getmarried later, thus having fewer children over the course of their lifetimes. 7. Answers will vary. Students may mention that vaccinations are easier to supply, require less infra-structure development, and perhaps receive more publicity than sanitation and water issues.
A Quick Trip to 7 Billion: Where Do We Grow From Here, page 7©2014 Population Connection