when and how to use statistics in a ux world
TRANSCRIPT

WHEN AND HOW TO USE STATISTICSIN A UX WORLD
Niki Lin | [email protected] | +32 471 01 34 39
A primer about good use of statistics

Des McHale
THE AVERAGE HUMAN HAS ONE BREAST AND ONE TESTICLE
WHY ARE WE BAD WITH STATISTICS
We are good at assessing probability, but odds are we’re a bit off
1.

WE ARE AFRAID
OF SNAKES
NOT OF CARS
5
1. Why are we bad with statistics
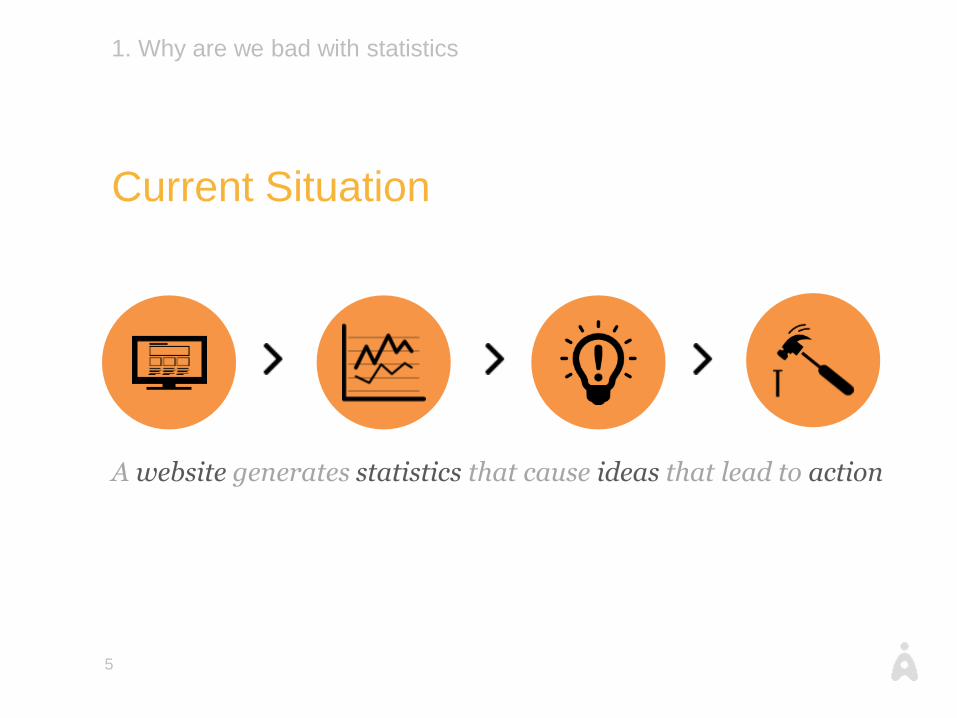
Current Situation
A website generates statistics that cause ideas that lead to action

MEASURE ANDCOMPARE
Compare to understand your measurement better
2.

77
2. Measure and Compare
Is this already being measured?
› If you are measuring it, chances are, someone else already has• For UX on websites: SUS
› Review published literature to see how other researchers measure• How are items phrased and compared
• What scales are being used
• How close do our methods match published findings

88

99

THE NEEDED PRECISION Do we shoot for the The Moon or Mars?
3.

11
3. Precision
Continuous statistics
• Google Analytics
measures everything
continuously
• This results in a different
approach to define a “test
group”
• When do we have enough
data to decide on an A/B
test?

12
3. Precision
Continuous statistics
› Strive for stabilization

13
3. Precision
Estimate example
• Idea: let’s set up a service
to sell t-shirts printed with
memes from 9gag.
• How can we estimate the
sales of this?

14
15
3. Precision
Estimate: Fermi equation
› Famously used by Drake to estimate the number of
extraterrestrial life
› Estimating things through the relation of entities

16
3. Precision
Fermi equation: 9gag T-shirt
› How many users are on 9gag each month
› What percentage of users requires a shirt that month
› What percentage of shirts sold are shirts with memes
› How long are users on the site each month
› How many memes are exposed per time frame
› What percentage of meme are liked enough to want a shirt

17
3. Precision
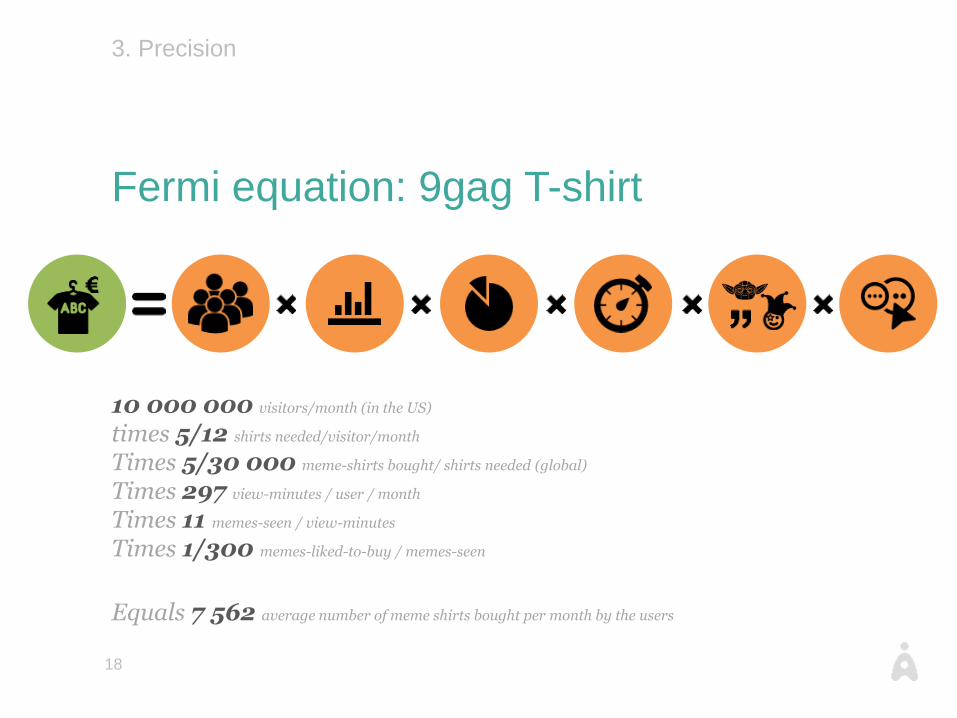
Fermi equation: 9gag T-shirt
Shirts Sold = Market Size x Need x Niche-interest x Time x Exposure x Selection
18
3. Precision
Fermi equation: 9gag T-shirt
10 000 000 visitors/month (in the US)
times 5/12 shirts needed/visitor/month
Times 5/30 000 meme-shirts bought/ shirts needed (global)
Times 297 view-minutes / user / month
Times 11 memes-seen / view-minutes
Times 1/300 memes-liked-to-buy / memes-seen
Equals 7 562 average number of meme shirts bought per month by the users

ACTIONS
Define actions before you even see the results
4.

20
Extreme Results?
› Reiterate: what part of estimating went wrong
› Learn from the experience

2121

22
4. What to do with all those results?
Back to the current Situation
A website generates statistics that cause ideas that lead to action

23
4. What to do with all those results?
Deciding afterwards…
Statistics that cause ideas that leads to action

24
4. What to do with all those results?
… results in an emotional decision
Statistics that cause ideas that leads to action are often emotional

25
4. What to do with all those results?
So what’s wrong?
A website generates statistics that cause ideas that lead to action

26
4. What to do with all those results?
Add a plan
Plan an action plan about statistics that defines action plans
B
A

27

CONCLUSIONS
5.

Niki Lin | [email protected] | +32 471 01 34 39