what’s eating python performance
TRANSCRIPT

what’s eating python performance
Piotr PrzymusNicolaus Copernicus University
1

about me
• Piotr Przymus PhD• work @ Nicolaus Copernicus University in Toruń• Interests: data mining and machine learning, databases,
GPGPU computing, high-performance computing.• 9 years of Python experience.
2

introduction
3

introduction
Programmers waste enormous amounts of time thinking about, orworrying about the speed of noncritical parts of their programs,and these attempts at efficiency actually have a strong negativeimpact when debugging and maintenance are considered. Weshould forget about small efficiencies, say about 97% of the time:premature optimisation is the root of all evil.
Donald Knuth, “Structured Programming With Go ToStatements”, 1974.
Yet we should not pass up our opportunities in that critical 3%.
4

premature optimisation
Premature optimisation may be stated as optimising code beforeknowing whether we need to.
This may be bad as it impacts:
• your productivity,• readability of the code,• ease of maintenance and debugging,• and it may contradict The Zen of Python ;).
Learn how to do proper assessment of your code in terms ofoptimisation needs!
Remember that a strong felling that your code falls into theremaining 3% does not count!
5

think before doing (think before coding)
Going for higher performance without a deeper reason may be justa waste of your time. So start with:
• stating your reasons (Why do you need higher performance?),• defining your goals (What would be an acceptable speed of
your code?),• estimating time and resources you are willing to spend to
achieve these goals.
Re-evaluate all the pros and cons.
6

why do you need higher performance?
Good reasons:
• Computation cost reduction• Significantly better user experience• Significantly faster results
7

what would be an acceptable speed of your code?
This is an important and a difficult to answer question!
• Computation cost reduction• Large projects with lots of computations• They may benefit just from few percent improvements.
• Significantly better user experience of web/desktopapplication.
• Note user experience is subjective, the user may:• not notice the difference,• or may not care about the change.
• The User is Always Right
• Significantly faster results• Scientific computing, Data mining, Machine learning• Large data sets processing• Example: going from weeks to one day makes a huge
difference. 8

amdahl’s law
Amdahl’s law is used to find the maximum expected improvementto an overall system when only part of the system is improved.(wiki)
• Often used in parallel computing to predict the theoreticalmaximum speedup.
• Assumes that the problem size remains the same!
Maximum expected improvement of a system, when only part ofthe computation is improved
improvment = 1(1 − P) + P
S
where:
• P is the proportion of improved computations,• S is the improvement ratio. 9
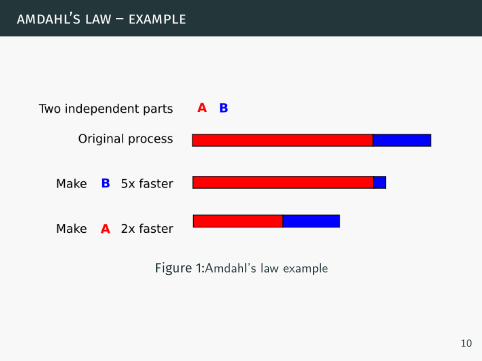
amdahl’s law – example
Figure 1:Amdahl’s law example
10

amdahl’s law – example
If we improve:
• 30% of computations,• so that they run twice as fast,
then P = 0.3 and S = 2, and the overall system improvement isonly
1(1 − 0.3) + 0.3
2= 1.1765.
11

test, measure, track down bottle-necks
12

test, measure, track down bottlenecks
A starting point for optimisation is a running code that givescorrect results.
• Prepare a regression test suite!
Then rest of the optimisation process may be summarized as:
1. Test if the code works correctly.2. Measure execution time
• if code is not fast enough use a profiler to identify thebottlenecks,
• else Your done!
3. Fix performance problems.4. Start from the beginning.
13

regression test suite
Before you start, prepare a regression test suite that:
• will guard the correctness of your code during theoptimisation.
• is comprehensive but yet quick-to-run.
Test will be ran very often – a reasonable execution time is a must!
14

measuring execution time
Measure execution time of your code. This is important because:
• it shows if you are getting any progress,• it shows how far it is from the desired execution time (a.k.a.
acceptable speed),• it allows you to compare various version of optimisations.
15

measuring execution time
There are various tools to do that, among them:
• Custom made timer,• Pythons timeit module,• unix time (use /usr/bin/time as time is also a common shell
built in).
16

timeit
A module provides a simple way to time small bits of Python code,has:
• command-line interface1 $ python −m t i m e i t ’ ”−” . j o i n ( [ s t r (n ) f o r n i n range (100)
] ) ’2 10000 loops , be s t o f 3 : 33.4 usec per loop3 $ python −m t i m e i t ’ ”−” . j o i n (map( s t r , range (100) ) ) ’4 10000 loops , be s t o f 3 : 25.2 usec per loop
• Python Interface1 >>> t i m e i t . t i m e i t ( ’ ”−”. j o i n ( [ s t r (n ) f o r n i n range (100)
] ) ’ , number=10000)2 0.72883081436157233 >>> t i m e i t . t i m e i t ( ’ ”−”. j o i n (map( s t r , range (100) ) ) ’ ,
number=10000)4 0.5858950614929199
17

/usr/bin/time -v – simple but useful1 Command being timed : ”python un ive r se−new . py”2 User time ( seconds ) : 0.383 System time ( seconds ) : 1.614 Percent of CPU t h i s job got : 26%5 Elapsed ( wa l l c lock ) time (h :mm: ss or m: s s ) : 0 :07 .466 Average shared tex t s i z e ( kbytes ) : 07 Average unshared data s i z e ( kbytes ) : 08 Average stack s i z e ( kbytes ) : 09 Average t o t a l s i z e ( kbytes ) : 0
10 Maximum r e s i d e n t se t s i z e ( kbytes ) : 2290011 Average r e s i d e n t se t s i z e ( kbytes ) : 012 Major ( r e q u i r i n g I /O) page f a u l t s : 6413 Minor ( r e c l a im ing a frame ) page f a u l t s : 637014 Voluntary context sw i tches : 339815 Invo lun ta ry context sw i tches : 12316 Swaps : 017 F i l e system inputs : 2565618 F i l e system outputs : 019 Socket messages sent : 020 Socket messages r e ce i v ed : 021 S igna l s d e l i v e r e d : 022 Page s i z e ( bytes ) : 409623 Ex i t s t a tu s : 0
18

measuring execution time
Notes on measuring:
• Try to measure multiple independent repetitions of your code.• Establish the lower bound of your execution time!
• Prepare a testing environment that will allow you to getcomparable results.
• Consider writing a micro benchmark to check variousalternative solutions of some algorithm.
• Be careful measuring speed using artificial data.• Re-validate using real data.
19

tracking down the bottlenecks
Profiling tools will give you a more in depth view of your codeperformance.
Take a view of your program internals in terms of
• execution time• and used memory.
20

tracking down the bottlenecks
There are various possible tools, like:
• vmprof – see next talk for details!• cProfile – a profiling module available in Python standard
library,• line_profiler – an external line-by line profiler,• tools for visualizing profiling results such as runsnakerun.
21

output of cprofile
cProfiler is a deterministic profiling of Python programs.
• command-line interface1 python -m cProfile [-o output_file] [-s
sort_order] myscript.py
• Python interface1 import cProfile2 import re3 cProfile.run('re.compile("foo|bar")')
22

output of cprofile
1 197 func t i on c a l l s (192 p r i m i t i v e c a l l s ) i n 0.002 seconds23 Ordered by : standard name45 n c a l l s tott ime p e r c a l l cumtime p e r c a l l f i l ename : l i n e n o ( func t i on )6 1 0.000 0.000 0.001 0.001 <s t r i ng >:1(<module>)7 1 0.000 0.000 0.001 0.001 re . py :212( compi le )8 1 0.000 0.000 0.001 0.001 re . py :268( _compile )9 1 0.000 0.000 0.000 0.000 sre_compi le . py :172( _compile_charset )
10 1 0.000 0.000 0.000 0.000 sre_compi le . py :201( _optimize_charset )11 4 0.000 0.000 0.000 0.000 sre_compi le . py :25( _ i d e n t i t y f u n c t i o n )12 3/1 0.000 0.000 0.000 0.000 sre_compi le . py :33( _compile )
23

usage of line_profile
1 @profile2 def do_stuff(numbers):3 print numbers4
5 numbers = 26 do_stuff(numbers)
24

output of line_profile
1 > python ”C:\ Python27\ S c r i p t s \ kernpro f . py” −l −v example . py2 23 Wrote p r o f i l e r e s u l t s to example . py . l p r o f4 Timer un i t : 3.2079e−07 s56 F i l e : example . py7 Function : do_stuf f at l i n e 28 Total time : 0.00185256 s9
10 Line # Hits Time Per Hit % Time Line Contents11 ==============================================================12 1 @ p r o f i l e13 2 def do_stuf f ( numbers ) :14 3 1 5775 5775.0 100.0 p r i n t numbers
25

runsnakerun
Figure 2:Runsnakerun26

io bound vs compute bound
Learn how to classify types of performance bounds.
• The compute bound – large number of instructions ismaking your code slow,
• the I/O bound – your code is slow because of various I/Ooperations, like:
• disk access, network delays, other I/O.
Depending on the type of the bound, different optimisationstrategies will apply.
27

fixing the cause: performance tips
28

algorithms and data structures
Improving your algorithms time complexity is probably the bestthing you could do to optimise your code!
• Micro optimisation tricks will not bring you anywhere near tothe speed boost you could get from improving time complexityof algorithm.
The big O notation matters!
• Check data structures used in your algorithms!• Check out Time complexity @ Python’s Wiki
29

algorithms and data structures – example
Innocent lookup code placed in a large loop may generate aperformance issue.
1 def sanitize_1(user_input , stop_words):2 """Sanitize using standard lists , new_list , iterate
over user_input check in stop_words list"""3 new_list = []4 for w in user_input: # longer list5 if w not in stop_words: # shorter list6 new_list.append(w)7 return new_list
• Real data (Project Guttenberg, extended English stop list)• Execution time 'pg11.txt': 2.4460400000000035, 'pg1342.txt
': 9.896383000000007, 'pg76.txt': 9.086391999999998
30

algorithms and data structures – example
Innocent lookup code placed in a large loop may generate aperformance issue.
1 def sanitize_1d(user_input , stop_words):2 """Sanitize using lists comprehension , iterate over
user_input , check in stop_words list"""3 return [w for w in user_input if w not in stop_words
]
• Real data (Project Guttenberg, extended English stop list)• Execution time 'pg11.txt': 2.4180460000000052, 'pg1342.txt
': 9.796099999999987, 'pg76.txt': 8.98378300000001
31

algorithms and data structures – example
Often a trivial change, like changing a list to a set, may be the keyto solving the problem.
1 def sanitize_2d(user_input , stop_words):2 """Sanitize using list comprehension and set"""3 # even better if stop_words is already a set4 stop_words = set(stop_words)5 return [w for w in user_input if w not in stop_words
]
• Real data (Project Guttenberg, extended English stop list)• Execution time
'pg11.txt': 0.02787999999999835, 'pg1342.txt':
0.1341930000000058, 'pg76.txt': 0.1227470000000066
Order of magnitude faster! 32

algorithms and data structures – in the wild
See excellent “A Python Optimization Anecdote” written by PavelPanchekha from Dropbox.
33

memory and i/o bounds
Some performance issues may be memory related, so checkmemory utilization! Typical symptoms that indicate that your codemay have memory problems:
• your program never releases memory,• or your program allocates way too much memory.
Also check if your code uses memory efficiently.
See may previous talk and references included therein.
• “Everything You Always Wanted to Know About Memory inPython But Were Afraid to Ask”
34

memory and i/o bounds
I/O bounds may require more effort to deal with. Depending onthe problem there may be various solutions, consider using:
• asynchronous I/O with Python• probabilistic and heuristic data structures instead of real data
• like Bloom filters,• which are used to test whether an element is a member of a
set,• false positive matches are possible, but false negatives are not.
• compressed data structures and lightweight compressionalgorithms
35
lightweight compression
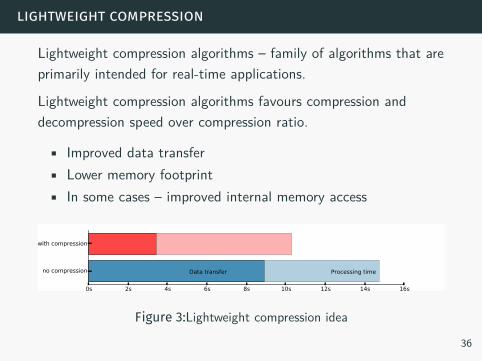
Lightweight compression algorithms – family of algorithms that areprimarily intended for real-time applications.
Lightweight compression algorithms favours compression anddecompression speed over compression ratio.
• Improved data transfer• Lower memory footprint• In some cases – improved internal memory access
0s 2s 4s 6s 8s 10s 12s 14s 16sTime seconds
no compression
with compression
Processing timeData transfer
Figure 3:Lightweight compression idea
36
lightweight compression
Lightweight compression algorithms in Python:
• bindings to Snappy, lz4, others.• write your own compression scheme.
Cassandra example:
Depending on the data characteristics of the table, compressing itsdata can result in:
• 2x-4x reduction in data size• 25-35% performance improvement on reads• 5-10% performance improvement on writes
Cassandra supports both Snappy and lz4.37

iteration independent calculations
Bring iteration-independent calculations outside of the loop.
This is a common sense and good practice.
• fix loops with code that performs computations that do notchange within loop,
Beware that such operations may be hidden in a class method or ina free function.
38
branching in large loops.
Try to avoid conditional branching in large loops.
Check whatever instead of having if/else statements in the loopbody:
• it is possible to do the conditional check outside the loop,• unroll branch in a loop,• have separate loops for different branches.
39

function inlining
Python introduces relatively high overhead for function/methodcalls.
In some cases it may be worth to consider code inlining to avoidthe overhead
• but this comes at a cost of code maintenance and readability.
40

function inlining
1 def sigmoid(x):2 return math.tanh(x)3
4 class BPNN:5 def update(self, inputs):6 ...7 for i in range(self.ni-1):8 self.ai[i] = sigmoid(inputs[i])9 ...
41

function inlining
1 class BPNN:2 def update(self, inputs):3 ...4 for i in range(self.ni-1):5 self.ai[i] = math.tanh(input[i])6 ...
42

other
• Use high performance datatypes – module Collections• Loop unrolling• Preallocation• string.intern• using locals instead of globals• improving lookup time of function
function/method/variable/attribute
43

notes on the special cases
Use the right tools:
• When your code involves numerics – use numpy, scipy andother specialized scientific libraries.
• This are highly optimised routines (usually based on externalscientific libraries).
• Consider pushing performance-critical code into C.
Remember to check your code with PyPy, you may be pleasantlysurprised.
44

notes on the special cases
Some problems may just need more computing power, so it may bea good idea to:
• write code that utilizes multi core architecture(mutliprocessing),
• or scale your code to multiple machines (task queues, spark,grid like environment),
• or using hardware accelerators (pyOpenCL, pyCuda, pyMIC,etc.)
45

final notes
• Optimize only when it is justified.• Measure, profile and test.• Optimization takes experimenting.
• Knowledge on what is going behind the scenes may help.
• Value your time. Performance tuning takes time, and yourtime is expensive.
• judging by conference hotel - our time is expensive ;)
46

references
1. A Python Optimization Anecdote, Pavel Panchekha, 2011,Dropbox.
2. Code optimization and its effects on Python, Karl-OskarMasing, 2013.
3. PythonSpeed, https://wiki.python.org4. PythonSpeed / Performance Tips, https://wiki.python.org5. Time complexity, https://wiki.python.org6. PythonSpeed / Profiling Python
Programs,https://wiki.python.org7. Performance, http://pypy.org8. Everything You Always Wanted to Know About Memory in
Python But Were Afraid to Ask, http://przymus.org
47