what does the public know about economic policy, and how
TRANSCRIPT

What Does the Public Know about Economic Policy, and How Does It Know It?
A long tradition in economic theory models economic policy deci-sions as solutions to optimization problems solved by rational and well-informed agents:1 a single policymaker minimizes a loss function subjectto some constraints. Another body of literature models policy decisions asif they were made by well-informed voters in elections of some sort.2
As everyone knows, each of these approaches is allegorical in somerespects, two of which are germane to this paper. First, apart from voteson school budgets and on some bond issues, economic (and other) policydecisions are rarely made by direct democracy. We instead utilize repre-sentative democracy, in which elected politicians decide on our behalf.Second, in many cases the agents making the decisions may be neither aswell informed nor as rational as homo economicus. Robert Blendon andhis coauthors, for example, find large gaps between measured economicperformance and the public’s perception thereof.3
327
A L A N S . B L I N D E RPrinceton University
A L A N B . K R U E G E RPrinceton University
We are indebted to Ed Freeland, Jesse Thomas, Marc Weiner, and the staff at thePrinceton Survey Research Center for help in conducting the survey used in this paper; toPrinceton’s Center for Economic Policy Studies for research support; to Jane Garrison,Courtney Stoddard, and Kathleen Hurley for expert assistance; and to members of theBrookings Panel for helpful suggestions.
1. “Well informed” need not connote perfectly informed. A large literature, of course,deals with imperfect information.
2. Black (1948) is an early reference on the median voter model. Downs (1957)extended the model to allow for political parties. See Persson and Tabellini (2000) for amodern treatment of political economy.
3. Blendon and others (1997).
2259-04-Blinder.qxd 8/6/04 11:20 Page 327

Monetary policy decisionmaking may perhaps approximate the lossfunction model. Decisions there are made by a technocrat or by a commit-tee of technocrats, many of whom think like (or are) economists.4 But fis-cal policy clearly is not made this way. Even if one models the presidentof the United States as minimizing a loss function, the president’s recom-mendation is just the starting point of a long process of political horsetrading. There may be 536 relevant loss functions rather than just one—and they will not all be the same. Similarly, a complex brew of politiciansmakes the major decisions in virtually all other areas of economic policy:labor laws, tax laws, environmental policy, and social insurance pro-grams, to name just a few.5
Of course, the fact that the voting and loss function models are alle-gorical does not necessarily make them misleading, when interpreted as“as if” hypotheses. But to make a judgment on the applicability of thesemodels of decisionmaking, it seems worth digging down deeper into theactual processes that guide policymaking. This paper takes a step in thatdirection.
Specifically, we take it as axiomatic that, first, the political mechanismmakes almost all important economic policy decisions, and second, thedecisions of elected politicians are heavily influenced by public opinion.These are hardly dazzling insights. The first statement is simply a fact; itis also central to both standard approaches to the economic theory of pol-icymaking: loss functions and voting. The second is rarely discussed byeconomists in their scholarly work. But its importance is apparent fromthe tremendous resources that politicians devote to assessing public opin-ion, and there is plenty of supportive evidence in political science.6
Legitimate doubts have been raised about whether the types of ques-tions commonly asked in public opinion polls elicit individuals’ true pref-erences.7 That is not our question here, because understanding thedeterminants of public opinion as expressed in standard polls remains
328 Brookings Papers on Economic Activity, 1:2004
4. On the difference between individual and group decisionmaking in monetary policy,see Blinder and Morgan (forthcoming).
5. Why this is so is an interesting question that we do not deal with here. See Blinder(1997).
6. Among the many references that could be cited, see Page and Shapiro (1983) andMonroe (1979).
7. See, for example, Kahneman (1986).
2259-04-Blinder.qxd 8/6/04 11:20 Page 328

important as long as these polls influence politicians’ policy decisions.This point remains valid irrespective of whether people understand theissues well or are confused about them, whether they are self-interested orpublic spirited, and whether they are well informed or poorly informed.
If we accept these points, a host of interesting questions arise, two ofwhich are the foci of this paper. First, to what extent is mass public opin-ion shaped by political ideology, self-interest, and—don’t laugh—economic knowledge? Second, to the extent that knowledge is relevant toopinions on economic issues, how do people inform themselves?
This paper offers many detailed answers to these and related questions,and so it may be useful to begin with a broad characterization that mayhelp the reader see the forest amid all the trees to follow. Subject to manycaveats, our main finding is that ideology is the most consistently impor-tant determinant of public opinion on a number of major economic policyissues, and objective measures of material self-interest are the leastimportant.8 Knowledge about the economy ranks somewhere in between:sometimes it is important, sometimes not. To us, this does not paint a pic-ture in which homo economicus is in charge.
Our evidence comes from a unique, new telephone survey of a randomsample of the U.S. population age eighteen and older. We begin by settingup a recursive model of the formulation of public opinion. Next weexplain the survey that we designed and implemented and discuss some ofthe specific questions.9 The two lengthy sections that follow make upmost of the paper. The first discusses some of the more interesting tabula-tions and cross-tabulations of the data; these are the straight facts. Thesecond presents estimates of our econometric model of public opinion.We conclude with some overarching, although admittedly speculative,interpretations of our findings.
Alan S. Blinder and Alan B. Krueger 329
8. Our findings are consistent with Citrin and Green’s (1990, pp. 16–17) survey of thepolitical science literature, which concludes, “Taken as a group, the studies summarizedabove appear devastating for the claim that self-interest, defined narrowly as the pursuit ofimmediate material benefits, is the central motive underlying American public opinion. . . .When self-interest effects did appear, they generally were weaker than the influence ofalternative sources of opinions such as values, feelings of group solidarity or ideology.”
9. We do not include the survey instrument here because it is long (over forty pages)and somewhat hard to read owing to complexities in the skip pattern. It is available, alongwith additional descriptive statistics, under “Economic Issues Survey” on the website of thePrinceton Survey Research Center at www.wws.princeton.edu/~psrc/surveys.html.
2259-04-Blinder.qxd 8/6/04 11:20 Page 329

On The Determinants of Public Opinion
To formulate an estimable model of how public opinion on economicpolicy issues is formed, we work backward. To the extent that the processis rational at the individual level, a person’s position on an issue shoulddepend on her self-interest, her ideology or “values,” her factual knowl-edge and conceptual understanding of the issue, and the degree to whichshe bases her decision on self-interest rather than her perception of whatis in the public interest.10 The last of these is likely the hardest to measure,even by asking people. Our basic model is
where OP is the opinion of person i at the time of the survey, SI is self-interest, ID is ideology, K is knowledge, ED is education, X is a vector ofother “demographic” variables such as race, sex, age, and income, and e1i
is an error term. (There might well be lags in this process, but we have notime-series information.)
Our survey elicits some information about each respondent’s ideologyand self-interest. But we make no attempt to explain how any particularperson’s values and ideology were formed, or why his or her self-interestis what it is. We simply treat these variables as econometrically exoge-nous. (For example, one of our “self-interest” variables is income, but wemake no attempt to explain family income.) Our main focus is on theacquisition of information, where the survey probed much more deeply.
The amount and kind of knowledge a person has on any particular eco-nomic issue ought to depend on the costs and benefits of acquiring suchknowledge. Our survey was thus designed not only to measure how wellinformed respondents are, but also how and where they get their informa-tion. Thus,
where D is a survey measure of how strongly the respondent desires to beinformed about the economy and economic policy, S is a vector repre-senting the sources of information that the individual uses, and Q is an
( ) ( , , , , ) ,2 2K ED D S Q X ei i i i i i i= +g
( ) ( , , , , ) ,1 1OP SI ID K ED X ei i i i i i i= +f
330 Brookings Papers on Economic Activity, 1:2004
10. See Zaller (1992) for an alternative, although related, framework for how individu-als acquire and transform information into responses to public opinion questions. Unlikeours, Zaller’s model does not start by assuming rationality.
2259-04-Blinder.qxd 8/6/04 11:20 Page 330

indicator of the quantity or intensity of information. These variables aredefined in the next section.
Finally, we try to explain why people do or do not choose to informthemselves, and in what ways:
So, and now working forward from “causes” to “effects,” our model saysthat people’s education, desire to be informed, self-interest, and ideologycombine to determine how much information—and what kinds of infor-mation—they acquire (equations 3, 4, and 5). This information, alongwith their education and desire to be informed, determines their knowl-edge of an issue (equation 2). And this knowledge, along with their ideol-ogy and self-interest, determines their opinions (equation 1). We payclosest attention to equations 1, 2, and 3: (in reverse order) how peopleinform themselves, the determinants of knowledge, and the determinantsof mass public opinion.
The Survey
In the spring of 2003 we conducted a telephone survey of a randomsample of the U.S. population eighteen and older, using random-digitdialing.11 As is typical for surveys of this type, the response rate (calcu-lated according to American Association of Public Opinion Researchguidelines) was low: just 26 percent of working residential numbers. But,perhaps surprisingly, the available evidence does not suggest that suchlow response rates lead to major statistical biases.12 We completed 1,002interviews and then weighted the responses to match the March 2002 pop-
( ) ( , , , ) .5 3 5D ED SI ID X ei i i i i i= +h
( ) ( , , , , )4 2 4Q ED D SI ID X ei i i i i i i= +h
( ) ( , , , , )3 1 3S ED D SI ID X ei i i i i i i= +h
Alan S. Blinder and Alan B. Krueger 331
11. The survey was conducted by Princeton University’s Survey Research Center. Theinterviews began on March 28 and ended on June 3. In the case of “no answers,” the surveyprotocols called for up to eight callbacks. It has been suggested to us that mentioningPrinceton University might have affected the response rates. But the sample did not appearexceptional in terms of education, age, or other objective attributes.
12. See, for example, Keeter and others (2000).
2259-04-Blinder.qxd 8/6/04 11:20 Page 331
ulation estimates of the U.S. Census Bureau’s Current Population Survey(CPS) in the following five respects: race, age, sex, education, and geo-graphical region.13 All the results reported in this paper reflect thatweighting.
The survey, which typically took twelve to seventeen minutes toadminister, began with a series of questions about economic policy issues,some of which are factual and some of which solicit the respondent’sopinion. An example of the former is
“Roughly what size (in billions of dollars) is this year’s federal budget deficit?”
An example of the latter is
“Do you think the federal budget deficit ought to be reduced?”
The five policy issues we dealt with are taxes, the federal budget deficit,the minimum wage, Social Security, and health insurance. Each issueinvolves several questions. In some cases (detailed below), the orderingof the questions was randomized. But the ordering rarely mattered.
After thus giving people an idea of the sort of economic policy issuesin which we were interested, the survey went on to inquire about how theybecome informed about such issues. The transition question to that part ofthe survey was
“Next, we’d like to know how important it is to you to keep well informedabout major economic policy issues, such as the ones we have just been dis-cussing. Would you say it is extremely important, very important, somewhatimportant, not very important, or not important at all?” (emphasis added)
The answers to this question comprise the “desire to be informed” vari-able, Di , in equations 3, 4, and 5. Notice the deliberate framing of whatwe mean by “major economic policy issues.”
That initial question about the importance of information was followedby a series of inquiries into “the sources of information you use, either tolearn about economic issues or to learn the opinions of others on theseissues.” One prototypical example is
“Do you watch television regularly, occasionally, or not at all to learn abouteconomic issues?”
332 Brookings Papers on Economic Activity, 1:2004
13. Without this weighting, women, senior citizens, the college educated, and non-Hispanic whites would all have been overrepresented. The weights for each observation arederived from an iterative procedure that balances the five variables. Thus we do not matchthe CPS counts exactly.
2259-04-Blinder.qxd 8/6/04 11:20 Page 332
Similar questions were asked for ten other sources of information: radio,newspapers, magazines, books, statements by political leaders, statementsby business leaders, statements by economists, statements by civic or reli-gious leaders, discussions with friends and relatives, and the Internet (inthat order). Most people presumably encounter statements by politicalleaders, business leaders, or economists via one of the standard mediachannels (such as television or newspapers). But, in our judgment, infor-mation from these three groups of “experts” was sufficiently differentfrom the standard media fare that they merited inclusion on their own.
The final section of the survey collected data on individual characteris-tics, including the usual demographic variables (such as race, age, andsex), but also including several less standard variables that relate to thefive policy issues, such as income, whether the person reported voting inthe 2000 election, whether the respondent was covered by health insur-ance, and whether the respondent’s parents were alive.
Some Straight Facts
There are no well-accepted models of the phenomena we are studying,the directions of causation among the variables we have collected are notalways obvious (and in some cases causation is clearly bidirectional), andwe have a paucity of truly exogenous variables (race, sex, and age beingthe only unexceptionable ones). Valid objections can therefore surely beraised against any identifying assumptions we might propose in formulat-ing a regression model, such as the recursive structure we impose.Undaunted, we will nonetheless do so when we estimate econometricmodels later. But before jumping into such controversial waters, we firstprovide an exploratory analysis of the data without imposing any structureon them.
The Demand for Economic Information
We begin with the desire to be informed, the variable D in the model.Almost 24 percent of respondents said it was “extremely important” tokeep well informed about major economic policy issues, and just over50 percent said it was “very important.” Another 23.5 percent character-ized keeping well informed as “somewhat important,” leaving fewer than
Alan S. Blinder and Alan B. Krueger 333
2259-04-Blinder.qxd 8/6/04 11:20 Page 333

3 percent of the sample in the “not very important” or “not important atall” categories. Frankly, we were surprised—and pleased—by thestrength of the expressed desire to be informed.14
When we look across subgroups of the population, the answers to thisquestion do not vary significantly (at the 5 percent level) by race, sex,education, or income. But older respondents expressed a slightly strongerdesire to be well informed. We also divided the sample into those whowere working at the time of the survey (56 percent of the sample) andthose who were not. The working population turned out to have a slightlyweaker desire to be informed than the heterogeneous nonworking group,which includes the unemployed, retirees, homemakers, and students.
In a survey that inquires about information relevant to economic policyissues, we expected to find many systematic differences by political ideol-ogy. So respondents were asked to classify themselves as liberal (15 per-cent of our sample), conservative (29 percent), moderate (19 percent),other (4 percent), or “haven’t thought much about it” (33 percent). Asshorthand, we refer to the last group—the largest—as the “nonpoliticals.”Using all five categories in a χ2 test of independence, we find little evi-dence of differences by ideology in the desire to be informed (χ2 = 28.6,p = 0.133).
However, we do find rather strong differences with respect to a vari-able that might be called “political engagement” (rather than partisan-ship). We asked respondents whether they had voted in the 2000presidential election. The answers to this question do not accurately rep-resent actual voting behavior, since 68 percent of our respondents claimedto have voted, whereas the national data show that only 51 percent of thevoting-age population actually did vote.15 The data may instead indicate
334 Brookings Papers on Economic Activity, 1:2004
14. The interviewers’ script began, “Hi. My name is _____, and I’m calling fromPrinceton University to conduct a fifteen-minute survey about economics and access toeconomic information.” Given this preface, perhaps respondents believed they shouldexpress a desire to be informed. On the other hand, the question about desire to be informedcame after a series of daunting questions on policy issues, which may have deflated somerespondents’ beliefs about how well informed they actually were.
15. See the Federal Election Commission data at www.fec.gov/pages/2000turnout/reg&to00.htm. If our sample is representative, and voters accurately reported that theyvoted, our finding implies that 34.7 percent (0.17 × 0.49 × 100) of nonvoters reported vot-ing. This figure is a bit higher than found in surveys for earlier elections, but very close tothe overreporting of voting found for the 2000 election. Silver, Anderson, and Abramson(1986) find that 27.4 percent of nonvoters reported voting in 1964, 31.4 percent in 1976,and 27.4 percent in 1980. The self-reported voting rate in the 2000 election based on the
2259-04-Blinder.qxd 8/6/04 11:20 Page 334

which respondents believe they should have voted (as well as those whoactually voted). In any case the self-described “voters” were considerablyand significantly (χ2 = 26.0, p = 0.001) more interested in keepinginformed than were the nonvoters. Fully 78 percent of “voters” said keep-ing well informed was either extremely or very important to them, versusonly 66 percent of nonvoters. This strong correlation supports our viewthat self-professed voting is an indicator of political engagement. As fur-ther support of the notion that the “nonpoliticals” are disengaged, we notethat only 47 percent of them reported having voted in 2000, versus 79 per-cent of everyone else.
Multiple regression estimates of equation 5 were not very informative,however, and hence are not reported. We began by estimating an orderedprobit model using the three regressors suggested by the simple correla-tions: age, working status, and whether the individual claimed to havevoted. Only the last of these was significant. We then experimented with avariety of demographic, ideology, and self-interest variables, as per equa-tion 5, but found hardly any other significant regressors. In a word, ourability to predict a person’s desire to be informed based on measurablevariables is negligible.
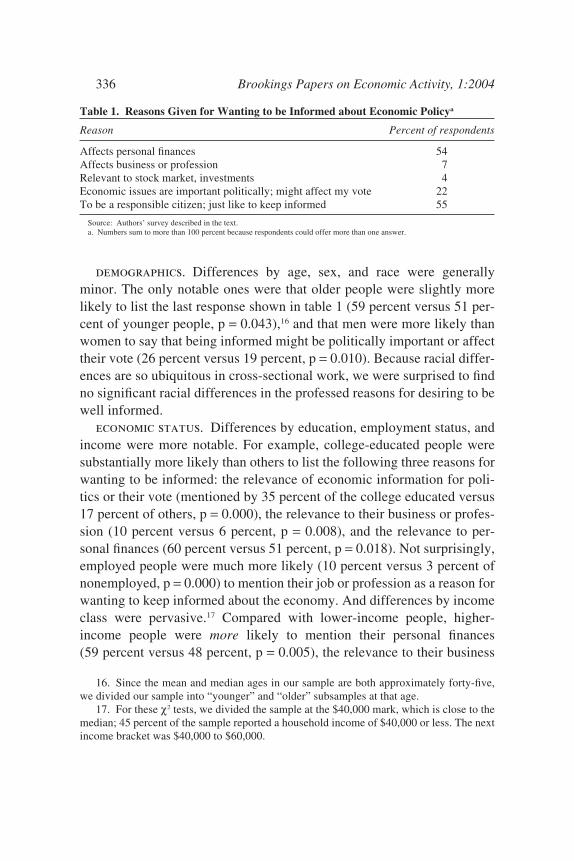
The next survey question asked each respondent who said that beinginformed was at least “somewhat important” to state “the main reasonswhy you wish to be well informed.” The choices listed were the fiveshown in table 1 (respondents could choose more than one reason). Justover half of our respondents gave the last response, which might be calledthe “civics class” answer. But, perhaps inconsistently, only 22 percentoffered politics or voting as a reason. Slightly more than half mentionedthe relevance of economic issues to their personal finances. But, in a bigsurprise to us, only 4 percent specifically mentioned the stock market as areason for wanting to keep informed.
Do these answers vary by personal characteristics? The only generalanswer, derived from the results below, is “somewhat.”
Alan S. Blinder and Alan B. Krueger 335
National Election Survey, which includes citizens only, exceeded the actual voting rate ofcitizens by 17 percentage points (McDonald, 2003), the same as in our data. The voting rateof citizens in 2000 was 55 percent, which implies that 39 percent of citizens who did notvote reported that they had voted, slightly higher than the rate for all respondents (citizensand noncitizens) in our sample. Note also that some respondents would not have been oldenough to vote in 2000. When those under 21 are omitted from the sample, the share claim-ing to have voted rises to 72 percent.
2259-04-Blinder.qxd 8/6/04 11:20 Page 335
demographics. Differences by age, sex, and race were generallyminor. The only notable ones were that older people were slightly morelikely to list the last response shown in table 1 (59 percent versus 51 per-cent of younger people, p = 0.043),16 and that men were more likely thanwomen to say that being informed might be politically important or affecttheir vote (26 percent versus 19 percent, p = 0.010). Because racial differ-ences are so ubiquitous in cross-sectional work, we were surprised to findno significant racial differences in the professed reasons for desiring to bewell informed.
economic status. Differences by education, employment status, andincome were more notable. For example, college-educated people weresubstantially more likely than others to list the following three reasons forwanting to be informed: the relevance of economic information for poli-tics or their vote (mentioned by 35 percent of the college educated versus17 percent of others, p = 0.000), the relevance to their business or profes-sion (10 percent versus 6 percent, p = 0.008), and the relevance to per-sonal finances (60 percent versus 51 percent, p = 0.018). Not surprisingly,employed people were much more likely (10 percent versus 3 percent ofnonemployed, p = 0.000) to mention their job or profession as a reason forwanting to keep informed about the economy. And differences by incomeclass were pervasive.17 Compared with lower-income people, higher-income people were more likely to mention their personal finances(59 percent versus 48 percent, p = 0.005), the relevance to their business
336 Brookings Papers on Economic Activity, 1:2004
16. Since the mean and median ages in our sample are both approximately forty-five,we divided our sample into “younger” and “older” subsamples at that age.
17. For these χ2 tests, we divided the sample at the $40,000 mark, which is close to themedian; 45 percent of the sample reported a household income of $40,000 or less. The nextincome bracket was $40,000 to $60,000.
Table 1. Reasons Given for Wanting to be Informed about Economic Policya
Reason Percent of respondents
Affects personal finances 54Affects business or profession 7Relevant to stock market, investments 4Economic issues are important politically; might affect my vote 22To be a responsible citizen; just like to keep informed 55
Source: Authors’ survey described in the text.a. Numbers sum to more than 100 percent because respondents could offer more than one answer.
2259-04-Blinder.qxd 8/6/04 11:20 Page 336

or profession (10 percent versus 4 percent, p = 0.001), and the relevanceto politics and voting (26 percent versus 18 percent, p = 0.025), but lesslikely to mention their general desire to be well-informed (50 percent ver-sus 62 percent, p = 0.004).
political involvement. Respondents of different political ideolo-gies differed only in how often they mentioned politics or voting as a rea-son for keeping informed. However, this difference appears to be more amatter of detachment than of ideology: nonpoliticals were substantiallyless likely to cite politics (only 8 percent did so) than either liberals(27 percent), conservatives (28 percent), or moderates (31 percent).Across these four categories, the χ2 test of independence is highly signifi-cant (χ2 = 52.4, p = 0.000). Consistent with this, self-described voterswere much more likely than nonvoters to cite politics or voting as a rea-son to keep informed (27 percent versus 12 percent, p = 0.000).
The Sources of Economic Information
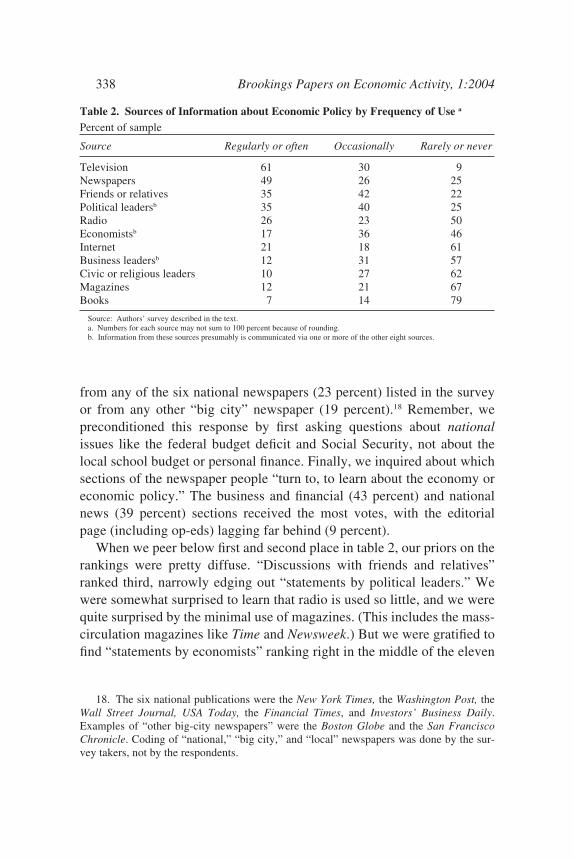
The lengthiest part of the questionnaire inquired about the sources ofinformation people use to inform themselves. As mentioned in the previ-ous section, we asked about the frequency of use of each of eleven possi-ble sources of information about economic issues, and we coded theresponses as either “regularly or often,” “occasionally,” or “rarely ornever.” Table 2 ranks the eleven sources from the most frequently used(television) to the least (books). It is hardly surprising that television is themost popular source of information—which it is by a substantial margin.
We followed this question by asking respondents whether they “learnmore about economics from the networks, from cable, or about the samefrom both,” with the following results:
Network stations 17 percentCable stations 28 percentAbout the same 44 percent.
Although it reaches many fewer viewers, cable has a noticeable edge.Nor is it surprising that newspapers rank second as a source of eco-
nomic information. But we would not have predicted that more people(54 percent) get their economic information from local newspapers than
Alan S. Blinder and Alan B. Krueger 337
2259-04-Blinder.qxd 8/6/04 11:20 Page 337
from any of the six national newspapers (23 percent) listed in the surveyor from any other “big city” newspaper (19 percent).18 Remember, wepreconditioned this response by first asking questions about nationalissues like the federal budget deficit and Social Security, not about thelocal school budget or personal finance. Finally, we inquired about whichsections of the newspaper people “turn to, to learn about the economy oreconomic policy.” The business and financial (43 percent) and nationalnews (39 percent) sections received the most votes, with the editorialpage (including op-eds) lagging far behind (9 percent).
When we peer below first and second place in table 2, our priors on therankings were pretty diffuse. “Discussions with friends and relatives”ranked third, narrowly edging out “statements by political leaders.” Wewere somewhat surprised to learn that radio is used so little, and we werequite surprised by the minimal use of magazines. (This includes the mass-circulation magazines like Time and Newsweek.) But we were gratified tofind “statements by economists” ranking right in the middle of the eleven
338 Brookings Papers on Economic Activity, 1:2004
18. The six national publications were the New York Times, the Washington Post, theWall Street Journal, USA Today, the Financial Times, and Investors’ Business Daily.Examples of “other big-city newspapers” were the Boston Globe and the San FranciscoChronicle. Coding of “national,” “big city,” and “local” newspapers was done by the sur-vey takers, not by the respondents.
Table 2. Sources of Information about Economic Policy by Frequency of Use a
Percent of sample
Source Regularly or often Occasionally Rarely or never
Television 61 30 9Newspapers 49 26 25Friends or relatives 35 42 22Political leadersb 35 40 25Radio 26 23 50Economistsb 17 36 46Internet 21 18 61Business leadersb 12 31 57Civic or religious leaders 10 27 62Magazines 12 21 67Books 7 14 79
Source: Authors’ survey described in the text.a. Numbers for each source may not sum to 100 percent because of rounding.b. Information from these sources presumably is communicated via one or more of the other eight sources.
2259-04-Blinder.qxd 8/6/04 11:20 Page 338

sources,19 beating out the Internet, business leaders, civic or religiousleaders, magazines, and books.20 Finally, table 2 probably underestimatesthe dominance of television, because many people probably hear theviews of political leaders, economists, and business leaders on television,although some of this information also comes from radio, magazines, theInternet, and newspapers, of course.
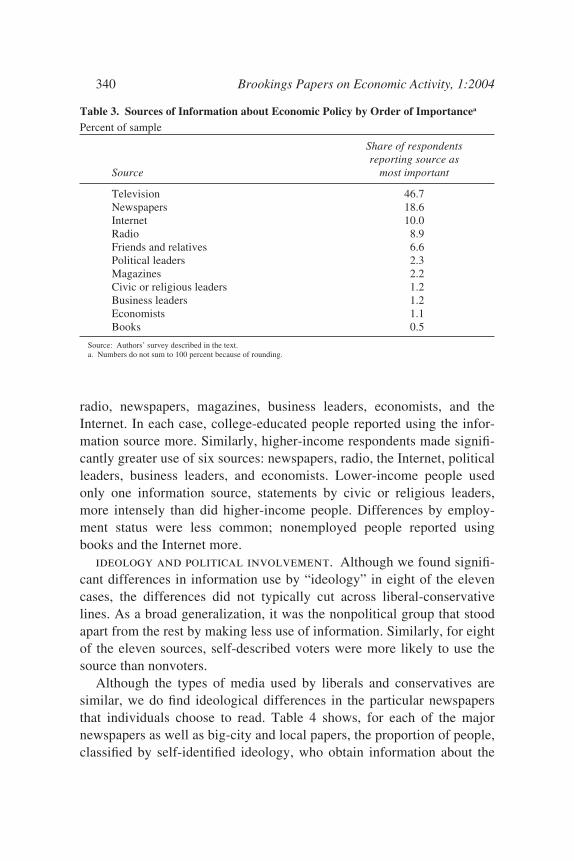
We concluded the section on sources of information by reading back toeach respondent the list of sources he or she had reported using “regularlyor often” and then asking, “which . . . is your most important source ofinformation on economics or economic policy?” By this alternative crite-rion, the ranking of sources is rather different (table 3). Television andnewspapers still rank first and second, respectively, but the margin fortelevision is now enormous. After that, the rankings in table 3 differnoticeably from those in table 2. For example, the Internet ranks muchhigher and, alas, economists rank much lower. Overall, the rank correla-tion between tables 2 and 3 is 0.76.
In a word, television tops the list of sources from which our respon-dents get their economic information; everything else lags well behind.But not all people are alike. As we did with the reasons for desiring to beinformed, we next looked for statistically significant (at the 5 percentlevel) differences in the frequency of use of the sources of information bydemographics, economic status, and political engagement. There weremany, so we summarize them briefly.
demographics. Our χ2 tests show that older respondents made signif-icantly greater use of most, but not all, sources of information. Butyounger respondents used radio and the Internet more. Men reported mak-ing greater use of radio, business leaders, economists, and the Internet,whereas women reported greater use of civic or religious leaders. Racialdifferences were less common: whites used television more, and non-whites used magazines, books, and civic and religious leaders more.
education and economic status. We found significant differencesby respondent’s level of education in the use of six of the eleven sources:
Alan S. Blinder and Alan B. Krueger 339
19. About one-sixth of the people who said they learn about the economy from econo-mists “regularly” or “occasionally” specifically mentioned Alan Greenspan as the econo-mist. We did not prompt that response.
20. Where the rankings of the distributions shown in table 2 were ambiguous, webroke the tie by assigning point scores as follows: regularly or often = 3, occasionally = 2,rarely = 1.
2259-04-Blinder.qxd 8/6/04 11:20 Page 339
radio, newspapers, magazines, business leaders, economists, and theInternet. In each case, college-educated people reported using the infor-mation source more. Similarly, higher-income respondents made signifi-cantly greater use of six sources: newspapers, radio, the Internet, politicalleaders, business leaders, and economists. Lower-income people usedonly one information source, statements by civic or religious leaders,more intensely than did higher-income people. Differences by employ-ment status were less common; nonemployed people reported usingbooks and the Internet more.
ideology and political involvement. Although we found signifi-cant differences in information use by “ideology” in eight of the elevencases, the differences did not typically cut across liberal-conservativelines. As a broad generalization, it was the nonpolitical group that stoodapart from the rest by making less use of information. Similarly, for eightof the eleven sources, self-described voters were more likely to use thesource than nonvoters.
Although the types of media used by liberals and conservatives aresimilar, we do find ideological differences in the particular newspapersthat individuals choose to read. Table 4 shows, for each of the majornewspapers as well as big-city and local papers, the proportion of people,classified by self-identified ideology, who obtain information about the
340 Brookings Papers on Economic Activity, 1:2004
Table 3. Sources of Information about Economic Policy by Order of Importancea
Percent of sample
Share of respondents reporting source as
Source most important
Television 46.7Newspapers 18.6Internet 10.0Radio 8.9Friends and relatives 6.6Political leaders 2.3Magazines 2.2Civic or religious leaders 1.2Business leaders 1.2Economists 1.1Books 0.5
Source: Authors’ survey described in the text.a. Numbers do not sum to 100 percent because of rounding.
2259-04-Blinder.qxd 8/6/04 11:20 Page 340
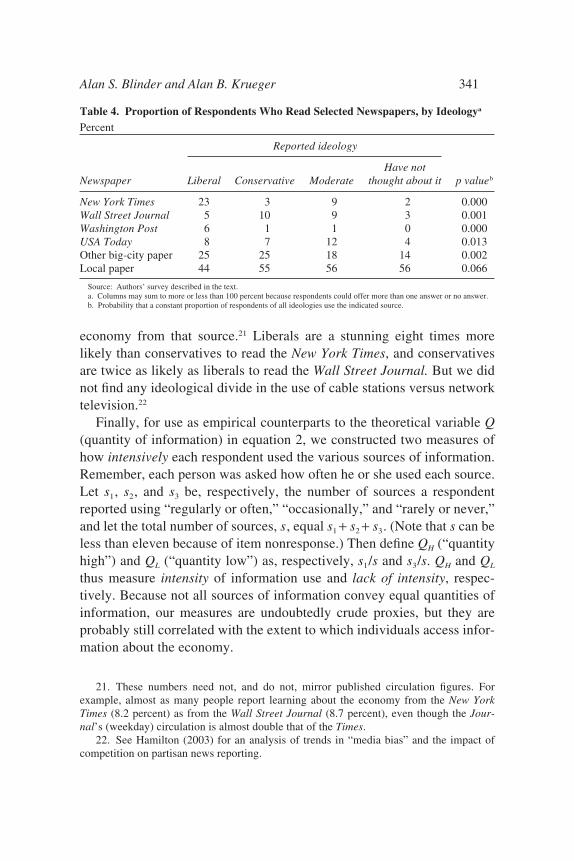
economy from that source.21 Liberals are a stunning eight times morelikely than conservatives to read the New York Times, and conservativesare twice as likely as liberals to read the Wall Street Journal. But we didnot find any ideological divide in the use of cable stations versus networktelevision.22
Finally, for use as empirical counterparts to the theoretical variable Q(quantity of information) in equation 2, we constructed two measures ofhow intensively each respondent used the various sources of information.Remember, each person was asked how often he or she used each source.Let s1, s2, and s3 be, respectively, the number of sources a respondentreported using “regularly or often,” “occasionally,” and “rarely or never,”and let the total number of sources, s, equal s1 + s2 + s3. (Note that s can beless than eleven because of item nonresponse.) Then define QH (“quantityhigh”) and QL (“quantity low”) as, respectively, s1/s and s3/s. QH and QL
thus measure intensity of information use and lack of intensity, respec-tively. Because not all sources of information convey equal quantities ofinformation, our measures are undoubtedly crude proxies, but they areprobably still correlated with the extent to which individuals access infor-mation about the economy.
Alan S. Blinder and Alan B. Krueger 341
21. These numbers need not, and do not, mirror published circulation figures. Forexample, almost as many people report learning about the economy from the New YorkTimes (8.2 percent) as from the Wall Street Journal (8.7 percent), even though the Jour-nal’s (weekday) circulation is almost double that of the Times.
22. See Hamilton (2003) for an analysis of trends in “media bias” and the impact ofcompetition on partisan news reporting.
Table 4. Proportion of Respondents Who Read Selected Newspapers, by Ideologya
Percent
Reported ideology
Have notNewspaper Liberal Conservative Moderate thought about it p valueb
New York Times 23 3 9 2 0.000Wall Street Journal 5 10 9 3 0.001Washington Post 6 1 1 0 0.000USA Today 8 7 12 4 0.013Other big-city paper 25 25 18 14 0.002Local paper 44 55 56 56 0.066
Source: Authors’ survey described in the text.a. Columns may sum to more or less than 100 percent because respondents could offer more than one answer or no answer. b. Probability that a constant proportion of respondents of all ideologies use the indicated source.
2259-04-Blinder.qxd 8/6/04 11:20 Page 341

The distributions of these two variables in the overall sample areshown in table 5. Not surprisingly, the frequency distribution of QH (highintensity) is piled up at the low end: just 15 percent of respondents have aQH greater than 0.4, whereas 32 percent have a QH below 0.1. “Heavy”users of information are thus relatively rare. Perhaps more surprisingly,the distribution of the variable QL (low intensity) is not piled up at thehigh end: fewer than 14 percent of respondents have a QL above 0.7,whereas 73 percent have a QL between 0.2 and 0.7. This is rather more useof information than we might have expected.
Looking across personal characteristics, we found some of the empiri-cal regularities that one might expect. College-educated people, high-income people, and self-professed voters reported significantly moreintensive use of information sources. Compared with either liberals, con-servatives, or moderates, the nonpoliticals had significantly lower QH andsignificantly higher QL. All these differences are significant well beyondthe 0.1 percent level. The other personal characteristics—age, race, sex,and employment status—did not seem to matter much.23
342 Brookings Papers on Economic Activity, 1:2004
23. There were two minor exceptions. Whites had slightly higher average values of QL
than nonwhites, and the employed had lower QL than the nonemployed.
Table 5. Frequency Distribution of High- and Low-Intensity Users of Information Sourcesa
Percent of respondents with QH (high intensity of information use) or QL (low intensity)
in indicated range
Range QH QL
0.0 ≤ Q < 0.1 32.0 5.50.1 ≤ Q < 0.2 19.6 7.60.2 ≤ Q < 0.3 20.5 11.40.3 ≤ Q < 0.4 13.2 16.50.4 ≤ Q < 0.5 7.0 17.90.5 ≤ Q < 0.6 3.9 15.10.6 ≤ Q < 0.7 2.5 12.40.7 ≤ Q < 0.8 0.9 7.50.8 ≤ Q < 0.9 0.4 4.20.9 ≤ Q < 1.0 0.03 1.9
Source: Authors’ calculations using data from the survey described in the text.a. QH is calculated as s1/(s1 + s2 + s3), and QL as s3/(s1 + s2 + s3), where s1, s2, and s3 are the numbers of information sources that
the respondent uses “regularly or often,” “occasionally,” and “rarely or never,” respectively. QH and QL thus range from 0 to 1,with a higher QH indicating greater intensity of use of the identified sources generally, and a higher QL less intensity.
2259-04-Blinder.qxd 8/6/04 11:20 Page 342

Knowledge about Economic Issues
In the context of asking a series of questions about the five economicpolicy issues, we embedded nine “fact” questions whose purpose was toassess each respondent’s knowledge. The facts inquired about were
—the share of income that a typical family pays in taxes —whether most people pay more in payroll or in income taxes—the size of the federal budget deficit—the level of the federal minimum wage—the size of the average Social Security benefit check—whether the respondent knew that President Bush had proposed par-
tial privatization of Social Security—whether the respondent knew that the Social Security system is pro-
jected to start running deficits in about a decade—whether Medicare covered prescription drugs for outpatients (at the
time of the survey)—the percentage of Americans who do not have health insurance.As a broad generalization and with exceptions to be noted shortly, we
were surprised to find that the average responses to most of these ques-tions were roughly correct (although the standard deviations were oftenhuge). With one important exception—the federal budget deficit—therewas also hardly any indication of skewness: the mean and medianresponses were close. Table 6 compares the correct answers to these factquestions with the survey results. Several comments are in order.
The correct tax share is a difficult question conceptually. Most econo-mists think first of taxes as a share of GDP, which was 28.4 percent in2002. But the denominator of this ratio (GDP) is meaningless to mostpeople, and the numerator includes many taxes that people probably donot think of themselves as paying.24 So we posed a more user-friendlyversion of the question:
“About what percentage of the typical American family’s income do you thinkgoes to paying taxes—including all levels of government?”
Alan S. Blinder and Alan B. Krueger 343
24. Two prominent examples are the corporate income tax and the employer’s share ofthe payroll tax. This example illustrates a general and important point about public opinionpolling. Economists often want to see survey questions that make sense to them. Such ques-tions may involve complicated concepts and numerous provisos that leave ordinary peopleconfused. Good poll questions need to be understandable by ordinary people with limitedattention spans and no training in economics.
2259-04-Blinder.qxd 8/6/04 11:20 Page 343

In calculating the “correct” denominator for this ratio, we added theemployee’s share of the payroll tax to personal income as defined in theNational Income and Product Accounts (NIPA). For the numerator weincluded personal income taxes, estate and gift taxes, the employee’sshare of the payroll tax, almost all sales and excise taxes, and propertytaxes on owner-occupied housing—all from the NIPA. But we excludedcorporate income taxes, the employer’s share of the payroll tax, propertytaxes on rental housing, customs duties, and the excise tax on diesel fuelon the grounds that individuals are unlikely to think of themselves as pay-
344 Brookings Papers on Economic Activity, 1:2004
Table 6. Correct Answers to Factual Questions in the Survey and Answers Given by Respondents
Survey Survey SurveyCorrect mean standard median
Question answer answer deviation answer
What percentage of its income does the typical American family pay in taxes? 23.3a 31.3 15.6 30
Do most Americans pay more in income or in payroll taxes? Payrollb Incomec … Income
How large is the current federal budget deficit? (in billions of dollars) 246–310d 334 739 90
What is the current federal minimum wage? (in dollars) 5.15 5.86 1.27 5.65
How much is the average Social Security benefit check? (in dollars) 898 824 493 800
Did you know that President Bush has proposed partial privatization of Social Security? … Yese … Yes
Did you know that Social Security is projected to begin running deficits in about a decade? … Yesf … Yes
Does Medicare cover prescription drugs for outpatients? Nog Noh … No
What percentage of Americans do not have health insurance? 15 37 16.7 35
Source: Authors’ survey described in the text.a. Calculated as personal income taxes, estate and gift taxes, the employee’s share of the payroll tax, most sales and excise
taxes, and property taxes on owner-occupied housing, summed and divided by personal income plus the employee share of thepayroll tax.
b. When the employer share of the payroll tax is included, 83 percent of taxpayers pay more in payroll than in income tax;when it is excluded, the figure is 53 percent, according to Gale and Rohaly (2003).
c. Response given by 52 percent of respondents.d. The lower and upper bounds on this range were, approximately, the official estimates published by the Congressional Bud-
get Office on March 10 and May 9, 2003, respectively.e. Response given by 56 percent of respondentsf. Response given by 69 percent of respondents.g. A Medicare prescription drug benefit was enacted in December 2003, after the survey was taken.h. Response given by 54 percent of respondents (after excluding the 11 percent who did not answer the question).
2259-04-Blinder.qxd 8/6/04 11:20 Page 344
ing those taxes. The resulting tax share in calendar 2001 was 23.3 percent;the share of the median family would be a bit lower. Thus we were leftwith two alternative interpretations of the mean survey response of31.3 percent: it was either a small overestimate of the tax share of GDP ora substantial overestimate of our constructed tax share. We favor the lat-ter interpretation. Note also that the standard deviation across respondentswas very large: more than 15 percentage points.
About 53 percent of tax filers with wage income pay more in payrolltaxes than they do in income taxes.25 But our respondents, by a decisivemargin of 52 percent to 35 percent, thought the reverse was true—that amajority of taxpayers pay more in income taxes than in payroll taxes.26
Estimates of the federal budget deficit—whether for fiscal 2003 or2004—were rising sharply while our survey was in the field. We thereforedecided to count any number between $246 billion and $310 billion ascorrect; these were the official estimates published by the CongressionalBudget Office (CBO) on March 10, 2003, and May 9, 2003, respec-tively.27 In fact, the mean estimate in the survey ($334 billion) was amaz-ingly accurate, especially since private sector estimates at the time wererunning well above the CBO’s estimates. However, the variance acrossrespondents was truly astounding—we received estimates of the federalbudget deficit as low as $1 billion and as high as $5 trillion. The medianresponse—just $90 billion—also showed that the “typical” response wasfar too low.28
The average (and the median) estimate of the federal minimum wagewas also quite accurate, especially when one considers that some respon-dents may have given the higher state minimum wage instead (as someexplicitly did).29
Alan S. Blinder and Alan B. Krueger 345
25. See Gale and Rohaly (2003). The 53 percent figure includes just the employee com-ponent of the payroll tax. If both the employer and the employee shares are considered,83 percent of wage earners pay more in payroll taxes than in income taxes.
26. The remaining 13 percent said they did not know or thought they were about thesame. Bartels (2003, p. 19) reports results from an NPR/Kaiser Foundation/KennedySchool survey that found that people are even more inaccurate in assessing whether theythemselves pay more in income or in payroll taxes. To us, this suggests that many peoplesimply do not distinguish between income and payroll taxes.
27. The May 9 CBO estimate was actually “over $300 billion.”28. The rate of nonresponse was also quite high on this question, at about 48 percent,
suggesting that there was even less knowledge than the reported estimates indicate.29. When we compute errors below, we use the state minimum wage as the true value
if a respondent mentioned that he or she was reporting the state minimum wage.
2259-04-Blinder.qxd 8/6/04 11:20 Page 345
Average Social Security benefits were also estimated quite accuratelyin the survey, although the variance was again enormous, and fully18 percent of respondents were unable to answer the question. Similarly,majorities of respondents said they were aware “that President Bush hasproposed that part of Social Security be replaced by personal investmentaccounts” and “that the Social Security system is projected to start run-ning deficits about a decade from now.” In general, public knowledge ofthe Social Security system seemed pretty high.
Not so for health insurance, however. A bare majority (54 percent) ofthose who answered the question realized that Medicare did not, at thetime of the survey, cover prescription drugs “when people are not inthe hospital”—this despite an avalanche of recent public attention to theissue.30 And perhaps the greatest misconception in the survey wasthe belief that a stunning 37 percent (this was the mean response) “ofAmericans do not have any health insurance today.” The actual numberin 2002 was 15.2 percent.
Each of the nine “knowledge” questions above will be used in contextlater, when we study public opinion on specific policy issues. But we alsoconstructed a generic knowledge score—corresponding to the variableK in our model—as follows. Five of the questions have numericalanswers. For each of these we computed the absolute error and thenassigned each respondent a percentile rank based on accuracy, Pij , wherei indexes individuals and j indexes questions. We also assigned numericalscores to two qualitative questions (those on payroll versus income taxand on Medicare drug coverage), setting the values for the variousanswers so that the mean score was the 50th percentile (just like thenumerical questions) and the standard deviation approximated that of auniform distribution (σ = 28.9 percent). However, in computing our com-posite knowledge score, we gave only 50 percent weight to these twoquestions because it was easier to guess the correct answer. We excludedthe two Social Security questions that began “Are you aware that. . .” onthe grounds that the phrasing probably often “led the witness” to the cor-rect answers. We then summed these ranks across all the (weighted) ques-tions the respondent answered to obtain Ki = (1/6) Σj Pij. Note that we
346 Brookings Papers on Economic Activity, 1:2004
30. The 54-46 split excludes the 11 percent of respondents who did not answer thequestion.
2259-04-Blinder.qxd 8/6/04 11:20 Page 346

always divide by six.31 The knowledge measure thus treats unansweredquestions exactly as they would be treated on an exam: they get zeropoints. Strikingly, the distribution of our constructed knowledge variableacross the population of respondents closely resembles a normal distribu-tion, with a mean of 42.9 and a standard deviation of 16.7 (figure 1).
How does economic knowledge, thus measured, vary by personal char-acteristics, by the desire to keep informed, by the main sources of infor-mation, and by the number of information sources an individual uses? Therest of this subsection explores various dimensions of this question.
personal characteristics. There were no significant differences inmean knowledge score by age, and only minor differences by sex andrace. Larger and more highly significant differences (all have p values
Alan S. Blinder and Alan B. Krueger 347
31. About half the sample was not asked for their estimate of the budget deficit. Forthem we summed the (weighted) ranks and divided by five instead.
1
2
3
4
5
6
7
8
9
10 20 30 40 50 60 70 80 90
Percent of respondents
Score
Figure 1. Distribution of Knowledge Scores
Source: Authors’ survey described in text.
2259-04-Blinder.qxd 8/6/04 11:20 Page 347

below 0.001) emerged when we considered economic status and politicalinvolvement:
—Higher-income people outscored lower-income people on our test byan average of 8.6 points (0.51σ). The scores of college-educated respon-dents averaged 6.3 points (0.38σ) higher than the scores of non-college-educated respondents. This is far smaller than the gap of 0.9σ recorded onthe 1994 U.S. International Adult Literacy Survey; the difference is prob-ably due to the fact that our assessment is based on just seven questionsand the results are therefore noisy.32
—Once again, the nonpolitical group stood out from the rest, withunusually low scores (about 6 or 7 points lower than liberals, conserva-tives, or moderates), and self-reported voters scored 8.5 points higher, onaverage, than nonvoters.33
differences by desire to keep informed. It seems almost axio-matic that individuals who deem it more important to keep informedshould actually be better informed. But the knowledge scores do notreally bear this out, except for the lowest category (table 7). Although theordering is as expected, the null hypothesis that all four mean scores areequal cannot be rejected at the 5 percent level (p = 0.07).
differences by major source of information. Table 8 shows thatthe small number of people who said that magazines are their primary
348 Brookings Papers on Economic Activity, 1:2004
32. As another point of comparison, Hansen, Heckman, and Mullen (forthcoming) findthat scores on the Armed Forces Qualifying Test rise by 0.17 standard deviation for eachyear of schooling. The difference in years of schooling between college graduates and non-graduates is 4.5, so this amounts to a 0.77σ gap, or twice what we find for our test.
33. This result is consistent with Palfrey and Poole’s (1987) results for politicalknowledge.
Table 7. Respondents’ Knowledge Scores by Reported Desire to Keep Well Informed
Stated importance of Mean knowledge Share of samplekeeping well informed score (percentile)a (percent)
Extremely important 43.8 23.8Very important 43.3 50.2Somewhat important 42.5 23.4Not very important or 34.5 2.6
not important at all
Source: Authors’ survey described in the text.a. See the text for description of how the knowledge score was calculated.
2259-04-Blinder.qxd 8/6/04 11:20 Page 348

source of information on economic issues (readers of The Economist?)were the most knowledgeable group, with a mean K score of 52.7. Theeven smaller number of people whose most important source of informa-tion was statements by economists ranked second (mean K = 50.3). Theleast knowledgeable people, by far, were the small group who rely moston statements by civic and religious leaders (mean K = 35.0). Thosewhose most important source was television—a plurality of the sample—had a relatively low mean K score of 41.1.
differences by quantity of information. Table 9 displays a posi-tive, but by no means high, correlation between the knowledge score andthe number of different sources that the respondent reports using regularlyor often. Thus more information does improve knowledge, albeit veryimperfectly. The null hypothesis that all the K scores are equal in table 9is rejected at beyond the 0.1 percent level, but the relationship is notmonotonic.
direction of errors. Our test scores are based on absolute errors,without regard to sign. But it has been suggested that conservatives andliberals may make systematically different errors because the two groupsseek out and utilize different sources of information in order to see theirbeliefs confirmed.34 Although conservatives and liberals had similar aver-
Alan S. Blinder and Alan B. Krueger 349
34. See Mullainathan and Shleifer (2003).
Table 8. Respondents’ Knowledge Scores by Reported Most Important Source ofEconomic Policy Informationa
Mean knowledge Share of sampleMost important source score (percentile)b (percent)a
Magazines 52.7 2.2Economists 50.3 1.1Newspapers 46.8 18.6Business leaders 46.1 1.2Internet 45.9 10.1Books 43.7 0.5Radio 42.3 8.9Television 41.1 46.6Political leaders 40.9 2.3Friends and relatives 39.9 6.6Civic or religious leaders 35.0 1.2
Source: Authors’ survey described in the text.a. Numbers do not sum to 100 percent because of rounding.b. See the text for description of how the knowledge score was calculated.
2259-04-Blinder.qxd 8/6/04 11:20 Page 349

age percentile scores on the knowledge test, we did find some differencesin the direction of their errors.
On average, conservatives thought that the federal budget deficit wasmuch larger ($333 billion versus $177 billion), that Social Security bene-fits were a bit more generous ($873 versus $766 per month), and that asmaller share of the U.S. population lacked health insurance (32 percentversus 40 percent) than did liberals. Conservatives were also more likelythan liberals to report being aware that the Social Security trust fund isprojected to run a deficit in about a decade (82 percent versus 74 percent)and less likely to say that Medicare already provided coverage for pre-scription drugs (23 percent versus 34 percent). Although each of thesedifferences is statistically significant, it is hard—for us at least—to seeany clear pattern of ideological bias in these numbers. And on the otherpolicy questions—regarding the tax share of income, whether the payrolltax is larger than the income tax, the value of the minimum wage, andwhether respondents were aware of the Bush Social Security proposal—ideological differences were trivial and consistent with chance.
Opinions on Economic Policy Issues
As stated earlier, the survey instrument began with a series of ques-tions about people’s opinions on a variety of economic policy issues.
the tax burden and the bush tax cuts. The first such questionwas
“Do you think taxes in the United States are generally too high, too low, orabout right?”
350 Brookings Papers on Economic Activity, 1:2004
Table 9. Respondents’ Knowledge Scores by Reported Number of Sources UsedRegularly or Often
Mean knowledge Share of sampleNo. of sources score (percentile) (percent)a
Five or more 45.5 14.4Four 43.5 13.0Three 46.1 20.9Two 44.4 19.4One 39.4 21.2None 37.1 11.2
Source: Authors’ survey described in the text.a. Numbers do not sum to 100 percent because of rounding.
2259-04-Blinder.qxd 8/6/04 11:20 Page 350
This question was asked, on a randomized basis, either before or after thefact question about the tax share. The ordering of the two questions turnedout not to affect the responses appreciably, and so we treated all theresponses as a single sample. Some 61 percent of respondents said thattaxes are too high, 36 percent said they are about right, 3 percent said theyare too low, and 2 percent said they did not know.
The overwhelming popular sentiment that taxes are too high can hardlycome as a shock to any sentient American. We have probably believedthis since the 1770s. But the cross-tabulations by subsets of the popula-tion did hold some surprises. First, self-described conservatives (at62 percent) were not much more likely than others (at 60 percent) to saythat taxes are too high. Liberals, however, were notably less likely—just48 percent did so. The most antitax group turned out to be the disengagednonpoliticals, 70 percent of whom said taxes are too high. Second,although racial differences were not terribly sharp, nonwhites (at 70 per-cent) were more likely than whites (at 59 percent) to say that taxes are toohigh (p = 0.036). Third, lower-income people were more likely thanhigher-income people to say that taxes are too high (68 percent to 56 per-cent, p = 0.001).35 Two other breakdowns were statistically significant:college-educated people were much less likely than others to say thattaxes are too high (51 percent versus 65 percent, p = 0.000), andemployed people were more likely than the nonemployed (65 percent ver-sus 56 percent, p = 0.033) to have that opinion.
While our survey was in the field, Congress was debating PresidentBush’s 2003 tax proposal (which subsequently passed) to advance thetiming of the phased-in tax rate reductions enacted in 2001 and to estab-lish a preferentially low tax rate on dividends. So we asked respondentswhether they favored or opposed this proposal, ordering this opinionquestion (on a randomized basis) either before or after the fact questionabout whether the typical American pays more in payroll or income taxes(but always after the question about the typical family’s tax share). In thiscase the answers did depend a bit on the ordering: asking the payroll taxquestion first reduced support for the Bush tax cut by about 5 percentagepoints. But a χ2 test did not reject the null hypothesis of the independenceof responses and question order (p = 0.31).
Alan S. Blinder and Alan B. Krueger 351
35. It has been suggested to us that even though the rich pay higher average tax rates,the utility loss from paying taxes may be proportionately greater for the poor.
2259-04-Blinder.qxd 8/6/04 11:20 Page 351

Looking for differences by individual characteristics, we found thatpolitical ideology mattered quite strongly (p = 0.000). This time, conserv-atives were far more supportive of the Bush proposal (64 percent) thanother groups (36 percent), even though, as just reported, they were nomore likely to deem taxes too high. Both college-educated people (by35 percent versus 23 percent of the non-college-educated) and self-reported voters (by 30 percent versus 19 percent of nonvoters) were morelikely to oppose the 2003 Bush tax cuts (p = 0.000 and p = 0.003, respec-tively). And both whites (by a 46-to-33 percent margin) and higher-income people (by 50 to 35 percent) were much more likely to favor them(p = 0.000 in both cases). Finally, employed people favored the Bush taxcuts more than nonemployed people did. There were no significant differ-ences by age or sex.
the federal budget deficit. The next opinion question was
“How much of a problem do you think the federal budget deficit poses for theeconomy? Would you say it is not a problem at all, a minor problem, or a seri-ous problem?”
We posed this question in two variants. For some respondents we asked itafter first inquiring about the size of the deficit. For others we asked itafter telling the respondent, “This year’s federal budget deficit is approxi-mately $300 billion. This works out to around $3,000 per household.”Remember, the median estimate of those who were asked about the sizeof the deficit was only $90 billion. So giving the $300 billion figureframed the deficit at a higher level for most respondents.
Telling respondents the actual size of the deficit did have a markedeffect on their responses, as table 10 shows. But, oddly, doing so reducedthe fraction who thought the deficit is a serious problem, by about 9 per-centage points. However, the χ2 test for independence between order andresponse categories was only marginally significant (p = 0.06).
We followed this question with two further queries about public policytoward the deficit:
“Do you think the federal budget deficit ought to be reduced?”
and (for the 87.5 percent of the sample who answered “yes”)
“Do you think the deficit should be reduced mostly by raising taxes, mostly bycutting spending, or about equally by both means?”
352 Brookings Papers on Economic Activity, 1:2004
2259-04-Blinder.qxd 8/6/04 11:20 Page 352

Our respondents divided approximately evenly between those whofavored reducing the deficit “mostly by cutting spending” (45 percent)and those who favored doing so “about equally by both means” (47 per-cent), with a tiny minority (3 percent) favoring “mostly by raising taxes.”(The other 5 percent gave no coherent opinion.) Several differencesamong subgroups were also observed.
Demographics. Older people and women were far more likely thanyounger people and men to rate the deficit “a serious problem,” and byalmost identical margins: 65 percent versus 50 percent (p = 0.000). But,ironically and perhaps inconsistently, this belief did not make them morelikely to “think the federal budget deficit ought to be reduced.” Nor werethere significant sex or racial differences in the preferred cures for thedeficit; however, older Americans favored expenditure cuts more thanyounger Americans did. Finally, although whites worried less about thebudget deficit than did nonwhites, they were nonetheless slightly morelikely to favor reducing the deficit.
Economic Status. The opinions of college-educated and non-college-educated respondents did not differ significantly on any of the threedeficit-related questions. The same was true when we compared theemployed with the nonemployed. However, lower-income people wereconsiderably more likely than higher-income people to rate the deficit aserious problem (by 65 percent versus 53 percent, p = 0.012). That said,income did not significantly influence opinion on either of the other twodeficit-related questions.
Alan S. Blinder and Alan B. Krueger 353
Table 10. Respondents’ Opinions on the Federal Budget Deficita
Percent
Respondents told size of actual deficitb
Opinion Yes No All respondents
Deficit a serious problem 50 59 54Deficit a minor problem 38 33 36Deficit not a problem 5 3 4Don’t know 6 5 5
Source: Authors’ survey described in the text.a. Numbers may not sum to 100 percent because of rounding.b. Approximately half of respondents were told, “This year’s federal budget deficit is approximately $300 billion. This works
out to around $3,000 per household.” The rest were not given this information.
2259-04-Blinder.qxd 8/6/04 11:20 Page 353

Political Involvement. Unsurprisingly, political ideology matteredquite a bit (p = 0.000). In a sign of these unusual times, liberals were farmore likely to rate the budget deficit a serious problem (72 percent) thaneither conservatives (44 percent) or nonpoliticals (56 percent).36 In thisrespect moderates (at 67 percent) were closer to liberals. Yet, once again,there were no significant differences by ideology in the fraction of peoplewho “think the federal budget deficit ought to be reduced.” (Almosteveryone does.) Ideology showed through strongly again (p = 0.000),however, when it came to selecting the preferred method for reducing thedeficit: conservatives favored spending cuts over tax increases by a mar-gin of 50 percent to 2 percent; among liberals the corresponding marginwas 39 percent to 12 percent. (The disengaged nonpolitical group werelike the conservatives in this respect. Moderates were in between.)Finally, self-reported voters and nonvoters did not differ much on any ofthe three deficit-related questions.
the minimum wage. Our next query was straightforward:
“Do you think the federal minimum wage should be increased?”
The answers overwhelmingly favored a higher minimum wage:
Yes 75 percentNo 21 percentDon’t know or refused 4 percent.
We posed this question either before or after asking people, on a random-ized basis, what the current minimum wage is. But the ordering made nodifference. We also disaggregated the sample by personal characteristics,with the following results.
Demographics. There were no significant differences in the answers tothis question by age or employment status. But women and nonwhiteswere more likely to favor raising the minimum wage than men andwhites—by margins of 81 percent to 69 percent (p = 0.000) for women
354 Brookings Papers on Economic Activity, 1:2004
36. By contrast, an NBC/Wall Street Journal poll of 1,003 adults conducted in January1995 found that 40 percent of conservatives identified the federal budget deficit as the mostimportant economic issue facing the country, while only 23 percent of liberals did so. By awide margin, the deficit was the issue most commonly cited by conservatives, but not byliberals (38 percent of whom cited unemployment) See Roper Center, Public OpinionOnline Archive, University of Connecticut, Question ID USNBCWSJ.012095, R09A.
2259-04-Blinder.qxd 8/6/04 11:20 Page 354

versus men and 93 percent to 74 percent (p = 0.000) for nonwhites versuswhites.
Economic Status. College-educated people were less likely to favor ahigher minimum wage than the non-college-educated (66 percent versus83 percent, p = 0.000). Perhaps they learned about the alleged disem-ployment effects of the minimum wage in a college economics course!37
And, as one would expect, lower-income people favored raising it morethan higher-income people did (by a margin of 85 percent to 73 percent,p = 0.001).
Political Involvement. Not surprisingly, attitudes toward the minimumwage differed significantly by political ideology (p = 0.000). Conserva-tives, although still supportive (with 60 percent favoring), were far lesslikely to favor raising it than were all other groups (which were in the 85to 89 percent approval range). Self-reported voters were also less likely tofavor raising the minimum wage (74 percent versus 87 percent of nonvot-ers, p = 0.000).
social security policy. In addition to the three fact questions men-tioned above—pertaining to average Social Security benefits, the actuar-ial deficit, and President Bush’s partial privatization plan—we asked twopolicy questions about Social Security. First, immediately after asking,“Are you aware that President Bush has proposed that part of Social Secu-rity be replaced by personal investment accounts?” we posed the follow-ing policy question:
“Do you favor or oppose this idea, or are you undecided?”
Second, right after asking, “Are you aware that the Social Security Sys-tem is projected to start running deficits about a decade from now?” weinquired,
“Do you think the government should try to reduce those deficits mainly byraising the payroll tax, mainly by reducing Social Security benefits, or both?”
Twenty percent of respondents favored partially replacing Social Secu-rity with personal accounts, whereas 38 percent opposed the idea and42 percent were undecided. As for closing the future Social Security
Alan S. Blinder and Alan B. Krueger 355
37. The argument can be found in most beginning economics texts. For contrary evi-dence, see Card and Krueger (1995). A survey by Fuller and Geide-Stevenson (2003) in fall2000 found that 46 percent of members of the American Economic Association “mainlyagreed” that “Minimum wages increase unemployment among young and unskilled work-ers.” Twenty-seven percent disagreed, and 28 percent agreed with provisos.
2259-04-Blinder.qxd 8/6/04 11:20 Page 355

deficit, respondents were roughly evenly divided between those whofavored a mixture of both remedies (34 percent) and those who favoredrelying mainly on the payroll tax (30 percent). Only 5 percent wanted torely mainly on benefit reductions, and a large 22 percent preferred neitherremedy. Interestingly, this expressed preference for higher taxes overlower expenditure is just the reverse of what we found earlier, when weinquired about ways to reduce the overall budget deficit. Social Security,it appears, really is different. Looking across subgroups yielded the fol-lowing findings.
Demographics. There were no significant racial differences on eitherSocial Security policy question. Men were much more likely than womento favor partial privatization (28 percent versus 13 percent, p = 0.000),and they were less likely to favor tax increases to reduce the Social Secu-rity deficit (28 percent versus 38 percent, p = 0.000). But the biggest dif-ferences, as one would expect, came by age. Older people were muchmore likely than younger ones to oppose the privatization idea (46 percentversus 31 percent) and much less likely to be undecided (32 percent ver-sus 50 percent). The curious consequence is that the proportion favoringthe idea was roughly independent of age (about 20 percent). When it cameto choosing between benefit cuts and tax increases as alternative ways toreduce the Social Security deficit, older Americans were more likely thanyounger ones (by 31 percent versus 18 percent) to choose “neither”—even though that option was not offered. Younger Americans were morelikely (45 percent versus 29 percent) to opt for “both.” Both sets of differ-ences are highly significant.
Economic Status. Higher-income people were much more likely tofavor privatization (27 percent versus 12 percent of lower-income people,p = 0.000), as were the employed (24 percent versus 15 percent of thenonemployed, p = 0.007) and the college-educated (33 percent versus16 percent of the non-college-educated, p = 0.000). Differences by educa-tion were interesting. The percentages of college-educated and non-college-educated respondents opposing the Bush privatization proposalwere about the same (roughly 38 percent). But many fewer of the collegeeducated were undecided (28 percent versus 46 percent). There were nosignificant differences on how best to reduce the looming Social Securitydeficit—no group wanted to see benefits cut.
Political Involvement. Ideology was pretty much a no-brainer on thisissue: conservatives were vastly more likely to favor partial privatization
356 Brookings Papers on Economic Activity, 1:2004
2259-04-Blinder.qxd 8/6/04 11:20 Page 356

(40 percent) than either liberals (9 percent), moderates (18 percent), ornonpoliticals (8 percent). Those who claimed to have voted in the 2000election were much more likely to favor privatization (25 percent versus10 percent of nonvoters) and much less likely to be undecided (35 percentversus 54 percent). These differences are highly significant (p = 0.000).But, again, the subgroups did not differ significantly in how they want toreduce the Social Security deficit. Those who were aware of the presi-dent’s proposal were more inclined to support it (by 31 percent versus7 percent).
medicare and health insurance. We asked people whether Medi-care currently included an outpatient drug benefit. (It did not at the time ofthe survey.) We followed that query by asking those who answered cor-rectly or who said there was presently only partial coverage (74 percent ofall respondents),
“Would you favor or oppose adding a prescription drug benefit to Medicare forpeople who are not in the hospital, bearing in mind that it would have to be paidfor somehow?”
Despite the last clause, which we deemed important, the general viewwas overwhelmingly supportive, with 80 percent in favor and only12 percent opposed.38 And opinions on this issue did not differ signifi-cantly by age (which we found surprising), sex, race, employment status,income, or self-reported voting behavior. College-educated people werea bit less likely to favor a Medicare drug benefit (by 82 percent versus89 percent of the non-college-educated), but the difference was barelysignificant (p = 0.033). The only highly significant difference was bypolitical ideology, but the ordering here was somewhat counterintuitive:The proportion favoring a Medicare drug benefit was 95 percent amongliberals, 89 percent among nonpoliticals, 85 percent among conserva-tives, and 79 percent among moderates.
The other health policy question was
“Do you favor or oppose what is called universal health insurance coverage,meaning that the government would make sure that every American is coveredby a health insurance policy?”
Alan S. Blinder and Alan B. Krueger 357
38. The rest did not know or gave no opinion. Of course, as was pointed out at theBrookings Panel meeting, we did not specify a particular way of paying for the drugbenefit.
2259-04-Blinder.qxd 8/6/04 11:20 Page 357
Remember, asking about the number of uninsured Americans elicited agross overestimate of the extent of the problem. Such a misconceptionmight be expected to reduce support for universal coverage, if respon-dents were thinking more about the high cost of reaching universal cover-age, or increase support, if they were thinking more about the severity ofthe problem. In any case over 75 percent of our respondents favored uni-versal coverage.39 On this policy issue, differences of opinion across sub-groups were the rule rather than the exception.
Demographics. Women were substantially more likely than men tofavor universal health insurance (80 percent versus 71 percent, p = 0.003),and nonwhites were much more likely to favor it than whites (87 percentversus 72 percent, p = 0.001). But there were no significant differencesby age.
Economic Status. Lower-income people were much more supportiveof universal coverage than were higher-income people (who were pro-bably covered in any case), by a margin of 85 percent to 70 percent(p = 0.000). And people without a college degree were significantly morelikely than college graduates to favor universal coverage (78 percent ver-sus 68 percent, p = 0.001). But, surprisingly, employment status did notmatter.
Political Involvement. Politically disengaged nonvoters were muchmore likely to favor universal health insurance than were self-reportedvoters, by a margin of 85 percent to 71 percent (p = 0.000). Ideology mat-tered, too. Liberals strongly favored universal coverage (90 percent didso), whereas conservatives barely favored it (just 52 percent). Moderates(79 percent) and nonpoliticals (87 percent) fell in between, but muchcloser to the liberals (p = 0.000).
Econometric Models of Knowledge and Public Opinion
We return now to the five-equation model outlined earlier. Our primaryinterest is in equations like equation 1, which explain people’s opinions
358 Brookings Papers on Economic Activity, 1:2004
39. However, the ordering of the questions mattered significantly in this case. Whenthe policy question was asked before the inquiry about the number of uninsured, ourrespondents favored universal health insurance by a margin of 74 percent to 22 percent.When the ordering of the questions was reversed, the margin fell to 67 percent to 25 per-cent. Getting people to think about the magnitude of the problem did suppress support a bit.
2259-04-Blinder.qxd 8/6/04 11:20 Page 358

on policy issues (OP) by their self-interest (SI), ideology (ID), knowledge(K ), education (ED), and other demographic controls (X ). Recall that weidentify the models by assuming a recursive structure. Readers unwillingto accept this assumption may be skeptical of our interpretation of theregression results (which is why we have reported only descriptive cross-tabulations up to now).
Does Information Breed Knowledge?
We begin with estimates of equation 2, which explains our admittedlyimperfect measure of knowledge by information sources (the quantity andnature of sources used by respondents), the desire to be informed, educa-tion, and other demographic variables. We tried measuring respondents’sources of information in three different ways: by QH and QL , the twointensity-of-use variables defined earlier; by the respondent’s primarysource of information; and by a set of twenty-two dummy variables indi-cating, for each of the eleven sources, whether the respondent reportedusing that source at least occasionally. We found that, once demographicswere controlled for, the twenty-two source dummies were jointly insignif-icant (at the 10 percent level). Therefore we eliminated the third optionand concentrated on the other two.
Table 11 begins with the results of a linear regression with K on theleft-hand side and only QH , QL , and the demographic variables on theright-hand side (column 11-1). The fit is mediocre (adjusted R2 = 0.17),and QH and QL are jointly insignificant—a result anticipated by table 9.More-educated people, higher-income people, and married people are sig-nificantly more knowledgeable.
Column 11-2 adds a set of three dummies indicating (in descendingorder) the respondent’s expressed desire to be informed. All three are sig-nificant at the 5 percent level, and the pattern of the coefficients meansthat people with more desire to be informed do obtain higher knowledgescores. But the adjusted R2 barely increases.
In column 11-3 we add a set of variables identifying political ideologyand engagement variables. Liberals, conservatives, and moderates (thecontrol group) are no different in terms of knowledge. But people whohave not thought about their ideology score significantly lower (althoughthis finding is significant only at the 10 percent level). People who reporthaving voted in 2000 score significantly higher.
Alan S. Blinder and Alan B. Krueger 359
2259-04-Blinder.qxd 8/6/04 11:20 Page 359

360 Brookings Papers on Economic Activity, 1:2004
Table 11. Regressions Explaining Respondents’ Knowledge Scoresa
Independent variable 11-1 11-2 11-3
Intensity of useRatio of number of sources used “regularly 4.85 4.41 2.94or often” to total sources used (QH) (3.80) (3.84) (3.87)Ratio of number of sources used “rarely or –2.11 –1.20 –0.13never” to total sources used (QL) (3.21) (3.21) (3.24)p-value of joint significance of variables 0.13 0.28 0.67
Desire to be informedb
Extremely important ... 10.05*** 7.91**(3.60) (3.69)
Very important ... 8.44** 6.83*(3.50) (3.58)
Somewhat important ... 8.04** 6.39*(3.55) (3.64)
p-value of joint significance of variables ... 0.04 0.19
Ideology and voting behaviorc
Liberal ... ... –1.00(1.78)
Conservative ... ... –1.27(1.55)
Has not thought much about ideology ... ... –3.06*(1.61)
Other ideology ... ... 2.33(2.81)
Voted in 2000 ... ... 2.65**(1.31)
p-value of joint significance of variables ... ... 0.05
DemographicsLog of income 1.96** 2.07** 2.01**
(0.82) (0.82) (0.82)(continued)
Finally, in a fourth regression not reported here, we added ten dummiesrepresenting sources of information, with the dummy equaling 1 when therespondent identified that source as the most important. Three of the tencoefficients (for newspapers, magazines, and economists) were significantat the 10 percent level, and each indicated higher scores than the basegroup (those who named television as their most important source). TheF-test for the ten dummies as a group also indicated statistical significance(F = 1.88, p = 0.045). The other results hardly changed.
Thus our overall conclusion is that both education and the desire to beinformed affect an individual’s knowledge positively, although the mag-
2259-04-Blinder.qxd 8/6/04 11:20 Page 360

nitude of the education effect is modest.40 The nature of the respondent’sprimary source of information does affect his or her K score, but the gen-eral intensity of information use does not. Educators will find theseresults somewhat disheartening, although we acknowledge that the brieftest embedded in our survey assesses only a limited range of factualknowledge—and that, even as such, the test is highly imperfect.
Alan S. Blinder and Alan B. Krueger 361
40. Four more years of education raises the test score by 4 or 5 points, or about one-quarter of a standard deviation.
Table 11. Regressions Explaining Respondents’ Knowledge Scoresa (continued)
Independent variable 11-1 11-2 11-3
Age 0.00 0.00 –0.01(0.05) (0.05) (0.05)
Years of education 1.25*** 1.25*** 1.01***(0.24) (0.24) (0.26)
Female –1.75 –1.86* –1.24(1.09) (1.09) (1.10)
Blackd –2.33 –2.60 –2.87(1.70) (1.70) (1.74)
Other race –6.40*** –6.32*** –5.86***(2.01) (2.01) (2.03)
Hispanic 0.38 0.30 0.40(2.05) (2.05) (2.06)
Unemployede 4.14* 3.87 3.88(2.39) (2.38) (2.40)
Retired –1.12 –1.06 –1.22(1.93) (1.93) (1.95)
Homemaker –1.50 –1.43 –1.10(2.47) (2.47) (2.47)
Student or other nonemployed –0.38 –0.18 0.06(1.65) (1.65) (1.68)
Marriedf 4.70*** 4.15*** 3.64**(1.53) (1.54) (1.55)
p-value of joint significance of variables 0.00 0.00 0.00
No. of observations 881 879 867Adjusted R2 0.17 0.18 0.19
Source: Authors’ regressions using data from the survey described in the text.a. The dependent variable is the respondent’s knowledge score (see text for definition). Standard errors are in parentheses.
***denotes significantly different from zero at the 1 percent level, ** at the 5 percent level, and * at the 10 percent level.b. The omitted category is those who answered “Not important” or “Not very important.”c. The omitted category is “Moderate.”d. The omitted category is “White.”e. The omitted category is “Employed.”f. The model also included demographic controls for three other categories of marital status, not shown here.
2259-04-Blinder.qxd 8/6/04 11:20 Page 361

Who Believes What? And Why?
For each of the five policy areas mentioned above, we now seek to esti-mate the relative roles of self-interest, ideology, and knowledge in form-ing public opinion—equation 1 in the model. In some sense this is thenatural culmination of our inquiry, since information use and knowledgeare, in this context, just way stations on the road to public opinion.
the bush tax cuts. Because 31 percent of respondents offered inter-mediate responses (either a mixed opinion or no opinion) about the 2003tax cut proposals, we estimated ordered probit models for opinion on theproposals with three choices: oppose, mixed response, or favor—inascending order. Thus positive coefficients in table 12 indicate morefavorable attitudes toward the Bush tax cuts. The magnitudes of the esti-mated coefficients in an ordered probit model are not easy to interpret, butthe relative magnitudes are. For example, column 12-1 reports that thecoefficient on the dummy variable for being black is almost ten times aslarge as the coefficient for years of education. That means that being blackhas roughly the same effect on the underlying probabilities as ten moreyears of education.
The estimates reported in table 12 are interesting and, for the most part,indicative of what we report later about opinions on other policy issues.Column 12-1 begins by trying to explain attitudes toward the tax cut bypurely demographic variables, plus the logarithm of income. Since the2003 tax cut proposal, unlike the 2001 tax cut, offered virtually no bene-fits to low- and moderate-income taxpayers, household income should bean excellent measure of self-interest here. The model does not explainmuch: the pseudo-R2 measure of goodness-of-fit is below 0.02. Further-more, virtually none of the demographic variables in column 12-1 matter.More-educated people and blacks are more opposed to the tax cuts, butlittle more than that can be said.41 (Remember, when we looked at simplecorrelations, several demographic variables were significant.) Althoughhousehold income has the correct sign in all three models in table 12—that is, richer people do favor the tax cuts more—the coefficient is neversignificant. Where have you gone, homo economicus?42
362 Brookings Papers on Economic Activity, 1:2004
41. Among our four controls for marital status (not shown in the table), one is signifi-cant (p = 0.01): divorced and separated people are more likely to favor the Bush tax cuts.
42. Both Bartels (2003) and Slemrod (2003) emphasize the role of popular miscon-ceptions in generating public opinion on tax policy in general and on the Bush tax cuts in
2259-04-Blinder.qxd 8/6/04 11:20 Page 362

Column 12-2 adds a host of ideology and knowledge variables. Manyof them are significant, and the pseudo-R2 jumps dramatically to 0.12.43
The table also reports χ2 tests (whose p-values are reported below each setof regressors), which clearly show that both ideology and knowledge arestrongly associated with opinions on the tax cuts.
Ideology is measured both by political ideology, as discussed above,and by opinions on whether the tax burden is too high or too low andwhether taxes should be progressive.44 Column 12-2 shows that ideologymatters quite a lot. Conservatives are much more favorably disposed
Alan S. Blinder and Alan B. Krueger 363
particular. Slemrod finds that more-educated people suffer somewhat less from thesemisconceptions.
43. This is not an entirely clean comparison, since the sample size drops from 874 to722 observations because of missing data.
44. The precise question is, “Do you agree or disagree with the statement that higher-income households should pay a larger share of their income in taxes than lower-incomehouseholds?”
Table 12. Ordered Probit Model for Favoring Bush Tax Cuta
Regression
Independent variable 12-1 12-2 12-3
Self-interestLog of income 0.09 0.10 0.11
(0.06) (0.07) (0.08)p-value of joint significance of variable 0.13 0.160 0.147
Ideology and political behaviorLiberal ... –0.41*** –0.43***
(0.15) (0.15)Conservative ... 0.70*** 0.60***
(0.13) (0.14)Has not thought much about ideology ... 0.03 –0.02
(0.13) (0.14)Other ideology ... –0.27 –0.45*
(0.23) (0.24)Voted in 2000 ... –0.11 –0.06
(0.11) (0.12)Believes taxes too high ... 0.57*** 0.63***
(0.10) (0.10)Believes taxes too lowb ... –0.70** –0.78**
(0.30) (0.31)Likes progressivity ... –0.16* –0.08
(0.09) (0.10)p-value of joint significance of variables ... 0.000 0.000
(continued)
2259-04-Blinder.qxd 8/6/04 11:20 Page 363
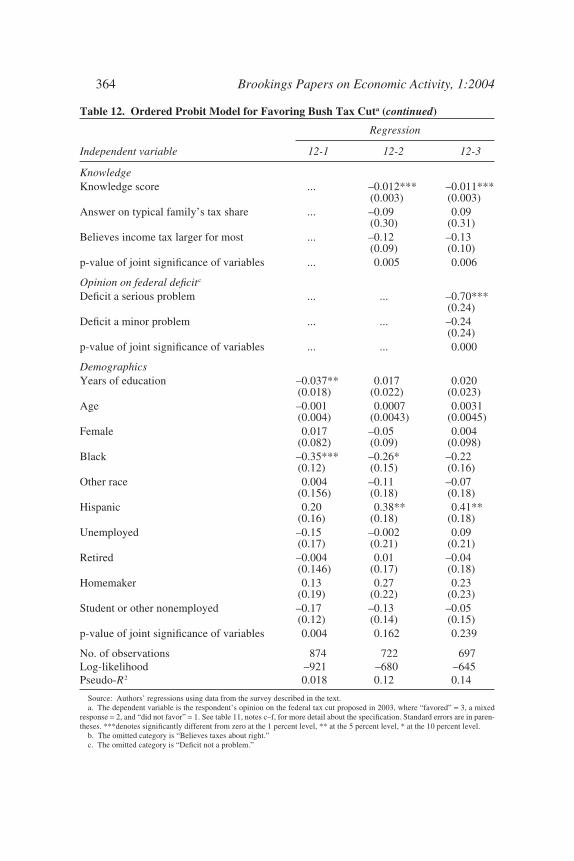
364 Brookings Papers on Economic Activity, 1:2004
Table 12. Ordered Probit Model for Favoring Bush Tax Cuta (continued)
Regression
Independent variable 12-1 12-2 12-3
KnowledgeKnowledge score ... –0.012*** –0.011***
(0.003) (0.003)Answer on typical family’s tax share ... –0.09 0.09
(0.30) (0.31)Believes income tax larger for most ... –0.12 –0.13
(0.09) (0.10)p-value of joint significance of variables ... 0.005 0.006
Opinion on federal deficitc
Deficit a serious problem ... ... –0.70***(0.24)
Deficit a minor problem ... ... –0.24(0.24)
p-value of joint significance of variables ... ... 0.000
DemographicsYears of education –0.037** 0.017 0.020
(0.018) (0.022) (0.023)Age –0.001 0.0007 0.0031
(0.004) (0.0043) (0.0045)Female 0.017 –0.05 0.004
(0.082) (0.09) (0.098)Black –0.35*** –0.26* –0.22
(0.12) (0.15) (0.16)Other race 0.004 –0.11 –0.07
(0.156) (0.18) (0.18)Hispanic 0.20 0.38** 0.41**
(0.16) (0.18) (0.18)Unemployed –0.15 –0.002 0.09
(0.17) (0.21) (0.21)Retired –0.004 0.01 –0.04
(0.146) (0.17) (0.18)Homemaker 0.13 0.27 0.23
(0.19) (0.22) (0.23)Student or other nonemployed –0.17 –0.13 –0.05
(0.12) (0.14) (0.15)p-value of joint significance of variables 0.004 0.162 0.239
No. of observations 874 722 697Log-likelihood –921 –680 –645Pseudo-R2 0.018 0.12 0.14
Source: Authors’ regressions using data from the survey described in the text.a. The dependent variable is the respondent’s opinion on the federal tax cut proposed in 2003, where “favored” = 3, a mixed
response = 2, and “did not favor” = 1. See table 11, notes c–f, for more detail about the specification. Standard errors are in paren-theses. ***denotes significantly different from zero at the 1 percent level, ** at the 5 percent level, * at the 10 percent level.
b. The omitted category is “Believes taxes about right.” c. The omitted category is “Deficit not a problem.”
2259-04-Blinder.qxd 8/6/04 11:20 Page 364

toward the tax cuts, and liberals much more opposed (compared with thebase group, which was moderates). Similarly, those who think taxes aretoo high are vastly more likely to favor the Bush tax proposal than arethose who think taxes are too low.45 (In this case, the omitted group isthose who answered that taxes are “about right.”) Finally, those whobelieve taxes should be progressive are less likely to favor the Bush pro-posal, although this coefficient becomes insignificant in the model incolumn 12-3.
We measure knowledge in two ways: general knowledge and knowl-edge specific to tax policy. Our constructed K score measures generalknowledge. Specific knowledge about taxes is measured by the estimatedtax share and by whether the respondent knew that most people pay morein payroll taxes than in income taxes. (Recall that these two indicators ofspecific knowledge are also part of the general knowledge score.)Although general knowledge matters in the estimated model, specificknowledge about taxes does not—and most of the coefficients appear tobe incorrectly signed. (The finding about general knowledge is the oneresult in table 12 that is not typical of what is to come.) The a priori “cor-rect” sign on the coefficient of K is unclear, since the composite scoremeasures knowledge of facts, not of economic theory, labor supply elas-ticities, or anything like that. But people with more factual knowledgeabout the economy apparently are less supportive of the Bush tax cut pro-posal, ceteris paribus.
In column 12-3 we add a pair of dummy variables for whether therespondent believes the budget deficit is a major problem or a minor prob-lem (the omitted category is “no problem at all”). It seems obvious thatviews on this question should influence support for the Bush tax cuts—and they do. However, the standard identification assumption may be dif-ficult to sustain in this case. It seems quite possible that some unmeasuredinfluence (call it “liking George W. Bush”) that makes a respondent favorthe Bush tax cut also makes him or her downplay the importance of bud-get deficits. Hence some readers may prefer to ignore column 12-3. Fortu-nately, including or excluding these two variables does not change theother coefficients much.
Alan S. Blinder and Alan B. Krueger 365
45. Readers can decide for themselves whether they want to think of this as an “ideol-ogy” variable but should recall that the regression already controls for the estimated taxshare.
2259-04-Blinder.qxd 8/6/04 11:20 Page 365

reducing the federal budget deficit. As mentioned, we beganthe deficit part of the questionnaire by asking all respondents how muchof a problem they think the federal budget deficit poses.46 We ordered thethree possible responses in ascending order of concern about the deficit:no problem at all, a minor problem, or a serious problem. Positive coeffi-cients in the ordered probit estimates of table 13 thus indicate greaterconcern.
As the reader may recall, about half the respondents were asked howlarge they think the deficit is, but fewer than half answered the question.So, although it seems sensible to use the estimated deficit as a regressor,doing so would shrink the sample by more than three-quarters. For thisreason table 13 presents only regressions that exclude the estimated deficitvariable. Suffice it to say that equations that included the estimated deficitshowed that people who think the deficit is larger are more worried aboutit, and that including the estimated deficit did not change the signs of theother coefficients.
As before, we start with an initial model that includes only demo-graphic variables plus the only self-interest variable we could think of forthe deficit issue, namely, income, which becomes insignificant once wecontrol for ideology (see column 13-2). The fit is poor, although betterthan in table 12. Women, blacks, older people, and more-educated peopleare more concerned about the deficit (the last group barely so).
The ideology variables, which are added in column 13-2, are moreinteresting, and adding them more than doubles the pseudo-R2. Conserva-tives are less concerned about the deficit than are liberals and moderates,and those with “other” ideologies look a lot like conservatives in thisrespect. Similarly, people who favor progressive taxation—another wayto identify liberals?—are significantly more concerned. People who thinktaxes are too high are more worried about the deficit (column 13-3),whereas people who think taxes are too low are less worried. (The first ofthese coefficients is significant at the 5 percent level, but the second isnot.) This finding may indicate that many respondents expect the eventualcure for the deficit problem to be higher taxes. When it comes to knowl-edge, neither our composite score nor specific knowledge about taxesaffects opinion on the deficit significantly.
366 Brookings Papers on Economic Activity, 1:2004
46. A more direct policy question was also asked—whether the respondent thought thedeficit should be reduced—but the vast majority of respondents answered yes, making theanswers rather uninteresting to analyze.
2259-04-Blinder.qxd 8/6/04 11:20 Page 366

Alan S. Blinder and Alan B. Krueger 367
Table 13. Ordered Probit Model for Opinion on the Federal Deficita
Regression
Independent variable 13-1 13-2 13-3
Self-interestLog of income –0.17** –0.11 –0.08
(0.07) (0.08) (0.08)p-value of joint significance of variables 0.01 0.16 0.30
Ideology and political behaviorLiberal ... 0.01 –0.01
(0.16) (0.16)Conservative ... –0.53*** –0.62***
(0.13) (0.14)Has not thought much about ideology ... –0.19 –0.24
(0.15) (0.15)Other ideology ... –0.46* –0.51**
(0.24) (0.25)Voted in 2000 ... 0.07 0.10
(0.12) (0.13)Believes taxes too high ... ... 0.20**
(0.10)Believes taxes too lowb ... ... –0.31
(0.26)Likes progressivity ... 0.30*** 0.34***
(0.10) (0.10)p-value of joint significance of variables ... 0.00 0.00
KnowledgeKnowledge score ... 0.001 0.002
(0.004) (0.004)Answer on typical family’s tax share ... 0.003 0.003
(0.003) (0.003)Believes income tax larger for most ... –0.02 –0.00
(0.10) (0.10)p-value of joint significance of variables ... 0.81 0.84
Survey designRespondent not told deficit sizec 0.20** 0.18* 0.17*
(0.09) (0.10) (0.10)p-value of joint significance of variables 0.02 0.07 0.08
DemographicsYears of education 0.03* 0.01 0.01
(0.02) (0.02) (0.02)Age 0.009** 0.010** 0.010**
(0.004) (0.005) (0.005)Female 0.24*** 0.37*** 0.34***
(0.09) (0.10) (0.10)Black 0.35** 0.43** 0.40**
(0.15) (0.18) (0.18)(continued)
2259-04-Blinder.qxd 8/6/04 11:20 Page 367

Opinions vary greatly on the methods that should be used to reduce thedeficit. Here we estimated two probit models, both shown in table 14,including only the subset of respondents who said the deficit ought to bereduced. Since the choices were “raising taxes,” “cutting spending,” or“both,” we created two binary variables:
Taxes = 1 if the respondent chose raising taxes or both= 0 otherwise,
and
Spending = 1 if the respondent chose cutting spending or both= 0 otherwise,
and we estimated an ordinary probit model for each. The model for“Spending” is less interesting, however, since almost everyone thinks
368 Brookings Papers on Economic Activity, 1:2004
Table 13. Ordered Probit Model for Opinion on the Federal Deficita (continued)
Regression
Independent variable 13-1 13-2 13-3
Other race 0.19 0.16 0.15(0.17) (0.19) (0.19)
Hispanic 0.16 0.16 0.12(0.17) (0.19) (0.19)
Unemployed 0.15 0.36 0.33(0.20) (0.24) (0.24)
Retired –0.24 –0.21 –0.20(0.16) (0.19) (0.19)
Homemaker –0.24 –0.40* –0.26(0.20) (0.22) (0.23)
Student or other nonemployed .10 .25 .30*(0.14) (0.16) (0.16)
p-value of joint significance of variables 0.00 0.00 0.00
No. of observations 842 716 701Log-likelihood –661 –535 –516Pseudo-R2 0.04 0.09 0.10
Source: Authors’ regressions using data from the survey described in the text.a. The dependent variable is the respondent’s opinion on the deficit as a problem, where “serious problem” = 3, “minor prob-
lem” = 2, and “not a problem” = 1. See table 11, notes c–f, for more detail about the specification. Standard errors are in paren-theses. ***denotes significantly different from zero at the 1 percent level, ** at the 5 percent level, * at the 10 percent level.
b. The omitted category is “Believes taxes about right.” c. The variable equals 1 if the respondent was not told the size of the deficit before being asked whether the deficit was a
problem.
2259-04-Blinder.qxd 8/6/04 11:20 Page 368

Tab
le 1
4. B
inar
y P
robi
t M
odel
s fo
r V
iew
s on
How
to
Red
uce
the
Defi
cita
Dep
ende
nt v
aria
ble
=1
whe
n re
spon
dent
hol
ds in
dica
ted
view
, 0 o
ther
wis
e
Rai
sing
taxe
s is
par
t of s
olut
ion
Cut
ting
spe
ndin
g is
par
t of s
olut
ion
Inde
pend
ent v
aria
ble
14-1
14-2
14-3
14-4
14-5
14-6
Self
-int
eres
tL
og o
f in
com
e–0
.022
–0.0
31–0
.073
0.16
50.
200*
0.22
0(0
.073
)(0
.074
)(0
.085
)(0
.109
)(0
.115
)(0
.138
)p-
valu
e of
join
t sig
nifi
canc
e of
var
iabl
es0.
077
0.67
90.
385
0.13
00.
082
0.11
2
Ideo
logy
and
pol
itic
al b
ehav
ior
Lib
eral
...
–0.0
27–0
.072
…–0
.612
***
–0.6
85**
*(0
.158
)(0
.174
)(0
.224
)(0
.257
)C
onse
rvat
ive
...–0
.197
–0.1
04...
0.23
70.
061
(0.1
38)
(0.1
51)
(0.2
39)
(0.2
69)
Has
not
thou
ght m
uch
abou
t ide
olog
y...
–0.2
78–0
.217
...0.
247
0.14
0(0
.145
)(0
.160
)(0
.258
)(0
.299
)O
ther
ideo
logy
...–0
.408
**–0
.435
...–0
.624
*–0
.818
**(0
.264
)(0
.282
)(0
.324
)(0
.368
)V
oted
in 2
000
...0.
022
0.05
0...
–0.3
47*
–0.5
01*
(0.1
18)
(0.1
33)
(0.2
13)
(0.2
58)
p-va
lue
of jo
int s
igni
fica
nce
of v
aria
bles
…0.
278
0.58
4…
0.00
00.
001
Kno
wle
dge
Kno
wle
dge
scor
e...
–0.0
05*
–0.0
08*
...–0
.005
–0.0
05(0
.003
)(0
.004
)(0
.005
)(0
.007
)A
nsw
er o
n ty
pica
l fam
ily’
s ta
x sh
are
......
0.00
0...
...0.
008
(0.0
04)
(0.0
07)
Bel
ieve
s in
com
e ta
x la
rger
for
mos
t...
...–0
.340
***
......
–0.0
97(0
.108
)(0
.184
)p-
valu
e of
join
t sig
nifi
canc
e of
var
iabl
es…
0.09
50.
007
…0.
316
0.37
2(c
onti
nued
)
2259-04-Blinder.qxd 8/6/04 11:20 Page 369

Tab
le 1
4. B
inar
y P
robi
t M
odel
s fo
r V
iew
s on
How
to
Red
uce
the
Defi
cita
(con
tinue
d)
Dep
ende
nt v
aria
ble
=1
whe
n re
spon
dent
hol
ds in
dica
ted
view
, 0 o
ther
wis
e
Rai
sing
taxe
s is
par
t of s
olut
ion
Cut
ting
spe
ndin
g is
par
t of s
olut
ion
Inde
pend
ent v
aria
ble
14-1
14-2
14-3
14-4
14-5
14-6
Opi
nion
s on
taxe
sL
ikes
pro
gres
sivi
ty...
...0.
063
......
–0.0
04(0
.110
)(0
.196
)B
elie
ves
taxe
s to
o hi
gh...
...–0
.630
***
......
0.52
1***
(0.1
16)
(0.1
91)
Bel
ieve
s ta
xes
too
low
b...
...0.
525
......
–0.6
68**
(0.3
30)
(0.3
38)
p-va
lue
of jo
int s
igni
fica
nce
of v
aria
bles
...…
0.00
0...
...0.
002
Dem
ogra
phic
sY
ears
of
educ
atio
n–0
.012
–0.0
28–0
.049
*–0
.098
***
–0.0
47–0
.013
(0.0
21)
(0.0
23)
(0.0
26)
(0.0
32)
(0.0
37)
(0.0
43)
Age
–0.0
11**
–0.0
10**
–0.0
10**
–0.0
06–0
.003
0.00
6(0
.004
)(0
.004
)(0
.005
)(0
.007
)(0
.007
)(0
.009
)F
emal
e–0
.059
–0.0
96–0
.090
0.07
60.
048
0.13
0(0
.097
)(0
.099
)(0
.109
)(0
.152
)(0
.164
)(0
.186
)
2259-04-Blinder.qxd 8/6/04 11:20 Page 370
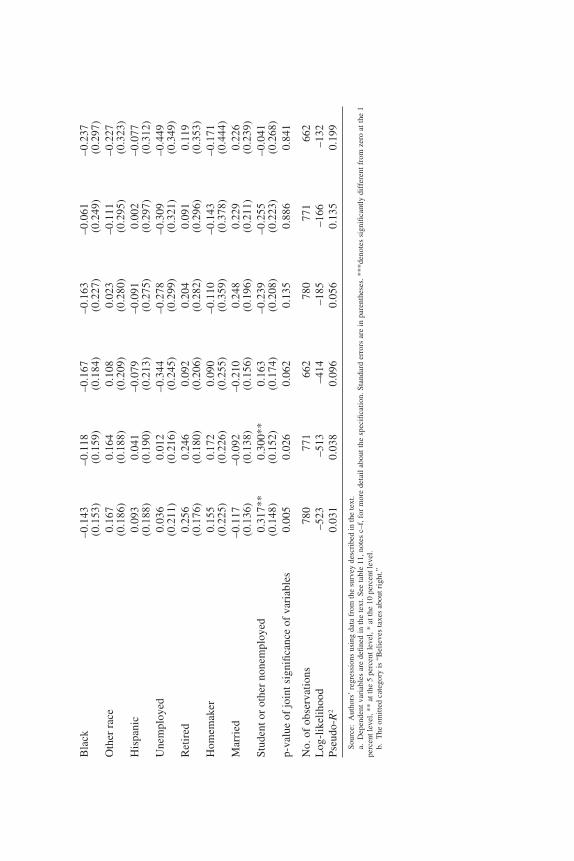
Bla
ck–0
.143
–0.1
18–0
.167
–0.1
63–0
.061
–0.2
37(0
.153
)(0
.159
)(0
.184
)(0
.227
)(0
.249
)(0
.297
)O
ther
rac
e0.
167
0.16
40.
108
0.02
3–0
.111
–0.2
27(0
.186
)(0
.188
)(0
.209
)(0
.280
)(0
.295
)(0
.323
)H
ispa
nic
0.09
30.
041
–0.0
79–0
.091
0.00
2–0
.077
(0.1
88)
(0.1
90)
(0.2
13)
(0.2
75)
(0.2
97)
(0.3
12)
Une
mpl
oyed
0.03
60.
012
–0.3
44–0
.278
–0.3
09–0
.449
(0.2
11)
(0.2
16)
(0.2
45)
(0.2
99)
(0.3
21)
(0.3
49)
Ret
ired
0.25
60.
246
0.09
20.
204
0.09
10.
119
(0.1
76)
(0.1
80)
(0.2
06)
(0.2
82)
(0.2
96)
(0.3
53)
Hom
emak
er0.
155
0.17
20.
090
–0.1
10–0
.143
–0.1
71(0
.225
)(0
.226
)(0
.255
)(0
.359
)(0
.378
)(0
.444
)M
arri
ed–0
.117
–0.0
92–0
.210
0.24
80.
229
0.22
6(0
.136
)(0
.138
)(0
.156
)(0
.196
)(0
.211
)(0
.239
)S
tude
nt o
r ot
her
none
mpl
oyed
0.31
7**
0.30
0**
0.16
3–0
.239
–0.2
55–0
.041
(0.1
48)
(0.1
52)
(0.1
74)
(0.2
08)
(0.2
23)
(0.2
68)
p-va
lue
of jo
int s
igni
fica
nce
of v
aria
bles
0.00
50.
026
0.06
20.
135
0.88
60.
841
No.
of
obse
rvat
ions
780
771
662
780
771
662
Log
-lik
elih
ood
–523
–513
–414
–185
–166
–132
Pse
udo-
R2
0.03
10.
038
0.09
60.
056
0.13
50.
199
Sou
rce:
Aut
hors
’ re
gres
sion
s us
ing
data
fro
m th
e su
rvey
des
crib
ed in
the
text
.a.
Dep
ende
nt v
aria
bles
are
defi
ned
in t
he t
ext.
See
tab
le 1
1, n
otes
c–f
, for
mor
e de
tail
abo
ut t
he s
peci
fica
tion
. Sta
ndar
d er
rors
are
in
pare
nthe
ses.
***
deno
tes
sign
ifica
ntly
dif
fere
nt f
rom
zer
o at
the
1pe
rcen
t lev
el, *
* at
the
5 pe
rcen
t lev
el, *
at t
he 1
0 pe
rcen
t lev
el.
b.T
he o
mit
ted
cate
gory
is “
Bel
ieve
s ta
xes
abou
t rig
ht.”
2259-04-Blinder.qxd 8/6/04 11:20 Page 371
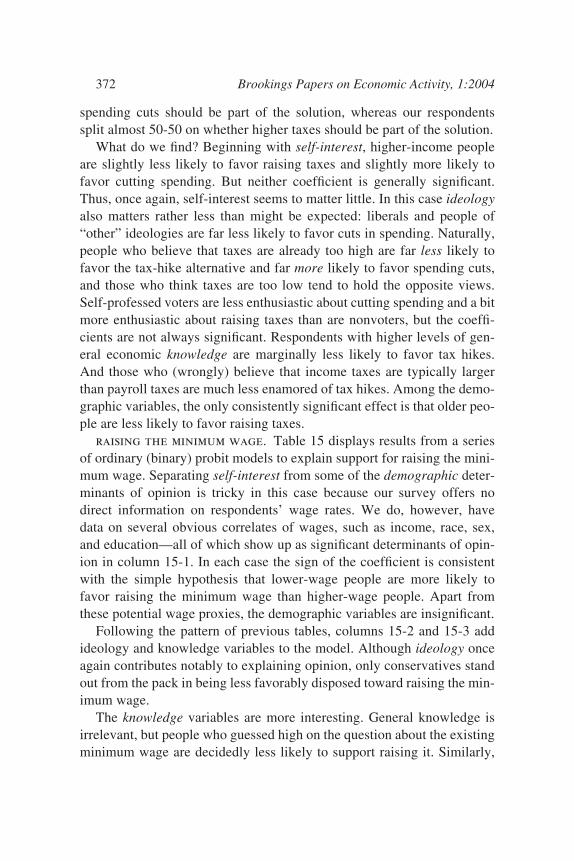
spending cuts should be part of the solution, whereas our respondentssplit almost 50-50 on whether higher taxes should be part of the solution.
What do we find? Beginning with self-interest, higher-income peopleare slightly less likely to favor raising taxes and slightly more likely tofavor cutting spending. But neither coefficient is generally significant.Thus, once again, self-interest seems to matter little. In this case ideologyalso matters rather less than might be expected: liberals and people of“other” ideologies are far less likely to favor cuts in spending. Naturally,people who believe that taxes are already too high are far less likely tofavor the tax-hike alternative and far more likely to favor spending cuts,and those who think taxes are too low tend to hold the opposite views.Self-professed voters are less enthusiastic about cutting spending and a bitmore enthusiastic about raising taxes than are nonvoters, but the coeffi-cients are not always significant. Respondents with higher levels of gen-eral economic knowledge are marginally less likely to favor tax hikes.And those who (wrongly) believe that income taxes are typically largerthan payroll taxes are much less enamored of tax hikes. Among the demo-graphic variables, the only consistently significant effect is that older peo-ple are less likely to favor raising taxes.
raising the minimum wage. Table 15 displays results from a seriesof ordinary (binary) probit models to explain support for raising the mini-mum wage. Separating self-interest from some of the demographic deter-minants of opinion is tricky in this case because our survey offers nodirect information on respondents’ wage rates. We do, however, havedata on several obvious correlates of wages, such as income, race, sex,and education—all of which show up as significant determinants of opin-ion in column 15-1. In each case the sign of the coefficient is consistentwith the simple hypothesis that lower-wage people are more likely tofavor raising the minimum wage than higher-wage people. Apart fromthese potential wage proxies, the demographic variables are insignificant.
Following the pattern of previous tables, columns 15-2 and 15-3 addideology and knowledge variables to the model. Although ideology onceagain contributes notably to explaining opinion, only conservatives standout from the pack in being less favorably disposed toward raising the min-imum wage.
The knowledge variables are more interesting. General knowledge isirrelevant, but people who guessed high on the question about the existingminimum wage are decidedly less likely to support raising it. Similarly,
372 Brookings Papers on Economic Activity, 1:2004
2259-04-Blinder.qxd 8/6/04 11:20 Page 372
Alan S. Blinder and Alan B. Krueger 373
Table 15. Binary Probit Model for Supporting Minimum Wage Increasea
Regression
Independent variable 15-1 15-2 15-3
Self-interestLog of income –0.22*** –0.19** –0.28***
(0.08) (0.09) (0.10)p-value of joint significance of variables 0.03 0.08 0.011
Ideology and political behaviorLiberal ... 0.12 0.19
(0.19) (0.22)Conservative ... –0.48*** –0.39**
(0.15) (0.17)Has not thought much about ideology ... 0.10 0.10
(0.17) (0.20)Other ideology ... –0.09 –0.06
(0.29) (0.32)Voted in 2000 ... –0.03 –0.24
(0.14) (0.17)p-value of joint significance of variables ... 0.000 0.002
KnowledgeKnowledge score ... 0.004 –0.001
(0.004) (0.004)Answer on current value of minimum wage ... ... –0.18***
(0.06)p-value of joint significance of variables ... 0.34 0.006
Opinion on effect of rise in minimum wageA lot will lose jobs ... ... –1.73***
(0.25)Some will lose jobs ... ... –0.95***
(0.13)p-value of joint significance of variables ... ... 0.002
DemographicsYears of education –0.08*** –0.09*** –0.07**
(0.02) (0.03) (0.03)Age –0.002 0.001 –0.008
(0.005) (0.005) (0.006)Female 0.42*** 0.39*** 0.47***
(0.11) (0.12) (0.13)Black 1.18*** 1.05*** 1.13**
(0.29) (0.30) (0.46)Other race 0.40* 0.38 0.34
(0.22) (0.23) (0.26)Hispanic 0.23 0.17 0.34
(0.23) (0.24) (0.27)Unemployed –0.04 –0.14 0.41
(0.26) (0.26) (0.31)(continued)
2259-04-Blinder.qxd 8/6/04 11:20 Page 373
those who believe that a higher minimum wage would cause the loss ofeither “a lot of” jobs (6 percent of the sample) or “some” jobs (36 percent)are much less likely to favor raising it than are those who believe that“hardly anyone” would lose their job (57 percent of the sample). Compar-ing columns 15-2 and 15-3 shows that these three variables measuringspecific knowledge contribute enormously to the goodness of fit.
The minimum wage is arguably the one policy that we have examinedwhere a good case can be made that self-interest—or at least group inter-est—and economic beliefs and knowledge are as strong an influence onpublic opinion as ideology. For example, when the estimated coefficientsshown in column 15-3 are translated into marginal effects on proba-bilities, we find that self-identified conservatives are 13 percentagepoints less likely than liberals to support a minimum wage increase. Sim-ilarly, support for an increase is 14 points higher among blacks thanamong whites, 16 points higher among those in the poorest 15 percent ofhouseholds than among those in the richest 15 percent, 10 points higheramong women than among men, and an impressive 58 points loweramong those who believe that a lot of workers will lose their jobs from ahigher minimum wage than among those who believe very few will losetheir job.
social security policy. We asked two questions about Social Secu-rity policy: whether respondents supported President Bush’s plan for par-
374 Brookings Papers on Economic Activity, 1:2004
Table 15. Binary Probit Model for Supporting Minimum Wage Increasea (continued)
Regression
Independent variable 15-1 15-2 15-3
Retired –0.17 –0.20 –0.02(0.20) (0.20) (0.23)
Homemaker 0.09 0.10 0.16(0.26) (0.26) (0.30)
Student or other nonemployed –0.14 –0.14 –0.37*(0.18) (0.18) (0.21)
p-value of joint significance of variables 0.000 0.000 0.000
No. of observations 838 823 761Log-likelihood –380 –364 –284Pseudo-R2 0.13 0.16 0.29
Source: Authors’ regressions using data from the survey described in the text.a. The dependent variable is whether the respondent favors increasing the minimum wage, where “yes” = 1 and “no” = 0. See
table 11, notes c–f, for more detail about the specification. Standard errors are in parentheses. ***denotes significantly differentfrom zero at the 1 percent level, ** at the 5 percent level, * at the 10 percent level.
2259-04-Blinder.qxd 8/6/04 11:20 Page 374

tial privatization, and how (if at all) the looming Social Security deficitshould be reduced.
Where Social Security was concerned, we included several novel self-interest variables, in addition to income, in the survey (top panel oftable 16). Broadening the concept of self-interest just a bit, we askedwhether the respondent’s mother, father, or both were still alive. We alsoasked respondents whether they expected Social Security to be a “majorsource” of their own retirement income, a “minor source,” or “not muchof a source at all.” Presumably, people in the first category have a muchgreater stake in the outcome of the Social Security debate. Older workersshould also have more of a stake in the current system.
When it comes to attitudes toward personal accounts, the subjectiveself-interest measure of anticipated Social Security income is significant,whereas the more objective ones—income, whether the parents are alive,and age—have inconsistent and weak effects, although they are some-times significant in the expected direction. The χ2 tests for the entiregroup of self-interest variables show statistical significance beyond the1 percent level in columns 16-2 and 16-3, and the importance of SocialSecurity benefits in retirement income is significant in all specifications.
The knowledge variables—whether general or specific to Social Secu-rity—make little contribution to explaining opinions on privatizing SocialSecurity. As noted earlier, respondents who were aware of PresidentBush’s proposal are more likely to support it, but the difference is not sig-nificant (p = 0.19). More-educated people are slightly more likely to favorpartial privatization.
Political ideology matters much more than knowledge. Not surpris-ingly, conservatives are much more likely to back privatization and liber-als more likely to oppose it.
In the questions about how to reduce the actuarial deficit, the choiceswere “mainly by raising the payroll tax” (chosen by 30 percent of respon-dents), “mainly by reducing Social Security benefits” (5 percent), or“both” (34 percent).47 We created two dummy variables analogous tothose for deficit reduction policy:
SS-Taxes = 1 if the respondent chose raising payroll taxes or both= 0 otherwise,
Alan S. Blinder and Alan B. Krueger 375
47. We excluded those who did not answer (9 percent of the sample) and those whosaid “neither” (22 percent).
2259-04-Blinder.qxd 8/6/04 11:20 Page 375

376 Brookings Papers on Economic Activity, 1:2004
Table 16. Ordered Probit Model for Favoring Personal Investment Accounts withinSocial Securitya
Regression
Independent variable 16-1 16-2 16-3
Self-interestLog of income 0.15** 0.11 0.11
(0.06) (0.07) (0.07)Age 0.004 –0.008 –0.009*
(0.004) (0.005) (0.005)Both parents alive 0.18 0.05 –0.04
(0.12) (0.13) (0.13)Only mother alive 0.06 0.03 0.05
(0.14) (0.15) (0.15)Only father aliveb 0.01 –0.15 –0.14
(0.20) (0.24) (0.24)Expects Social Security to be major –0.22* –0.40*** –0.36***
income source (0.12) (0.13) (0.14)Expects Social Security to be minor –0.17* –0.31*** –0.30**
income sourcec (0.10) (0.11) (0.11)p-value of joint significance of variables 0.06 0.004 0.003
Ideology and political behaviorLiberal ... –0.38*** –0.40***
(0.15) (0.15)Conservative ... 0.87*** 0.87***
(0.13) (0.13)Has not thought much about ideology ... 0.31** 0.34**
(0.14) (0.14)Other ideology ... –0.12 –0.18
(0.23) (0.24)Voted in 2000 ... 0.04 0.02
(0.11) (0.11)p-value of joint significance of variables ... 0.000 0.000
KnowledgeKnowledge score ... 0.003 0.002
(0.003) (0.003)Answer on monthly Social Security benefit ... 0.09 0.10
(0.09) (0.09)p-value of joint significance of variables ... 0.35 0.41
Other knowledgeAware of Bush personal accounts proposal ... ... 0.13
(0.10)Aware of projected Social Security deficit ... ... 0.05
(0.11)p-value of joint significance of variables ... ... 0.36
(continued)
2259-04-Blinder.qxd 8/6/04 11:20 Page 376

and
SS-Spending = 1 if the respondent chose cutting benefits or both= 0 otherwise,
and we ran binary probit models for each. The results are displayed intable 17.
Our ability to explain people’s opinions on this important public policyissue is quite modest (pseudo-R2s are in the 0.06 to 0.07 range in bothcases). Surprisingly, and in contrast to the results in table 16, the six self-interest variables are not significant determinants of opinion, either indi-vidually or as a group, once political ideology variables are included. Nor
Alan S. Blinder and Alan B. Krueger 377
Table 16. Ordered Probit Model for Favoring Personal Investment Accounts withinSocial Securitya (continued)
Regression
Independent variable 16-1 16-2 16-3
DemographicsYears of education 0.03 0.05** 0.05**
(0.02) (0.02) (0.02)Female –0.26*** –0.15 –0.11
(0.08) (0.09) (0.10)Black –0.16 –0.07 –0.06
(0.13) (0.16) (0.16)Other race –0.04 –0.24 –0.25
(0.15) (0.17) (0.17)Hispanic 0.15 0.34** 0.34**
(0.15) (0.17) (0.17)Unemployed –0.05 0.07 0.03
(0.18) (0.19) (0.19)Retired –0.10 –0.03 –0.02
(0.15) (0.17) (0.17)Homemaker 0.18 0.14 0.12
(0.18) (0.20) (0.20)Student or other nonemployed –0.06 –0.04 –0.06
(0.13) (0.15) (0.15)p-value of joint significance of variables 0.19 0.22 0.38
No. of observations 862 736 731Log-likelihood –883 –713 –706Pseudo-R2 0.03 0.10 0.10
Source: Authors’ regressions using data from the survey described in the text.a. The dependent variable is the respondent’s opinion on the Bush administration proposal to replace part of Social Security
with private individual accounts, where “favors” = 3, “undecided” = 2, and “opposes” = 1. See table 11, notes c–f, for more detailabout the specification. Standard errors are in parentheses. ***denotes significantly different from zero at the 1 percent level,** at the 5 percent level, * at the 10 percent level.
b. The omitted category is “Neither parent alive.”c. The omitted category is “Expects Social Security to be not much of a source [of retirement income] at all.”
2259-04-Blinder.qxd 8/6/04 11:20 Page 377

Tab
le 1
7.B
inar
y P
robi
t M
odel
s fo
r H
ow t
o R
educ
e th
e So
cial
Sec
urit
y D
efici
ta
Dep
ende
nt v
aria
ble
=1
whe
n re
spon
dent
hol
ds in
dica
ted
view
, 0 o
ther
wis
e
Rai
sing
taxe
s is
par
t of s
olut
ion
Cut
ting
ben
efits
is p
art o
f sol
utio
n
Inde
pend
ent v
aria
ble
17-1
17-2
17-3
17-4
17-5
17-6
Self
-int
eres
tL
og o
f in
com
e–0
.088
–0.1
43–0
.121
0.09
90.
064
0.07
2(0
.078
)(0
.088
)(0
.090
)(0
.073
)(0
.082
)(0
.083
)A
ge–0
.007
–0.0
03–0
.002
–0.0
09*
–0.0
07–0
.007
(0.0
05)
(0.0
06)
(0.0
06)
(0.0
05)
(0.0
06)
(0.0
06)
Bot
h pa
rent
s al
ive
0.09
30.
071
0.10
70.
229
0.14
00.
108
(0.1
53)
(0.1
65)
(0.1
70)
(0.1
45)
(0.1
56)
(0.1
59)
Onl
y fa
ther
ali
ve
–0.3
41–0
.027
0.08
8–0
.350
–0.3
15–0
.371
(0.2
43)
(0.2
82)
(0.2
92)
(0.2
51)
(0.2
76)
(0.2
80)
Onl
y m
othe
r al
iveb
0.16
70.
117
0.12
50.
285*
0.20
80.
162
(0.1
76)
(0.1
82)
(0.1
84)
(0.1
66)
(0.1
71)
(0.1
73)
Exp
ects
Soc
ial S
ecur
ity
to b
e 0.
477*
**0.
268
0.32
2*0.
100
–0.0
74–0
.063
maj
or in
com
e so
urce
(0.1
47)
(0.1
71)
(0.1
76)
(0.1
37)
(0.1
59)
(0.1
62)
Exp
ects
Soc
ial S
ecur
ity
to b
e 0.
214*
0.15
80.
166
–0.0
71–0
.086
–0.0
64m
inor
inco
me
sour
cec
(0.1
19)
(0.1
33)
(0.1
35)
(0.1
15)
(0.1
27)
(0.1
28)
p-va
lue
of jo
int s
igni
fica
nce
of v
aria
bles
0.01
50.
563
0.56
60.
005
0.22
20.
282
Ideo
logy
and
pol
itic
al b
ehav
ior
Lib
eral
...0.
122
0.10
5...
0.18
80.
207
(0.1
83)
(0.1
87)
(0.1
73)
(0.1
75)
Con
serv
ativ
e...
–0.1
06–0
.115
...0.
142
0.12
8(0
.155
)(0
.159
)(0
.149
)(0
.152
)H
as n
ot th
ough
t muc
h ab
out i
deol
ogy
...–0
.001
0.00
1...
0.29
30.
296*
(0.1
75)
(0.1
77)
(0.1
63)
(0.1
64)
Oth
er id
eolo
gy...
–0.6
63**
–0.6
52**
...–0
.112
–0.1
02(0
.281
)(0
.294
)(0
.290
)(0
.299
)
2259-04-Blinder.qxd 8/6/04 11:20 Page 378

Vot
ed in
200
0...
0.12
10.
102
...0.
090
0.10
4(0
.140
)(0
.142
)(0
.131
)(0
.132
)p-
valu
e of
join
t sig
nifi
canc
e of
var
iabl
es...
0.12
20.
196
...0.
485
0.46
5
Kno
wle
dge
Kno
wle
dge
scor
e...
–0.0
08**
–0.0
09**
...0.
001
0.00
1(0
.004
)(0
.004
)(0
.004
)(0
.004
)A
nsw
er o
n m
onth
ly S
ocia
l Sec
urit
y be
nefi
td...
0.00
90.
007
...0.
017*
0.01
7*(0
.010
)(0
.011
)(0
.010
)(0
.010
)A
war
e of
Bus
h pe
rson
al a
ccou
nts
prop
osal
...–0
.204
–0.1
98...
–0.2
52**
–0.2
65**
(0.1
30)
(0.1
32)
(0.1
22)
(0.1
23)
Aw
are
of p
roje
cted
Soc
ial S
ecur
ity
defi
cit
...0.
210
0.23
3...
–0.0
64–0
.057
(0.1
48)
(0.1
49)
(0.1
36)
(0.1
37)
p-va
lue
of jo
int s
igni
fica
nce
of v
aria
bles
...0.
066
0.05
4...
0.10
00.
093
Oth
er o
pini
ons
Bel
ieve
s ta
xes
too
high
......
–0.2
52**
......
0.17
1(0
.118
)(0
.110
)B
elie
ves
taxe
s to
o lo
we
......
–0.1
49...
...0.
191
(0.2
88)
(0.2
77)
p-va
lue
of jo
int s
igni
fica
nce
of v
aria
bles
......
0.10
0...
...0.
278
Dem
ogra
phic
sY
ears
of
educ
atio
n0.
036
0.00
70.
003
–0.0
62**
*–0
.041
–0.0
35(0
.023
)(0
.027
)(0
.028
)(0
.022
)(0
.027
)(0
.027
)F
emal
e0.
269*
**0.
163
0.15
5–0
.238
**–0
.368
***
–0.3
69**
*(0
.105
)(0
.118
)(0
.120
)(0
.099
)(0
.113
)(0
.115
)B
lack
0.15
70.
168
0.18
20.
295*
0.17
30.
148
(0.1
69)
(0.2
11)
(0.2
12)
(0.1
53)
(0.1
87)
(0.1
88)
Oth
er r
ace
–0.0
38–0
.006
0.09
1–0
.239
–0.2
67–0
.248
(0.1
94)
(0.2
11)
(0.2
20)
(0.1
85)
(0.2
00)
(0.2
03)
His
pani
c0.
352*
0.27
70.
200
0.30
7*0.
367*
0.36
0*(0
.208
)(0
.219
)(0
.223
)(0
.187
)(0
.197
)(0
.198
)(c
onti
nued
)
2259-04-Blinder.qxd 8/6/04 11:20 Page 379

Tab
le 1
7.B
inar
y P
robi
t M
odel
s fo
r H
ow t
o R
educ
e th
e So
cial
Sec
urit
y D
efici
ta(c
ontin
ued)
Dep
ende
nt v
aria
ble
=1
whe
n re
spon
dent
hol
ds in
dica
ted
view
, 0 o
ther
wis
e
Rai
sing
taxe
s is
par
t of s
olut
ion
Cut
ting
ben
efits
is p
art o
f sol
utio
n
Inde
pend
ent v
aria
ble
17-1
17-2
17-3
17-4
17-5
17-6
Une
mpl
oyed
0.60
2**
0.79
5**
0.82
1**
–0.0
77–0
.009
–0.0
23(0
.280
)(0
.318
)(0
.323
)(0
.216
)(0
.226
)(0
.227
)R
etir
ed–0
.289
–0.1
00–0
.167
–0.1
67–0
.046
–0.0
37(0
.186
)(0
.206
)(0
.210
)(0
.186
)(0
.201
)(0
.204
)H
omem
aker
–0.1
97–0
.247
–0.3
21–0
.079
–0.1
17–0
.079
(0.2
29)
(0.2
40)
(0.2
44)
(0.2
21)
(0.2
35)
(0.2
39)
Stu
dent
or
othe
r no
nem
ploy
ed–0
.075
–0.0
74–0
.089
–0.3
45**
–0.3
75**
–0.3
42**
(0.1
60)
(0.1
81)
(0.1
85)
(0.1
51)
(0.1
74)
(0.1
76)
p-va
lue
of jo
int s
igni
fica
nce
of v
aria
bles
0.02
90.
318
0.26
80.
005
0.02
10.
049
No.
of
obse
rvat
ions
793
676
664
793
676
664
Log
-lik
elih
ood
–451
–377
–366
–509
–432
–425
Pse
udo-
R2
0.06
30.
069
0.07
50.
060
0.06
50.
065
Sou
rce:
Aut
hors
’ re
gres
sion
s us
ing
data
fro
m th
e su
rvey
des
crib
ed in
the
text
.a.
Dep
ende
nt v
aria
bles
are
defi
ned
in t
he t
ext.
The
ord
er i
n w
hich
que
stio
ns a
bout
the
defi
cit
wer
e as
ked
is a
lso
cont
roll
ed f
or. S
ee t
able
11,
not
es c
–f, f
or m
ore
deta
ils
of t
he s
peci
fica
tion
. Sta
ndar
der
rors
are
in p
aren
thes
es. *
**de
note
s si
gnifi
cant
ly d
iffe
rent
fro
m z
ero
at th
e 1
perc
ent l
evel
, **
at th
e 5
perc
ent l
evel
, * a
t the
10
perc
ent l
evel
. b.
The
om
itte
d ca
tego
ry is
“N
eith
er p
aren
t ali
ve.”
c.T
he o
mit
ted
cate
gory
is “
Exp
ects
Soc
ial S
ecur
ity
to b
e no
t muc
h of
a s
ourc
e [o
f re
tire
men
t inc
ome]
” at
all
.d.
Div
ided
by
100.
e.T
he o
mit
ted
cate
gory
is “
Bel
ieve
s ta
xes
abou
t rig
ht.”
2259-04-Blinder.qxd 8/6/04 11:20 Page 380

does ideology itself matter very much. (The χ2 statistics are insignificantin all cases.)
Knowledge does matter, however. Respondents with higher generalknowledge scores are a bit less likely to favor raising the payroll tax, andpeople with higher estimates of the average monthly Social Security ben-efit are, surprisingly, less likely to want to cut them. (But the coefficient isbarely significant at the 10 percent level.) Interestingly, those who saidthey were aware of President Bush’s privatization proposal are signifi-cantly (at the 5 percent level) less willing to cut Social Security benefits.
On the demographics, women and students are significantly lessinclined to cut benefits, whereas Hispanics are more inclined (but thecoefficient is barely significant). Unemployed people are decidedly lessenthusiastic than others about raising payroll taxes.
health insurance policy. Our last two policy questions pertain tohealth insurance. As discussed above, we asked respondents whether theyfavored adding a prescription drug benefit to Medicare and whether theyfavored universal coverage.
In addition to age and income, the survey included what we believedwould be useful self-interest variables tailored to these questions. Asalready noted, we asked whether the respondent’s parents were alive; wealso asked whether the respondent or anyone in his or her immediatefamily was uninsured. We begin with table 18, which displays the resultsfor an ordinary probit model of opinion on universal health insurancecoverage.
Higher-income people are significantly more opposed to universal cov-erage (p = 0.000), and uninsured respondents are more likely to favor it(p = 0.004 in column 18-1, but p = 0.108 in column 18-2).48 However, nei-ther age nor having an uninsured family member affects one’s opinion.The coefficients on own insurance coverage imply that people who lackhealth insurance are more likely to support universal coverage (by 12 per-centage points in column 18-1 and 8 points in column 18-2). As usual,measures of political ideology are successful as regressors. Liberals arefar more likely to favor universal coverage, and conservatives are muchmore likely to oppose it. Interestingly, self-reported voters are less likely
Alan S. Blinder and Alan B. Krueger 381
48. Our results indicate more of an impact of self-interest on support for universalhealth insurance than has been found in previous research. For example, Sears and others(1980) find that a respondent’s support for government-funded national health insurance isunrelated to his or her own health insurance coverage.
2259-04-Blinder.qxd 8/6/04 11:20 Page 381

to favor universal coverage. Knowledge appears to have a modest effecton opinions on universal coverage. The general knowledge score is irrele-vant, as usual. But people with higher estimates of the uncovered popu-lation are a bit more likely to favor universal coverage.49 Finally,demographic variables do not seem to matter—not even age. Column18-1 indicates that blacks are more likely than whites to favor universalcoverage, but the coefficient becomes insignificant once ideology andknowledge are added to the equation (column 18-2).
382 Brookings Papers on Economic Activity, 1:2004
49. The coefficient implies that a 10-percentage-point increase in the presumed uncov-ered population is associated with a 3-percentage-point increase in support for universalhealth insurance.
Table 18. Binary Probit Model for Favoring Universal Health Insurancea
Regression
Independent variable 18-1 18-2
Self-interestLog of income –0.42*** –0.30***
(0.09) (0.10)Uninsured 0.56*** 0.35
(0.20) (0.22)Family member uninsured –0.11 –0.15
(0.18) (0.20)p-value of joint significance of variables 0.000 0.005
Ideology and political behaviorLiberal ... 0.58***
(0.22)Conservative ... –0.77***
(0.17)Has not thought much about ideology ... 0.15
(0.20)Other ideology ... –0.48
(0.30)Voted in 2000 ... –0.40**
(0.17)p-value of joint significance of variables ... 0.000
KnowledgeKnowledge score ... 0.002
(0.005)Answer on percent of Americans uninsured ... 0.009**
(0.005)p-value of joint significance of variables ... 0.12
(continued)
2259-04-Blinder.qxd 8/6/04 11:20 Page 382

Table 19 explores the determinants of public opinion about adding aprescription drug benefit to Medicare; we limit the sample to respondentswho, at the time of the survey, knew that Medicare did not cover prescrip-tion drugs. Here demographics matter more than it does on most otherpolicy issues. Blacks and more-educated people are far less likely to sup-port such a benefit, whereas students are much more likely to support it.The results on self-interest, ideology, and knowledge are by now familiar:self-interest and knowledge are not significant determinants of opinion,but political ideology is. In particular, liberals and respondents with“other” (than liberal, conservative, or moderate) ideology are substan-tially more likely to support a prescription drug benefit. So are self-professed voters, at least in two of the three specifications.
Alan S. Blinder and Alan B. Krueger 383
Table 18. Binary Probit Model for Favoring Universal Health Insurance (continued)
Regression
Independent variable 18-1 18-2
DemographicsYears of education –0.02 –0.01
(0.03) (0.03)Age 0.001 .004
(0.005) (0.006)Female 0.21* 0.08
(0.11) (0.13)Black 0.62*** 0.28
(0.23) (0.25)Other race –0.05 –0.21
(0.21) (0.24)Hispanic 0.38* 0.23
(0.23) (0.25)Unemployed –0.08 –0.22
(0.23) (0.31)Retired –0.15 –0.15
(0.21) (0.24)Homemaker 0.12 0.08
(0.26) (0.29)Student or other nonemployed 0.24 0.18
(0.19) (0.22)p-value of joint significance of variables 0.03 0.17
No. of observations 761 674Log-likelihood –356 –287Pseudo-R2 0.12 0.21
Source: Authors’ regressions using data from the survey described in the text.a. The dependent variable is whether the respondent favors universal health insurance, where 1 = “yes” and 0 = “no.” See table
11, notes c–f, for more details of the specification. Standard errors are in parentheses. ***denotes significantly different from zeroat the 1 percent level, ** at the 5 percent level, * at the 10 percent level.
2259-04-Blinder.qxd 8/6/04 11:20 Page 383

Conclusion
Taken as a whole, our survey results hold little good news for those ofus engaged in economic education or economic policy—or for economictheorists who use homo economicus as the backbone of their models ofpolitical economy.
384 Brookings Papers on Economic Activity, 1:2004
Table 19. Ordered Probit Model for Favoring Prescription Drug Insurance in Medicarea
Regression
Independent variable 19-1 19-2 19-3
Self-interestLog of income 0.100 0.100 0.107
(0.119) (0.119) (0.128)Age –0.008 –0.007 –0.016*
(0.007) (0.008) (0.008)Both parents alive –0.010 0.022 –0.111
(0.220) (0.221) (0.231)Only father alive 0.297 0.306 0.083
(0.470) (0.465) (0.480)Only mother aliveb –0.250 –0.284 –0.350
(0.236) (0.237) (0.245)p-value of joint significance of variables 0.524 0.453 0.240
Ideology and political behaviorLiberal 1.064*** 1.069*** 0.766**
(0.295) (0.294) (0.313)Conservative 0.143 0.152 –0.127
(0.187) (0.186) (0.209)Has not thought much about ideology 0.312 0.360* –0.182
(0.204) (0.206) (0.239)Other ideology 1.068** 1.069** 0.640
(0.544) (0.542) (0.564)Voted in 2000 0.374** 0.432** 0.192
(0.185) (0.187) (0.210)p-value of joint significance of variables 0.002 0.001 0.023
KnowledgeKnowledge score ... 0.003 0.005
(0.005) (0.005)Believes Medicare already partly covers drugsc ... ... 0.079
... ... (0.199)p-value of joint significance of variables ... 0.559 0.587
(continued)
2259-04-Blinder.qxd 8/6/04 11:20 Page 384

On the positive side, a large majority of a representative national sam-ple of Americans does express a strong desire to be well informed aboutmajor economic policy issues. And their factual knowledge is, on aver-age, reasonably good. From where does their information come? Theshort answer is television, followed at a (long) distance by local (ratherthan national) newspapers. Unfortunately, as a source of information,
Alan S. Blinder and Alan B. Krueger 385
Table 19. Ordered Probit Model for Favoring Prescription Drug Insurance in Medicarea (continued)
Regression
Independent variable 19-1 19-2 19-3
DemographicsYears of education –0.095*** –0.099*** –0.140***
(0.034) (0.035) (0.038)Female 0.197 0.236 0.086
(0.153) (0.155) (0.170)Black –0.589** –0.594** –0.506
(0.231) (0.232) (0.261)Other race –0.012 –0.138 –0.260
(0.295) (0.304) (0.326)Hispanic –0.100 –0.027 –0.209
(0.293) (0.301) (0.322)Student or other nonemployed 1.056*** 1.040*** 1.131**
(0.386) (0.383) (0.517)Unemployed –0.130 –0.156 –0.326
(0.317) (0.317) (0.336)Retired 0.009 0.050 0.434
(0.257) (0.260) (0.286)Homemaker –0.015 –0.028 0.270
(0.342) (0.340) (0.377)Married 0.440** 0.398* 0.213
(0.221) (0.220) (0.243)p-value of joint significance of variables 0.002 0.001 0.001
No. of observations 629 626 567Log-likelihood –206 –202 –176Pseudo-R2 0.128 0.133 0.139
Source: Authors’ regressions using data from the survey described in the text.a. The dependent variable is the respondent’s opinion on enactment of a prescription drug benefit within Medicare, where
“favors” = 3, “no answer” = 2, and “opposes” = 1. The sample includes only those who answered (correctly) that Medicare didnot cover prescription drugs outside of the hospital for Medicare patients at the time of the survey, or who said coverage was onlypartial. See table 11, notes c–f, for more detail about the specification. Equations also control for order of questions. Standarderrors are in parentheses. ***denotes significantly different from zero at the 1 percent level, ** at the 5 percent level, * at the10 percent level.
b. The omitted category is “Neither parent alive.”c. The sample excludes those who said they believed that Medicare already provided full prescription drug coverage.
2259-04-Blinder.qxd 8/6/04 11:20 Page 385

television does far better on quantity than on quality. For example, itranks eighth among the eleven possible sources of information in its con-tribution to our constructed measure of economic knowledge, althoughwe recognize that one can question the direction of causality here.Perhaps more disconcerting, economic knowledge is barely higher amongthose people who use more sources of information, use information moreintensively, or express a stronger desire to be informed than do others. Onthe other hand, people with more education and more income are moreknowledgeable.
As a broad generalization—some exceptions to which we havenoted—ideology seems to play a stronger role in shaping opinion on eco-nomic policy issues than either self-interest or knowledge, although spe-cific (as opposed to general) knowledge does influence opinion on anumber of matters.50 This finding is not terribly different from the conclu-sion reached by Victor Fuchs, Krueger, and James Poterba in their surveyof professional economists:51 left-right ideology seemed to shape opinionmore than parameter estimates did. The contrast with homo economicus—who is well informed, nonideological, and extremely self-interested—could hardly be more stark. Instead, our findings seem more consistentwith an idea expressed in the political science literature, namely, that peo-ple often use ideology as a short-cut heuristic for deciding what positionto take, when properly informing oneself is difficult.52
In closing, we offer two speculative explanations for this basic finding:confusion and generosity of spirit. Both explanations start from thepremise that people typically develop conventional (“ideological”) beliefsabout how the world works and about what is good for them and for thecommonweal. Thereafter the two explanations diverge. The confusionexplanation emphasizes how misperceptions of their own self-interest canlead people to act (or, in the case of our respondents, to speak) againsttheir best interests.53 The generosity explanation emphasizes that, at least
386 Brookings Papers on Economic Activity, 1:2004
50. Of course, our K variable measures knowledge with considerable error, whichprobably biases its coefficient downward.
51. Fuchs, Krueger, and Poterba (1998).52. See, for example, Lupia (1994).53. Bartels (2003) and Slemrod (2003) fall squarely within this camp. Romer (2003)
provides a start at modeling political outcomes under the assumption that voters have sys-tematic misperceptions.
2259-04-Blinder.qxd 8/6/04 11:20 Page 386
when it comes to national economic policy, people are often more inter-ested in what they perceive to be the common good than they are in theirown narrow self-interest.54 In both cases there is at least room for hopethat greater knowledge will improve decisionmaking, even though itappears from our survey that efforts in this dimension have shown lessthan impressive results to date.
Alan S. Blinder and Alan B. Krueger 387
54. See Caplan (2002) and the essays in Mansbridge (1990) for further discussion ofhow group interests affect public opinion and voting.
2259-04-Blinder.qxd 8/6/04 11:20 Page 387
Comment and Discussion
William D. Nordhaus: In a democracy, one might suppose, the decisionsof elected politicians are to some extent influenced by public opinion.This is the motivation for the question, which Alan Blinder and AlanKrueger address in this paper, of how public opinion and, specifically,public opinion about economic affairs is determined.
Blinder and Krueger investigate the state of economic knowledge andpreferences among the general public by tracking down a random sampleand asking them a battery of fact questions (to determine their knowl-edge), personal questions (to determine their self-interest), and economicpolicy questions (to see where they stand on the issues of the day). No oneshould be surprised to learn that the authors have gone about this task in athoughtful manner and have produced many interesting findings. The sur-vey has been carefully administered, and the response rate is high. Mycomments will raise a number of questions about their questions, whichleave me thinking that survey research is even harder than I originallyimagined.
To begin with, one might ask whether the respondents behave like thetextbook homo economicus classicus. Somewhere, someone probablybelieves that economic policy opinions are formed by continuous-timemaximization of a consistent preference function maximizing the presentvalue of the utility of consumption using Bayesian updating in light of theconstant inflow of data from the Internet, several televisions tuned to thefinancial channels, and a live feed from the Brookings Panel. But anyonewho still entertains that notion will quickly discard it after reading thispaper.
388
2259-04-Blinder.qxd 8/6/04 11:20 Page 388
What do we learn about the public’s economic opinions? In reality,public opinions about the economy in a democracy are the outcome of avery complex process in which people try to sort through conflictingaccounts and theories, often provided by unreliable narrators. The newscontains much factual reporting (including the Dow Jones average toseven significant digits), but very little analytical reporting. Analyses areoften shaded by political motives (if by public figures), by profit motives(if by companies), or by desire for publicity (if by private individuals).Even a good news source such as PBS’s Jim Lehrer NewsHour feels it hasto present a balanced point of view, where “balanced” means someone isthere to defend supply-side economics.
Americans report that, of all professions, they trust nurses most and carsalesmen and HMO managers least.1 Canadians report that they trustpharmacists most and national politicians least (only 9 percent of Canadi-ans trust the latter).2 Yet people get much of their economic knowledgefrom national politicians and little from nurses and pharmacists. I suspectthat most people view getting economic information somewhat akin toextracting a referral from their HMO. Given the difficulties of knowingwhom to trust and the contentiousness of most policy discussions, itwould not be surprising if the public is confused at best and ill informed atworst.
How do Blinder and Krueger attack this issue? They administer a bat-tery of nine fact questions to see how their respondents have sortedthrough the varieties of conflicting opinions. I admit that I found some ofthe questions vaguely unsatisfying, partly because recall of numericalfacts is not identical with sound economic analysis.
In addition, I found myself constantly worrying about the questions.For example, on taxes the question was
“About what percentage of the typical American family’s income do you thinkgoes to paying taxes—including all levels of government?”
This is actually a very hard question. Does “typical” mean median oraverage or what the respondent thinks is a typical nuclear family? Should
Alan S. Blinder and Alan B. Krueger 389
1. “Matter of Trust: HMOs Get Little,” Managed Care (January 2004), www.managedcaremag.com/archives/0401/0401.news_trust.html.
2. “So, Whom Do We Trust?” Toronto: Ipsos-Reid (January 22, 2003), www.acpa.ca/press_news/2003/trust.pdf.
2259-04-Blinder.qxd 8/6/04 11:20 Page 389
I be economically sophisticated and include production taxes and busi-ness taxes in the numerator, as a good public finance theorist wouldrecommend and a good Chicago economist would predict? (Blinder andKrueger would not.) Should I include imputed rent on my owner-occupied house in the denominator as the Bureau of Economic Analysisdoes? (Blinder and Krueger do, but I doubt that most Americans would.)What do we learn from an incorrect answer to this question? Apparently,survey respondents shared some of my confusions, for they grossly over-estimated the typical share of taxes paid by households.
In addition to the knowledge questions, people were asked a number ofpublic policy questions. For example:
“Are you aware that President Bush has proposed that part of Social Security bereplaced by personal investment accounts?”
followed by
“Do you favor or oppose this idea, or are you undecided?”
I would be surprised if most people had much knowledge of this proposal.I, for one, have forgotten the details, and perhaps even President Bushwould have trouble explaining it clearly. The term “personal investmentaccounts” has a nice ring to it, and I personally am in favor of them. Infact, I think I already have a few of them. More of a problem is that theterm is embedded in a question that states that personal accounts are aBush proposal, so the question is probably heard as, “President Bush hasmade a new proposal called personal investment accounts; how do youfeel about President Bush and his proposals?” Under this interpretation, itis not a question about Social Security but about attitudes toward Bush.
Economists are always complaining about questions that are posedwithout the context of the trade-offs involved. The most careful work inthis area comes from environmental economists who have designed con-tingent valuation studies to learn about the value of pristine Alaskanwaters or of preserving whooping cranes. The lesson from these studies isthat one must be very careful to specify both the “commodity” and the“price” to have any hope that the responses will be meaningful.
Blinder and Krueger are inconsistent in this respect. For example,when querying about drug benefits, they ask
“Would you favor or oppose adding a prescription drug benefit to Medicare forpeople who are not in the hospital, bearing in mind that it would have to be paidfor somehow?”
390 Brookings Papers on Economic Activity, 1:2004
2259-04-Blinder.qxd 8/6/04 11:20 Page 390

It is definitely good to bear in mind that the proposed benefit would haveto be paid for. But “somehow” is a little vague. It does not explain thepayment method, and so it does not really confront the respondent with arealistic choice. The average respondent might assume that “somehow”means “by someone else,” as in former Senator Russell Long’s ditty,“Don’t tax you, don’t tax me, tax that fellow behind the tree.”
Even worse in this regard is the question on national health insurance:
“Do you favor or oppose what is called ‘universal health insurance coverage,’meaning that the government would make sure that every American is coveredby a health insurance policy?”
It is not surprising that a great majority of people favor such a policywhen no price tag or tax tag is attached. I favor universal health insurance.I would guess most of the Brookings Panel favor it, whatever it is. But itwould be better to tease out preferences with something like:
“The next question is about health insurance. One proposal is to extend theMedicare program to all U.S. residents. Statisticians estimate that this proposalcould be financed with a tax of $2,500 per family. Would you favor or opposesuch a proposal?”
The questions on fiscal policy are potentially the most illuminating,given the widespread support of the American people for tax cuts. HereBlinder and Krueger begin with the following:
“Do you think taxes in the United States are generally too high, too low, orabout right?”
They find that most people think taxes are too high (71 percent) and vir-tually none (3 percent) think they are too low. I agree with most people.I think my taxes are too high. I also think that airplanes are too crowded,teenagers are too noisy, cell phones are a nuisance, and there are toomany SUVs. But these opinions, like the view that taxes are too high, areof little relevance because the relevant budget constraints are nowhere insight.
I mentioned above that people overestimate the typical tax rate. Is itpossible that people overestimate the size of things they dislike? Recallthat various surveys have found that people want to reduce U.S. spendingon foreign aid, but at the same time they estimate that U.S. spending onforeign aid is 20 percent of the budget (an overestimate by about a factor
Alan S. Blinder and Alan B. Krueger 391
2259-04-Blinder.qxd 8/6/04 11:20 Page 391

of twenty).3 Do people think taxes are too high because they constantlyhear that taxes are a menace to the Republic rather than that taxes are theprice of a civilized society? People may want lower taxes in return forlarger deficits, but would they want lower taxes in return for lower SocialSecurity benefits, fewer police, dirtier streets, and more crowdedclassrooms?
Blinder and Krueger also ask whether respondents favored the Bushtax cuts. The most important determinants of the answers are politicalphilosophy (liberal versus conservative) and whether the respondentthought taxes were too high or too low to begin with. Self-interest anddemographic variables (in the form of income) play a very modest role.Instead, what can roughly be thought of as ideology is the key determi-nant of attitudes on central political issues such as tax cuts.
A similar pattern of responses is seen on the questions about the impor-tance of the federal budget deficit as a problem and how to solve it.Whether people thought taxes were part of the solution depended chieflyon whether they were conservative or liberal and on whether they thoughttaxes were too high to begin with. Here I worry a little about causality.Am I conservative because I don’t like taxes, or do I dislike taxes becauseI’m conservative? If the label I attach to myself describes my constella-tion of views, what do we learn from these regressions? Don’t we reallyneed to go a step further and find out why I dislike taxes? All this maysuggest that the ideology variables are not useful right-hand-sidevariables.
There are many fascinating findings here, but I will end with one puz-zle. The authors conclude that economic opinions and policy attitudesappear to be largely independent of self-interest. They find, for example,that lower-income people are more likely to think taxes are too high thanhigher-income people. In other areas, such as Social Security and deficitreduction, the coefficient on self-interest often has the right sign, but itsimportance is swamped by ideological variables. This does suggest, forone thing, that Democratic politicians like Howard Dean could never per-suade the guy with a pickup truck sporting a Confederate-flag decal thatrepealing the death tax is a bad idea.
392 Brookings Papers on Economic Activity, 1:2004
3. Program on International Policy Attitudes, University of Maryland, “Americans onForeign Aid and World Hunger: A Study of U.S. Public Attitudes (February 2, 2001),www.pipa.org/OnlineReports/BFW/finding1.html.
2259-04-Blinder.qxd 8/6/04 11:20 Page 392

The authors’ conclusion here is not heretical; it is supported by a sub-stantial array of research in the political science literature, which con-cludes, for example, that there are “no strong effects of personalfinancial well-being on the vote.”4 This result is consistent with the viewthat a substantial fraction of voters favor abolition of the inheritance tax,even though its repeal is likely to benefit only about 1 percent of thepopulation.
Here a paradox lurks. Economists may recall results from the “politicalbusiness cycle” literature showing that election returns track the businesscycle, particularly for presidential elections. My colleague Ray Fair didbetter than most polling firms (or the Supreme Court) in calling the 2000election, largely on the basis of economic variables.5 Moreover, aggregatestudies over the last three decades, going back to seminal work by GeraldKramer,6 as well as studies in virtually every advanced democracy, makeit clear that voters punish incumbents who are running for elections whenunemployment is rising, real incomes are falling, and inflation is high.How is it that voters punish incumbents who bring on bad times but donot vote on the basis of their self-interest?
General discussion: Several participants discussed the authors’ findingthat self-interest was not a key factor shaping views on economic issues.Benjamin Friedman applauded the paper for its new evidence about howpeople form their economic opinions. But he questioned whether atti-tudes across income groups about tax burdens and tax cuts should beinterpreted as indifference to self-interest. He noted that the actual bur-den of taxes differed from that implied by statutory income tax rates.Low- and middle-income people had to pay their income and payrolltaxes out of their paychecks, whereas the well-to-do had many avenuesfor avoiding high tax rates. Furthermore, assuming declining marginalutility of income, a typical tax cut package might be expected to producemore utility for lower-income people. Shang-Jin Wei argued that if self-interest helped to predict ideology, the authors could be misattributing theeffect of self-interest to ideology. Olivier Blanchard noted that both ideol-ogy and self-interest have been found by others to be related to voting
Alan S. Blinder and Alan B. Krueger 393
4. Feldman (1984); also see Fiorina (1978) and Rosenstone, Hansen, and Kinder(1986).
5. Fair (2002)6. Kramer (1971).
2259-04-Blinder.qxd 8/6/04 11:20 Page 393

behavior, and that all observers grant the importance of self-interest invoting on issues such as property taxes. Martin Baily suggested that peo-ple may not be truthful in responding to questionnaires, and he cited widedifferences between how people say they voted in union elections and theactual vote totals.
A number of panelists discussed how other questions that the surveydid not ask might have yielded illuminating results. Robert Gordonargued for questions that related an economic fact to a political interpreta-tion; for example, did respondents attribute the current economic reboundto George W. Bush’s tax cuts or to Alan Greenspan’s low interest rates?William Dickens compared the present paper with a recent paper byBryan Caplan in the Economic Journal. Caplan found broad agreementamong economists on what the “right” answers were, and that more-knowledgeable people got more answers right (that is, they agreed withthe consensus of economists). Dickens conjectured that economists wouldagree less about the questions in the authors’ survey, which might explainthe low importance of knowledge in predicting views on economic pol-icy. William Gale, following up on William Nordhaus’s comment, notedthat survey questions that omit reference to actual budget constraintsoften produce very different answers than do questions framed aroundrealistic alternatives. He reported that proposals to balance the budget orcut taxes typically receive strong support when asked without the con-straint and strong opposition when asked with it.
Austan Goolsbee discussed whether the paper’s results really under-mined the homo economicus model. He noted that, because policies in ademocracy are set by elected officials, self-interest may be better reflectedin who people vote for than in their own answers to economic questions.Evidence that people’s answers to survey questions were inconsistentwith that model need not imply that economic policy will be inefficient.As for whether homo economicus was the relevant model for economiststo use, he reasoned that what mattered was such things as whether agentsknew their own tax rates, not whether they knew any facts about macro-economic aggregates.
The great heterogeneity of beliefs among the respondents receivedconsiderable attention. Edward Glaeser noted that, since any one person’svote is irrelevant, the homo economicus model would predict that individ-uals will be ill informed about the issues and that beliefs will be widelydispersed. He saw this as a challenge to prevailing Bayesian models and a
394 Brookings Papers on Economic Activity, 1:2004
2259-04-Blinder.qxd 8/6/04 11:20 Page 394
challenge to understanding how the market for ideas works and howbeliefs are formed. In this connection, he reasoned that understanding theincentives of those who provide information as well as the framework inwhich people form their views was critical; for example, in school Euro-peans are taught in a Marxian framework whereas Americans are taughtHoratio Alger. Friedman suggested analyzing the authors’ data for con-tent bias associated with different information sources. For example, howdid the views of those who relied on economists for economic infor-mation differ from the views of those who relied on ministers? AndreiShleifer pointed out that people generally seek out providers of infor-mation that confirm their own beliefs: conservatives read and listen toconservative media sources and liberals to liberal media sources. Oneconsequence is that conservatives are most likely to be confused or wrongabout those issues where the conservative media want them to be con-fused or wrong, and liberals are most likely to be confused or wrong aboutissues where the liberal media want them to be confused or wrong.
Peter Orszag was both surprised and heartened by the survey responsesregarding the long-term Social Security deficit and how to reduce it.Recent political proposals have relied mainly or entirely on benefit reduc-tions to eliminate the prospective deficits, but only 5 percent of surveyrespondents chose that approach. The largest group of respondents(34 percent) wanted a combination of tax hikes and benefit cuts, whichcorresponds to the approach detailed in the recent book written by Orszagand Peter Diamond.
Alan S. Blinder and Alan B. Krueger 395
2259-04-Blinder.qxd 8/6/04 11:20 Page 395
References
Bartels, Larry M. 2003. “Homer Gets a Tax Cut: Inequality and Public Policy inthe American Mind.” Working paper. Princeton University (August).
Black, Duncan. 1948. “On the Rationale of Group Decision-Making.” Journal ofPolitical Economy 56, no. 1: 23–34.
Blendon, Robert J., and others. 1997. “Bridging the Gap between the Public’s andEconomists’ Views of the Economy.” Journal of Economic Perspectives 11,no. 3: 105–18.
Blinder, Alan S. 1997. “Is Government Too Political?” Foreign Affairs 76(November/December): 115–26.
Blinder, Alan S., and John Morgan. Forthcoming. “Are Two Heads Better thanOne? Monetary Policy by Committee.” Journal of Money, Credit, and Banking.
Caplan, Bryan. 2002. “Sociotropes, Systematic Bias, and Political Failure:Reflections on the Survey of Americans and Economists on the Economy.”Social Science Quarterly 83, no. 2: 416–35.
Card, David, and Alan B. Krueger. 1995. Myth and Measurement: The New Eco-nomics of the Minimum Wage. Princeton University Press.
Citrin, Jack, and Donald Philip Green. 1990. “The Self-Interest Motive in Ameri-can Public Opinion.” In Research in Micropolitics: Public Opinion, 1990: AResearch Annual, vol. 3, edited by Samuel Long. Greenwich, Conn.: JAIPress.
Downs, Anthony. 1957. An Economic Theory of Democracy. New York: Harperand Brothers.
Fair, Ray C. 2002. “The Effect of Economic Events on Votes for President: 2000Update.” Yale University, Department of Economics. Available at fairmodel.econ.yale.edu/RAYFAIR/PDF/2002DHTM.HTM.
Feldman, Stanley. 1984. “Economic Self-Interest and the Vote: Evidence andMeaning.” Political Behavior 6, no. 3: 229–51.
Fiorina, Morris P. 1978. “Economic Retrospective Voting in American NationalElections: A Micro-Analysis.” American Journal of Political Science 22, no.2: 426–43.
Fuchs, Victor R., Alan B. Krueger, and James M. Poterba. 1998. “Economists’Views about Parameters, Values, and Policies: Survey Results in Labor andPublic Economics.” Journal of Economic Literature 36, no. 3: 1387–1425.
Fuller, Dan, and Doris Geide-Stevenson. 2003. “Consensus Among Economists:Revisited.” Journal of Economic Education 34, no. 4 (Fall): 369–87.
Gale, William G., and Jeffrey Rohaly. 2003. “Three-Quarters of Filers Pay Morein Payroll Taxes Than in Income Taxes.” Tax Notes (January 6), p. 119.
Hamilton, James T. 2003. All the News That’s Fit to Sell: How the Market Trans-forms Information into News. Princeton University Press.
Hansen, Karsten T., James J. Heckman, and Kathleen J. Mullen. Forthcoming.“The Effect of Schooling and Ability on Achievement Test Scores.” Journalof Econometrics.
396 Brookings Papers on Economic Activity, 1:2004
2259-04-Blinder.qxd 8/6/04 11:20 Page 396
Kahneman, Daniel. 1986. “Comments.” In Valuing Environmental Goods: AnAssessment of the Contingent Valuation Method, edited by Ronald G. Cum-mings, David S. Brookshire, and William D. Schulze. Totowa, N.J.: Rowmanand Allanheld.
Keeter, Scott, and others. 2000. “Consequences of Reducing Nonresponse in aNational Telephone Survey.” Public Opinion Quarterly 64, no. 2: 125–48.
Kramer, Gerald H. 1971. “Short-Term Fluctuations in U.S. Voting Behavior,1896–1954.” American Political Science Review 65, no. 1: 131–43.
Lupia, Arthur. 1994. “Shortcuts Versus Encyclopedias: Information and VotingBehavior in California Insurance Reform Elections.” American Political Sci-ence Review 88, no. 1: 63–76.
Mansbridge, Jane J., ed. 1990. Beyond Self-Interest. University of Chicago Press. McDonald, Michael P. 2003. “On the Over-Report Bias of the National Election
Study Turnout Rate.” Political Analysis 11, no. 2: 180–86.Monroe, Alan D. 1979. “Consistency between Public Preferences and National
Policy Decisions.” American Politics Quarterly 7, no. 1: 3–19. Mullainathan, Sendhil, and Andrei Shleifer. 2003. “The Market for News.”
Working paper. Harvard University, Department of Economics (December).Page, Benjamin I., and Robert Y. Shapiro. 1983. “Effects of Public Opinion on
Policy.” American Political Science Review 77, no. 1: 175–90. Palfrey, Thomas R., and Keith T. Poole. 1987. “The Relationship between Infor-
mation, Ideology, and Voting Behavior.” American Journal of Political Sci-ence 31, no. 3: 511–30.
Persson, Torsten, and Guido Tabellini. 2000. Political Economics: ExplainingEconomic Policy. MIT Press.
Romer, David. 2003. “Misconceptions and Political Outcomes.” Economic Jour-nal 113, no. 484: 1–20.
Rosenstone, Steven J., John Mark Hansen, and Donald R. Kinder. 1986. “Mea-suring Change in Personal Economic Well-Being.” Public Opinion Quarterly50, no. 2 (Summer): 176–92.
Sears, David O., and others. 1980. “Self-Interest vs. Symbolic Politics in PolicyAttitudes and Presidential Voting.” American Political Science Review 74, no.3: 670–84.
Silver, Brian D., Barbara A. Anderson, and Paul R. Abramson. 1986. “Who Over-reports Voting?” American Political Science Review 80, no. 2: 613–24.
Slemrod, Joel. 2003. “The Role of Misconceptions in Support for Regressive TaxReform.” Working paper. University of Michigan (November).
Zaller, John R. 1992. The Nature and Origins of Mass Opinion. University ofCambridge Press.
Alan S. Blinder and Alan B. Krueger 397
2259-04-Blinder.qxd 8/6/04 11:20 Page 397

2259-04-Blinder.qxd 8/6/04 11:20 Page 398