what do we really know? metrics for food insecurity and
TRANSCRIPT
metrics of food insecurity and malnutrition
1
What do we really know? Metrics for
food insecurity and malnutrition
Hartwig de Haen, Stephan Klasen, Matin QaimUniversity of Göttingen, Germany
Workshop on Measuring Food Insecurity and Assessing the Sustainability of Global Food Systems, February 16-17, 2011, Keck
Center of the National Academies, Washington, DC
metrics of food insecurity and malnutrition
2
Outline1. Questions and issues2. Three key methods
• FAO indicator of chronic undernourishment• Household consumption surveys• Anthropometric measurements
3. Contradictions and complementarities between indicators
4. Recommendations for improvement5. Next steps
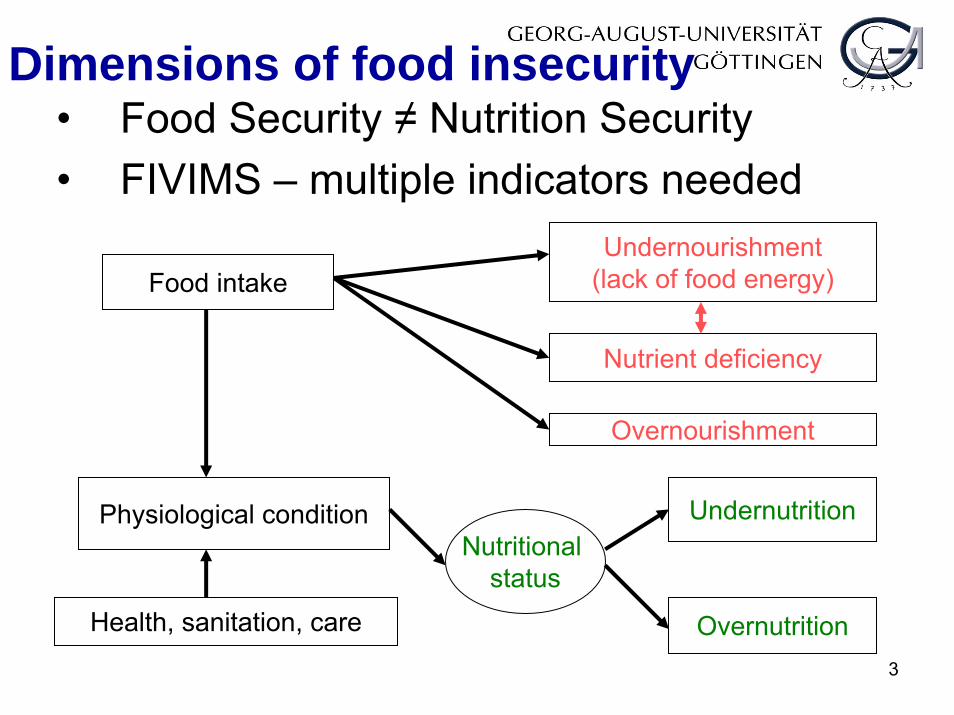
Dimensions of food insecurity• Food Security ≠ Nutrition Security• FIVIMS – multiple indicators needed
Food intake
Physiological condition
Health, sanitation, care
Undernourishment(lack of food energy)
Nutrient deficiency
Nutritional status
Undernutrition
Overnutrition
Overnourishment
3
metrics of food insecurity and malnutrition
4
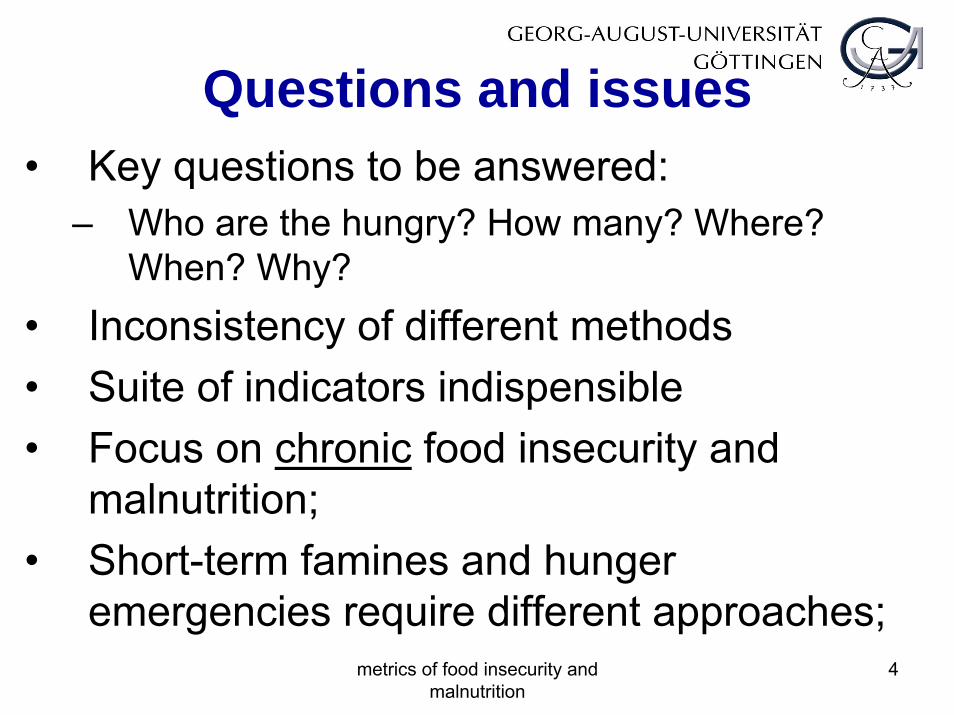
Questions and issues• Key questions to be answered:
– Who are the hungry? How many? Where? When? Why?
• Inconsistency of different methods • Suite of indicators indispensible• Focus on chronic food insecurity and
malnutrition;• Short-term famines and hunger
emergencies require different approaches;
metrics of food insecurity and malnutrition
5
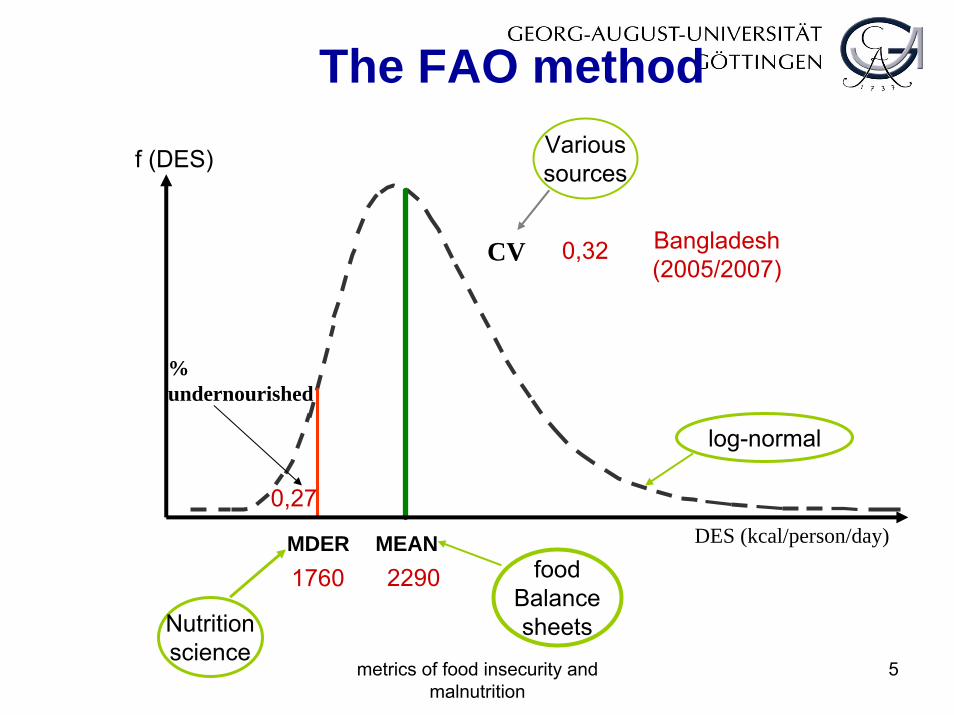
MEANMDER
% undernourished
CV
DES (kcal/person/day)
The FAO method
f (DES)
0,27
0,32 Bangladesh(2005/2007)
1760 2290 foodBalancesheets
Varioussources
Nutritionscience
log-normal
metrics of food insecurity and malnutrition
6
The FAO methodUse of the indicator
• Annual publication in SOFI • Since 2008: ex-post projections• Monitoring MDG One • Useful for national and global governance • Not suited (and not intended) to guide
sub-national policy action• Currently being reviewed in FAO
metrics of food insecurity and malnutrition
7
The FAO methodMain strengths
• Focus on essential food energy requirement• Regular publication and worldwide coverage• Consistent with national statistics• Relatively low cost• Food balance sheet approach also applicable
to other nutrients (macro, micro)
metrics of food insecurity and malnutrition
8
The FAO methodCritical issues (1)
• Dietary energy supply (DES)– Dietary diversity not captured– Seasonal fluctuations not covered– Biased estimates through errors in food balance
sheets (losses, waste, non-food use etc)– Dependant on quality of data inputs from
countries (e. g the case of India)
metrics of food insecurity and malnutrition
9
The FAO methodCritical issues (2)
• Inequality of consumption within countries (CV)– Sources of CV not transparent– Upper and lower bounds for CV unclear (0.2-0.35)– Constancy of CV over time unrealistic and may
misrepresent trends in hunger
• Minimum dietary requirements (MDER)– Based on WHO/FAO/UNU Expert Consultation (2001)– Some issues need more research
• Ex-post projections– Enables more timely estimates– Method insufficiently documented
metrics of food insecurity and malnutrition
10
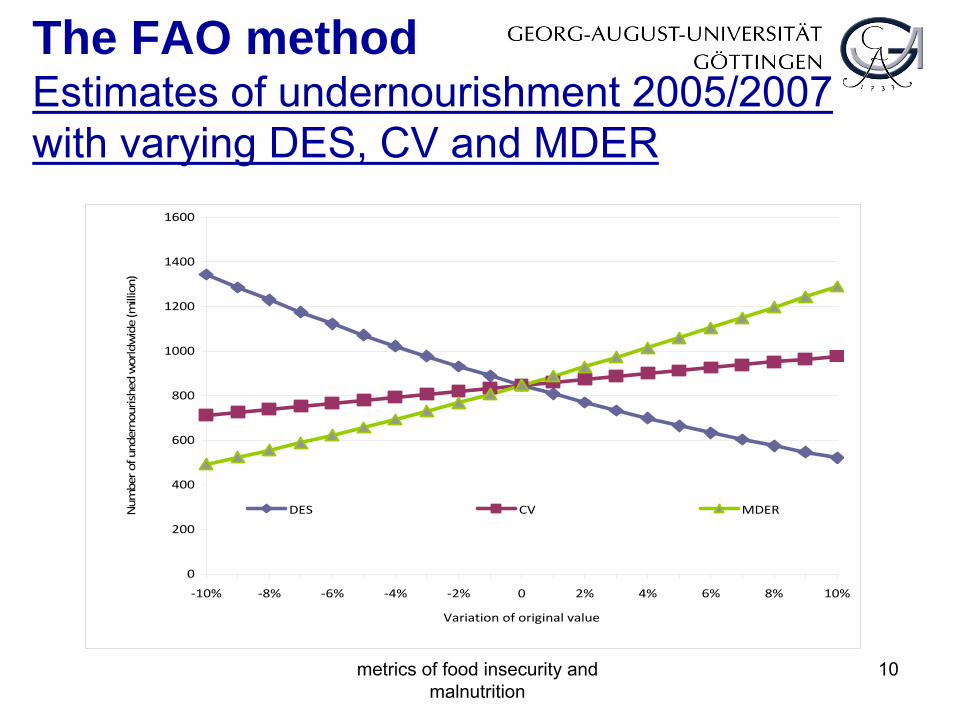
The FAO methodEstimates of undernourishment 2005/2007with varying DES, CV and MDER
0
200
400
600
800
1000
1200
1400
1600
‐10% ‐8% ‐6% ‐4% ‐2% 0 2% 4% 6% 8% 10%
Variation of original value
Num
ber of undernourished worldwide (million)
DES CV MDER
Food Consumption Surveys• Data base:
– Representative household surveys (increasingly frequent and rising accuracy);
– Food expenditures (recall or diary);• Method:
– Conversion of food expenditures into calories (and other nutrients);
– Comparison with household-specific needs;– Aggregate to generate national and
international numbers;metrics of food insecurity and
malnutrition11
Advantages
• More direct assessment of detailed food deficits– fewer assumptions needed;
• Direct measurement of distribution of hunger– no distributional assumptions;
• Household-specific assessment of actual dietary requirements possible;– no aggregate assumptions;
• Disaggregation by groups possible;• Actionable indicator:
– allows analysis of determinants of hungermetrics of food insecurity and
malnutrition12
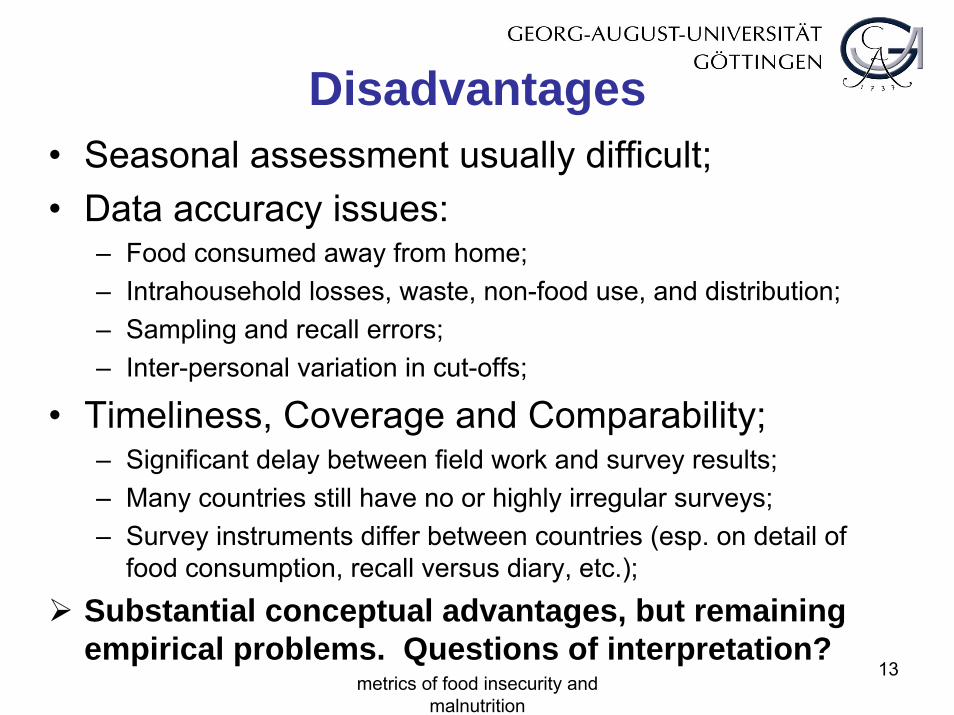
Disadvantages• Seasonal assessment usually difficult;• Data accuracy issues:
– Food consumed away from home;– Intrahousehold losses, waste, non-food use, and distribution;– Sampling and recall errors;– Inter-personal variation in cut-offs;
• Timeliness, Coverage and Comparability;– Significant delay between field work and survey results;– Many countries still have no or highly irregular surveys;– Survey instruments differ between countries (esp. on detail of
food consumption, recall versus diary, etc.);
Substantial conceptual advantages, but remaining empirical problems. Questions of interpretation?
metrics of food insecurity and malnutrition
13

Anthropometric Assessments
• Nutritional ‚outcome‘ (rather than ‚input‘)• Data base:
– Representative household surveys (DHS);– Anthropometric assessment (of children);
• Method:– Comparison of individual anthropometric status with
international reference standard (for children);– Z-score (SD. Distance from median of standard);– Key: Statistical assessment (misclassification),
reference standard;metrics of food insecurity and
malnutrition14
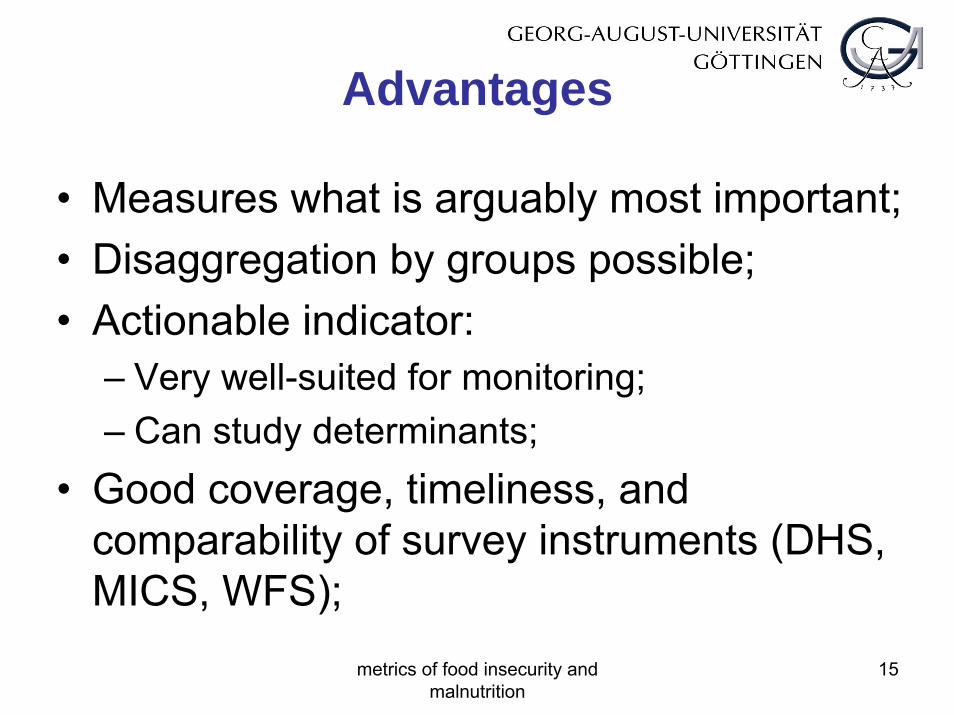
Advantages
• Measures what is arguably most important;• Disaggregation by groups possible;• Actionable indicator:
– Very well-suited for monitoring;– Can study determinants;
• Good coverage, timeliness, and comparability of survey instruments (DHS, MICS, WFS);
metrics of food insecurity and malnutrition
15
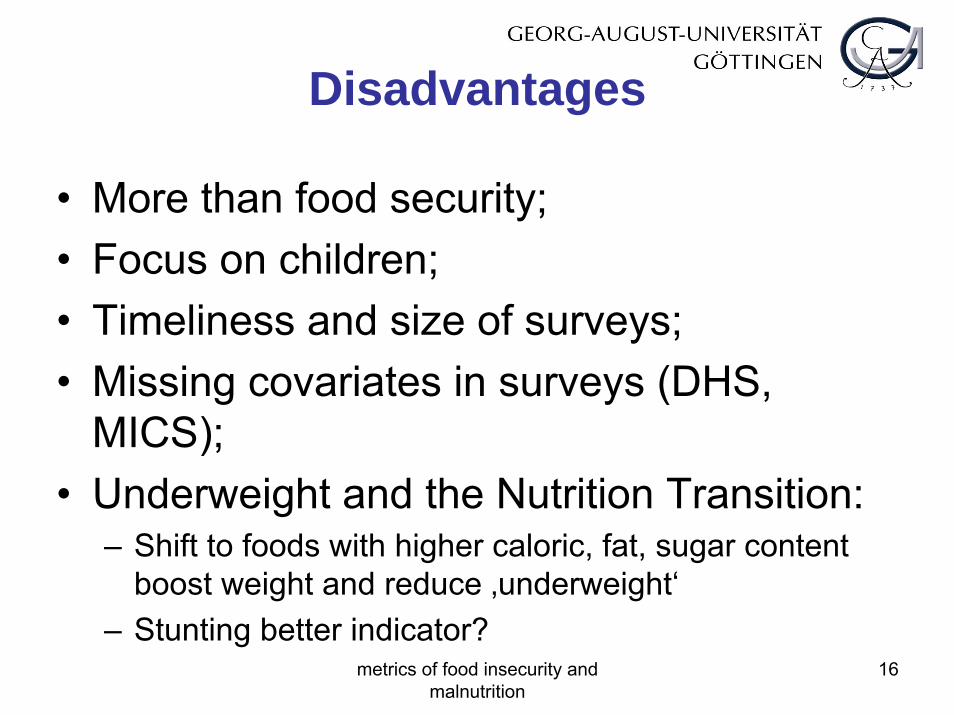
Disadvantages
• More than food security;• Focus on children;• Timeliness and size of surveys;• Missing covariates in surveys (DHS,
MICS);• Underweight and the Nutrition Transition:
– Shift to foods with higher caloric, fat, sugar content boost weight and reduce ‚underweight‘
– Stunting better indicator?metrics of food insecurity and
malnutrition16
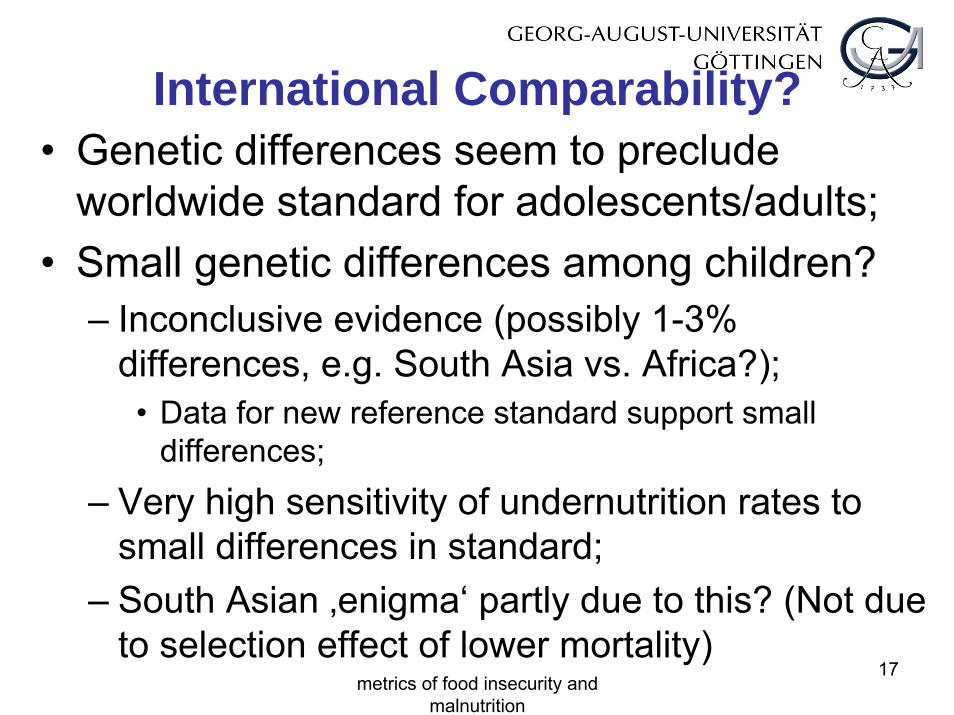
International Comparability?• Genetic differences seem to preclude
worldwide standard for adolescents/adults;• Small genetic differences among children?
– Inconclusive evidence (possibly 1-3% differences, e.g. South Asia vs. Africa?);
• Data for new reference standard support small differences;
– Very high sensitivity of undernutrition rates to small differences in standard;
– South Asian ‚enigma‘ partly due to this? (Not due to selection effect of lower mortality)
metrics of food insecurity and malnutrition
17
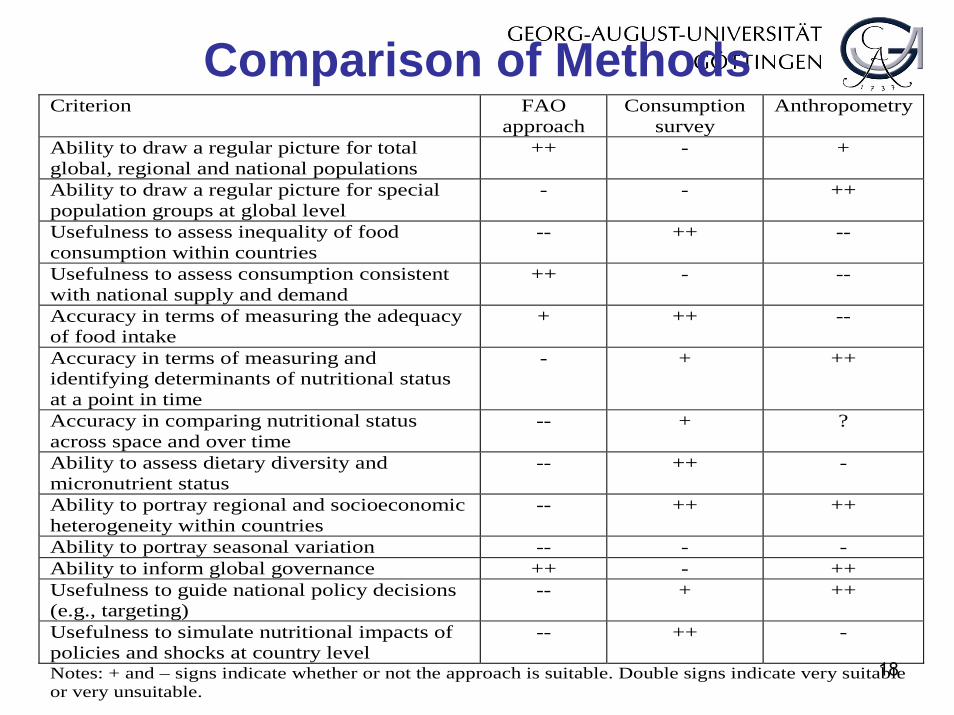
Comparison of Methods
18
Criterion FAO approach
Consumption survey
Anthropometry
Ability to draw a regular picture for total global, regional and national populations
++ - +
Ability to draw a regular picture for special population groups at global level
- - ++
Usefulness to assess inequality of food consumption within countries
-- ++ --
Usefulness to assess consumption consistent with national supply and demand
++ - --
Accuracy in terms of measuring the adequacy of food intake
+ ++ --
Accuracy in terms of measuring and identifying determinants of nutritional status at a point in time
- + ++
Accuracy in comparing nutritional status across space and over time
-- + ?
Ability to assess dietary diversity and micronutrient status
-- ++ -
Ability to portray regional and socioeconomic heterogeneity within countries
-- ++ ++
Ability to portray seasonal variation -- - -Ability to inform global governance ++ - ++Usefulness to guide national policy decisions (e.g., targeting)
-- + ++
Usefulness to simulate nutritional impacts of policies and shocks at country level
-- ++ -
Notes: + and – signs indicate whether or not the approach is suitable. Double signs indicate very suitable or very unsuitable.
19
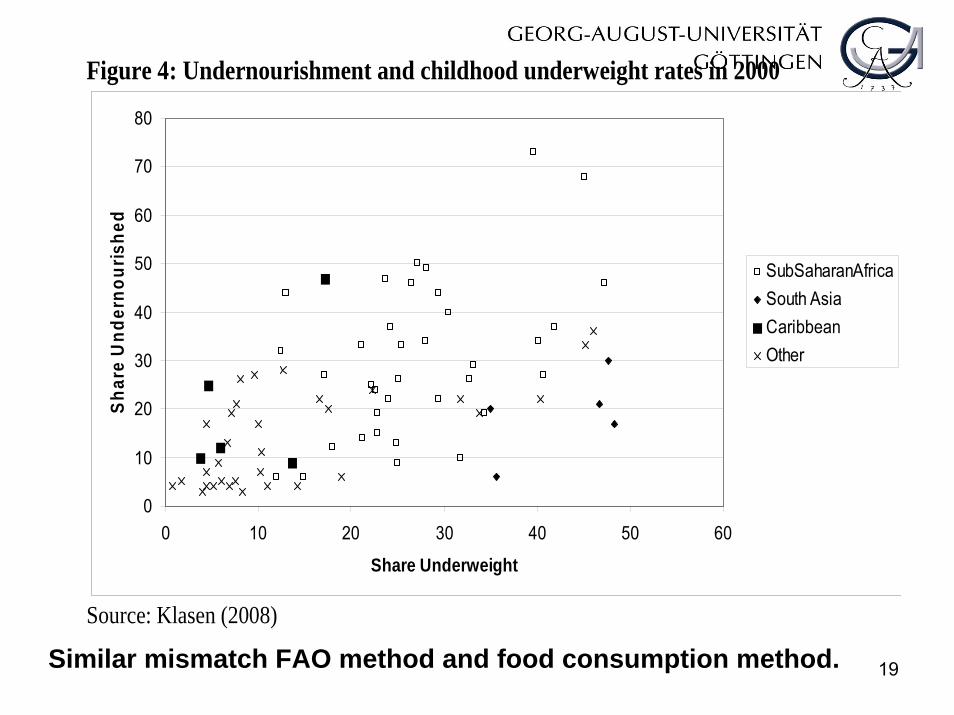
Figure 4: Undernourishment and childhood underweight rates in 2000
0
10
20
30
40
50
60
70
80
0 10 20 30 40 50 60
Share Underweight
Shar
e U
nder
nour
ishe
d
SubSaharanAfricaSouth AsiaCaribbeanOther
Source: Klasen (2008)
Similar mismatch FAO method and food consumption method.
metrics of food insecurity and malnutrition
20
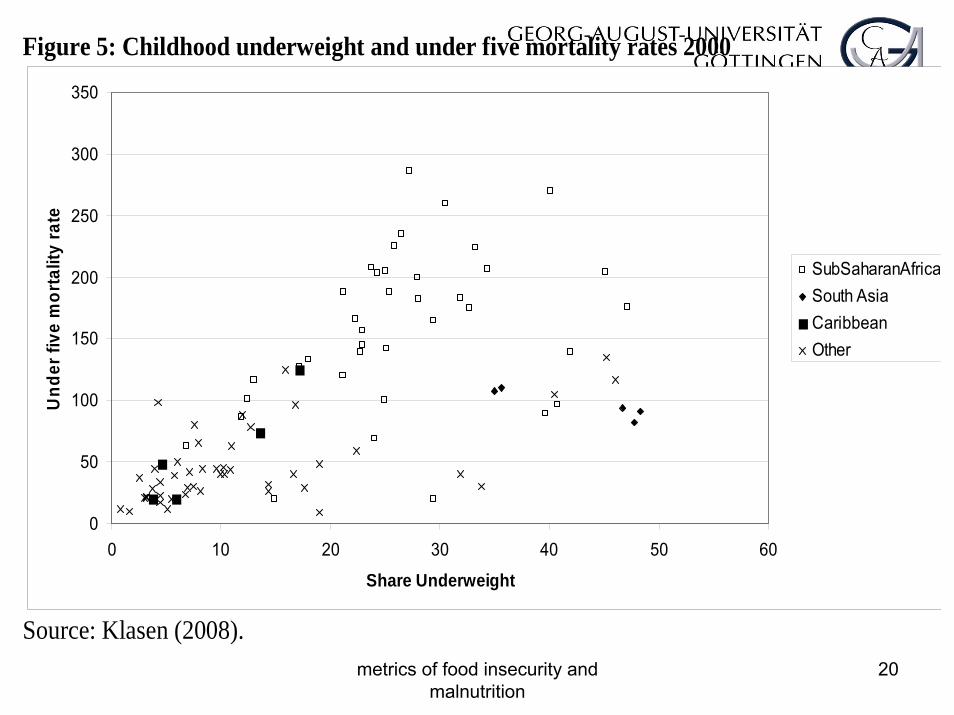
Figure 5: Childhood underweight and under five mortality rates 2000
0
50
100
150
200
250
300
350
0 10 20 30 40 50 60
Share Underweight
Und
er fi
ve m
orta
lity
rate
SubSaharanAfricaSouth AsiaCaribbeanOther
Source: Klasen (2008).
metrics of food insecurity and malnutrition
21
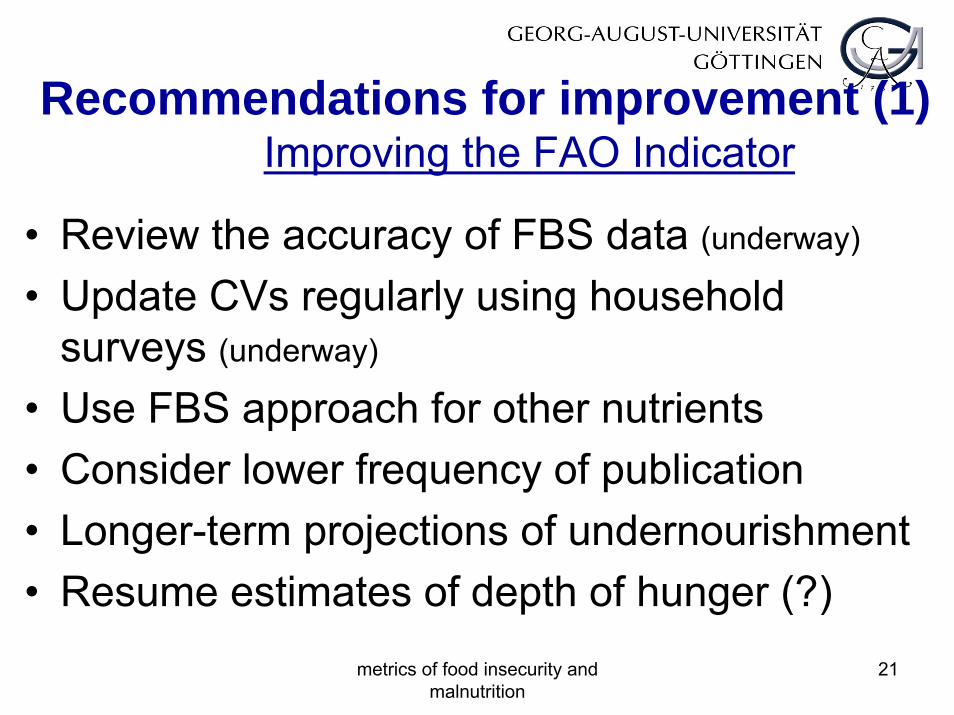
Recommendations for improvement (1)Improving the FAO Indicator
• Review the accuracy of FBS data (underway)
• Update CVs regularly using household surveys (underway)
• Use FBS approach for other nutrients• Consider lower frequency of publication• Longer-term projections of undernourishment• Resume estimates of depth of hunger (?)

metrics of food insecurity and malnutrition
22
Recommendations for improvement (2)Moving beyond the FAO Indicator
• Expand living standard measurement surveys • Link LSMS with anthropometric suveys• Simulations (global and national)
– e.g. use of consumption surveys and price/output data to estimate current levels of hunger
– Policy impact simulations.
metrics of food insecurity and malnutrition
23
Recommendations for improvement (3)Moving beyond the FAO Indicator
• Improve and expand surveys of concrete nutrition indicators– Dietary diversity– Micronutrient deficiency– (Overweight and obesity)
• More research:– Consumption surveys versus anthropometrics– Cut-offs (anthropometrics and intake)
metrics of food insecurity and malnutrition
24
Next steps• Establish inventory of various indicators• Enhancement of the empirical data base
– Continue review of FBS data base– Reconcile food consumption data from FBS and
household surveys – Enlarge country coverage and frequency of
household living standard and anthropometric surveys
– Harmonize formats, questionnaires, and sampling frames for both (esp. DHS/MICS and LSMS).
metrics of food insecurity and malnutrition
25
Institutional implicationsKey agencies must cooperate more closely to:
– overcome incompatibilities between the methods– work towards consistent suite of Indicators– maintain close links to research community– seek joint diagnoses of different indicators– consider publishing a joint Report on Food and
Nutrition Security– advocate and promote country-owned
measurements and policy responses
metrics of food insecurity and malnutrition
26
Options for institutional set-up• Networking - reinvigoration of FIVIMS (?)
– Food Security Info Network (FSIN) (FAO, WFP, IFPRI)– Involve others (esp. WHO, UNICEF, World Bank, EU)– Online Portal of all available indicators– Regular consultations on the three key indicators – Broaden focus on under- and overnutrition – Strengthen country-level work
• Use platforms for advocacy and support:– CFS– SCN
• Funding: combine RP and joint donor funding
metrics of food insecurity and malnutrition
27
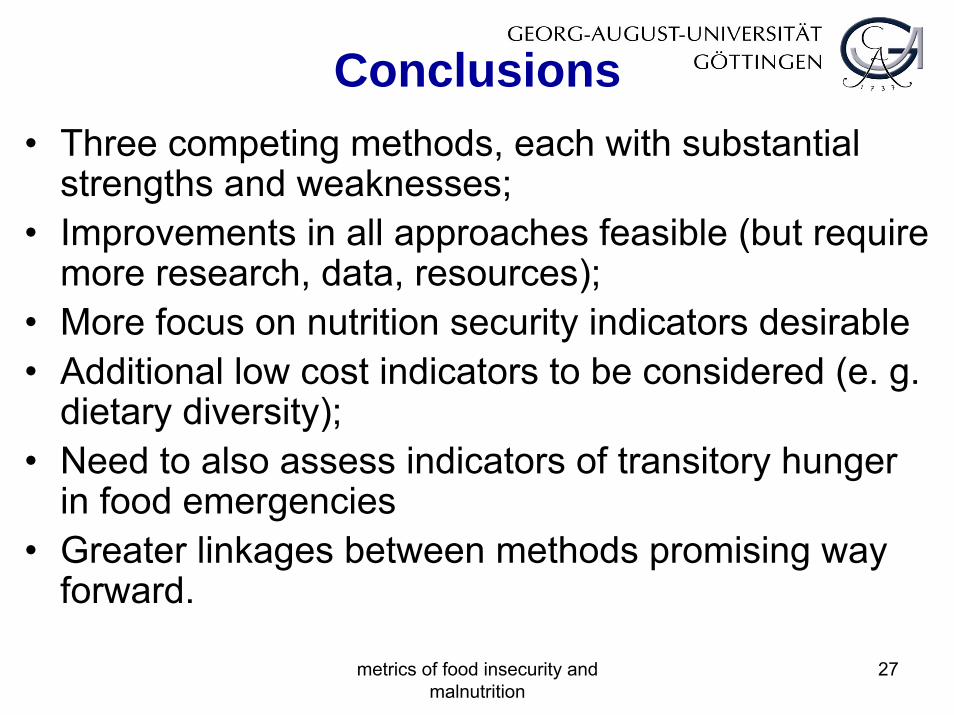
Conclusions• Three competing methods, each with substantial
strengths and weaknesses;• Improvements in all approaches feasible (but require
more research, data, resources); • More focus on nutrition security indicators desirable• Additional low cost indicators to be considered (e. g.
dietary diversity); • Need to also assess indicators of transitory hunger
in food emergencies• Greater linkages between methods promising way
forward.
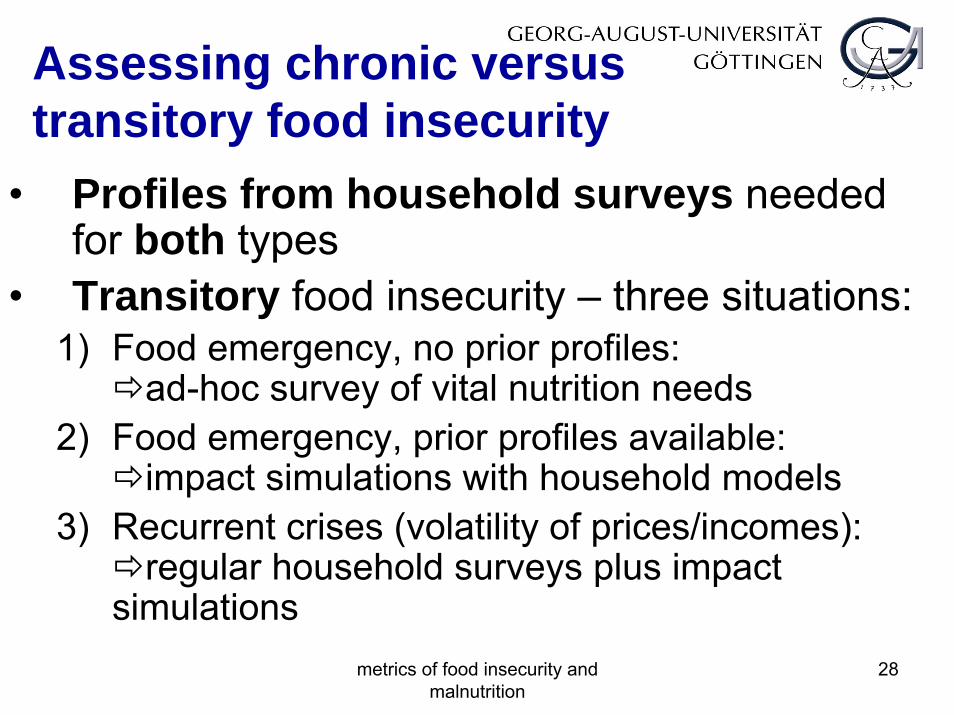
Assessing chronic versus transitory food insecurity
• Profiles from household surveys needed for both types
• Transitory food insecurity – three situations:1) Food emergency, no prior profiles:
ad-hoc survey of vital nutrition needs 2) Food emergency, prior profiles available:
impact simulations with household models3) Recurrent crises (volatility of prices/incomes):
regular household surveys plus impact simulations
metrics of food insecurity and malnutrition
28

Children died in SSA
Children died in SA
Selection via Mortality and the ‚South Asian‘ Enigma
Z=-2
SSA lower undernutrition among living children.
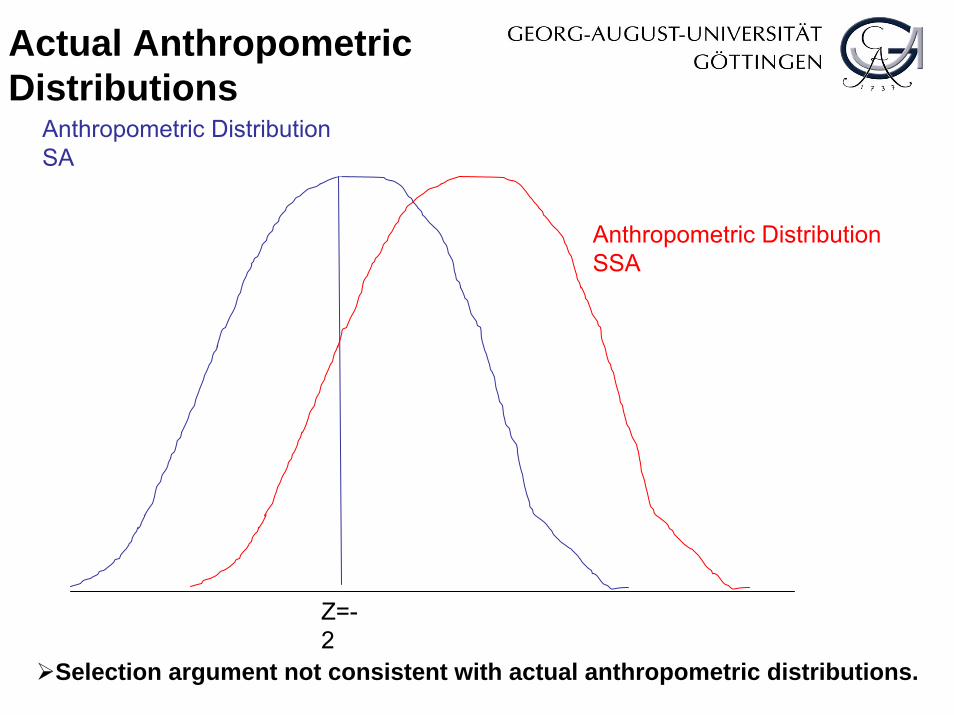
Anthropometric Distribution SSA
Anthropometric Distribution SA
Z=-2
Selection argument not consistent with actual anthropometric distributions.
Actual Anthropometric Distributions