household food insecurity in canada, 2014 - · pdf filehousehold food insecurity in canada,...
TRANSCRIPT
Valerie TarasukAndy MitchellNaomi Dachner
2014
PROOFFOOD INSECURITYPOLICY RESEARCH
HOUSEHOLD FOOD INSECURITY IN CANADA, 2014
1
PROOFFOOD INSECURITYPOLICY RESEARCH
Household Food Insecurity in Canada, 2014
This study was supported by the
Canadian Institutes of Health Research.
Valerie TarasukAndy MitchellNaomi Dachner
Acknowledgments:
This report is a PROOF initiative which is supported by a Programmatic Grant in Health and Health
Equity, Canadian Institutes of Health Research (CIHR) (FRN 115208). The authors wish to thank
Stephanie Vasko for her layout and design work on the report. They also wish to acknowledge Timmie
Li for his contribution to the report.
PROOF Investigators:
Herb Emery (University of Calgary), Craig Gundersen (University of Illinois at Urbana-Champaign),
Paul Kurdyak (Centre for Addition and Mental Health), Catherine Mah (Memorial University),
Lynn McIntyre (University of Calgary), Jurgen Rehm (Centre for Addiction and Mental Health),
How to cite this document:
Tarasuk, V, Mitchell, A, Dachner, N. (2016). Household food insecurity in Canada, 2014.
Toronto: Research to identify policy options to reduce food insecurity (PROOF).
Retrieved from http://proof.utoronto.ca
PROOF is an international, interdisciplinary team of researchers committed to a program of research to identify effective policy interventions to address household food insecurity. Website: http://proof.utoronto.ca
Valerie Tarasuk (University of Toronto).
Released April 5, 2016. Updated May 12, 2017.
Our annual reports are provided under the terms of a Creative Commons Attribution 4.0 International License. This license allows for free redistribution, as long as it is credited to PROOF.
2 PROOFFOOD INSECURITYPOLICY RESEARCH
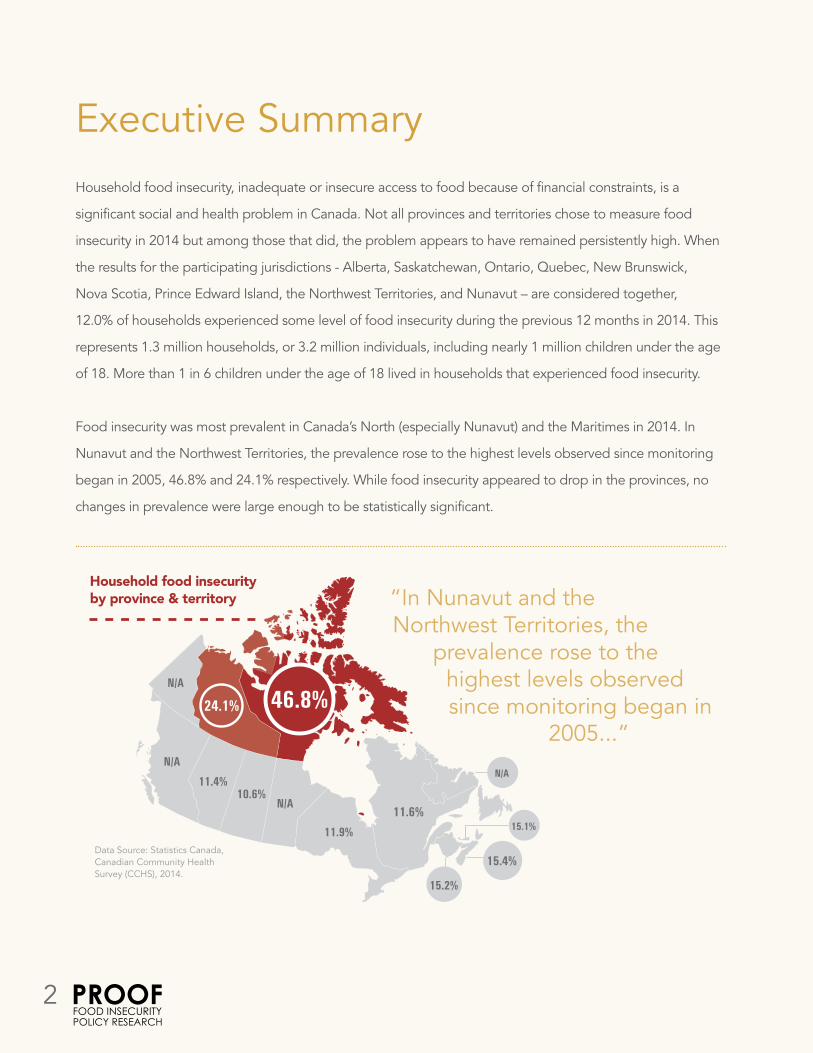
Executive SummaryHousehold food insecurity, inadequate or insecure access to food because of financial constraints, is a
significant social and health problem in Canada. Not all provinces and territories chose to measure food
insecurity in 2014 but among those that did, the problem appears to have remained persistently high. When
the results for the participating jurisdictions - Alberta, Saskatchewan, Ontario, Quebec, New Brunswick,
Nova Scotia, Prince Edward Island, the Northwest Territories, and Nunavut – are considered together,
12.0% of households experienced some level of food insecurity during the previous 12 months in 2014. This
represents 1.3 million households, or 3.2 million individuals, including nearly 1 million children under the age
of 18. More than 1 in 6 children under the age of 18 lived in households that experienced food insecurity.
Food insecurity was most prevalent in Canada’s North (especially Nunavut) and the Maritimes in 2014. In
Nunavut and the Northwest Territories, the prevalence rose to the highest levels observed since monitoring
began in 2005, 46.8% and 24.1% respectively. While food insecurity appeared to drop in the provinces, no
changes in prevalence were large enough to be statistically significant.
11.9%
N/AN/A
15.1%
15.4%
15.2%
11.6%N/A
N/A
46.8%
11.4%10.6%
24.1%
Household food insecurity by province & territory
Data Source: Statistics Canada, Canadian Community Health Survey (CCHS), 2014.
“In Nunavut and the Northwest Territories, the
prevalence rose to the highest levels observed since monitoring began in
2005...”
2 PROOFFOOD INSECURITYPOLICY RESEARCH

HOUSEHOLD FOOD INSECURITY IN CANADA, 2014
3
Households with children under the age of 18 were at greater risk for food insecurity than households without
children (15.6% versus 10.4%). The most vulnerable were lone parent families headed by women: 33.5% of
these families were food insecure in 2014. Among households without children under 18 years old, the highest
rate of food insecurity was 15.7% among unattached individuals. Nunavut and the Northwest Territories had
the highest prevalence of children living in food-insecure households at 60% and 29% respectively.
Sixty-one percent of households whose major source of income was social assistance were food
insecure, as were 35.6% of those reliant on Employment Insurance or Workers’ Compensation.
However, the majority of food insecure households (62.2%) were reliant on wages or salaries from
employment. Other household characteristics associated with a higher likelihood of food insecurity
included having an income below the Low Income Measure (29.2%), being Aboriginal (25.7%), being
Black (29.4%), and renting rather than owning one’s home (24.5%).
Household food insecurity affected
1 in 6children in Canada
“60.9% of households whose major source of income was social assistance were food insecure. However, the majority of food insecure households (62.2%) were reliant on wages or salaries from employment.”
3
17%
19%
N/A
22%
22%
21%
N/A
N/A
60%N/A
16%
16%
29%
Data Source: Statistics Canada, Canadian Community Health Survey (CCHS), 2013 and 2014.
Proportion of children who lived in food insecure households
4 PROOFFOOD INSECURITYPOLICY RESEARCH
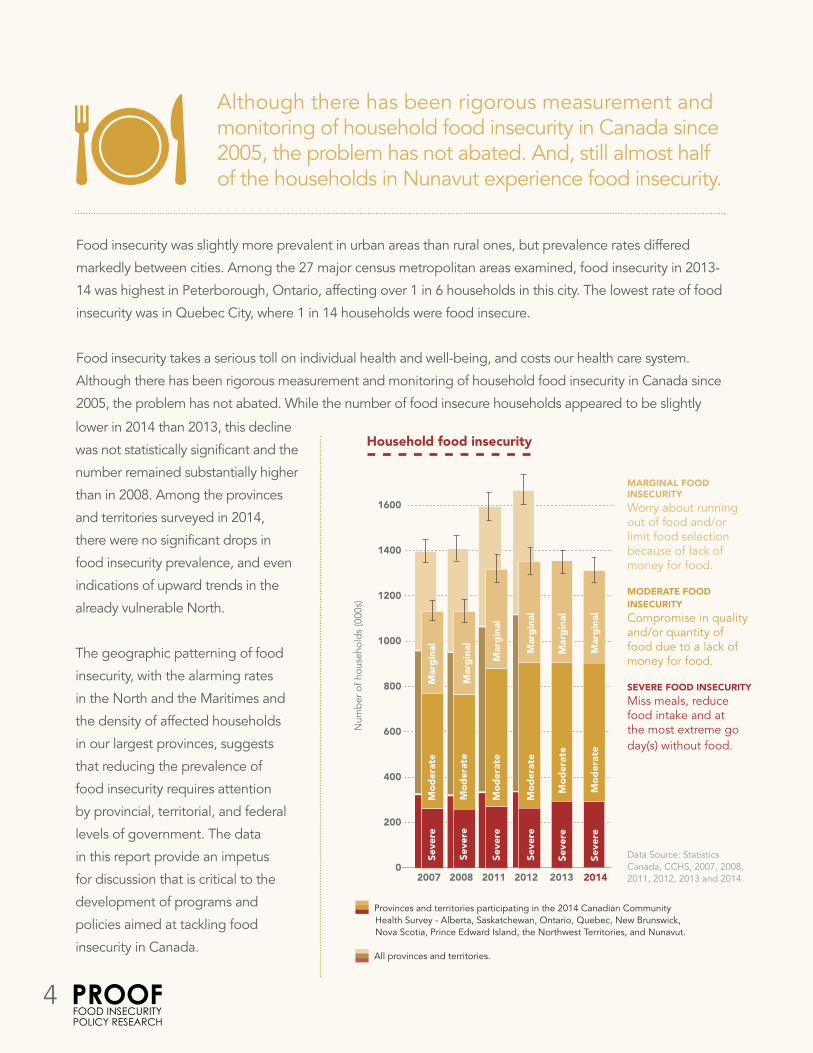
Food insecurity was slightly more prevalent in urban areas than rural ones, but prevalence rates differed
markedly between cities. Among the 27 major census metropolitan areas examined, food insecurity in 2013-
14 was highest in Peterborough, Ontario, affecting over 1 in 6 households in this city. The lowest rate of food
insecurity was in Quebec City, where 1 in 14 households were food insecure.
Food insecurity takes a serious toll on individual health and well-being, and costs our health care system.
Although there has been rigorous measurement and monitoring of household food insecurity in Canada since
2005, the problem has not abated. While the number of food insecure households appeared to be slightly
Although there has been rigorous measurement and monitoring of household food insecurity in Canada since 2005, the problem has not abated. And, still almost half of the households in Nunavut experience food insecurity.
Household food insecurity
0
200
400
600
800
1000
1200
1400
1600
Num
ber
of h
ouse
hold
s (0
00s)
2007 2008 2011 2012
Seve
reM
od
erat
eM
arg
inal
2013
Seve
re
Seve
reM
arg
inal
Seve
reM
od
erat
eM
arg
inal
Seve
re
Seve
reM
od
erat
e
Seve
reM
od
erat
eM
arg
inal
Seve
reM
od
erat
eM
arg
inal
Seve
re
Seve
reM
od
erat
eM
arg
inal
Seve
reM
od
erat
eM
arg
inal
Seve
reM
od
erat
eM
arg
inal
Seve
reM
od
erat
eM
arg
inal
2014
Mo
der
ate
Mar
gin
alSe
vere
MARGINAL FOOD INSECURITY
Worry about running out of food and/or limit food selection because of lack of money for food.
MODERATE FOOD INSECURITY
Compromise in quality and/or quantity of food due to a lack of money for food.
SEVERE FOOD INSECURITY
Miss meals, reduce food intake and at the most extreme go day(s) without food.
Data Source: Statistics Canada, CCHS, 2007, 2008, 2011, 2012, 2013 and 2014.
Provinces and territories participating in the 2014 Canadian Community Health Survey - Alberta, Saskatchewan, Ontario, Quebec, New Brunswick, Nova Scotia, Prince Edward Island, the Northwest Territories, and Nunavut.
All provinces and territories.
lower in 2014 than 2013, this decline
was not statistically significant and the
number remained substantially higher
than in 2008. Among the provinces
and territories surveyed in 2014,
there were no significant drops in
food insecurity prevalence, and even
indications of upward trends in the
already vulnerable North.
The geographic patterning of food
insecurity, with the alarming rates
in the North and the Maritimes and
the density of affected households
in our largest provinces, suggests
that reducing the prevalence of
food insecurity requires attention
by provincial, territorial, and federal
levels of government. The data
in this report provide an impetus
for discussion that is critical to the
development of programs and
policies aimed at tackling food
insecurity in Canada.
4 PROOFFOOD INSECURITYPOLICY RESEARCH
HOUSEHOLD FOOD INSECURITY IN CANADA, 2014
5
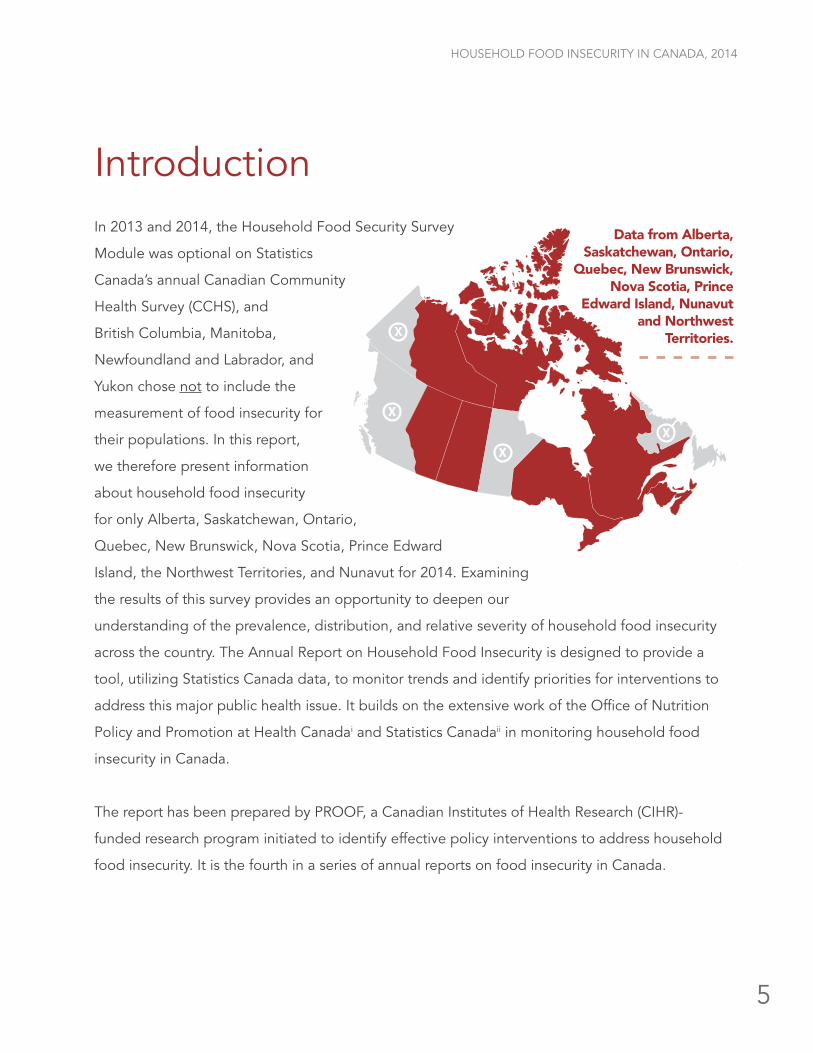
IntroductionIn 2013 and 2014, the Household Food Security Survey
Module was optional on Statistics
Canada’s annual Canadian Community
Health Survey (CCHS), and
British Columbia, Manitoba,
Newfoundland and Labrador, and
Yukon chose not to include the
measurement of food insecurity for
their populations. In this report,
we therefore present information
about household food insecurity
for only Alberta, Saskatchewan, Ontario,
Quebec, New Brunswick, Nova Scotia, Prince Edward
Island, the Northwest Territories, and Nunavut for 2014. Examining
the results of this survey provides an opportunity to deepen our
understanding of the prevalence, distribution, and relative severity of household food insecurity
across the country. The Annual Report on Household Food Insecurity is designed to provide a
tool, utilizing Statistics Canada data, to monitor trends and identify priorities for interventions to
address this major public health issue. It builds on the extensive work of the Office of Nutrition
Policy and Promotion at Health Canadai and Statistics Canadaii in monitoring household food
insecurity in Canada.
The report has been prepared by PROOF, a Canadian Institutes of Health Research (CIHR)-
funded research program initiated to identify effective policy interventions to address household
food insecurity. It is the fourth in a series of annual reports on food insecurity in Canada.
X
X
XX
Data from Alberta, Saskatchewan, Ontario,
Quebec, New Brunswick, Nova Scotia, Prince
Edward Island, Nunavut and Northwest
Territories.
6 PROOFFOOD INSECURITYPOLICY RESEARCH
What is food insecurity?
According to the Food and Agriculture
Organization (FAO) of the United Nations,
food security exists when “all people, at all
times, have physical and economic access
to sufficient, safe and nutritious food to meet
their dietary needs and food preferences for
an active and healthy life.”iii This definition
was adopted by Canada at the World
Food Summit, but the measurement and
monitoring of food insecurity in the country
focuses on a household’s experience of food
insecurity, or the inadequate or insecure
access to adequate food due to financial
constraints. The experience of food insecurity
can range from concerns about running out
of food before there is more money to buy
more, to the inability to afford a balanced
diet, to going hungry, missing meals, and in
extreme cases, not eating for a whole day
because of a lack of food and money for food.
Food insecurity is a serious public health
problem because individuals’ health
and well-being are tightly linked to their
household food security. Recent research
in Canada has shown that the experience
of hunger leaves an indelible mark on
children’s physical and mental health,
manifesting in greater likelihood of certain
conditions, such as depression and asthma
in adolescence and early adulthoodiv. Adults
in food-insecure households have poorer
physical and mental health and higher rates
of numerous chronic conditions, including
depression, diabetes, and heart diseasev.
Once chronic diseases are established,
their management is also compromised in
the context of food insecurityvi. The toll that
food insecurity takes on health is evident
through the heightened health care costs
among food insecure Canadiansvii.
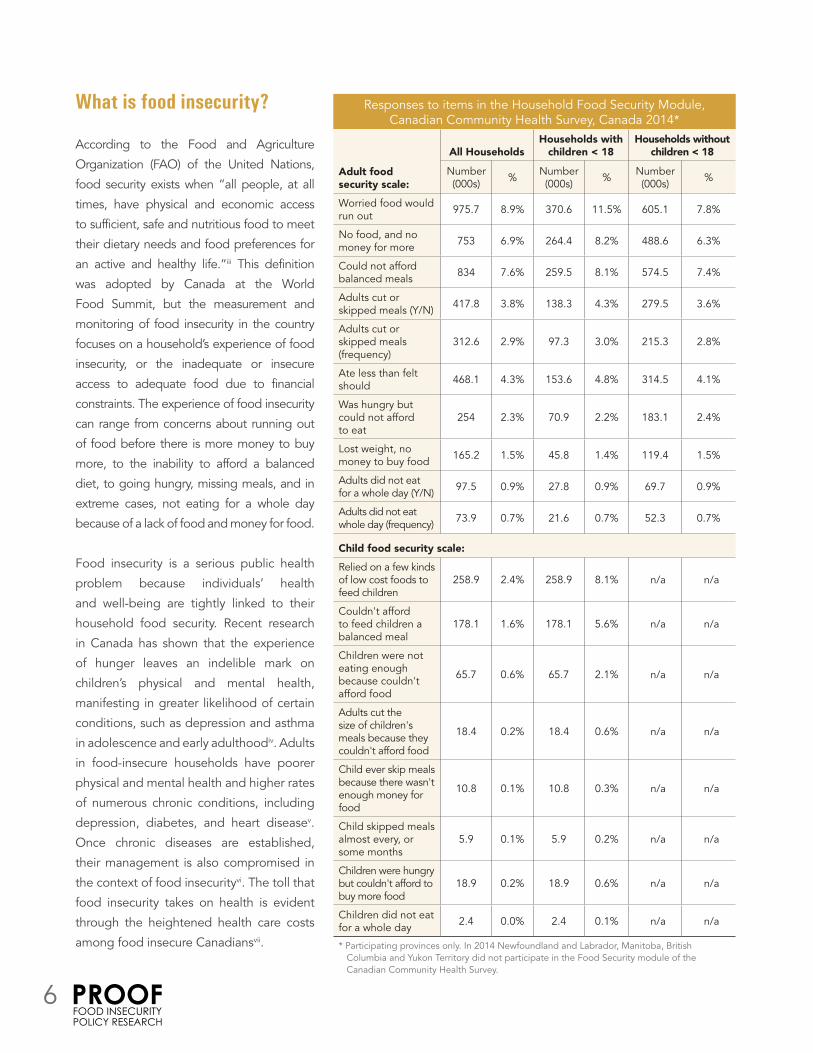
Responses to items in the Household Food Security Module, Canadian Community Health Survey, Canada 2014*
Adult food security scale:
All HouseholdsHouseholds with
children < 18Households without
children < 18
Number(000s) % Number
(000s) % Number(000s) %
Worried food would run out 975.7 8.9% 370.6 11.5% 605.1 7.8%
No food, and no money for more 753 6.9% 264.4 8.2% 488.6 6.3%
Could not afford balanced meals 834 7.6% 259.5 8.1% 574.5 7.4%
Adults cut or skipped meals (Y/N) 417.8 3.8% 138.3 4.3% 279.5 3.6%
Adults cut or skipped meals (frequency)
312.6 2.9% 97.3 3.0% 215.3 2.8%
Ate less than felt should 468.1 4.3% 153.6 4.8% 314.5 4.1%
Was hungry but could not afford to eat
254 2.3% 70.9 2.2% 183.1 2.4%
Lost weight, no money to buy food 165.2 1.5% 45.8 1.4% 119.4 1.5%
Adults did not eat for a whole day (Y/N) 97.5 0.9% 27.8 0.9% 69.7 0.9%
Adults did not eat whole day (frequency) 73.9 0.7% 21.6 0.7% 52.3 0.7%
Child food security scale:
Relied on a few kinds of low cost foods to feed children
258.9 2.4% 258.9 8.1% n/a n/a
Couldn't afford to feed children a balanced meal
178.1 1.6% 178.1 5.6% n/a n/a
Children were not eating enough because couldn't afford food
65.7 0.6% 65.7 2.1% n/a n/a
Adults cut the size of children's meals because they couldn't afford food
18.4 0.2% 18.4 0.6% n/a n/a
Child ever skip meals because there wasn't enough money for food
10.8 0.1% 10.8 0.3% n/a n/a
Child skipped meals almost every, or some months
5.9 0.1% 5.9 0.2% n/a n/a
Children were hungry but couldn't afford to buy more food
18.9 0.2% 18.9 0.6% n/a n/a
Children did not eat for a whole day 2.4 0.0% 2.4 0.1% n/a n/a
* Participating provinces only. In 2014 Newfoundland and Labrador, Manitoba, British Columbia and Yukon Territory did not participate in the Food Security module of the Canadian Community Health Survey.
HOUSEHOLD FOOD INSECURITY IN CANADA, 2014
7
How is food insecurity measured in Canada?
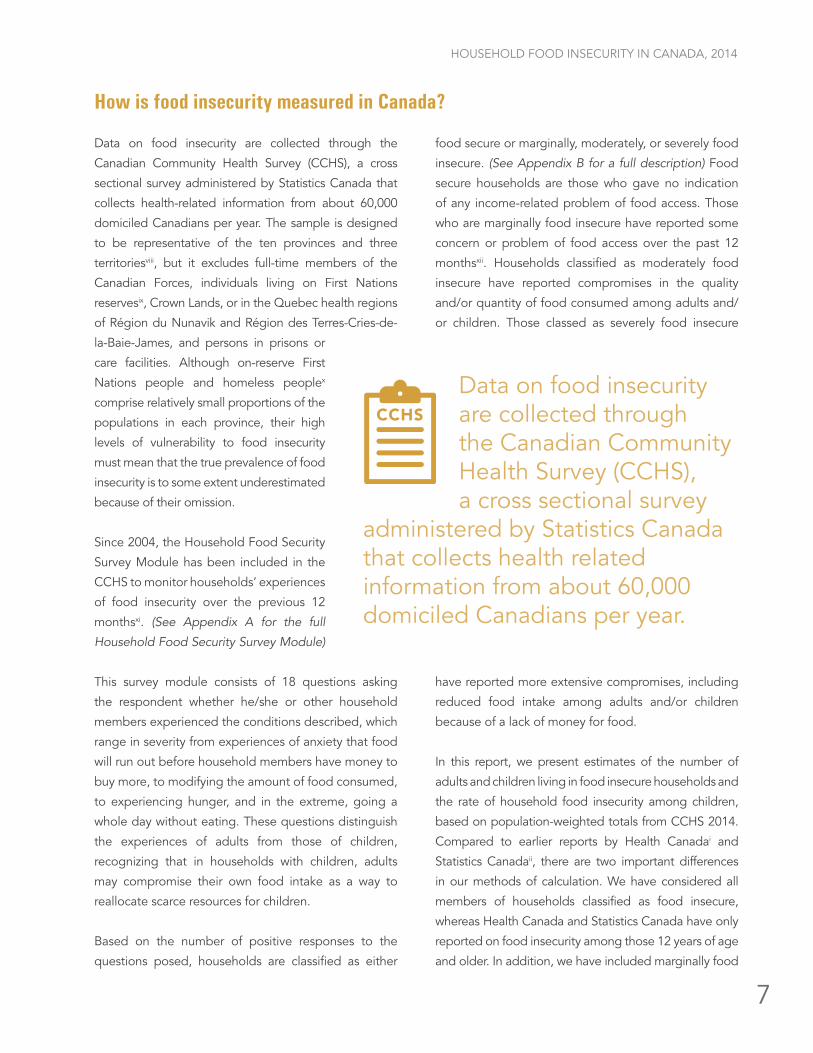
Data on food insecurity are collected through the
Canadian Community Health Survey (CCHS), a cross
sectional survey administered by Statistics Canada that
collects health-related information from about 60,000
domiciled Canadians per year. The sample is designed
to be representative of the ten provinces and three
territoriesviii, but it excludes full-time members of the
Canadian Forces, individuals living on First Nations
reservesix, Crown Lands, or in the Quebec health regions
of Région du Nunavik and Région des Terres-Cries-de-
la-Baie-James, and persons in prisons or
care facilities. Although on-reserve First
Nations people and homeless peoplex
comprise relatively small proportions of the
populations in each province, their high
levels of vulnerability to food insecurity
must mean that the true prevalence of food
insecurity is to some extent underestimated
because of their omission.
Since 2004, the Household Food Security
Survey Module has been included in the
CCHS to monitor households’ experiences
of food insecurity over the previous 12
monthsxi. (See Appendix A for the full
Household Food Security Survey Module)
This survey module consists of 18 questions asking
the respondent whether he/she or other household
members experienced the conditions described, which
range in severity from experiences of anxiety that food
will run out before household members have money to
buy more, to modifying the amount of food consumed,
to experiencing hunger, and in the extreme, going a
whole day without eating. These questions distinguish
the experiences of adults from those of children,
recognizing that in households with children, adults
may compromise their own food intake as a way to
reallocate scarce resources for children.
Based on the number of positive responses to the
questions posed, households are classified as either
food secure or marginally, moderately, or severely food
insecure. (See Appendix B for a full description) Food
secure households are those who gave no indication
of any income-related problem of food access. Those
who are marginally food insecure have reported some
concern or problem of food access over the past 12
monthsxii. Households classified as moderately food
insecure have reported compromises in the quality
and/or quantity of food consumed among adults and/
or children. Those classed as severely food insecure
have reported more extensive compromises, including
reduced food intake among adults and/or children
because of a lack of money for food.
In this report, we present estimates of the number of
adults and children living in food insecure households and
the rate of household food insecurity among children,
based on population-weighted totals from CCHS 2014.
Compared to earlier reports by Health Canadai and
Statistics Canadaii, there are two important differences
in our methods of calculation. We have considered all
members of households classified as food insecure,
whereas Health Canada and Statistics Canada have only
reported on food insecurity among those 12 years of age
and older. In addition, we have included marginally food
Data on food insecurity are collected through the Canadian Community Health Survey (CCHS), a cross sectional survey administered by Statistics Canada that collects health related information from about 60,000 domiciled Canadians per year.
CCHS

8 PROOFFOOD INSECURITYPOLICY RESEARCH
insecure households in our calculations,
whereas Statistics Canada’s and Health
Canada’s reports have only counted the
people living in moderately and severely
food insecure households. Thus, the
prevalence estimates here encompass
a more comprehensive spectrum of the
population affected by food insecurity.
In the United States, food insecurity is
monitored using the same questionnaire
used in Canada, but the terminology and
classification scheme differ. This means that the results
in this report are not directly comparable to reports of
food insecurity in the United States. A comparison of
food insecurity rates in Canada and the United States in
2014 is not feasible given the absence of national data
in Canada, but please refer to previous PROOF reports
for 2011 and 2012 where the United States Department
of Agriculture’s coding of the questionnaire is presented
for national comparisons for those years.
The food security survey
module is not always
part of the common
content of CCHS, and
during cycles of CCHS
where it has been
optional, some provinces and territories have opted
out of participation. In 2013 and 2014, the food
security survey module was optional, and British
Columbia, Manitoba, Newfoundland and Labrador,
and Yukon chose not to measure food insecurity.
Because we lack food insecurity data from these
provinces and territory, it is not possible to calculate
a national prevalence of household food insecurity for
2014.
In 2013 and 2014 the food security survey module was optional, and B.C., Manitoba, Newfoundland and Labrador, and Yukon chose not to measure food insecurity.
CCHS
In this report, we describe household food insecurity in
the jurisdictions for which 2014 data are available. We
also report on household food insecurity from 2007 to
2014 and food insecurity by household characteristics
using pooled data from participating provinces and
territories. These provinces and territories represented
81.8% of the Canadian population in 2014xiii. Because
the results here are based only on data for this subset
of the Canadian population, our description of the
socio-demographic characteristics of food-insecure
households in 2014 cannot be compared directly
with the results we have reported in our 2011 and
2012 reports. Further, in cases where the samples
sizes are smaller, we present statistics based on a
combination of 2013 and 2014 data, in order to
provide reliable estimates. Specifically, the provincial/
territorial statistics describing severity, children in food
insecure households and food insecurity among social
assistance recipients, and the prevalence of food
insecurity in census metropolitan areas are based on
2013 and 2014 data.
In looking at changes in estimates over time within
the participating provinces and territories, 95%
confidence intervals (presented in Appendix D) are
examined, and where confidence intervals do not
overlap, observed differences in prevalence estimates
are considered statistically significant.
VISIT http://proof.utoronto.ca to access previous PROOF reports.
HOUSEHOLD FOOD INSECURITY IN CANADA, 2014
9
Prevalence of Household Food Insecurity – Canada 2014
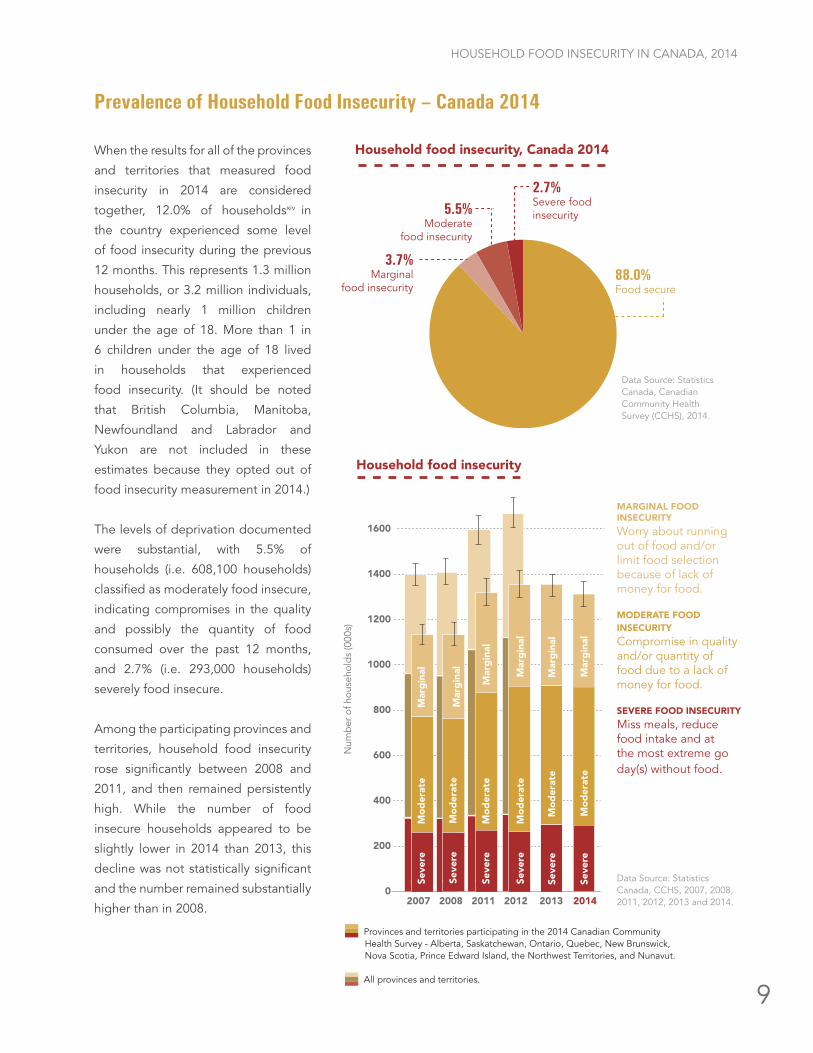
When the results for all of the provinces
and territories that measured food
insecurity in 2014 are considered
together, 12.0% of householdsxiv in
the country experienced some level
of food insecurity during the previous
12 months. This represents 1.3 million
households, or 3.2 million individuals,
including nearly 1 million children
under the age of 18. More than 1 in
6 children under the age of 18 lived
in households that experienced
food insecurity. (It should be noted
that British Columbia, Manitoba,
Newfoundland and Labrador and
Yukon are not included in these
estimates because they opted out of
food insecurity measurement in 2014.)
The levels of deprivation documented
were substantial, with 5.5% of
households (i.e. 608,100 households)
classified as moderately food insecure,
indicating compromises in the quality
and possibly the quantity of food
consumed over the past 12 months,
and 2.7% (i.e. 293,000 households)
severely food insecure.
Among the participating provinces and
territories, household food insecurity
rose significantly between 2008 and
2011, and then remained persistently
high. While the number of food
insecure households appeared to be
slightly lower in 2014 than 2013, this
decline was not statistically significant
and the number remained substantially
higher than in 2008.
Household food insecurity
0
200
400
600
800
1000
1200
1400
1600
Num
ber
of h
ouse
hold
s (0
00s)
2007 2008 2011 2012
Seve
reM
od
erat
eM
arg
inal
2013
Seve
re
Seve
reM
arg
inal
Seve
reM
od
erat
eM
arg
inal
Seve
re
Seve
reM
od
erat
e
Seve
reM
od
erat
eM
arg
inal
Seve
reM
od
erat
eM
arg
inal
Seve
re
Seve
reM
od
erat
eM
arg
inal
Seve
reM
od
erat
eM
arg
inal
Seve
reM
od
erat
eM
arg
inal
Seve
reM
od
erat
eM
arg
inal
2014
Mo
der
ate
Mar
gin
alSe
vere
MARGINAL FOOD INSECURITY
Worry about running out of food and/or limit food selection because of lack of money for food.
MODERATE FOOD INSECURITY
Compromise in quality and/or quantity of food due to a lack of money for food.
SEVERE FOOD INSECURITY
Miss meals, reduce food intake and at the most extreme go day(s) without food.
Data Source: Statistics Canada, CCHS, 2007, 2008, 2011, 2012, 2013 and 2014.
Provinces and territories participating in the 2014 Canadian Community Health Survey - Alberta, Saskatchewan, Ontario, Quebec, New Brunswick, Nova Scotia, Prince Edward Island, the Northwest Territories, and Nunavut.
All provinces and territories.
88.0%Food secure
3.7%Marginal
food insecurity
5.5% Moderate
food insecurity
2.7%Severe foodinsecurity
Household food insecurity, Canada 2014
Data Source: Statistics Canada, Canadian Community Health Survey (CCHS), 2014.
10 PROOFFOOD INSECURITYPOLICY RESEARCH
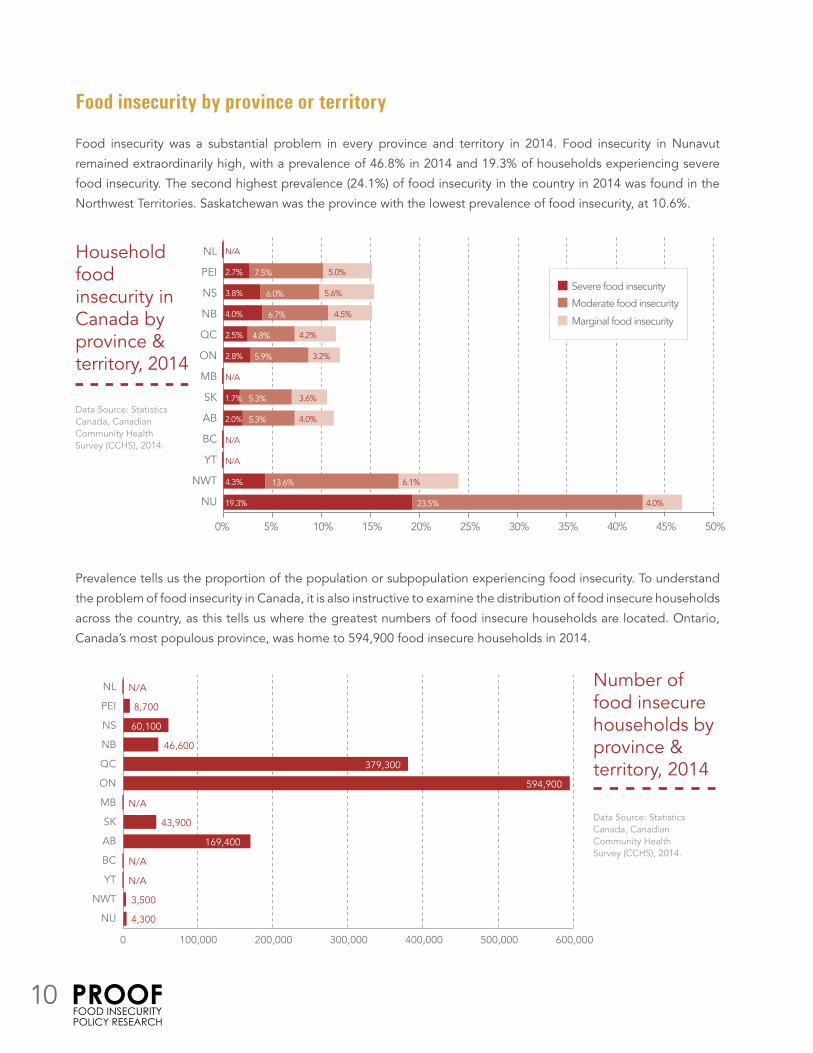
Food insecurity by province or territory
Food insecurity was a substantial problem in every province and territory in 2014. Food insecurity in Nunavut
remained extraordinarily high, with a prevalence of 46.8% in 2014 and 19.3% of households experiencing severe
food insecurity. The second highest prevalence (24.1%) of food insecurity in the country in 2014 was found in the
Northwest Territories. Saskatchewan was the province with the lowest prevalence of food insecurity, at 10.6%.
Severe food insecurity
Moderate food insecurity
Marginal food insecurity
NL
PEI
NS
NB
QC
ON
MB
SK
AB
BC
YT
NWT
NU
N/A
2.7%
3.8%
4.0%
2.5%
2.8%
N/A
1.7%
2.0%
N/A
N/A
4.3%
19.3%
n/a
7.5%
6.0%
6.7%
4.8%
5.9%
n/a
5.3%
5.3%
n/a
n/a
13.6%
23.5%
n/a
5.0%
5.6%
4.5%
4.2%
3.2%
n/a
3.6%
4.0%
n/a
n/a
6.1%
4.0%
0% 5% 10% 15% 20% 25% 30% 35% 40% 45% 50%
Household food insecurity in Canada by province & territory, 2014
Data Source: Statistics Canada, Canadian Community Health Survey (CCHS), 2014.
Prevalence tells us the proportion of the population or subpopulation experiencing food insecurity. To understand
the problem of food insecurity in Canada, it is also instructive to examine the distribution of food insecure households
across the country, as this tells us where the greatest numbers of food insecure households are located. Ontario,
Canada’s most populous province, was home to 594,900 food insecure households in 2014.
0 100,000 200,000 300,000 400,000 500,000 600,000
NL
PEI
NS
NB
QC
ON
MB
SK
AB
BC
YT
NWT
NU
N/A
8,700
60,100
46,600
379,300
594,900
N/A
43,900
169,400
N/A
N/A
3,500
4,300
Number of food insecure households by province &territory, 2014
Data Source: Statistics Canada, Canadian Community Health Survey (CCHS), 2014.
HOUSEHOLD FOOD INSECURITY IN CANADA, 2014
11
Severe food insecurity
Moderate
Marginal
0% 10% 20% 30% 40%
With children under 18 Couple with childrenFemale lone parent
Male lone parent
With no children under 18 Unattached, living alone or with others
Couple, no children Couples with children ≥ 18
Female lone parent with children ≥ 18Male lone parent or other family type
Elderly living alone
2.7% 7.6% 5.3% 15.6% 5.7% 4.7% 11.8%9.2% 16.6% 7.6% 33.5%
6.3% 7.6% 14.7%
2.7% 4.7% 3.1% 10.4%4.7% 6.8% 4.2% 15.7%
2.5% 1.7% 5.2%
3.2% 2.7% 6.4%2.5% 6.3% 5.0% 13.8%3.1% 4.7% 2.2% 10.1%
4.0% 2.2% 7.4%
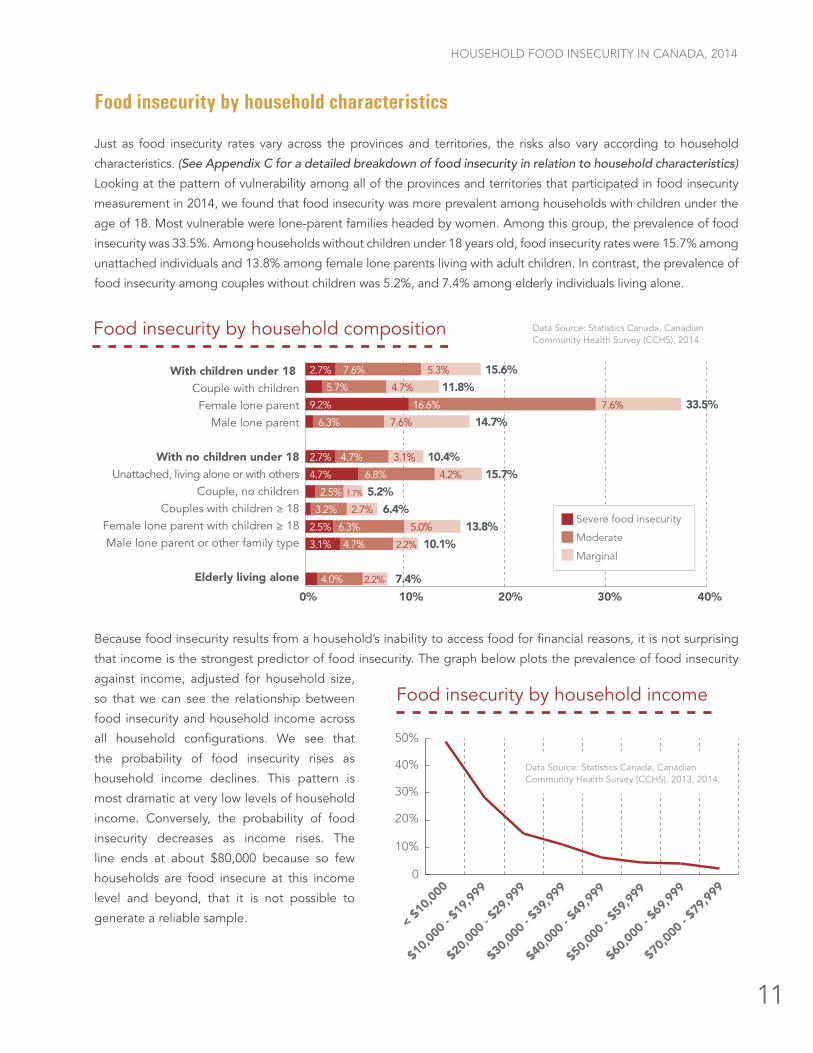
Food insecurity by household composition Data Source: Statistics Canada, Canadian Community Health Survey (CCHS), 2014.
Food insecurity by household characteristics
Just as food insecurity rates vary across the provinces and territories, the risks also vary according to household
characteristics. (See Appendix C for a detailed breakdown of food insecurity in relation to household characteristics)
Looking at the pattern of vulnerability among all of the provinces and territories that participated in food insecurity
measurement in 2014, we found that food insecurity was more prevalent among households with children under the
age of 18. Most vulnerable were lone-parent families headed by women. Among this group, the prevalence of food
insecurity was 33.5%. Among households without children under 18 years old, food insecurity rates were 15.7% among
unattached individuals and 13.8% among female lone parents living with adult children. In contrast, the prevalence of
food insecurity among couples without children was 5.2%, and 7.4% among elderly individuals living alone.
Because food insecurity results from a household’s inability to access food for financial reasons, it is not surprising
that income is the strongest predictor of food insecurity. The graph below plots the prevalence of food insecurity
against income, adjusted for household size,
so that we can see the relationship between
food insecurity and household income across
all household configurations. We see that
the probability of food insecurity rises as
household income declines. This pattern is
most dramatic at very low levels of household
income. Conversely, the probability of food
insecurity decreases as income rises. The
line ends at about $80,000 because so few
households are food insecure at this income
level and beyond, that it is not possible to
generate a reliable sample.
0
10%
20%
30%
40%
50%
Food insecurity by household income
Data Source: Statistics Canada, Canadian Community Health Survey (CCHS), 2013, 2014.
12 PROOFFOOD INSECURITYPOLICY RESEARCH
0% 10% 20% 30% 40% 50%
< 0.5 0.5 - < 1.0
1.0 - 1.491.5 - 1.9
2.0 - 2.993.0+
% food insecure
16.3% 20.7% 6.9% 43.9%5.7% 12.4% 6.5% 24.6%
2.2% 5.4% 5.1% 12.7% 4.0% 3.2% 8.3%
1.9% 2.3% 4.8%2%
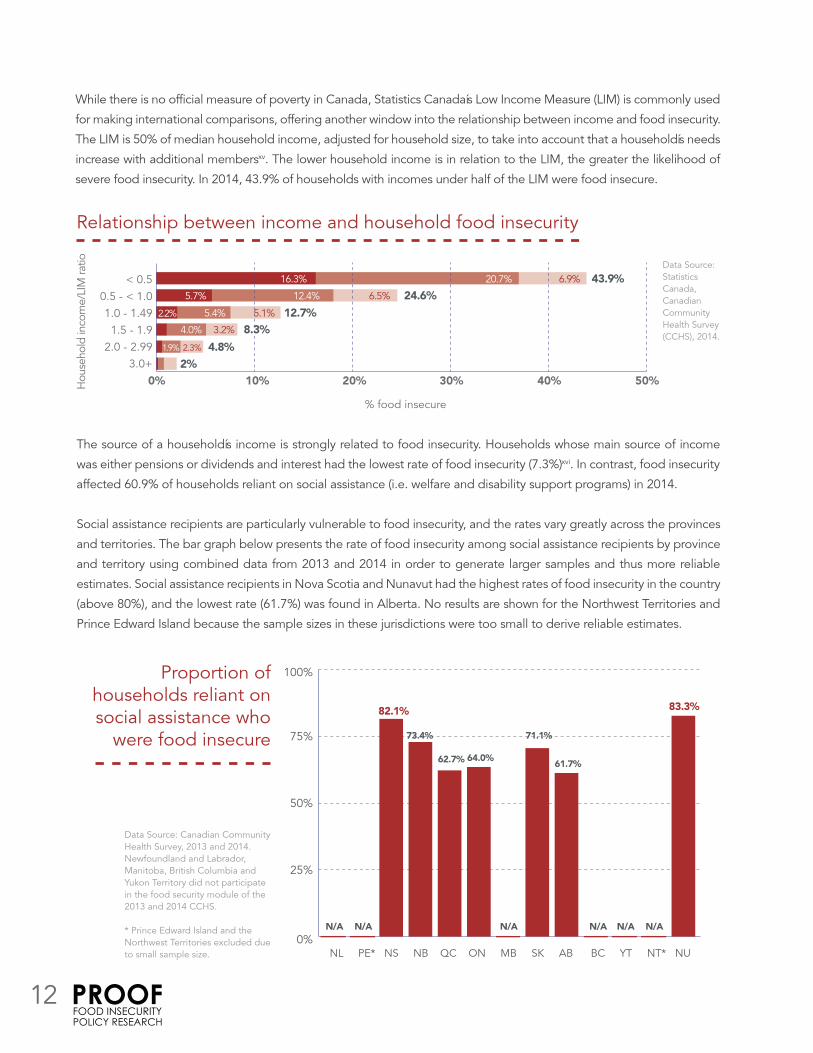
Relationship between income and household food insecurity
Data Source: Statistics Canada, Canadian Community Health Survey (CCHS), 2014.
While there is no official measure of poverty in Canada, Statistics Canada’s Low Income Measure (LIM) is commonly used
for making international comparisons, offering another window into the relationship between income and food insecurity.
The LIM is 50% of median household income, adjusted for household size, to take into account that a household’s needs
increase with additional membersxv. The lower household income is in relation to the LIM, the greater the likelihood of
severe food insecurity. In 2014, 43.9% of households with incomes under half of the LIM were food insecure.
The source of a household’s income is strongly related to food insecurity. Households whose main source of income
was either pensions or dividends and interest had the lowest rate of food insecurity (7.3%)xvi. In contrast, food insecurity
affected 60.9% of households reliant on social assistance (i.e. welfare and disability support programs) in 2014.
Social assistance recipients are particularly vulnerable to food insecurity, and the rates vary greatly across the provinces
and territories. The bar graph below presents the rate of food insecurity among social assistance recipients by province
and territory using combined data from 2013 and 2014 in order to generate larger samples and thus more reliable
estimates. Social assistance recipients in Nova Scotia and Nunavut had the highest rates of food insecurity in the country
(above 80%), and the lowest rate (61.7%) was found in Alberta. No results are shown for the Northwest Territories and
Prince Edward Island because the sample sizes in these jurisdictions were too small to derive reliable estimates.
NL PE* NS NB QC ON MB SK AB BC YT NT* NU0%
25%
50%
75%
100%
83.3%82.1%
73.4%
62.7% 64.0%
71.1%
61.7%
N/A N/A N/A N/AN/A N/A
Proportion of households reliant on social assistance who
were food insecure
Data Source: Canadian Community Health Survey, 2013 and 2014. Newfoundland and Labrador, Manitoba, British Columbia and Yukon Territory did not participate in the food security module of the 2013 and 2014 CCHS.
* Prince Edward Island and the Northwest Territories excluded due to small sample size.
HOUSEHOLD FOOD INSECURITY IN CANADA, 2014
13
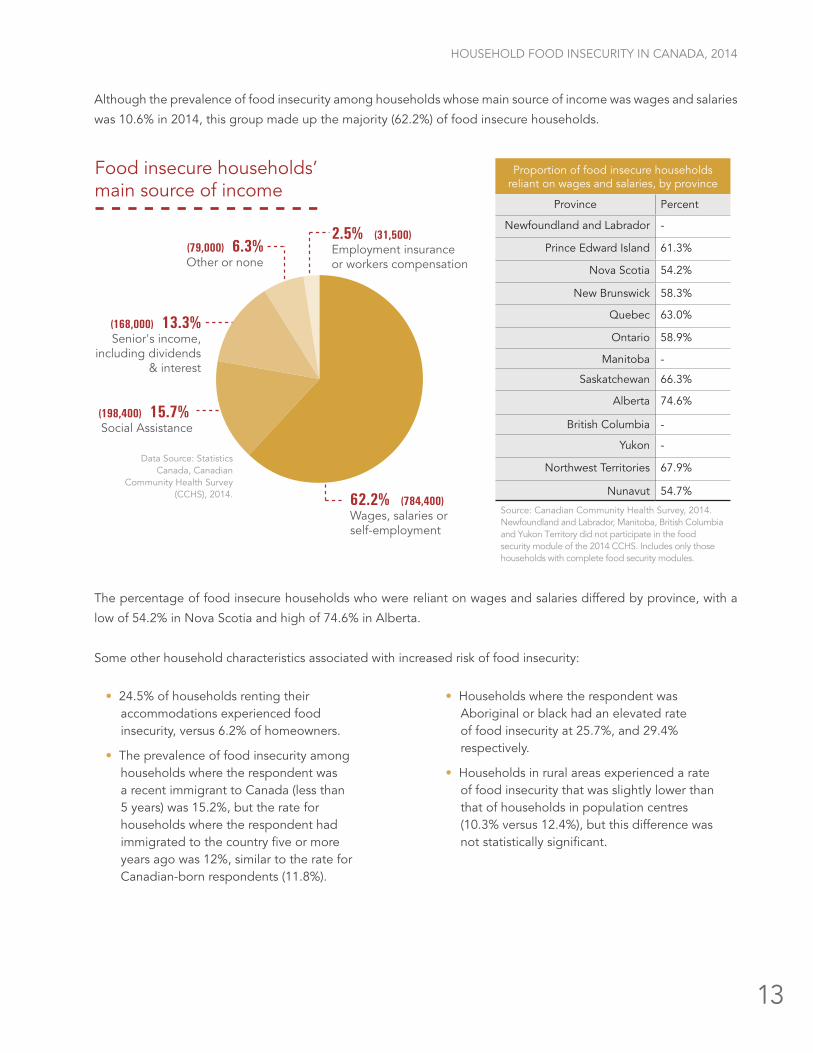
Although the prevalence of food insecurity among households whose main source of income was wages and salaries
was 10.6% in 2014, this group made up the majority (62.2%) of food insecure households.
The percentage of food insecure households who were reliant on wages and salaries differed by province, with a
low of 54.2% in Nova Scotia and high of 74.6% in Alberta.
Some other household characteristics associated with increased risk of food insecurity:
Food insecure households’ main source of income
62.2% (784,400)Wages, salaries or self-employment
(198,400) 15.7% Social Assistance
(168,000) 13.3% Senior's income,
including dividends& interest
(79,000) 6.3%Other or none
2.5% (31,500)Employment insurance or workers compensation
Data Source: Statistics Canada, Canadian
Community Health Survey (CCHS), 2014.
Proportion of food insecure households reliant on wages and salaries, by province
Province Percent
Newfoundland and Labrador -
Prince Edward Island 61.3%
Nova Scotia 54.2%
New Brunswick 58.3%
Quebec 63.0%
Ontario 58.9%
Manitoba -
Saskatchewan 66.3%
Alberta 74.6%
British Columbia -
Yukon -
Northwest Territories 67.9%
Nunavut 54.7%
Source: Canadian Community Health Survey, 2014. Newfoundland and Labrador, Manitoba, British Columbia and Yukon Territory did not participate in the food security module of the 2014 CCHS. Includes only those households with complete food security modules.
• 24.5% of households renting their accommodations experienced food insecurity, versus 6.2% of homeowners.
• The prevalence of food insecurity among households where the respondent was a recent immigrant to Canada (less than 5 years) was 15.2%, but the rate for households where the respondent had immigrated to the country five or more years ago was 12%, similar to the rate for Canadian-born respondents (11.8%).
• Households where the respondent was Aboriginal or black had an elevated rate of food insecurity at 25.7%, and 29.4% respectively.
• Households in rural areas experienced a rate of food insecurity that was slightly lower than that of households in population centres (10.3% versus 12.4%), but this difference was not statistically significant.
14 PROOFFOOD INSECURITYPOLICY RESEARCH
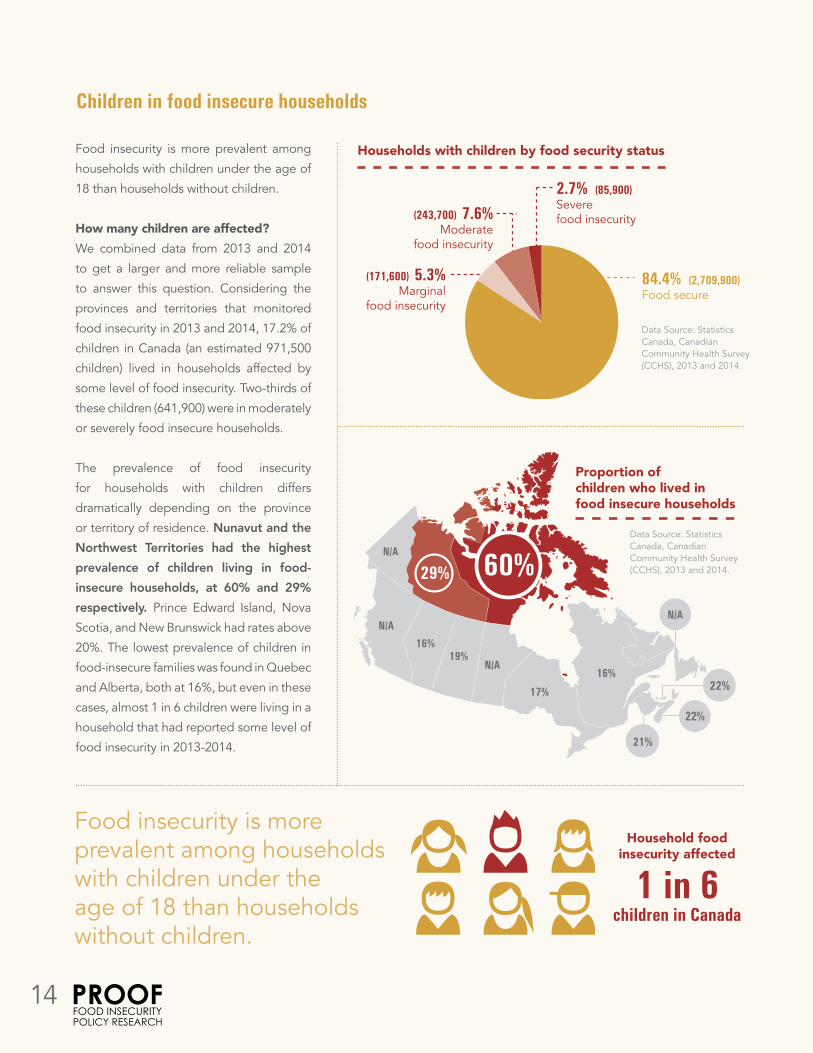
Children in food insecure households
Food insecurity is more prevalent among
households with children under the age of
18 than households without children.
How many children are affected?We combined data from 2013 and 2014
to get a larger and more reliable sample
to answer this question. Considering the
provinces and territories that monitored
food insecurity in 2013 and 2014, 17.2% of
children in Canada (an estimated 971,500
children) lived in households affected by
some level of food insecurity. Two-thirds of
these children (641,900) were in moderately
or severely food insecure households.
The prevalence of food insecurity
for households with children differs
dramatically depending on the province
or territory of residence. Nunavut and the Northwest Territories had the highest prevalence of children living in food-insecure households, at 60% and 29% respectively. Prince Edward Island, Nova
Scotia, and New Brunswick had rates above
20%. The lowest prevalence of children in
food-insecure families was found in Quebec
and Alberta, both at 16%, but even in these
cases, almost 1 in 6 children were living in a
household that had reported some level of
food insecurity in 2013-2014.
84.4% (2,709,900)Food secure
(171,600) 5.3% Marginal
food insecurity
(243,700) 7.6% Moderate
food insecurity
2.7% (85,900)Severefood insecurity
Households with children by food security status
Data Source: Statistics Canada, Canadian Community Health Survey (CCHS), 2013 and 2014.
17%
19%
N/A
22%
22%
21%
N/A
N/A
60%N/A
16%
16%
29%
Proportion of children who lived in food insecure households
Data Source: Statistics Canada, Canadian Community Health Survey (CCHS), 2013 and 2014.
Household food insecurity affected
1 in 6children in Canada
Food insecurity is more prevalent among households with children under the age of 18 than households without children.
14 PROOFFOOD INSECURITYPOLICY RESEARCH
HOUSEHOLD FOOD INSECURITY IN CANADA, 2014
15
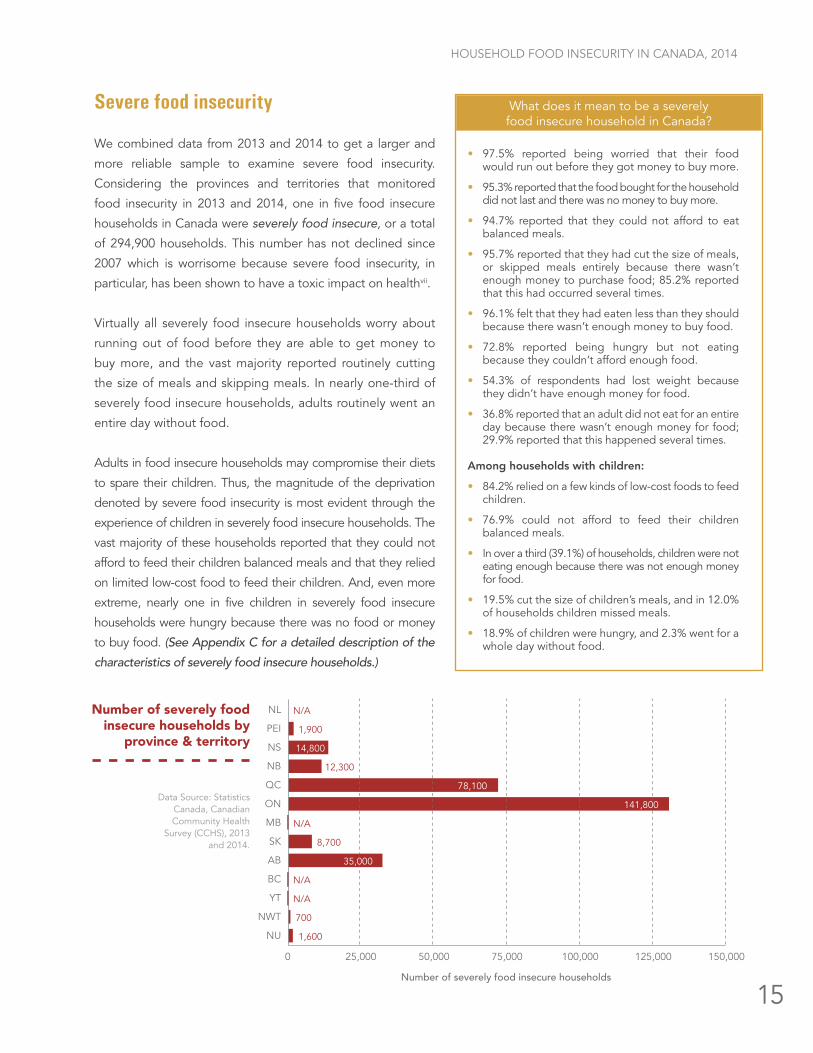
Severe food insecurity
We combined data from 2013 and 2014 to get a larger and
more reliable sample to examine severe food insecurity.
Considering the provinces and territories that monitored
food insecurity in 2013 and 2014, one in five food insecure
households in Canada were severely food insecure, or a total
of 294,900 households. This number has not declined since
2007 which is worrisome because severe food insecurity, in
particular, has been shown to have a toxic impact on healthvii.
Virtually all severely food insecure households worry about
running out of food before they are able to get money to
buy more, and the vast majority reported routinely cutting
the size of meals and skipping meals. In nearly one-third of
severely food insecure households, adults routinely went an
entire day without food.
Adults in food insecure households may compromise their diets
to spare their children. Thus, the magnitude of the deprivation
denoted by severe food insecurity is most evident through the
experience of children in severely food insecure households. The
vast majority of these households reported that they could not
afford to feed their children balanced meals and that they relied
on limited low-cost food to feed their children. And, even more
extreme, nearly one in five children in severely food insecure
households were hungry because there was no food or money
to buy food. (See Appendix C for a detailed description of the
characteristics of severely food insecure households.)
What does it mean to be a severely food insecure household in Canada?
• 97.5% reported being worried that their food would run out before they got money to buy more.
• 95.3% reported that the food bought for the household did not last and there was no money to buy more.
• 94.7% reported that they could not afford to eat balanced meals.
• 95.7% reported that they had cut the size of meals, or skipped meals entirely because there wasn’t enough money to purchase food; 85.2% reported that this had occurred several times.
• 96.1% felt that they had eaten less than they should because there wasn’t enough money to buy food.
• 72.8% reported being hungry but not eating because they couldn’t afford enough food.
• 54.3% of respondents had lost weight because they didn’t have enough money for food.
• 36.8% reported that an adult did not eat for an entire day because there wasn’t enough money for food; 29.9% reported that this happened several times.
Among households with children:
• 84.2% relied on a few kinds of low-cost foods to feed children.
• 76.9% could not afford to feed their children balanced meals.
• In over a third (39.1%) of households, children were not eating enough because there was not enough money for food.
• 19.5% cut the size of children’s meals, and in 12.0% of households children missed meals.
• 18.9% of children were hungry, and 2.3% went for a whole day without food.
0 25,000 50,000 75,000 100,000 125,000 150,000
NL
PEI
NS
NB
QC
ON
MB
SK
AB
BC
YT
NWT
NU
N/A
1,900
14,800
12,300
78,100
141,800
N/A
8,700
35,000
N/A
N/A
700
1,600
Number of severely food insecure households
Number of severely food insecure households by
province & territory
Data Source: Statistics Canada, Canadian Community Health
Survey (CCHS), 2013 and 2014.
16 PROOFFOOD INSECURITYPOLICY RESEARCH
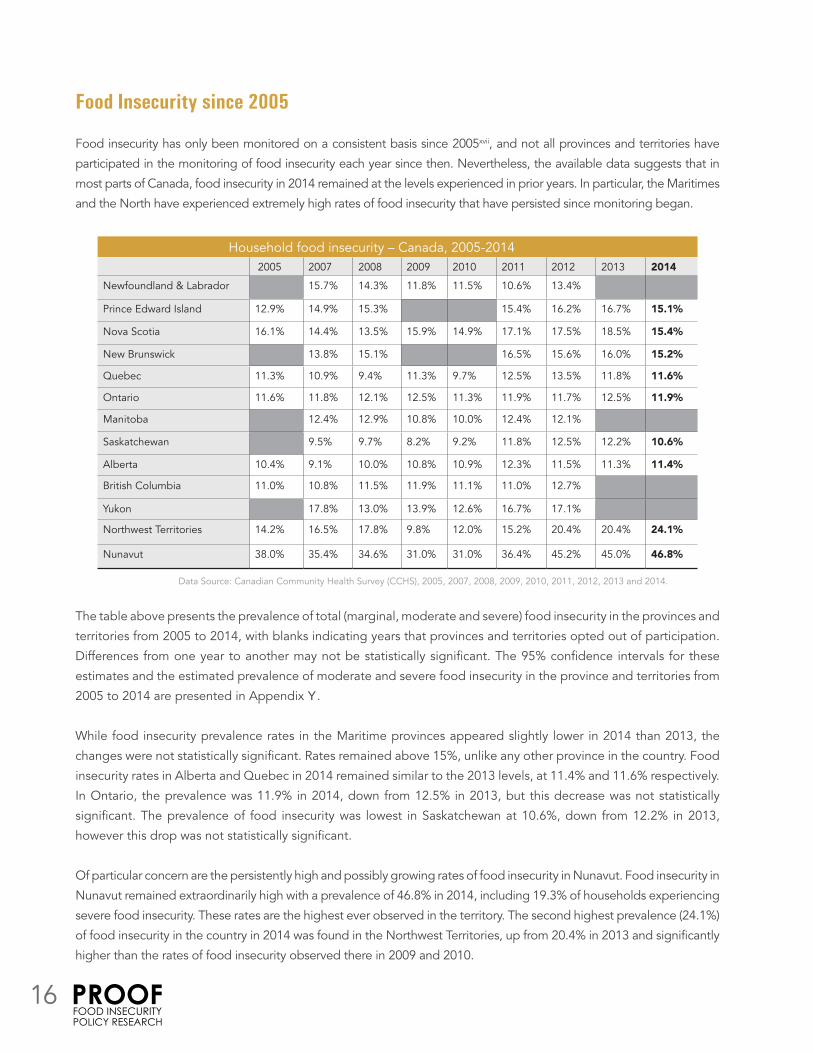
Food Insecurity since 2005
Food insecurity has only been monitored on a consistent basis since 2005xvii, and not all provinces and territories have
participated in the monitoring of food insecurity each year since then. Nevertheless, the available data suggests that in
most parts of Canada, food insecurity in 2014 remained at the levels experienced in prior years. In particular, the Maritimes
and the North have experienced extremely high rates of food insecurity that have persisted since monitoring began.
Household food insecurity – Canada, 2005-2014 2005 2007 2008 2009 2010 2011 2012 2013 2014
Newfoundland & Labrador 15.7% 14.3% 11.8% 11.5% 10.6% 13.4%
Prince Edward Island 12.9% 14.9% 15.3% 15.4% 16.2% 16.7% 15.1%
Nova Scotia 16.1% 14.4% 13.5% 15.9% 14.9% 17.1% 17.5% 18.5% 15.4%
New Brunswick 13.8% 15.1% 16.5% 15.6% 16.0% 15.2%
Quebec 11.3% 10.9% 9.4% 11.3% 9.7% 12.5% 13.5% 11.8% 11.6%
Ontario 11.6% 11.8% 12.1% 12.5% 11.3% 11.9% 11.7% 12.5% 11.9%
Manitoba 12.4% 12.9% 10.8% 10.0% 12.4% 12.1%
Saskatchewan 9.5% 9.7% 8.2% 9.2% 11.8% 12.5% 12.2% 10.6%
Alberta 10.4% 9.1% 10.0% 10.8% 10.9% 12.3% 11.5% 11.3% 11.4%
British Columbia 11.0% 10.8% 11.5% 11.9% 11.1% 11.0% 12.7%
Yukon 17.8% 13.0% 13.9% 12.6% 16.7% 17.1%
Northwest Territories 14.2% 16.5% 17.8% 9.8% 12.0% 15.2% 20.4% 20.4% 24.1%
Nunavut 38.0% 35.4% 34.6% 31.0% 31.0% 36.4% 45.2% 45.0% 46.8%
Data Source: Canadian Community Health Survey (CCHS), 2005, 2007, 2008, 2009, 2010, 2011, 2012, 2013 and 2014.
The table above presents the prevalence of total (marginal, moderate and severe) food insecurity in the provinces and
territories from 2005 to 2014, with blanks indicating years that provinces and territories opted out of participation.
Differences from one year to another may not be statistically significant. The 95% confidence intervals for these
estimates and the estimated prevalence of moderate and severe food insecurity in the province and territories from
2005 to 2014 are presented in Appendix Y.
While food insecurity prevalence rates in the Maritime provinces appeared slightly lower in 2014 than 2013, the
changes were not statistically significant. Rates remained above 15%, unlike any other province in the country. Food
insecurity rates in Alberta and Quebec in 2014 remained similar to the 2013 levels, at 11.4% and 11.6% respectively.
In Ontario, the prevalence was 11.9% in 2014, down from 12.5% in 2013, but this decrease was not statistically
significant. The prevalence of food insecurity was lowest in Saskatchewan at 10.6%, down from 12.2% in 2013,
however this drop was not statistically significant.
Of particular concern are the persistently high and possibly growing rates of food insecurity in Nunavut. Food insecurity in
Nunavut remained extraordinarily high with a prevalence of 46.8% in 2014, including 19.3% of households experiencing
severe food insecurity. These rates are the highest ever observed in the territory. The second highest prevalence (24.1%)
of food insecurity in the country in 2014 was found in the Northwest Territories, up from 20.4% in 2013 and significantly
higher than the rates of food insecurity observed there in 2009 and 2010.
HOUSEHOLD FOOD INSECURITY IN CANADA, 2014
17
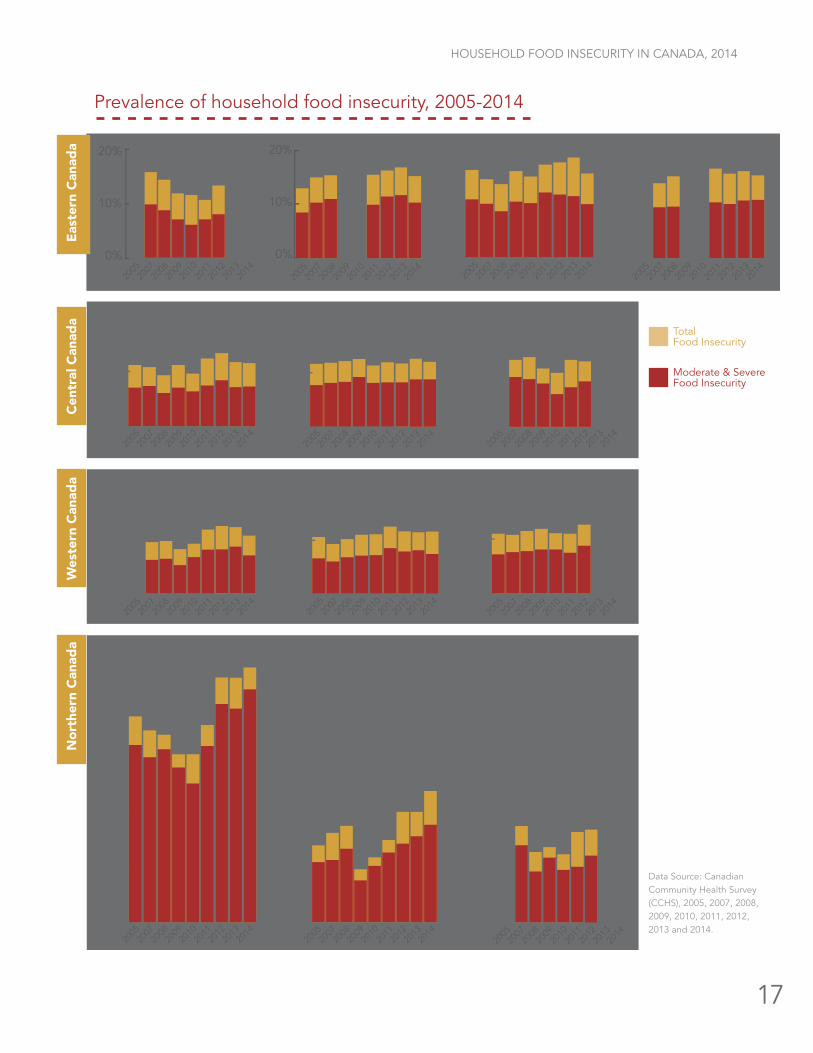
20%
10%
0%NL
20%
10%
0%
PE NS
20%
10%
0%
NB
20%
10%
0%
QC
20%
10%
0%
ON
20%
10%
0%MB
20%
10%
0%
SK
20%
10%
0%AB
20%
10%
0%BC
20%
10%
0%
NU
40%
30%
20%
10%
0%
50%
NT
20%
10%
0%
30%
YT
20%
10%
0%
Prevalence of household food insecurity, 2005-2014
TotalFood Insecurity
Moderate & Severe Food Insecurity
Data Source: Canadian Community Health Survey (CCHS), 2005, 2007, 2008, 2009, 2010, 2011, 2012, 2013 and 2014.
Cen
tral
Can
ada
Wes
tern
Can
ada
No
rthe
rn C
anad
aE
aste
rn C
anad
a
18 PROOFFOOD INSECURITYPOLICY RESEARCH
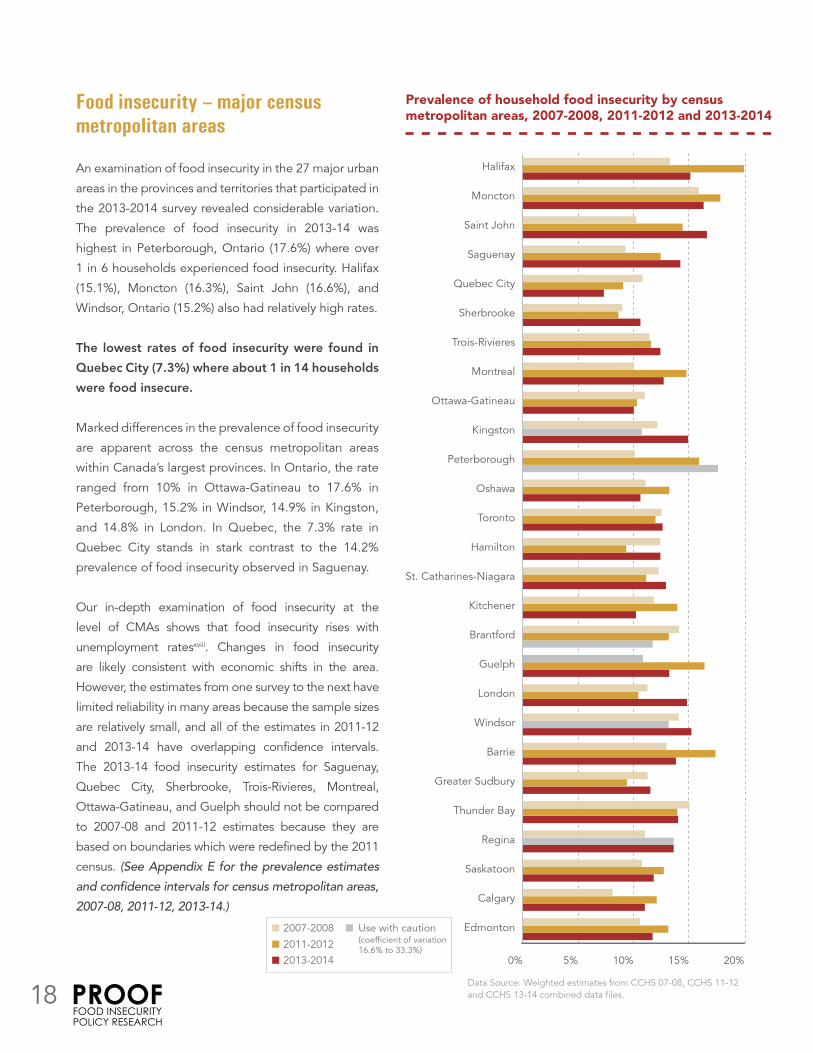
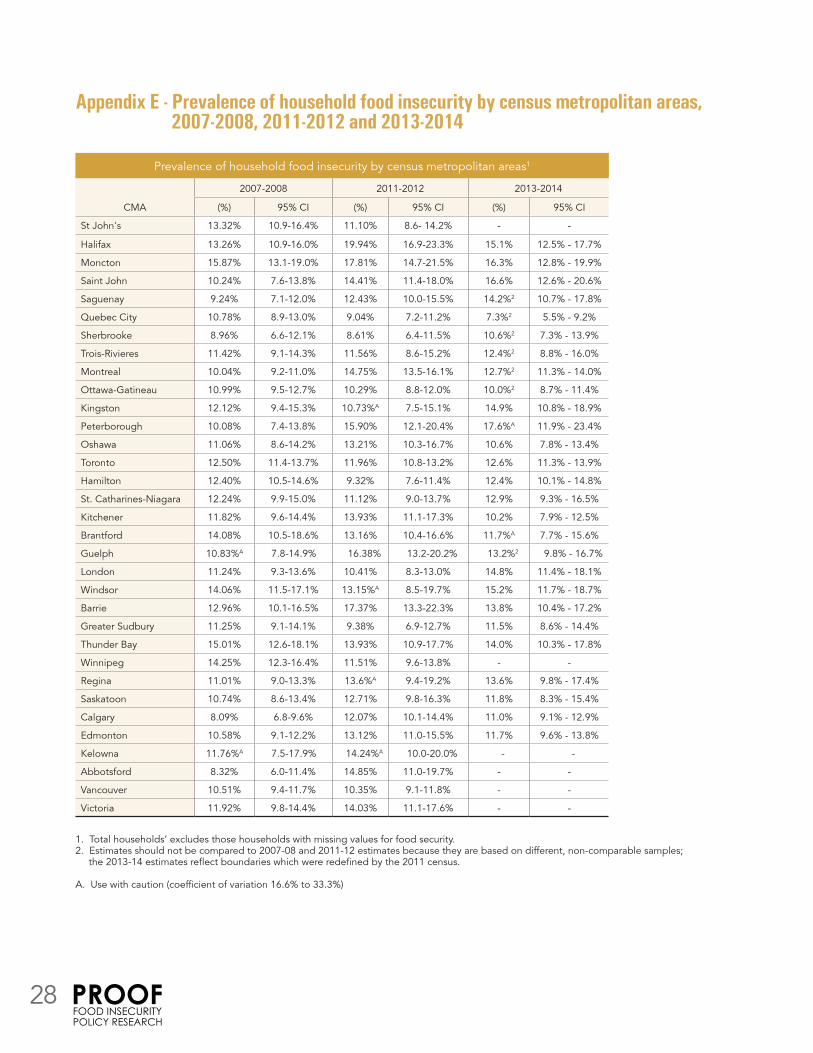
Food insecurity – major census metropolitan areas
An examination of food insecurity in the 27 major urban
areas in the provinces and territories that participated in
the 2013-2014 survey revealed considerable variation.
The prevalence of food insecurity in 2013-14 was
highest in Peterborough, Ontario (17.6%) where over
1 in 6 households experienced food insecurity. Halifax
(15.1%), Moncton (16.3%), Saint John (16.6%), and
Windsor, Ontario (15.2%) also had relatively high rates.
The lowest rates of food insecurity were found in
Quebec City (7.3%) where about 1 in 14 households
were food insecure.
Marked differences in the prevalence of food insecurity
are apparent across the census metropolitan areas
within Canada’s largest provinces. In Ontario, the rate
ranged from 10% in Ottawa-Gatineau to 17.6% in
Peterborough, 15.2% in Windsor, 14.9% in Kingston,
and 14.8% in London. In Quebec, the 7.3% rate in
Quebec City stands in stark contrast to the 14.2%
prevalence of food insecurity observed in Saguenay.
Our in-depth examination of food insecurity at the
level of CMAs shows that food insecurity rises with
unemployment ratesxviii. Changes in food insecurity
are likely consistent with economic shifts in the area.
However, the estimates from one survey to the next have
limited reliability in many areas because the sample sizes
are relatively small, and all of the estimates in 2011-12
and 2013-14 have overlapping confidence intervals.
The 2013-14 food insecurity estimates for Saguenay,
Quebec City, Sherbrooke, Trois-Rivieres, Montreal,
Ottawa-Gatineau, and Guelph should not be compared
to 2007-08 and 2011-12 estimates because they are
based on boundaries which were redefined by the 2011
census. (See Appendix E for the prevalence estimates
2007-08, 2011-12, 2013-14.)
Data Source: Weighted estimates from CCHS 07-08, CCHS 11-12 and CCHS 13-14 combined data files.
0% 5% 10% 15% 20%
Halifax
Moncton
Saint John
Saguenay
Quebec City
Sherbrooke
Trois-Rivieres
Montreal
Ottawa-Gatineau
Kingston
Peterborough
Oshawa
Toronto
Hamilton
St. Catharines-Niagara
Kitchener
Brantford
Guelph
London
Windsor
Barrie
Greater Sudbury
Thunder Bay
Regina
Saskatoon
Calgary
Edmonton2007-2008
2011-2012
Use with caution(coefficient of variation 16.6% to 33.3%)
2013-2014
Prevalence of household food insecurity by census metropolitan areas, 2007-2008, 2011-2012 and 2013-2014

HOUSEHOLD FOOD INSECURITY IN CANADA, 2014
19
Conclusions Food insecure individuals are vulnerable to the physical
and emotional hardships that underpin the experience
of food insecurity, a marker of material deprivation
that is intimately tied to compromised health and well-
being.
Although there has been rigorous measurement and
monitoring of household food insecurity in Canada
since 2005, the problem has not abated. In fact, it
has grown or persisted in every province and territory.
Among the provinces and territories surveyed in
2014, there are no significant drops and indications
of troubling upward trends in the already vulnerable
North. The inclusion of the Household Food Security
Survey Module on the Canadian Health Survey enables
monitoring of food insecurity, and it is incumbent on
provinces and territories to participate in all cycles of
measurement.
Food insecurity is a very large and serious social and
public health problem in Canada. The geographic
patterning of food insecurity, such as the alarming
rates in the North and the Maritimes, and the density
of affected households in our largest provinces,
suggests that reducing the prevalence of food
insecurity requires attention by provincial, territorial,
and federal levels of government. The data in this
report provide an impetus for discussion that is critical
to the development of programs and policies by all
sectors aimed at tackling food insecurity in Canada.
The geographic patterning of food insecurity such as the alarming rates in the North and the Maritimes, and the density of affected households in our largest provinces suggest that reducing the prevalence of food insecurity requires attention by provincial and federal levels of government.
20 PROOFFOOD INSECURITYPOLICY RESEARCH
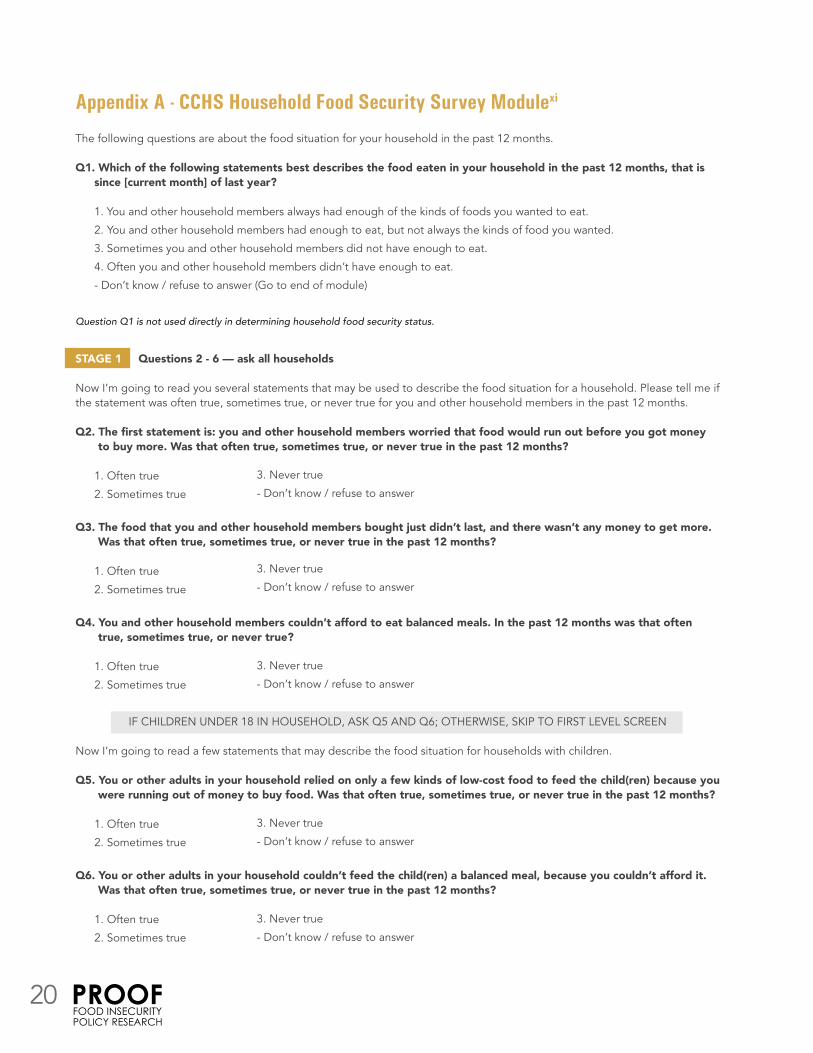
Appendix A - CCHS Household Food Security Survey Modulexi
The following questions are about the food situation for your household in the past 12 months.
Q1. Which of the following statements best describes the food eaten in your household in the past 12 months, that is since [current month] of last year?
1. You and other household members always had enough of the kinds of foods you wanted to eat.
2. You and other household members had enough to eat, but not always the kinds of food you wanted.
3. Sometimes you and other household members did not have enough to eat.
4. Often you and other household members didn’t have enough to eat.
- Don’t know / refuse to answer (Go to end of module)
STAGE 1 Questions 2 - 6 — ask all households
Now I’m going to read you several statements that may be used to describe the food situation for a household. Please tell me if the statement was often true, sometimes true, or never true for you and other household members in the past 12 months.
Q2. The first statement is: you and other household members worried that food would run out before you got money to buy more. Was that often true, sometimes true, or never true in the past 12 months?
1. Often true
2. Sometimes true
Q3. The food that you and other household members bought just didn’t last, and there wasn’t any money to get more. Was that often true, sometimes true, or never true in the past 12 months?
1. Often true
2. Sometimes true
Q4. You and other household members couldn’t afford to eat balanced meals. In the past 12 months was that often true, sometimes true, or never true?
1. Often true
2. Sometimes true
IF CHILDREN UNDER 18 IN HOUSEHOLD, ASK Q5 AND Q6; OTHERWISE, SKIP TO FIRST LEVEL SCREEN
Now I’m going to read a few statements that may describe the food situation for households with children.
Q5. You or other adults in your household relied on only a few kinds of low-cost food to feed the child(ren) because you were running out of money to buy food. Was that often true, sometimes true, or never true in the past 12 months?
1. Often true
2. Sometimes true
Q6. You or other adults in your household couldn’t feed the child(ren) a balanced meal, because you couldn’t afford it. Was that often true, sometimes true, or never true in the past 12 months?
1. Often true
2. Sometimes true
3. Never true
- Don’t know / refuse to answer
3. Never true
- Don’t know / refuse to answer
3. Never true
- Don’t know / refuse to answer
3. Never true
- Don’t know / refuse to answer
3. Never true
- Don’t know / refuse to answer
Question Q1 is not used directly in determining household food security status.
HOUSEHOLD FOOD INSECURITY IN CANADA, 2014
21
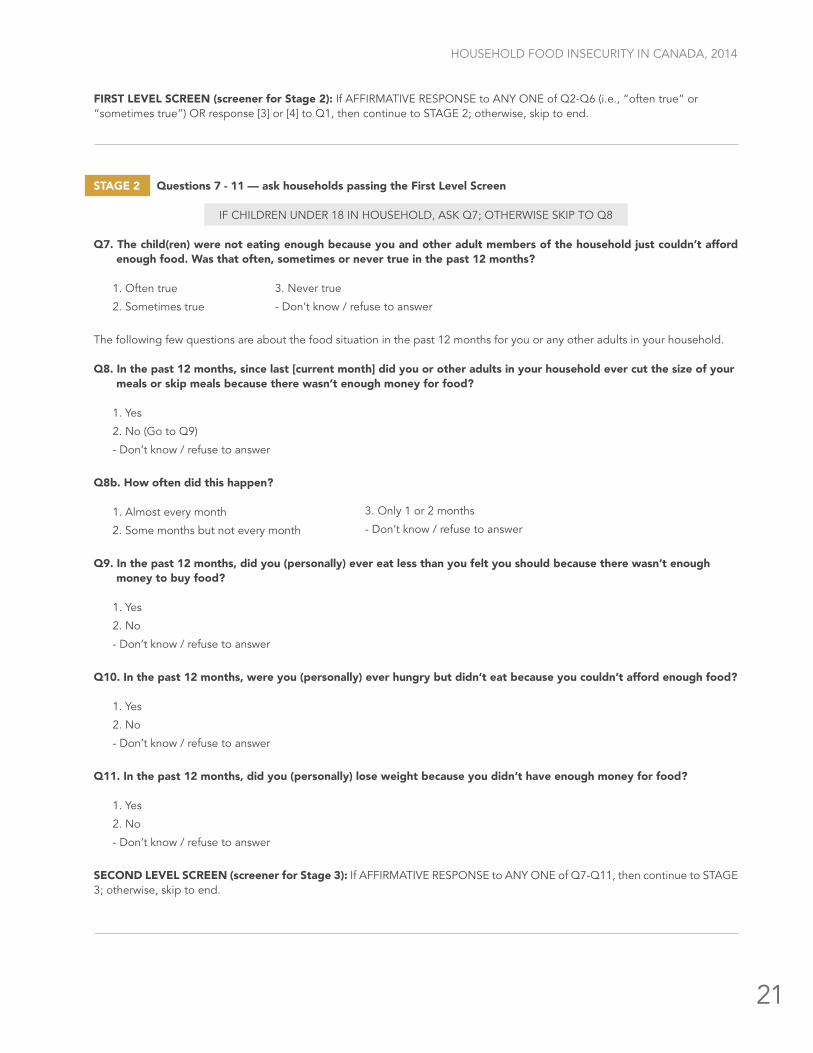
STAGE 2 Questions 7 - 11 — ask households passing the First Level Screen
IF CHILDREN UNDER 18 IN HOUSEHOLD, ASK Q7; OTHERWISE SKIP TO Q8
Q7. The child(ren) were not eating enough because you and other adult members of the household just couldn’t afford enough food. Was that often, sometimes or never true in the past 12 months?
1. Often true
2. Sometimes true
The following few questions are about the food situation in the past 12 months for you or any other adults in your household.
Q8. In the past 12 months, since last [current month] did you or other adults in your household ever cut the size of your meals or skip meals because there wasn’t enough money for food?
1. Yes
2. No (Go to Q9)
- Don’t know / refuse to answer
Q8b. How often did this happen?
1. Almost every month
2. Some months but not every month
Q9. In the past 12 months, did you (personally) ever eat less than you felt you should because there wasn’t enough money to buy food?
1. Yes
2. No
- Don’t know / refuse to answer
Q10. In the past 12 months, were you (personally) ever hungry but didn’t eat because you couldn’t afford enough food?
1. Yes
2. No
- Don’t know / refuse to answer
Q11. In the past 12 months, did you (personally) lose weight because you didn’t have enough money for food?
1. Yes
2. No
- Don’t know / refuse to answer
SECOND LEVEL SCREEN (screener for Stage 3): If AFFIRMATIVE RESPONSE to ANY ONE of Q7-Q11, then continue to STAGE 3; otherwise, skip to end.
3. Never true
- Don’t know / refuse to answer
3. Only 1 or 2 months
- Don’t know / refuse to answer
FIRST LEVEL SCREEN (screener for Stage 2): If AFFIRMATIVE RESPONSE to ANY ONE of Q2-Q6 (i.e., “often true” or “sometimes true”) OR response [3] or [4] to Q1, then continue to STAGE 2; otherwise, skip to end.
22 PROOFFOOD INSECURITYPOLICY RESEARCH
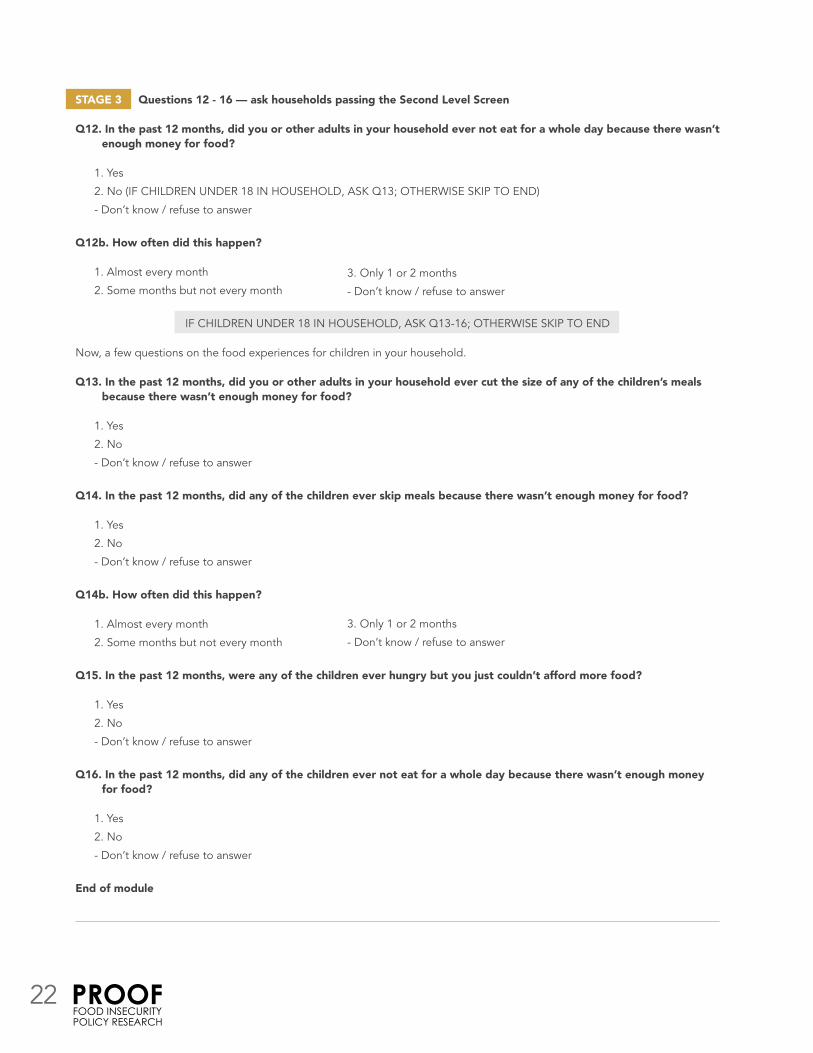
STAGE 3 Questions 12 - 16 — ask households passing the Second Level Screen
Q12. In the past 12 months, did you or other adults in your household ever not eat for a whole day because there wasn’t enough money for food?
1. Yes
2. No (IF CHILDREN UNDER 18 IN HOUSEHOLD, ASK Q13; OTHERWISE SKIP TO END)
- Don’t know / refuse to answer
Q12b. How often did this happen?
1. Almost every month
2. Some months but not every month
IF CHILDREN UNDER 18 IN HOUSEHOLD, ASK Q13-16; OTHERWISE SKIP TO END
Now, a few questions on the food experiences for children in your household.
Q13. In the past 12 months, did you or other adults in your household ever cut the size of any of the children’s meals because there wasn’t enough money for food?
1. Yes
2. No
- Don’t know / refuse to answer
Q14. In the past 12 months, did any of the children ever skip meals because there wasn’t enough money for food?
1. Yes
2. No
- Don’t know / refuse to answer
Q14b. How often did this happen?
1. Almost every month
2. Some months but not every month
Q15. In the past 12 months, were any of the children ever hungry but you just couldn’t afford more food?
1. Yes
2. No
- Don’t know / refuse to answer
Q16. In the past 12 months, did any of the children ever not eat for a whole day because there wasn’t enough money for food?
1. Yes
2. No
- Don’t know / refuse to answer
End of module
3. Only 1 or 2 months
- Don’t know / refuse to answer
3. Only 1 or 2 months
- Don’t know / refuse to answer
HOUSEHOLD FOOD INSECURITY IN CANADA, 2014
23
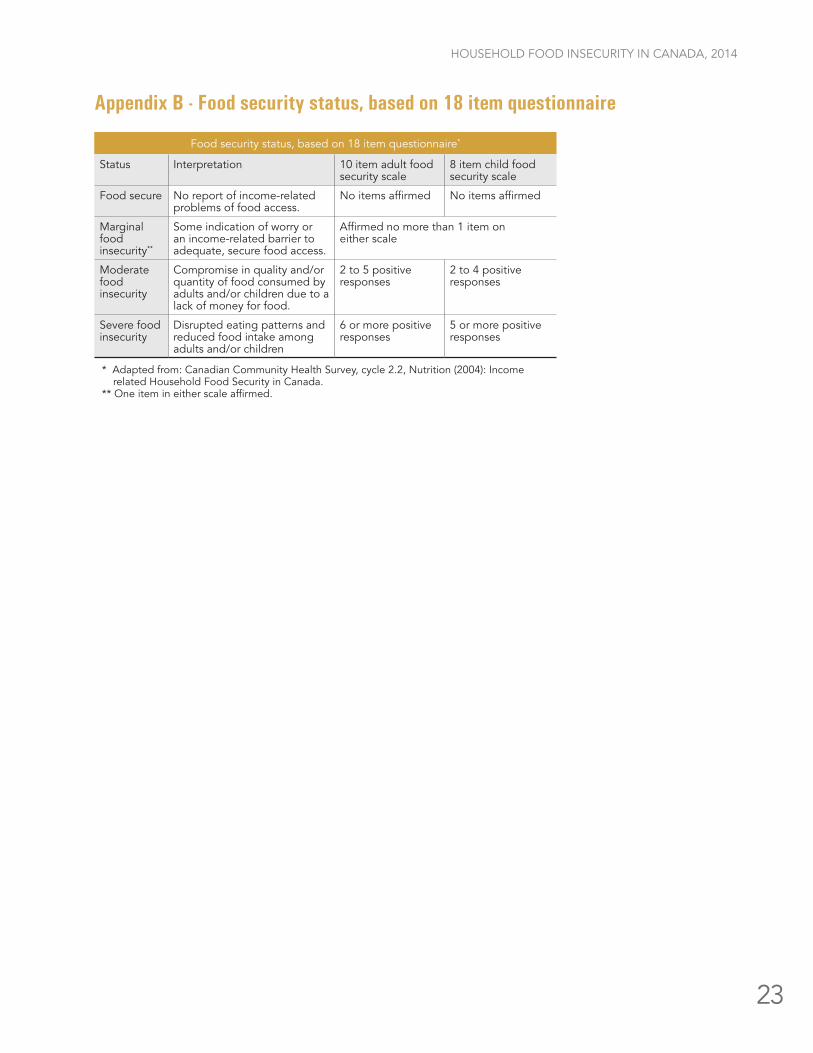
Appendix B - Food security status, based on 18 item questionnaire
Food security status, based on 18 item questionnaire*
Status Interpretation 10 item adult food security scale
8 item child food security scale
Food secure No report of income-related problems of food access.
No items affirmed No items affirmed
Marginal food insecurity**
Some indication of worry or an income-related barrier to adequate, secure food access.
Affirmed no more than 1 item on either scale
Moderate food insecurity
Compromise in quality and/or quantity of food consumed by adults and/or children due to a lack of money for food.
2 to 5 positive responses
2 to 4 positive responses
Severe food insecurity
Disrupted eating patterns and reduced food intake among adults and/or children
6 or more positive responses
5 or more positive responses
* Adapted from: Canadian Community Health Survey, cycle 2.2, Nutrition (2004): Income related Household Food Security in Canada.
** One item in either scale affirmed.
24 PROOFFOOD INSECURITYPOLICY RESEARCH
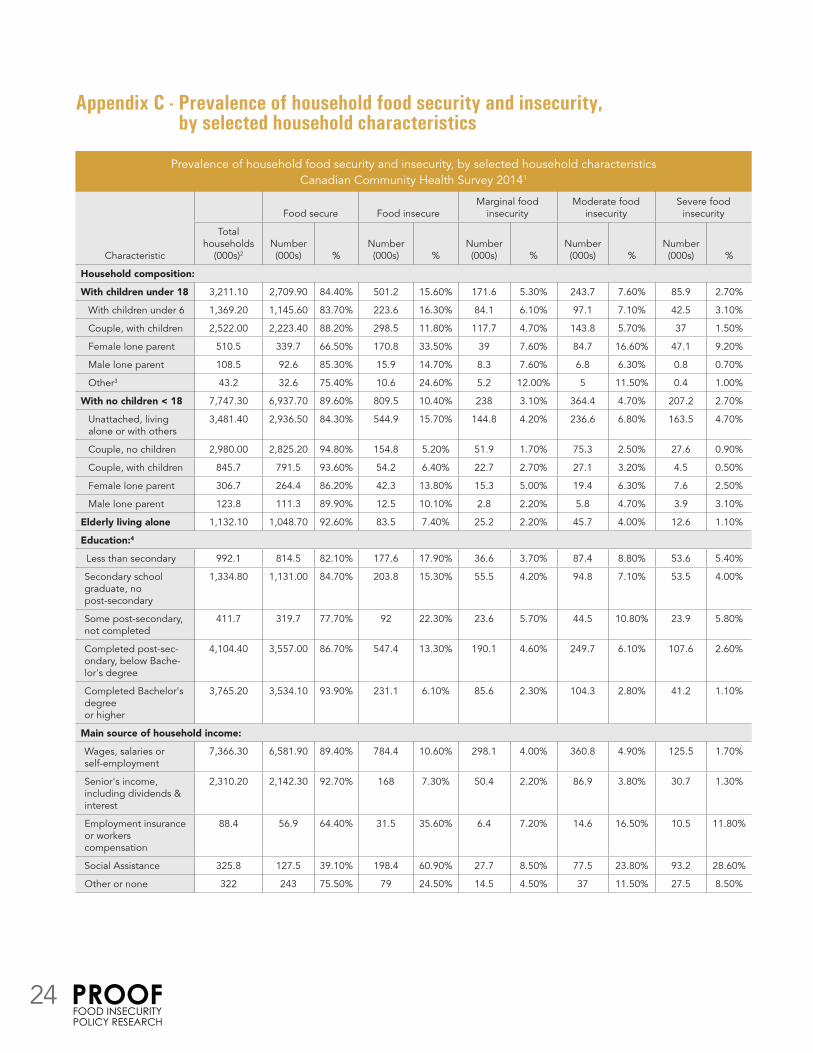
Prevalence of household food security and insecurity, by selected household characteristicsCanadian Community Health Survey 20141
Characteristic
Food secure Food insecureMarginal food
insecurityModerate food
insecuritySevere food
insecurity
Total households
(000s)2Number (000s) %
Number (000s) %
Number (000s) %
Number (000s) %
Number (000s) %
Household composition:
With children under 18 3,211.10 2,709.90 84.40% 501.2 15.60% 171.6 5.30% 243.7 7.60% 85.9 2.70%
With children under 6 1,369.20 1,145.60 83.70% 223.6 16.30% 84.1 6.10% 97.1 7.10% 42.5 3.10%
Couple, with children 2,522.00 2,223.40 88.20% 298.5 11.80% 117.7 4.70% 143.8 5.70% 37 1.50%
Female lone parent 510.5 339.7 66.50% 170.8 33.50% 39 7.60% 84.7 16.60% 47.1 9.20%
Male lone parent 108.5 92.6 85.30% 15.9 14.70% 8.3 7.60% 6.8 6.30% 0.8 0.70%
Other3 43.2 32.6 75.40% 10.6 24.60% 5.2 12.00% 5 11.50% 0.4 1.00%
With no children < 18 7,747.30 6,937.70 89.60% 809.5 10.40% 238 3.10% 364.4 4.70% 207.2 2.70%
Unattached, living alone or with others
3,481.40 2,936.50 84.30% 544.9 15.70% 144.8 4.20% 236.6 6.80% 163.5 4.70%
Couple, no children 2,980.00 2,825.20 94.80% 154.8 5.20% 51.9 1.70% 75.3 2.50% 27.6 0.90%
Couple, with children 845.7 791.5 93.60% 54.2 6.40% 22.7 2.70% 27.1 3.20% 4.5 0.50%
Female lone parent 306.7 264.4 86.20% 42.3 13.80% 15.3 5.00% 19.4 6.30% 7.6 2.50%
Male lone parent 123.8 111.3 89.90% 12.5 10.10% 2.8 2.20% 5.8 4.70% 3.9 3.10%
Elderly living alone 1,132.10 1,048.70 92.60% 83.5 7.40% 25.2 2.20% 45.7 4.00% 12.6 1.10%
Education:4
Less than secondary 992.1 814.5 82.10% 177.6 17.90% 36.6 3.70% 87.4 8.80% 53.6 5.40%
Secondary school graduate, no post-secondary
1,334.80 1,131.00 84.70% 203.8 15.30% 55.5 4.20% 94.8 7.10% 53.5 4.00%
Some post-secondary, not completed
411.7 319.7 77.70% 92 22.30% 23.6 5.70% 44.5 10.80% 23.9 5.80%
Completed post-sec-ondary, below Bache-lor's degree
4,104.40 3,557.00 86.70% 547.4 13.30% 190.1 4.60% 249.7 6.10% 107.6 2.60%
Completed Bachelor's degree or higher
3,765.20 3,534.10 93.90% 231.1 6.10% 85.6 2.30% 104.3 2.80% 41.2 1.10%
Main source of household income:
Wages, salaries or self-employment
7,366.30 6,581.90 89.40% 784.4 10.60% 298.1 4.00% 360.8 4.90% 125.5 1.70%
Senior's income, including dividends & interest
2,310.20 2,142.30 92.70% 168 7.30% 50.4 2.20% 86.9 3.80% 30.7 1.30%
Employment insurance or workers compensation
88.4 56.9 64.40% 31.5 35.60% 6.4 7.20% 14.6 16.50% 10.5 11.80%
Social Assistance 325.8 127.5 39.10% 198.4 60.90% 27.7 8.50% 77.5 23.80% 93.2 28.60%
Other or none 322 243 75.50% 79 24.50% 14.5 4.50% 37 11.50% 27.5 8.50%
Appendix C - Prevalence of household food security and insecurity, by selected household characteristics
HOUSEHOLD FOOD INSECURITY IN CANADA, 2014
25
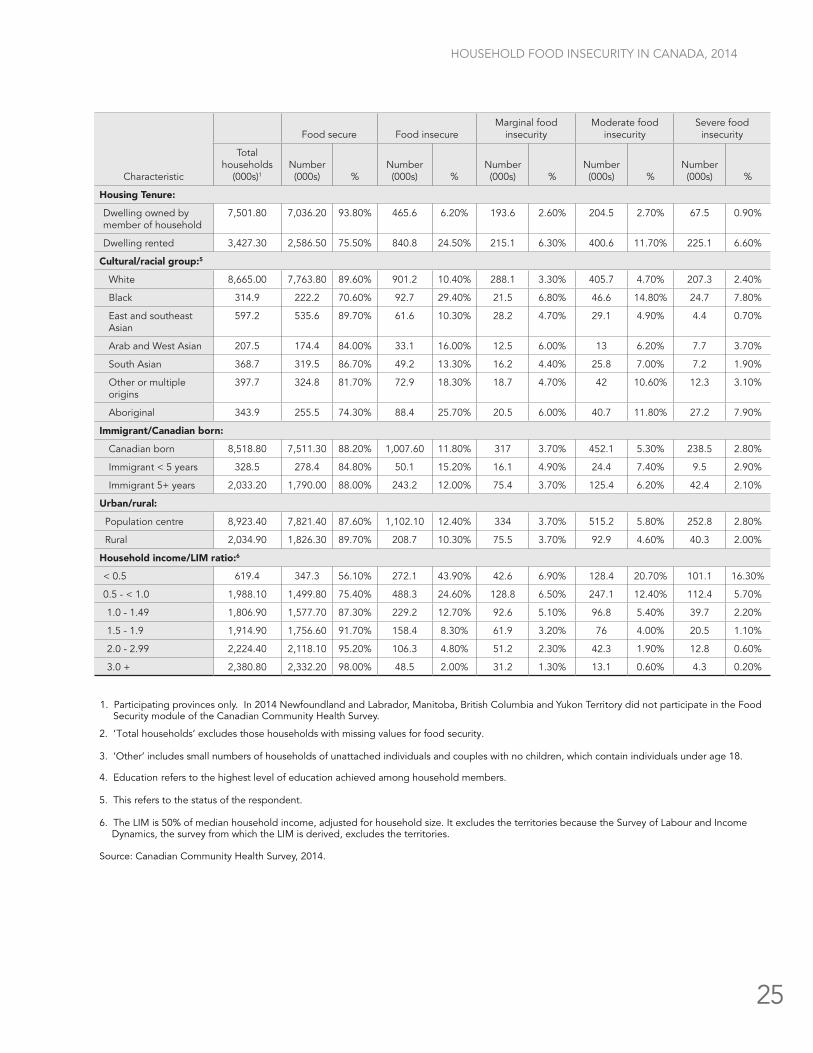
Characteristic
Food secure Food insecureMarginal food
insecurityModerate food
insecuritySevere food
insecurity
Total households
(000s)1Number (000s) %
Number (000s) %
Number (000s) %
Number (000s) %
Number (000s) %
Housing Tenure:
Dwelling owned by member of household
7,501.80 7,036.20 93.80% 465.6 6.20% 193.6 2.60% 204.5 2.70% 67.5 0.90%
Dwelling rented 3,427.30 2,586.50 75.50% 840.8 24.50% 215.1 6.30% 400.6 11.70% 225.1 6.60%
Cultural/racial group:5
White 8,665.00 7,763.80 89.60% 901.2 10.40% 288.1 3.30% 405.7 4.70% 207.3 2.40%
Black 314.9 222.2 70.60% 92.7 29.40% 21.5 6.80% 46.6 14.80% 24.7 7.80%
East and southeast Asian
597.2 535.6 89.70% 61.6 10.30% 28.2 4.70% 29.1 4.90% 4.4 0.70%
Arab and West Asian 207.5 174.4 84.00% 33.1 16.00% 12.5 6.00% 13 6.20% 7.7 3.70%
South Asian 368.7 319.5 86.70% 49.2 13.30% 16.2 4.40% 25.8 7.00% 7.2 1.90%
Other or multiple origins
397.7 324.8 81.70% 72.9 18.30% 18.7 4.70% 42 10.60% 12.3 3.10%
Aboriginal 343.9 255.5 74.30% 88.4 25.70% 20.5 6.00% 40.7 11.80% 27.2 7.90%
Immigrant/Canadian born:
Canadian born 8,518.80 7,511.30 88.20% 1,007.60 11.80% 317 3.70% 452.1 5.30% 238.5 2.80%
Immigrant < 5 years 328.5 278.4 84.80% 50.1 15.20% 16.1 4.90% 24.4 7.40% 9.5 2.90%
Immigrant 5+ years 2,033.20 1,790.00 88.00% 243.2 12.00% 75.4 3.70% 125.4 6.20% 42.4 2.10%
Urban/rural:
Population centre 8,923.40 7,821.40 87.60% 1,102.10 12.40% 334 3.70% 515.2 5.80% 252.8 2.80%
Rural 2,034.90 1,826.30 89.70% 208.7 10.30% 75.5 3.70% 92.9 4.60% 40.3 2.00%
Household income/LIM ratio:6
< 0.5 619.4 347.3 56.10% 272.1 43.90% 42.6 6.90% 128.4 20.70% 101.1 16.30%
0.5 - < 1.0 1,988.10 1,499.80 75.40% 488.3 24.60% 128.8 6.50% 247.1 12.40% 112.4 5.70%
1.0 - 1.49 1,806.90 1,577.70 87.30% 229.2 12.70% 92.6 5.10% 96.8 5.40% 39.7 2.20%
1.5 - 1.9 1,914.90 1,756.60 91.70% 158.4 8.30% 61.9 3.20% 76 4.00% 20.5 1.10%
2.0 - 2.99 2,224.40 2,118.10 95.20% 106.3 4.80% 51.2 2.30% 42.3 1.90% 12.8 0.60%
3.0 + 2,380.80 2,332.20 98.00% 48.5 2.00% 31.2 1.30% 13.1 0.60% 4.3 0.20%
1. Participating provinces only. In 2014 Newfoundland and Labrador, Manitoba, British Columbia and Yukon Territory did not participate in the Food Security module of the Canadian Community Health Survey.
Source: Canadian Community Health Survey, 2014.
2. ‘Total households’ excludes those households with missing values for food security.
4. Education refers to the highest level of education achieved among household members.
5. This refers to the status of the respondent.
6. The LIM is 50% of median household income, adjusted for household size. It excludes the territories because the Survey of Labour and Income Dynamics, the survey from which the LIM is derived, excludes the territories.
3. ‘Other’ includes small numbers of households of unattached individuals and couples with no children, which contain individuals under age 18.
26 PROOFFOOD INSECURITYPOLICY RESEARCH
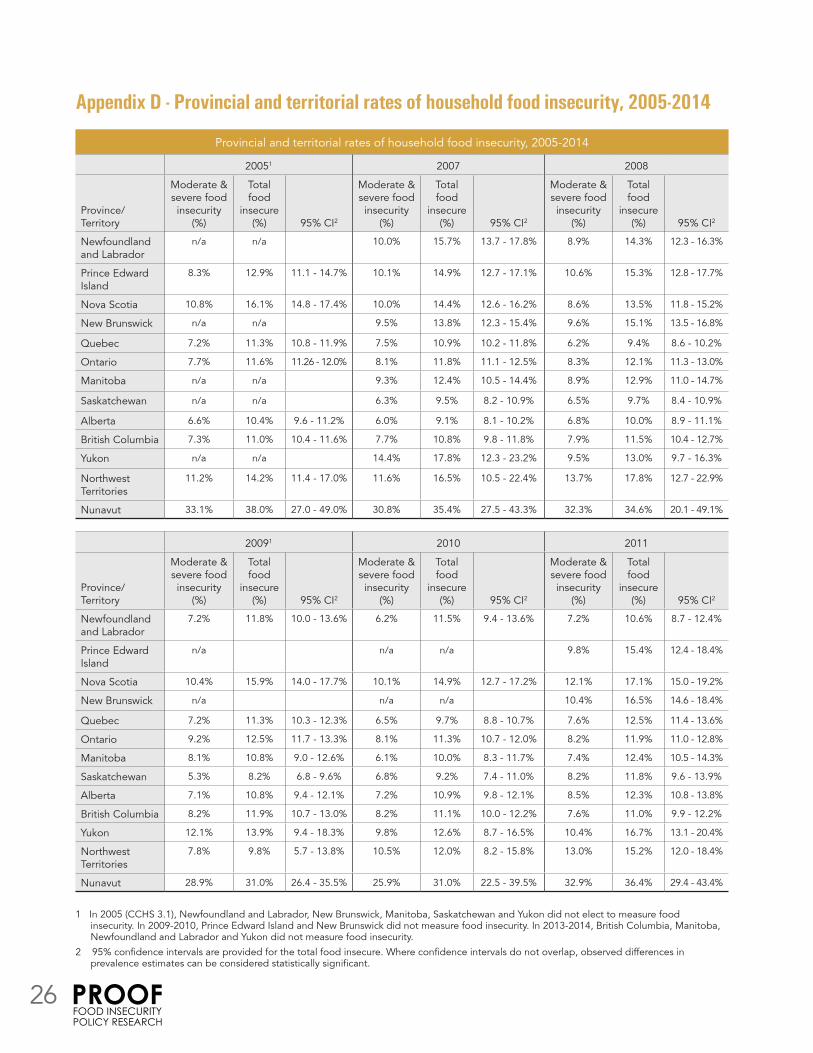
Appendix D - Provincial and territorial rates of household food insecurity, 2005-2014
Provincial and territorial rates of household food insecurity, 2005-2014
20051 2007 2008
Province/ Territory
Moderate & severe food insecurity
(%)
Total food
insecure (%) 95% CI2
Moderate & severe food insecurity
(%)
Total food
insecure (%) 95% CI2
Moderate & severe food insecurity
(%)
Total food
insecure (%) 95% CI2
Newfoundland and Labrador
n/a n/a 10.0% 15.7% 13.7 - 17.8% 8.9% 14.3% 12.3 - 16.3%
Prince Edward Island
8.3% 12.9% 11.1 - 14.7% 10.1% 14.9% 12.7 - 17.1% 10.6% 15.3% 12.8 - 17.7%
Nova Scotia 10.8% 16.1% 14.8 - 17.4% 10.0% 14.4% 12.6 - 16.2% 8.6% 13.5% 11.8 - 15.2%
New Brunswick n/a n/a 9.5% 13.8% 12.3 - 15.4% 9.6% 15.1% 13.5 - 16.8%
Quebec 7.2% 11.3% 10.8 - 11.9% 7.5% 10.9% 10.2 - 11.8% 6.2% 9.4% 8.6 - 10.2%
Ontario 7.7% 11.6% 11.26 - 12.0% 8.1% 11.8% 11.1 - 12.5% 8.3% 12.1% 11.3 - 13.0%
Manitoba n/a n/a 9.3% 12.4% 10.5 - 14.4% 8.9% 12.9% 11.0 - 14.7%
Saskatchewan n/a n/a 6.3% 9.5% 8.2 - 10.9% 6.5% 9.7% 8.4 - 10.9%
Alberta 6.6% 10.4% 9.6 - 11.2% 6.0% 9.1% 8.1 - 10.2% 6.8% 10.0% 8.9 - 11.1%
British Columbia 7.3% 11.0% 10.4 - 11.6% 7.7% 10.8% 9.8 - 11.8% 7.9% 11.5% 10.4 - 12.7%
Yukon n/a n/a 14.4% 17.8% 12.3 - 23.2% 9.5% 13.0% 9.7 - 16.3%
Northwest Territories
11.2% 14.2% 11.4 - 17.0% 11.6% 16.5% 10.5 - 22.4% 13.7% 17.8% 12.7 - 22.9%
Nunavut 33.1% 38.0% 27.0 - 49.0% 30.8% 35.4% 27.5 - 43.3% 32.3% 34.6% 20.1 - 49.1%
20091 2010 2011
Province/ Territory
Moderate & severe food insecurity
(%)
Total food
insecure (%) 95% CI2
Moderate & severe food insecurity
(%)
Total food
insecure (%) 95% CI2
Moderate & severe food insecurity
(%)
Total food
insecure (%) 95% CI2
Newfoundland and Labrador
7.2% 11.8% 10.0 - 13.6% 6.2% 11.5% 9.4 - 13.6% 7.2% 10.6% 8.7 - 12.4%
Prince Edward Island
n/a n/a n/a 9.8% 15.4% 12.4 - 18.4%
Nova Scotia 10.4% 15.9% 14.0 - 17.7% 10.1% 14.9% 12.7 - 17.2% 12.1% 17.1% 15.0 - 19.2%
New Brunswick n/a n/a n/a 10.4% 16.5% 14.6 - 18.4%
Quebec 7.2% 11.3% 10.3 - 12.3% 6.5% 9.7% 8.8 - 10.7% 7.6% 12.5% 11.4 - 13.6%
Ontario 9.2% 12.5% 11.7 - 13.3% 8.1% 11.3% 10.7 - 12.0% 8.2% 11.9% 11.0 - 12.8%
Manitoba 8.1% 10.8% 9.0 - 12.6% 6.1% 10.0% 8.3 - 11.7% 7.4% 12.4% 10.5 - 14.3%
Saskatchewan 5.3% 8.2% 6.8 - 9.6% 6.8% 9.2% 7.4 - 11.0% 8.2% 11.8% 9.6 - 13.9%
Alberta 7.1% 10.8% 9.4 - 12.1% 7.2% 10.9% 9.8 - 12.1% 8.5% 12.3% 10.8 - 13.8%
British Columbia 8.2% 11.9% 10.7 - 13.0% 8.2% 11.1% 10.0 - 12.2% 7.6% 11.0% 9.9 - 12.2%
Yukon 12.1% 13.9% 9.4 - 18.3% 9.8% 12.6% 8.7 - 16.5% 10.4% 16.7% 13.1 - 20.4%
Northwest Territories
7.8% 9.8% 5.7 - 13.8% 10.5% 12.0% 8.2 - 15.8% 13.0% 15.2% 12.0 - 18.4%
Nunavut 28.9% 31.0% 26.4 - 35.5% 25.9% 31.0% 22.5 - 39.5% 32.9% 36.4% 29.4 - 43.4%
1 In 2005 (CCHS 3.1), Newfoundland and Labrador, New Brunswick, Manitoba, Saskatchewan and Yukon did not elect to measure food insecurity. In 2009-2010, Prince Edward Island and New Brunswick did not measure food insecurity. In 2013-2014, British Columbia, Manitoba, Newfoundland and Labrador and Yukon did not measure food insecurity.
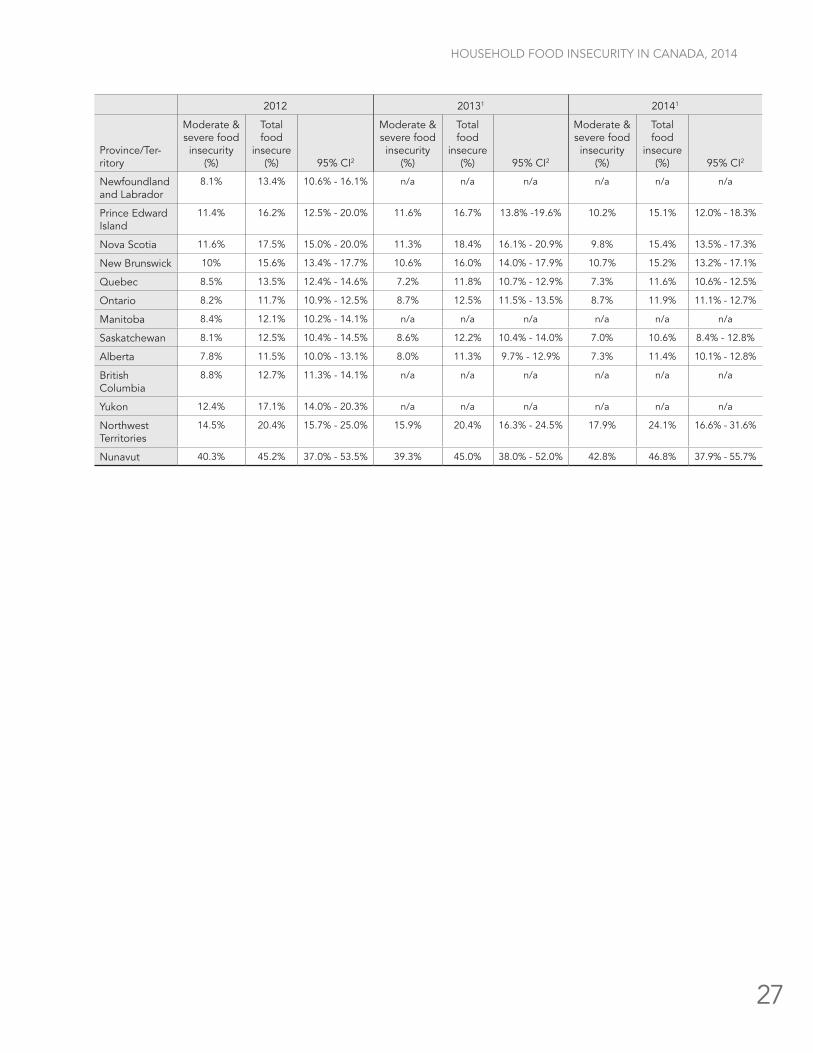
2 95% confidence intervals are provided for the total food insecure. Where confidence intervals do not overlap, observed differences in prevalence estimates can be considered statistically significant.
HOUSEHOLD FOOD INSECURITY IN CANADA, 2014
27
2012 20131 20141
Province/Ter-ritory
Moderate & severe food insecurity
(%)
Total food
insecure (%) 95% CI2
Moderate & severe food insecurity
(%)
Total food
insecure (%) 95% CI2
Moderate & severe food insecurity
(%)
Total food
insecure (%) 95% CI2
Newfoundland and Labrador
8.1% 13.4% 10.6% - 16.1% n/a n/a n/a n/a n/a n/a
Prince Edward Island
11.4% 16.2% 12.5% - 20.0% 11.6% 16.7% 13.8% -19.6% 10.2% 15.1% 12.0% - 18.3%
Nova Scotia 11.6% 17.5% 15.0% - 20.0% 11.3% 18.4% 16.1% - 20.9% 9.8% 15.4% 13.5% - 17.3%
New Brunswick 10% 15.6% 13.4% - 17.7% 10.6% 16.0% 14.0% - 17.9% 10.7% 15.2% 13.2% - 17.1%
Quebec 8.5% 13.5% 12.4% - 14.6% 7.2% 11.8% 10.7% - 12.9% 7.3% 11.6% 10.6% - 12.5%
Ontario 8.2% 11.7% 10.9% - 12.5% 8.7% 12.5% 11.5% - 13.5% 8.7% 11.9% 11.1% - 12.7%
Manitoba 8.4% 12.1% 10.2% - 14.1% n/a n/a n/a n/a n/a n/a
Saskatchewan 8.1% 12.5% 10.4% - 14.5% 8.6% 12.2% 10.4% - 14.0% 7.0% 10.6% 8.4% - 12.8%
Alberta 7.8% 11.5% 10.0% - 13.1% 8.0% 11.3% 9.7% - 12.9% 7.3% 11.4% 10.1% - 12.8%
British Columbia
8.8% 12.7% 11.3% - 14.1% n/a n/a n/a n/a n/a n/a
Yukon 12.4% 17.1% 14.0% - 20.3% n/a n/a n/a n/a n/a n/a
Northwest Territories
14.5% 20.4% 15.7% - 25.0% 15.9% 20.4% 16.3% - 24.5% 17.9% 24.1% 16.6% - 31.6%
Nunavut 40.3% 45.2% 37.0% - 53.5% 39.3% 45.0% 38.0% - 52.0% 42.8% 46.8% 37.9% - 55.7%
28 PROOFFOOD INSECURITYPOLICY RESEARCH
Appendix E - Prevalence of household food insecurity by census metropolitan areas, 2007-2008, 2011-2012 and 2013-2014
Prevalence of household food insecurity by census metropolitan areas1
CMA
2007-2008 2011-2012 2013-2014
(%) 95% CI (%) 95% CI (%) 95% CI
St John's 13.32% 10.9-16.4% 11.10% 8.6- 14.2% - -
Halifax 13.26% 10.9-16.0% 19.94% 16.9-23.3% 15.1% 12.5% - 17.7%
Moncton 15.87% 13.1-19.0% 17.81% 14.7-21.5% 16.3% 12.8% - 19.9%
Saint John 10.24% 7.6-13.8% 14.41% 11.4-18.0% 16.6% 12.6% - 20.6%
Saguenay 9.24% 7.1-12.0% 12.43% 10.0-15.5% 14.2%2 10.7% - 17.8%
Quebec City 10.78% 8.9-13.0% 9.04% 7.2-11.2% 7.3%2 5.5% - 9.2%
Sherbrooke 8.96% 6.6-12.1% 8.61% 6.4-11.5% 10.6%2 7.3% - 13.9%
Trois-Rivieres 11.42% 9.1-14.3% 11.56% 8.6-15.2% 12.4%2 8.8% - 16.0%
Montreal 10.04% 9.2-11.0% 14.75% 13.5-16.1% 12.7%2 11.3% - 14.0%
Ottawa-Gatineau 10.99% 9.5-12.7% 10.29% 8.8-12.0% 10.0%2 8.7% - 11.4%
Kingston 12.12% 9.4-15.3% 10.73%A 7.5-15.1% 14.9% 10.8% - 18.9%
Peterborough 10.08% 7.4-13.8% 15.90% 12.1-20.4% 17.6%A 11.9% - 23.4%
Oshawa 11.06% 8.6-14.2% 13.21% 10.3-16.7% 10.6% 7.8% - 13.4%
Toronto 12.50% 11.4-13.7% 11.96% 10.8-13.2% 12.6% 11.3% - 13.9%
Hamilton 12.40% 10.5-14.6% 9.32% 7.6-11.4% 12.4% 10.1% - 14.8%
St. Catharines-Niagara 12.24% 9.9-15.0% 11.12% 9.0-13.7% 12.9% 9.3% - 16.5%
Kitchener 11.82% 9.6-14.4% 13.93% 11.1-17.3% 10.2% 7.9% - 12.5%
Brantford 14.08% 10.5-18.6% 13.16% 10.4-16.6% 11.7%A 7.7% - 15.6%
Guelph 10.83%A 7.8-14.9% 16.38% 13.2-20.2% 13.2%2 9.8% - 16.7%
London 11.24% 9.3-13.6% 10.41% 8.3-13.0% 14.8% 11.4% - 18.1%
Windsor 14.06% 11.5-17.1% 13.15%A 8.5-19.7% 15.2% 11.7% - 18.7%
Barrie 12.96% 10.1-16.5% 17.37% 13.3-22.3% 13.8% 10.4% - 17.2%
Greater Sudbury 11.25% 9.1-14.1% 9.38% 6.9-12.7% 11.5% 8.6% - 14.4%
Thunder Bay 15.01% 12.6-18.1% 13.93% 10.9-17.7% 14.0% 10.3% - 17.8%
Winnipeg 14.25% 12.3-16.4% 11.51% 9.6-13.8% - -
Regina 11.01% 9.0-13.3% 13.6%A 9.4-19.2% 13.6% 9.8% - 17.4%
Saskatoon 10.74% 8.6-13.4% 12.71% 9.8-16.3% 11.8% 8.3% - 15.4%
Calgary 8.09% 6.8-9.6% 12.07% 10.1-14.4% 11.0% 9.1% - 12.9%
Edmonton 10.58% 9.1-12.2% 13.12% 11.0-15.5% 11.7% 9.6% - 13.8%
Kelowna 11.76%A 7.5-17.9% 14.24%A 10.0-20.0% - -
Abbotsford 8.32% 6.0-11.4% 14.85% 11.0-19.7% - -
Vancouver 10.51% 9.4-11.7% 10.35% 9.1-11.8% - -
Victoria 11.92% 9.8-14.4% 14.03% 11.1-17.6% - -
1. Total households’ excludes those households with missing values for food security.2. Estimates should not be compared to 2007-08 and 2011-12 estimates because they are based on different, non-comparable samples;
the 2013-14 estimates reflect boundaries which were redefined by the 2011 census.
A. Use with caution (coefficient of variation 16.6% to 33.3%)
HOUSEHOLD FOOD INSECURITY IN CANADA, 2014
29
i Please see the Office of Nutrition Policy and Promotion (Health Canada) website at http://www.hc-sc.gc.ca/fn-an/surveill/nutrition/commun/insecurit/index-eng.php.
ii http://www.statcan.gc.ca/pub/82-625-x/2013001/article/11889-eng.htm
iii United Nations Food and Agriculture Organization (1996), Rome Declaration on World Food Security, World Food Summit Plan of Action, paragraph 1, Rome: November 1996. Available at: http://www.fao.org/docrep/003/w3613e/w3613e00.htm, Accessed 3/11/2013
iv McIntyre L, et al. Depression and suicide ideation in late adolescence and early adulthood are an outcome of child hunger. J Affect Disord 2012, http://dx.doi.org/10.1016/j.jad.2012.11.029. Kirkpatrick S, et al. Child hunger and long-term adverse consequences for health. Arch Pediatr Adolesc Med 2010; 164: 754-762.
v Che J, Chen J. Food insecurity in Canadian households. Health Rep 2001; 12: 11-22. Galesloot S, et al. Food insecurity in Canadian adults receiving diabetes care. Can J Diet Prac Res 2012; 73: e261-e266. Gucciardi E, et al. Exploration of the relationship between household food insecurity and diabetes care in Canada. Diabetes Care 2009; 32: 2218-2224. Fuller-Thomson E, Nimigon J. Factors associated with depression among individuals with chronic fatigue syndrome: findings from a nationally representative survey. Fam Pract 2008; 25: 414-422. Muirhead V, et al. Oral health disparities and food insecurity in working poor Canadians. Community Dent Oral Epidemiol 2009; 37: 294-304. Vozoris N, Tarasuk V. Household food insufficiency is associated with poorer health. J Nutr 2003; 133: 120-126. Willows N, et al. Associations between household food insecurity and health outcomes in the Aboriginal population (excluding reserves). Health Rep 2011; 22: 1-6. McLeod L, Veall M. The dynamics of food insecurity and overall health: evidence from the Canadian National Population Health Survey. Applied Economics 2006; 38: 2131-2146.
vi Anema A, et al. Food insecurity and HIV/AIDS: current knowledge, gaps, and research priorities. Current HIV/AIDS Reports 2009; 6: 224-231. Gucciardi E, et al. Exploration of the relationship between household food insecurity and diabetes care in Canada. Diabetes Care 2009; 32: 2218-2224. Marjerrison S, et al. Prevalence and associations of food insecurity in children with diabetes mellitus. J Pediatr 2010. Seligman HK, et al. Food insecurity and glycemic control among low-income patients with type 2 diabetes. Diabetes Care 2012; 35: 233-238.
vii Tarasuk V, et al. Health care costs associated with household food insecurity in Ontario. Can Med Assoc J 2015. http://www.cmaj.ca/content/early/2015/08/10/cmaj.150234. Fitzpatrick T, et al. Looking Beyond Income and Education: Socioeconomic Status Gradients among Future High-Cost Users of Health Care. Am J of Prev Med 2015; 49: 167-171.
viii In 2013, coverage in Nunavut was expanded to represent 92% of the targeted population, up from 71% in the preceding survey years.
ix Nearly half of all First Nations people in Canada live on reserves, and there is a growing effort by Health Canada to collect data for First Nations living on Reserve. See for example, the First Nations Food, Nutrition and Environment Study (FNFNES) which include a food security module. http://www.fnfnes.ca/. For more information about Aboriginal Peoples living in Canada, see http://www12.statcan.gc.ca/nhs-enm/2011/as-sa/99-011-x/99-011-x2011001-eng.cfm.
x See Gaetz S, et al. The State of Homelessness in Canada 2013. Homeless Hub Paper #4. Toronto, ON: Canadian Homelessness Research Network Press, 2013.
xi See Income related Household Food Security in Canada, Canadian Community Health Survey, cycle 2.2, Nutrition (2004) Health Canada, 2007, Cat. H164-42/2007E-PDF, ISBN 978-0-662-45455-7, HC Pub. No. 4696. http://www.hc-sc.gc.ca/fn-an/surveill/nutrition/commun/income_food_sec-sec_alim-eng.php.
xii Marginal food insecurity is not a category used in Health Canada’s publications on this module. Following their classification system, those with a single response are considered food secure. The marginal category is included in this report because of a growing body of literature indicating that households reporting at least some level of uncertainty over their access to food are more vulnerable than those who have affirmed no items on the 18-item questionnaire. Coleman-Jensen, A J. U.S. food insecurity status: toward a refined definition. Soc Indic Res 2010; 95: 215-230.
xiii Statistics Canada, CANSIM, table 051-0001. Last modified: 2015-09-29. http://www.statcan.gc.ca/tables-tableaux/sum-som/l01/cst01/demo02a-eng.htm.
xiv Percentages and numbers provided in this report refer to the total population with complete responses to the food security module. Approximately 4% of households did not have complete responses to the food security module in the 2014 Canadian Community Health Survey, and these households have been excluded.
xv We measure general income adequacy by taking the household income as a ratio of Statistics Canada’s Low Income Measure (LIM). Briefly, to calculate the LIM, household income is adjusted by the equivalent household size (by dividing household income by the square root of the number of household members) and the median over all individuals in the population is taken. The LIM for a single person household is 50% of the median of this adjusted household income. The LIM for households of other sizes are computed by multiplying the single person LIM by the equivalent household size. This figure excludes results for the territories because the Survey of Labour and Income Dynamics, the survey from which the LIM is derived, excludes the territories.
xvi The number of households in the sample whose main source of income is dividends and interest is relatively small. Other research has shown that households whose main source of income is dividends and interest demographically resemble those age 65+ so they have been included in with households whose main source of income is pensions.
xvii Although the Household Food Security Module was included in CCHS 2004, this survey has not been included in our comparison because it is not considered to be comparable to the subsequent annual surveys. See http://www.hc-sc.gc.ca/fn-an/surveill/nutrition/commun/insecurit/prov-ter-2005-eng.php
xviii Sriram U, Tarasuk V. Changes in household food insecurity rates in Canadian metropolitan areas from 2007 to 2012. Can J Pub Health 2015; 106(5): e322-e327.
Endnotes