western region technical attachment no. … 31, 1998 vrishear interpretation raymond kruzdlo ii nwso...
TRANSCRIPT

Introduction
WESTERN REGION TECHNICAL ATTACHMENT NO. 98-12
MARCH 31, 1998
VRISHEAR INTERPRETATION
Raymond Kruzdlo II NWSO San Joaquin Valley - Hanford, CA
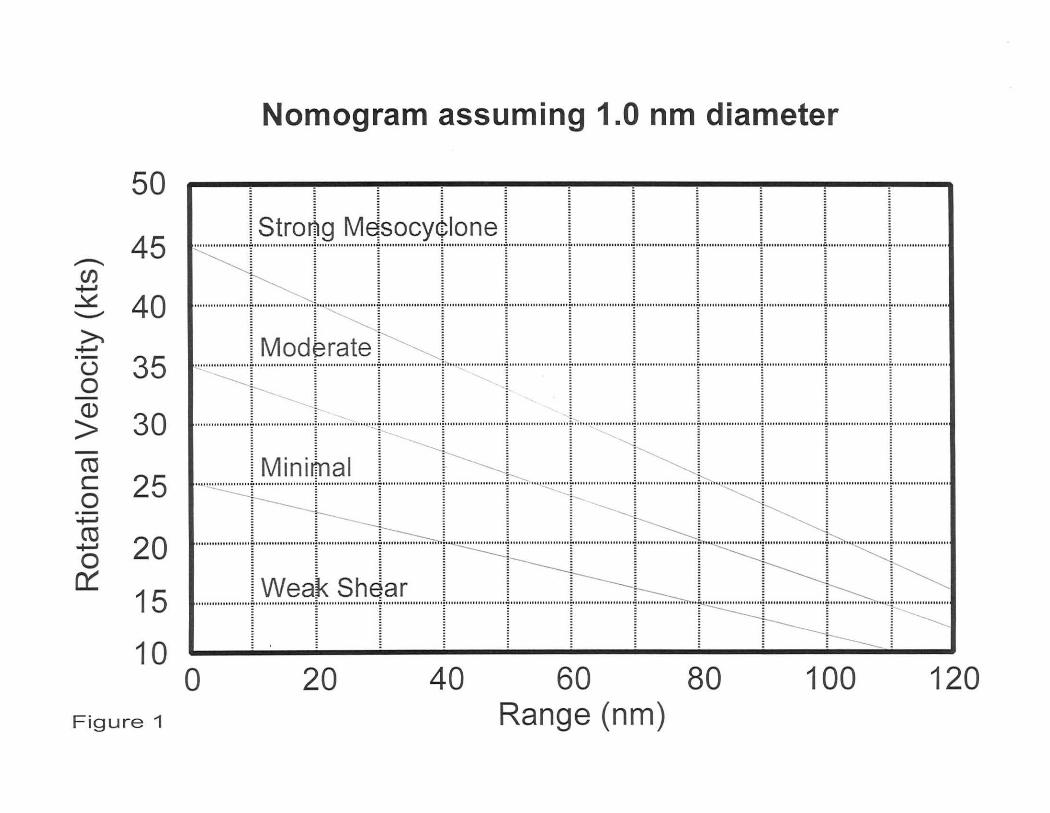
This Technical Attachment discusses the use of a WSR-880 Operational Support Facility (OSF) nomogram, created for mesocyclone recognition , used in conjunction with WSR-880 storm relative velocity (SRV) products. In short, a nomogram is a trace of three coplanar cu rves which are usually straight parallel lines, each graduated for a different variable. In this case, radar-defined variables are used and include weak shear, minimal mesocyclone, moderate mesocyclone, and strong mesocyclone. The nomogramatic method is used as an operational tool to help decipher mesocyclone strength and predict which ones may be tornadic.
Four (three mini-supercell and one supercell) severe weather events from the California Central Valley are used to test the nomogram.
1. 13 May 1995, an FO tornado event located 14nm west southwest of the Fresno Yosemite International Airport.
2. 12 March 1996, an FO tornado event located 2nm northwest of the ROA in Hanford. 3. 22 November 1996, an F1 tornado event within Lemoore NAS located 16nm from
the ROA in Hanford. 4. 20 January 1997, a severe thunderstorm, which produced multiple funnel clouds,
located 25nm to 30nm southeast of the Hanford ROA site. One funnel cloud was observed near the town of Strathmore and another near Exeter.
Background
Several years ago, the OSF devised a nomogram which determines mesocyclone strength. As seen in Fig. 1, four categories of mesocyclone shear strength are depicted. They are defined as weak shear, minimal mesocyclone, moderate mesocyclone, and strong mesocyclone. To use the nomogram, the Vr/shear algorithm is run. From the algorithm results several variables are determined including the diameter of mesocyclone rotation (nm), mesocyclone distance from the ROA sight or range (nm), and mesocyclonic rotational velocity (kts). Using these variables, the mesocyclonic rotational velocities are plotted on the nomogram to determine potential mesocyclone strength.

From OSF results of Midwest supercell events, conclusions state:
1. A severe thunderstorm warning is recommended if a mesocyclone is recognized by the radar.
2. A tornado warning is recommended if a strong mesocyclone is recognized by the radar.
3. Only 30% of all radar defined mesocyclones produce tornadoes. 4. 90% of all radar-defined mesocyclones produce severe weather.
Recently, more and more mesocyclone studies have been submitted to the OSF for research, including studies from east and west coast mini-supercell events. From these events, new nomograms have been developed. The original Midwest nomograms were based on 3.5nm to 5.0nm mesocyclone core diameters, whi le the newer mini-supercell nomog rams assume 1.0nm to 2.0nm core diameters.
Case-Analysis
Mesocyclone/ci rculation parameters for the four events are shown in Table 1.
TABLE 1
Date Event Maximum Range @ maximum Greatest de~th of A~~arent gate VR/shear VR/shear Circu lation (AGL) to-g ate shear
05/13/95 FO tornado 16 kts 29nm 5,627f t -11 ,613ft 21:05- 21 :23UTC 2.4 degree scan 1.5 - 3.4 degree scan
03/12/96 FO tornado 16 kts 06nm 700ft - 1 973ft 22:03- 22:09UTC 2.4 degree scan 0.5 - 2.4 degree scan
11/22/96 F1 tornado 40 kts 14nm No Data No Data
01 /20/97 Funnel cloud 16 k 26nm Only detected by 1.5 00:14UTC 1.5 degree scan degree scan @ 4856ft
Funnel cloud 12 kt 29nm Only detected by 1.5 23:50UTC 1.5 degree scan degree scan @ 5782ft
Using the updated nomograms (Fig . 2) , the 22 November 1996 event closely resembles Midwest guidance, where a tornado warning is recommended if a strong mesocyclone is recognized by radar. The data point (40kts at 14nm) is in the higher values of the moderate category, approaching strong mesocyclone values. The other events, which are more common to the California Central Valley, all fall within the weak shear range. Of most importance, two events, 13 May 1995 and 12 March 1996, were tornadic, but had rotational velocity values of only 16kts. These values , at their respective ranges, fa ll we ll below the strong mesocyclone category and OSF guidance for tornado warn ing issuance. The last event, 20 January 1997, produced multiple funnel clouds. No mesocyclones were defined by the mesocyclone algorithm, but rotational velocity values analyzed by hand were 12kts and 16kts.
2

Since three events , two tornadic and the other non-tornadic, had the same Vr/shear values at about the same range , a comparison was made of the storm relative velocity product. A subtle difference was observed between tornadic and non-tornadic events. In the tornadic events , (13 May 1995 and 12 March 1996), the maximum azimuthal shear resided with in multiple radial pixels adjacent to each other, i.e. , gate-to-gate (Figs. 3 and 4) , whi le the shear of the non-tornadic events of (20 January 1997) did not (Figs. 5 and 6). These results follow the reasoning that, within sampling constra ints , small tornadoes are more like ly to be associated with well-structured and developed gate-to-gate shear.
Conclusions
California Central Valley mini-supercell tornadoes are usually associated with very weak rotational velocities. It was found that these mini-supercells, with approximately 1 nm mesocyclone cores , can be tornadic with Vr/shear values of only 16kts. This value, at a given distance, falls well below OSF recommendations of tornado warn ing issuance. Also, the greatest Vr/shear values and organized storm structure were located by using either the 1.5 or 2.4 elevation slice , depending on distance. Results also indicate that gate-togate shear is important in discriminating between tornadic and non-tornadic circulations as seen on radar. In addition, these types of tornadoes are anticipated to be well -handled by the upcoming Build 10 Tornado Detection Algorithm. However, it is expected that optimal adaptable parameters wi ll need to be determined (see Vasi loff 1996 for a TDA parameter study in Utah).
Acknowledgments
The author is gratefu l to Steve Vasi loff, who reviewed this Technical Attachment and provided consultation. The nomograms used in this study are from the Operational Training Branch of the Operational Support Facility in Norman, Oklahoma.
References
Vasiloff, S. V. , 1996: WSR-880 TVS parameter study. WR TALITE96-11 , NWS WR Homepage.
3
Nomogram assuming 1.0 nm diameter
50
~ 45 en
+-'
6 40 ~
+-' ·-(.) 35 0 -Q)
30 > -co c 25 0 ·-+-' co 20 +-' 0 a:
15
10
! StroQg M~socy¢1one l I _ _ _ _ _ l~l''''"'''''''''''''''l'''''''''''''''''''''l'''''''''"" ' '''''''l'''''''''''" ' '''''' 'l''''''" ''''''''''''''[''''''''''''''"' ' '''l''''' ' '''''"''"'''''f''''''''''"'"'''''"l'''''''''"''''"'''''l''"''''''''''"''''''f''''''"''''''''''''
I I I I I I I I I I .................... , .•••••••.•...••...... l"'''''''~''''''"' ' ''''' ''l'''' ' '' ' '' '''' '' '''' ' 'l ''' '''''''' '' ''''"'''f''''''''''''' ' '''''''l''''''' ' ''' ''''' ' ''''' f''''" ''' '''"''''' '' 'l'''''"''''' '' '''' ' '''l'"''''"''''"'''''''['''''''''"' '' ''''''
1 Mode' rate 1 - 1 1 1 l 1 1 1 1 - - ~- - - - - - - -; . ; ; ~ ~ ; ; ; ; ; ~c·~ ................... '!""'" ............ !" ............. '"f"" ........................... ~ ................................... ' ................................. ""!""""''' ..... "'[" .......... .
OOOOIOIOOIIIIIIIIIII;.IIIIIIIIIIIIOIIIIOIOII:IOIOOOIOIOIOOIIIOOjiii;.OIIIOOIOIIIOOOOIIOIIII:IooOifiiiiiiiiOOIOOOOO.:ooooootoiOII I I OII O IO OO;. OIIOOI OIIIOOIIIOOOIOIMio l ttiiiiOIOIOIIIOIO I I:.I IIII II OIOOOO OOOOOOO OO:ooo o tOO OIII IIO IOI OO IOI;.OIO IOOII OIOIOO OIOIO IIO:.oooooooo ootO IO IIHI I
: : - : : : : : : : : :
~ ~ ~ ~" "-~ ~ ~ ~ ~ ~ ~ ~ ~ M. . ' I ~ ~ ....__ ~ ~ ~ ~ l ~ ~ ~ = 1nnma = = ~ = = ~ = = = ......... ~ ................. T .................. f .............. p ...... ~ ... :r .... ·~:Cj ........ ~1 ....... :J .................. 't' ................ .
.................... ; ................... ... ~.i .. ~···········f······· · ·····"''''"'~'''' ' ''''''''''''''''~"''''''''''"'''''''';-. .. .................. ; ...................... ; :::::.. .. 0.::.::.:.'"'"''~'''''''''''""'''"' 'WeakshJar -!~ I ' ! ~ ,,,,,,,,,,,,,,,,,, .. ;,,,,,,,,,,,,,,,,,,,,,,,:,,,,,,,,,,,,,,,,,,,,,,;,,,,,,,,,,,,,,,,,,,,,,.: ....... ,,,,,,,, ,,,, ,, ,,; ,,,,,,,,,,,,,,,,,,,,,,;,,,,,,,,,,,,,,,,,,,,,,~ ... ~l······················"-·· ··· ······"'''"''';,, , ,,,,,,,,,,,,,,,,,,
- . I ' I I ' I . ~! ~
0 20 40 60 80 100 120 Figure 1 Range (nm)

Nomogram assuming 1.0 nm diameter
50 I : : : : :
~ ~ ~ ~ ~
I Stro~g M~socy~lone I _ _ _ _ _ _ ,,,,,,,,,,.,, ,,,,,,,;.,,, ,,,,,,,,,,,,,,,,,, ,.:,,,,,,,,,,,,,,,, ,,,,,,,;,,,,,,,,,,,,,,,,,,,,,,,:,,,,,,,.,,,,,,,,,,,.,,,;,,,,, ,,.,,,,,,,,,,,,,,,;.,, ,,,,,,.,,,,,,,,,,,,.:,,,,,,,,,,,,,,,,,,,,,.;:. ,,,,,,,,.,,,,,.,,,,,,.:,,,,,,,,, .. ,,,,,,,,,,,;.,,,,,,,,,,,.,,,,,,,,,,;:.,,,,,,,,,,,,,,,,,,,, .... : : : : : : : : : : :
-... ~ ~ ~ ~ ~ ~ ~ ~ ~ ~ -........: : : : : : : : : :
: : : ; ; ; ; ; ; ; .................. 1 ............. ~ ..... , ...... j ..................... i· ................... T .................. r ................... 1 .................. + .................. + ....... ........... , ...................... [ ................ ..
: : : -.........._ : : : : : : : :
; Moderate; -........ ; ; ; ; ; ; ; ;
~::::::::::::::::EC:.::r::::::::::J::::::sr::::::::::::::::::r:::::::::::::::::::t:::::::::::::::::::r::::::::::::::::::r::::::::::::::::::::r::::::::::::::::::: :: ~:: : ~-:::: ; ; ; ; ; ; ; ; ; ; ; : :: ::: ~:::: ; . . ~ ; ;--- ; ; ; ; ; ; ; = M1n1mal = = ------ = = = = = = =
; i"""""""""""l""""'""""'l'"'""' .::l""""""~~""::"""l""""""""""'l"~""""" """'"'"'"'"""""""! =---- =::: -=: :~:: - - - - - -------- - - -: : : : : : : : : : ~ -r----_ ~ ~ ~ ; ~ ; ;___ ; ; ...................... f"""''"'""''''"'';"'" '.!!:: '~''''~"''""'"'"''''""~''"'''"'""""'"~'"''"'"''''"'"""~-.... ~ ........ ;"'""'"'"""""'~'"'""'""'"''''";
Weak Shear ~ ~ - ~ - ~ ~ ~ ~ ~ j
..............•....... ...... ........... .l. ..... ... ,,q,,,,tl ...................... l ...................... l ...................... l ..................... l ...................... l ...................... ! ........ ~.~ ....... l ........ ~ ............ l ......... ~.~ ; .1 I I I I I I ----1-----1 ----
..-..... 45 CJ)
+-' ~ 40 ...._.....
~ +-' ·-() 35 0 -Q)
> 30 -ro c 25 0 ·-+-' ro 20 +-' 0
0::: 15
10 0 20 40 60 80 100 120
Range (nm)
Figure 2 • Tornado Funnel Cloud

5
02 / 10 / 98 02 : 20 REL UEL MAP 56 SRM
124 NM . 54 NM 05 / 13/ 95 21 : 17 RDA : KHN X 36/ 18/ 50N
340 FT 119/ 37/ 51W ELEIJ= 2 . 4 DEG MODE A / 21 CNTR 3150EG 16NM MAX= - 79 KT 55 KT SRM:244DEG 13 KT
NO -50 KT -40 -30 - 22 -10 - 5 -1
0 5 10 22 30 40 50
- RF MAG =8 X FL= 1 COM=1 Ol..I L: t1
AT
POLAR=10 NM 10 DEG
Q15 SRM 0145 R CONNECTION PENDING OED . RPG LINE 1 10/ 0216 ARCHI UE UNIT 1 READ DONE HARDCOPY
RAN 29N t·1 DI 0 . 8NM

1;32 ..1' 10 ..1' 98 03 =0 1 REL VEL MAP 56 SRM
124 NM . 54 NM 03/12..1'96 22=09 ROA=KHN X 36/ 18..r50N
340 FT 119/ 37/ 51W ELEV= 2 . 4 DEG t10DE A / 21 CNTR 2250EG 1NM MAX= -60 KT 82 KT SRM=234DEG 23 KT
NO - 50 KT -40 - 30 -22 -10 -5 -1
0 5 10 22 30 40 50 RF
1 COM=1
POLAR=1 0 NM 10 DEG
Q15 SRM 0 145 R CONNECTION PENDING OED . RPG LINE 1 10 / 0247 ARCHIVE UNIT 1 READ DONE
RAN 6Nt>1 DI 0.9NM

"
(
~~./ ~----, .. /
,mJ!Imm~.. W!I!Jm ~ •• lnllll
R
,,
LC . .~;
,.pi"
-~~~!!!~~- ;
FCH
F'tfRE S NO
• REE
• SEL
• SEQ
--\1 IS
'TLR
~1!1. I ~
• ...
~
·-· . (1 2 / 10/ 98 03 : 17 REL VEL MAP 56 SRM
124 NM .54 NM 01/21/97 00:14 ROA:KHNX 36/ 18/ 50N
340 FT 119/ 37/ 51W ELEV= 1.5 DEG .. ttllo-
•• • .... • ·~· 4~11~n"",~.~ t1 o o E A / 1 1
.. .. . • •
~~ CNTR 1060EG ,, MAX= -75 KT
SRM:2750EG
BNM 52 KT
11 KT NO
-5 0 KT -40 -3 0 -22 - 10 -5 - 1
0 5 10 22 30 40 50
- RF MAG=4 X FL= 1 COM=1 OVL : M
AT
( Hm1E)
G!1 5 SR~1 01 45
10 / 0312 ARCH I VE UNIT 1 READ DONE HAF~D COP \'
R
UR 12KTS RAN 29NM S . 0 06 / S DI 1.2NM

~~ ~CH
.. .. -· -" ~
r / ,./. ,.
/ J>
•1~1~1. ;I'
~ #
.FAT • ,.
• REE
..
• SEQ ,
~ - ...
= \~
,JI: .,..
- ... ........ ....
·~· .· ~ ', .... ,~ ~':~i~f,,~·.;;!
~~ I . ,.~ -... ..u.::~~.. ~ ~ .... -~ ...... •
~ PTU
• P I X
I
1 .JTh,, a •
02 / liil/9 8 03 : 16 REL UEL MAP 56 SRM
124 NM .54 NM 01 / 2 0 / 97 23:50 ROA : KHN X 36/ 18 / 50N
340 FT 119 / 3? / 51W ELEU= 1 . 5 OEG MOD E A / 11 CNTR 112DEG 9NM MA X= -66 KT 48 KT SRM : 274DEG 13 KT
..
NO -50 KT -40 - 30 - 22 -10 - 5 - 1
0 5 10 22 30 40 50 RF
1 COM=1
Q15 SRM 0145 R CONNECTION PENDING OED . RPG LINE 1 10/ 0312 ARCHIVE UNIT 1 READ DON E HARDCOPY
UR lGK TS RA N 26NM S . 007 / S DI 1 . 3 NM