part iii - attachment b - technical report rev 1
TRANSCRIPT

NORTH AUCKLAND AND NORTHLAND GRID
UPGRADE PROJECT
ATTACHMENT B
TECHNICAL REPORT
Revision 1 – May 2008

Attachment B: Technical Report – May 2008 Revision
Grid Upgrade Plan 2007 Instalment 1, Part III – North Auckland and Northland Investment Proposal – May 2008 Revision © Transpower New Zealand Limited 2008. All rights reserved.
2
Executive Summary A number of transmission development options were considered for providing a secure power supply to North Auckland and Northland. This report presents analysis of four options from the preliminary long list of options. These are the options which remained as viable options after a high level analysis of the long list.
With some minor upgrades, the existing transmission system reaches its capacity by 2016 and a major new investment is required to be in place before then. The long list of options included building new transmission assets, upgrading the existing lines, providing generation north of the constriction, distributed generation or load control in the North Auckland-Northland region.
The four options analysed in detail in this report include: • Installing a single new 220 kV cable circuit across Auckland from Penrose to Albany,
with a second circuit installed if and when required; • Upgrading the existing 220 & 110 kV networks by replacing existing conductor with
high temperature conductor of equal dimensions; • Installing a new 220 kV cable circuit from Penrose to Mount Roskill and a 220/110 kV
interconnection at Mount Roskill; • New generation in the area north of Auckland.
Option 1: Single 220 kV cable circuit from Penrose to Albany
This option involves a single 220 kV cable circuit from Penrose to Hobson Street via an existing tunnel, then from Hobson Street to Wairau Road using cable buried along the roading system and attached to the Harbour Bridge, and a section from Wairau Road to Albany mostly buried in a new busway currently under construction.
The new 220 kV cable circuit is assumed to have a capacity of 630 MVA in winter. The cable circuit will include a series reactor to balance power flow north between this circuit and existing overhead lines. A new 220kV cable connection is also installed between Pakuranga and Penrose substation.
The augmented transmission system into Northland is expected to reach its n-1 capacity by 2036,1 requiring an additional 220 kV cable circuit to be installed.
Option 2: High Temperature Conductor
This option includes replacing the conductor on the 220 kV HEN-OTA line and on the 110 kV OTA-MNG-ROS-HEP-HEN lines as n-1 capacity is exceeded. The type of conductor used is assumed to be of similar dimension to the existing conductor to avoid any change in the physical appearance of the lines.
Eventually a new circuit from Penrose to Mount Roskill will be required as the n-1 capacity of the upgraded circuits is exceeded.
Option 3: Single 220 kV cable circuit from Penrose to Mount Roskill
This option involves installing a 220 kV cable from Penrose substation to Mount Roskill substation and initially a single 220/110 kV transformer at Mount Roskill.
The new circuit has a rating of 630 MVA and is approximately 10 km in length. This will be installed before the Henderson-Otahuhu overhead circuit exceeds n-1 capacity, and will increase supply capacity to the Northland region by increasing power flow north on the 110 kV circuits across Auckland. A new 220kV cable connection is also installed between Pakuranga and Penrose substation.
1 Note that the n-1 analysis in this attachment was carried out on the basis of the security criteria set out at section 2.7 of this attachment.

Attachment B: Technical Report – May 2008 Revision
Grid Upgrade Plan 2007 Instalment 1, Part III – North Auckland and Northland Investment Proposal – May 2008 Revision © Transpower New Zealand Limited 2008. All rights reserved.
3
A second interconnecting transformer is installed at Mount Roskill when required to increase power flow north on the 110 kV system. The second transformer increases the 220-110 kV total n-1 transfer capacity and delays further major investment by four more years. Ultimately a cross-harbour cable as in Option 1 will be installed.
Option 4: Installing new generation north of the Auckland
A technical analysis of this option is provided for information only. A discussion on the status of this option is provided in the proposal document.
This option includes installing new generation north of Henderson substation. For the purposes of this work, it is assumed that the new generation is connected into the 220 kV Huapai-Marsden circuit. The maximum amount of reliable generation assumed to be available is 240 MW.
The new generation delays the requirement to reinforce the supply into Northland. The 110 kV system is reinforced as its n-1 capacity is exceeded, by installing a 220 kV Penrose-Mount Roskill circuit and an interconnection at Mount Roskill. Eventually under this option a cross-harbour cable will be installed including new GXP’s at Hobson Street and Wairau Road
Reactive support is planned to meet reactive power losses and ensure voltage stability of the power system. Dynamic reactive power support is planned such that there are sufficient reserves to cover the worst transmission contingency, whether the Ngawha power station new generation (15 MW) is in service or not

Attachment B: Technical Report – May 2008 Revision
Grid Upgrade Plan 2007 Instalment 1, Part III – North Auckland and Northland Investment Proposal – May 2008 Revision © Transpower New Zealand Limited 2008. All rights reserved.
4
Contents
EXECUTIVE SUMMARY.......................................................................................2
1 INTRODUCTION ............................................................................................6
2 EXISTING SYSTEM........................................................................................9
2.1 Transmission .....................................................................................................................................9
2.2 Voltage Support ..............................................................................................................................12
3 ASSUMPTIONS AND METHODOLOGY......................................................13
3.1 General Assumptions......................................................................................................................13
3.2 Demand Forecast ............................................................................................................................13
3.3 Generation .......................................................................................................................................14
3.4 Component Ratings ........................................................................................................................15
3.5 Description of Modelled New Circuits ..........................................................................................15
3.6 Distribution System ........................................................................................................................15
3.7 Security Criteria..............................................................................................................................17
3.8 Planning Horizon ............................................................................................................................17
3.9 Methodology for Analysis...............................................................................................................17
4 COMMON AUGMENTATIONS.....................................................................19
4.1 North Island Grid Upgrade Project ..............................................................................................19
4.2 Other Projects .................................................................................................................................20
4.3 Voltage Support Plan......................................................................................................................21
4.4 Penrose 110 kV Reinforcement......................................................................................................22
5 PROJECT ALTERNATIVES.........................................................................24
5.1 Option 1 – Cross Harbour Cables .................................................................................................25
5.2 Option 2 – High Temperature Conductor ....................................................................................28
5.3 Option 3 – New interconnection at Roskill ...................................................................................31
5.4 Option 4 – New generation north of Auckland.............................................................................34
Attachment B: Technical Report – May 2008 Revision
Grid Upgrade Plan 2007 Instalment 1, Part III – North Auckland and Northland Investment Proposal – May 2008 Revision © Transpower New Zealand Limited 2008. All rights reserved.
5
6 DISCUSSION ON REACTIVE PLANS .........................................................37
6.1 Static Reactive Requirements ........................................................................................................37
6.2 Dynamic Reactive Requirements...................................................................................................37
7 SUMMARY ...................................................................................................41
APPENDIX A – EXISTING CIRCUIT RATINGS .................................................42
APPENDIX B - INTERCONNECTION TRANSFORMER RATINGS...................43
APPENDIX C - PARAMETERS OF NEW COMPONENTS USED......................44
APPENDIX D - SUBSTATION CODES...............................................................46
APPENDIX E - FORECAST LOAD DATA..........................................................48
APPENDIX F - CHARACTERISTIC OF NAAN LOAD........................................49
APPENDIX G - CHARACTERISTIC OF PENROSE LOAD................................50

Attachment B: Technical Report – May 2008 Revision
Grid Upgrade Plan 2007 Instalment 1, Part III – North Auckland and Northland Investment Proposal – May 2008 Revision © Transpower New Zealand Limited 2008. All rights reserved.
6
1 Introduction For the purposes of this report, the North Auckland and Northland (NAaN) region includes the loads at Hepburn and Henderson, and everything north of that. The peak load of this region was about 839 MVA in 2006 and is expected to be in excess of 850 MVA in 2007. The historical average annual increase over the past five years is approximately 3%.
This report describes the technical assessment of alternatives for augmenting the transmission capacity across Auckland and into the NAaN area, to ensure adequate security of supply out to 2039. The results of the analysis are summarised in the form of a timed development plan for each transmission alternative. The timings of the planned transmission developments are based on Electricity Commission’s prudent demand forecast as of August 2007, adjusted by Transpower and as used for the 2008 Annual Planning Report.
The scope of this report is limited to: • steady state analysis of the Auckland and Northland power system to ensure that it
would remain in a satisfactory state following any single credible contingency event occurring on the core grid. This assumes that Ngawha generation is 10 MW, which allows for an outage of 15 MW of Ngawha generation (due to be commissioned).
• analysis of the power transmission system across Auckland and into the NAaN area. It does not address security issues into the Auckland area from the south. For security of supply into Auckland (specifically into Otahuhu and Pakuranga), the analysis assumes the development plans as described in the North Island Grid Upgrade Project (NI GUP) – Amended Proposal, Option 2.
The reactive power support plan is developed to ensure stable operation of the power system. The plan for each development option ensures the set voltage (1.02 pu for this study) can be maintained at each controlled bus, under n-1 conditions, to a demand level of the forecast peak demand in each year. Sufficient dynamic support is planned so that no capacitor switching is required post-contingency.
The reactive plan from Otahuhu south is as developed for the NI GUP, and it is assumed that the voltage at Otahuhu is maintained at 1.02 pu under all contingencies.
Four transmission options were analysed in detail for enhancing the security of supply into the NAaN area as follows:
1. Installing a 220 kV cross-harbour cable, from Penrose to Albany, connecting into new grid exit points (GXPs) along the route at Hobson Street and Wairau Road.
2. Upgrading existing transmission circuits using high temperature conductor, avoiding as far as possible constructing any new lines
3. Installing a new 220 kV cable circuit from Penrose to Mount Roskill with a 220/110 kV interconnection at Mount Roskill. This would be followed by a cross harbour cable as per option 1 but deferred by 10 years.
4. New generation in the Northland region – modelled as being connected into the 220 kV Huapai-Marsden circuit.
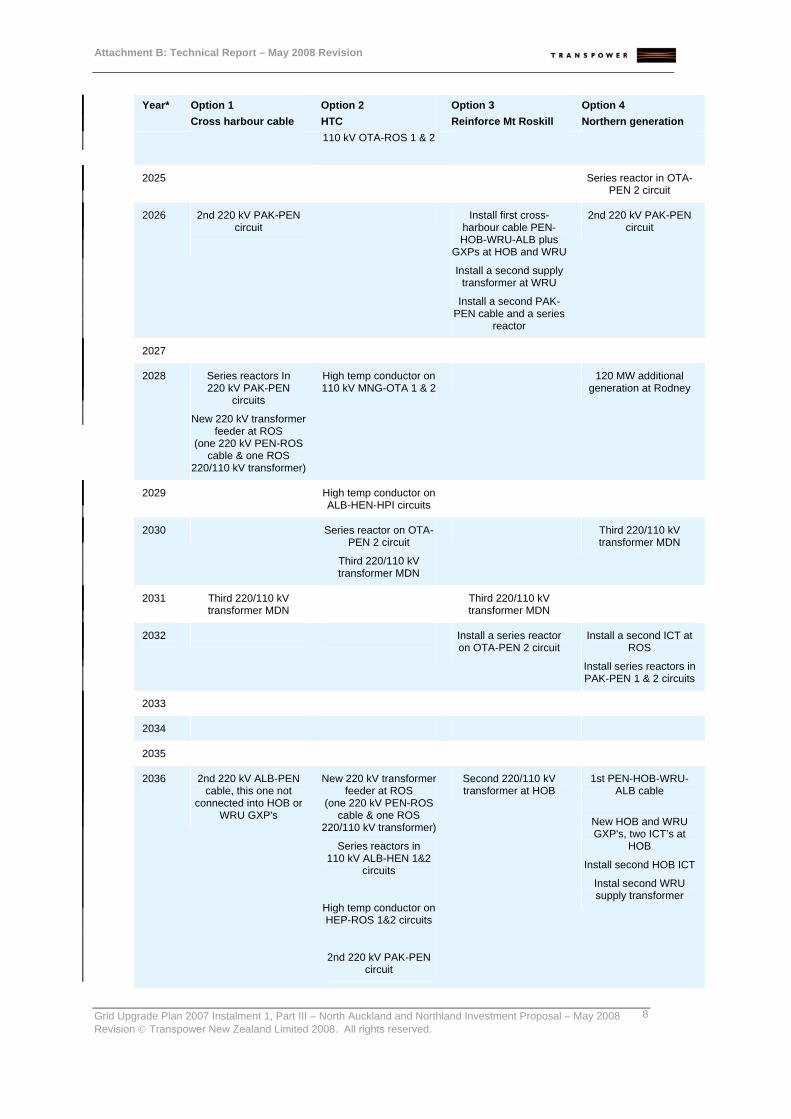
Table 1-1 below summarises the development plans for the four options considered in detail.

Attachment B: Technical Report – May 2008 Revision
Grid Upgrade Plan 2007 Instalment 1, Part III – North Auckland and Northland Investment Proposal – May 2008 Revision © Transpower New Zealand Limited 2008. All rights reserved.
7
Table 1-1 Summary of Development Plans for the Four Preferred Options
Year* Option 1
Cross harbour cable Option 2 HTC
Option 3 Reinforce Mt Roskill
Option 4 Northern generation
2009 2nd 220/110 kV transformer at PEN in parallel with PEN T10
2nd 220/110 kV transformer at PEN in parallel with PEN T10
2nd 220/110 kV transformer at PEN in parallel with PEN T10
2nd 220/110 kV transformer at PEN in parallel with PEN T10
2010
2011
2012
2013
2014
2015
2016 1st PEN-HOB-WRU-ALB cable
New HOB and WRU
GXP's One 220 kV PAK-PEN
circuit
High Temp conductor on 220 kV HEN-OTA
circuits
One 220 kV PAK-PEN circuit
New 220 kV transformer feeder at ROS (one 220 kV PEN-ROS cable) and a ROS
220/110 kV interconnecting
transformer (ICT)
One 220 kV PAK-PEN circuit
One 220 kV PAK-PEN circuit
120 MW new generation at Rodney connected to
220 kV MDN-HPI 1 circuit
2017
2018 Upgrade HEN 220/110 kV
transformers with 2 x 250 MVA 7% units
Replace existing HEN 220/110 kV
transformers with 2 x 250 MVA 7% units
2019 Install a second ICT at ALB
2020 Second 220/110 kV transformer at ALB
Install a second ICT at ALB
New 220 kV transformer feeder at ROS (one
220 kV PEN-ROS cable & one ROS 220/110 kV
transformer)
2021 High Temp conductor on 110 kV MNG-ROS
circuits
Upgrade 200m of ALB-HEN 3 to duplex zebra
conductor
2022 Install a second ICT at ROS
2023 Second 220/110 kV transformer at HOB
One series reactor in the PAK-PEN 1 circuit
2024 2nd supply transformer at WRU
Third 220/110 kV transformer at OTA in parallel with T3 & T5
High temp conductor on
Upgrade HEP-ROS 1 & 2 circuits
Attachment B: Technical Report – May 2008 Revision
Grid Upgrade Plan 2007 Instalment 1, Part III – North Auckland and Northland Investment Proposal – May 2008 Revision © Transpower New Zealand Limited 2008. All rights reserved.
8
Year* Option 1 Cross harbour cable
Option 2 HTC
Option 3 Reinforce Mt Roskill
Option 4 Northern generation
110 kV OTA-ROS 1 & 2
2025 Series reactor in OTA-PEN 2 circuit
2026 2nd 220 kV PAK-PEN circuit
Install first cross-harbour cable PEN-HOB-WRU-ALB plus
GXPs at HOB and WRU
Install a second supply transformer at WRU
Install a second PAK-PEN cable and a series
reactor
2nd 220 kV PAK-PEN circuit
2027
2028 Series reactors In 220 kV PAK-PEN
circuits
New 220 kV transformer feeder at ROS
(one 220 kV PEN-ROS cable & one ROS
220/110 kV transformer)
High temp conductor on 110 kV MNG-OTA 1 & 2
120 MW additional generation at Rodney
2029 High temp conductor on ALB-HEN-HPI circuits
2030 Series reactor on OTA-PEN 2 circuit
Third 220/110 kV transformer MDN
Third 220/110 kV transformer MDN
2031 Third 220/110 kV transformer MDN
Third 220/110 kV transformer MDN
2032
Install a series reactor on OTA-PEN 2 circuit
Install a second ICT at ROS
Install series reactors in PAK-PEN 1 & 2 circuits
2033
2034
2035
2036 2nd 220 kV ALB-PEN cable, this one not
connected into HOB or WRU GXP's
New 220 kV transformer feeder at ROS
(one 220 kV PEN-ROS cable & one ROS
220/110 kV transformer)
Series reactors in 110 kV ALB-HEN 1&2
circuits
High temp conductor on HEP-ROS 1&2 circuits
2nd 220 kV PAK-PEN circuit
Second 220/110 kV transformer at HOB
1st PEN-HOB-WRU-ALB cable
New HOB and WRU GXP's, two ICT’s at
HOB
Install second HOB ICT
Instal second WRU supply transformer

Attachment B: Technical Report – May 2008 Revision
Grid Upgrade Plan 2007 Instalment 1, Part III – North Auckland and Northland Investment Proposal – May 2008 Revision © Transpower New Zealand Limited 2008. All rights reserved.
9
Year* Option 1 Cross harbour cable
Option 2 HTC
Option 3 Reinforce Mt Roskill
Option 4 Northern generation
2037
2038 Upgrade PAK-PEN circuits from 667 MVA to
985 MVA
2039
2040 High temperature conductor on HEN-WEL
1 & 2 circuits
Upgrade PAK-PEN circuits from 667 MVA to
1100 MVA
2nd 220 kV ALB-PEN cable, this one not
connected into HOB or WRU GXP's
* Year in which development is required, e.g. 2013 = development required to be commissioned by winter (May)
of 2013
These four options were short-listed for further detailed analysis because they: • represent different strategic approaches which could potentially improve the supply
security to the NAaN area • are considered to provide similar benefits
Other transmission options that were studied during the preliminary phase, but not short listed are discussed in the document “Assessment of Options”. These options are listed in Table 1-2.
Table 1-2: Options Not Considered Description Type
Deep tunnel Hobson Street – Albany Transmission
Deep tunnel Penrose - Henderson Transmission
Central corridor 110 kV to 220 kV line replacement Transmission
Distributed generation Supply side
Ripple Control Demand side
Huntly – Huapai cables via harbour Transmission
Deep tunnel Hobson Street – Henderson Transmission
HVDC light from Penrose to Albany (two terminal) Transmission
HVDC light Pakuranga – Penrose – Albany (three terminal) Transmission
Huntly – Henderson overhead / underground Transmission
Huntly to Huapai 220 kV double circuit overhead line Transmission
2 Existing System 2.1 Transmission
The transmission system across Auckland supplying the North Auckland and Northland (NAaN) area is composed of two branches:

Attachment B: Technical Report – May 2008 Revision
Grid Upgrade Plan 2007 Instalment 1, Part III – North Auckland and Northland Investment Proposal – May 2008 Revision © Transpower New Zealand Limited 2008. All rights reserved.
10
1. A double circuit 220 kV line from Otahuhu to Henderson, with Southdown power station connected into one of these circuits just north of Otahuhu.
2. Two 110 kV lines from Otahuhu to Mount Roskill (with one double-circuit line going via Mangere) then to Hepburn Road and on to Henderson. This system is presently split for operational reasons between Mount Roskill and Hepburn Road. The split is due to be closed in 2008 following the installation of new secondary equipment.
Figure 2-1: Existing transmission System in the Auckland and Northland Region

Attachment B: Technical Report – May 2008 Revision
Grid Upgrade Plan 2007 Instalment 1, Part III – North Auckland and Northland Investment Proposal – May 2008 Revision © Transpower New Zealand Limited 2008. All rights reserved.
11
Table 2-1 below gives the ratings of the existing circuits supplying the NAaN area, including conductor ratings and limiting components. Refer to Appendix A for a full list of circuit ratings in the NAaN area.
Table 2-1: Existing circuits supplying NAaN area
Circuit Line Conductor V (kV)
Conductor Rating (MVA)
Branch Rating (MVA)
Notes on limiting component
HEN-HEP 1 to 4
HEN-ROS A Simplex Wolf 75oC
110 92/101 92/101
HEN-OTA 1 HEN-OTA A Duplex Zebra 120oC
220 938/985 915/915 Disconnector
HEN-SWN 1 HEN-OTA A Duplex Zebra 120oC
220 938/985 915/915 Disconnector
HEP-ROS 1&2
HEN-ROS A 2 bonded Wolf 75oC
110 184/202 114/114 Disconnector at 114 MVA then single span at 174/191 MVA
MNG-OTA 1&2
MNG-OTA A Duplex Zebra 75oC
110 355/390 305/305 Disconnector
MNG-ROS 1&2
MNG-ROS A Simplex Wolf 75oC
110 92/101 92/101
OTA-ROS 1&2
OTA-PEN B & PEN-ROS A
Simplex Wolf 75oC
110 92/101 92/101
OTA-SWN 1 HEN-OTA A Duplex Zebra 120oC
220 938/985 912/912 Transducer
The capacity of the transmission system into Northland is presently equal to the n-1 capacity of the 220 kV HEN-OTA line. This is a double-circuit line, each circuit being duplex zebra conductor with a temperature rating of 120oC. The resulting n-1 rating is 938/985 MVA summer/winter.
Attachment B: Technical Report – May 2008 Revision
Grid Upgrade Plan 2007 Instalment 1, Part III – North Auckland and Northland Investment Proposal – May 2008 Revision © Transpower New Zealand Limited 2008. All rights reserved.
12
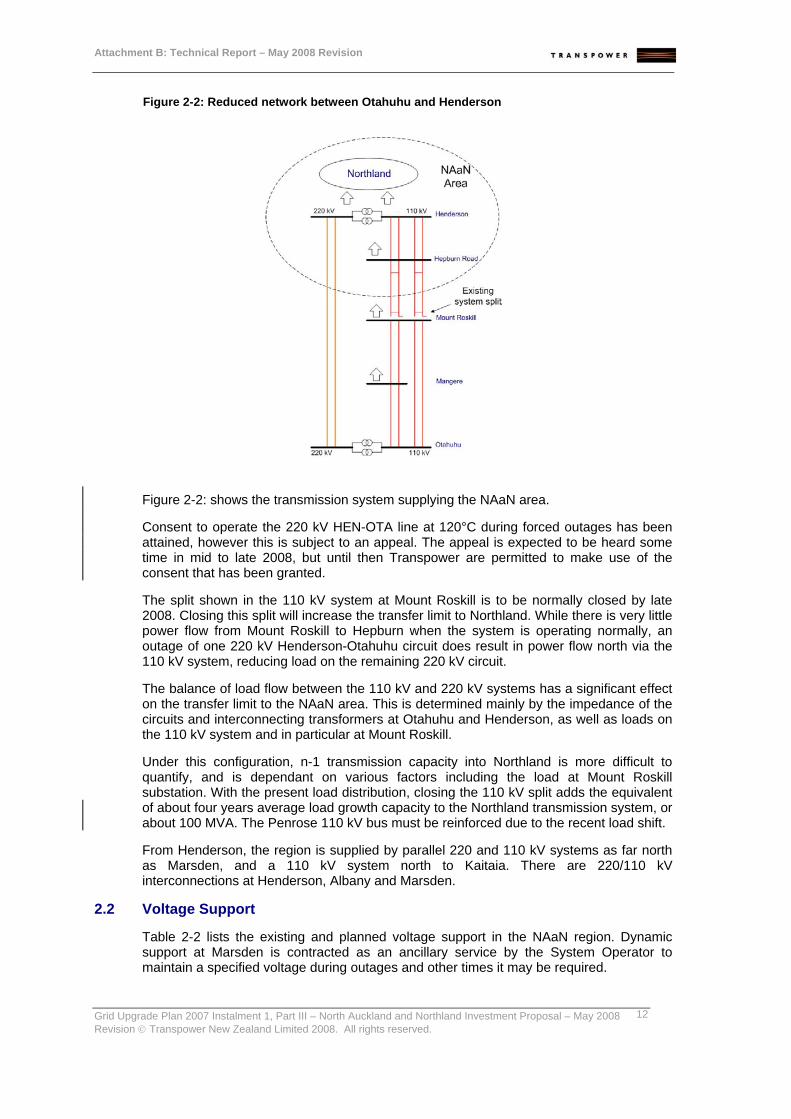
Figure 2-2: Reduced network between Otahuhu and Henderson
Figure 2-2: shows the transmission system supplying the NAaN area.
Consent to operate the 220 kV HEN-OTA line at 120°C during forced outages has been attained, however this is subject to an appeal. The appeal is expected to be heard some time in mid to late 2008, but until then Transpower are permitted to make use of the consent that has been granted.
The split shown in the 110 kV system at Mount Roskill is to be normally closed by late 2008. Closing this split will increase the transfer limit to Northland. While there is very little power flow from Mount Roskill to Hepburn when the system is operating normally, an outage of one 220 kV Henderson-Otahuhu circuit does result in power flow north via the 110 kV system, reducing load on the remaining 220 kV circuit.
The balance of load flow between the 110 kV and 220 kV systems has a significant effect on the transfer limit to the NAaN area. This is determined mainly by the impedance of the circuits and interconnecting transformers at Otahuhu and Henderson, as well as loads on the 110 kV system and in particular at Mount Roskill.
Under this configuration, n-1 transmission capacity into Northland is more difficult to quantify, and is dependant on various factors including the load at Mount Roskill substation. With the present load distribution, closing the 110 kV split adds the equivalent of about four years average load growth capacity to the Northland transmission system, or about 100 MVA. The Penrose 110 kV bus must be reinforced due to the recent load shift.
From Henderson, the region is supplied by parallel 220 and 110 kV systems as far north as Marsden, and a 110 kV system north to Kaitaia. There are 220/110 kV interconnections at Henderson, Albany and Marsden.
2.2 Voltage Support
Table 2-2 lists the existing and planned voltage support in the NAaN region. Dynamic support at Marsden is contracted as an ancillary service by the System Operator to maintain a specified voltage during outages and other times it may be required.

Attachment B: Technical Report – May 2008 Revision
Grid Upgrade Plan 2007 Instalment 1, Part III – North Auckland and Northland Investment Proposal – May 2008 Revision © Transpower New Zealand Limited 2008. All rights reserved.
13
Table 2-2: Planned and Existing Voltage Support in the NAaN Region
Location Size Dynamic/Static
Notes
Kaikohe 20 Mvar S Existing
Albany 110 Mvar S Existing
Henderson 135 Mvar S Existing
Marsden +60/-20 Mvar D Existing
Hepburn 2 x 50 Mvar S Existing
Albany 100 Mvar S Existing
Albany +/- 100 Mvar D Due to be commissioned 2008
Kaitaia 24 Mvar S Committed Project
Henderson +/- 100 Mvar D Seeking approval – may not be at HEN
3 Assumptions and Methodology The following assumptions are made in the technical analysis.
3.1 General Assumptions
Pakuranga substation will be entirely converted to 220 kV by 2011 and there will be two 220 kV OTA-PAK circuits (on the existing OTA-PAK A line). In addition, as part of this conversion; • The 110 kV ARI-PAK 1 circuit will be decommissioned; • The 110 kV PAK-PEN 1 circuit will be decommissioned; and • 110 kV OTA-PAK 1 & 7 circuits will be converted to 220 kV. • The BOB-GLN interconnection is built by 2015.
All system upgrades south of Otahuhu as defined in the North Island Grid Upgrade Project (NI GUP) are common to all of the alternatives and will be modelled as occurring in the year proposed by the NI GUP – Amended Proposal, Option 2. A complete list of common projects is provided in section 4.
All Upper North Island voltage support projects from Otahuhu south are assumed to be as in the Amended NI GUP. For simplicity the analysis assumes the Otahuhu bus voltage remains at 1.02 pu throughout the studies.
Voltage support in the NAaN area will include dynamic support at Henderson, Albany and Marsden, and the 220 kV buses at these substations will be maintained at 1.02 pu voltage.
3.2 Demand Forecast
The load forecast used is based on the EC prudent forecast August 2007, as adjusted by Transpower for use in the 2008 Annual Planning Report.
The graph below shows the load forecast for the NAaN area as used for the technical assessment. It has been assumed that this forecast takes distributed generation into account. See the Appendix for a summary of Northland and Auckland forecast regional load peaks.

Attachment B: Technical Report – May 2008 Revision
Grid Upgrade Plan 2007 Instalment 1, Part III – North Auckland and Northland Investment Proposal – May 2008 Revision © Transpower New Zealand Limited 2008. All rights reserved.
14
Figure 3-1: EC Prudent Demand Forecast for Northland and North Auckland 2010-2040
500
750
1000
1250
1500
1750
2000
2010 2015 2020 2025 2030 2035 2040
Year
MW
As the distribution of loads in the EC forecast does not exactly match the distribution of loads that Transpower use in modelling the system, some rearrangement of loads was required. This is detailed below.
The EC loads LST_110A and LST_110B were combined then split as follows: • 52% to LST_110/ROS • 24% to ROS_KING/1 • 24% to ROS_KING/2
The EC loads PEN_110A and PEN _110B were combined then split as follows: • 56% to LST_110/PEN • 22% to PEN_QUAY/1 • 22% to PEN_QUAY/2
PEN_33A and PEN_33B are regarded as PEN22 and PEN33 respectively.
Total PEN110 load for this study is based on a diversity factor of 81% for loads supplied from this GXP. This is the peak region diversity for these loads as in the draft peak demand forecast used. The Penrose 110 kV load includes: Hobson St (LST/PEN), Liverpool St (LST/ROS), Quay St (PEN/QUAY 1 + 2) and Freemans Bay (25% of diversified ROS_KING total).
3.3 Generation
Ngawha is assumed to be generating at 10 MW out of a total capacity of 25 MW, and 8.7 Mvar voltage support controlling the Ngawha 33 kV bus voltage.

Attachment B: Technical Report – May 2008 Revision
Grid Upgrade Plan 2007 Instalment 1, Part III – North Auckland and Northland Investment Proposal – May 2008 Revision © Transpower New Zealand Limited 2008. All rights reserved.
15
Southdown generating 170 MW with 4 machines, controlling the SWN 220 kV bus voltage at 1.02 pu.
3.4 Component Ratings
a) Percentage loading on transformers refers to the percentage of post-contingency winter rating of the transformer, unless otherwise specified.
b) Loading on circuits is a percentage of the winter conductor rating, unless otherwise specified.
c) For cables, all ratings are assumed to be winter peak capacity, based on typical load profiles. No additional capacity has been assumed for short-term contingencies.
d) For high temperature conductors, the ratings were assumed to be equal to the existing conductor operating at a temperature of 220oC. This approximates the rating of a high temperature conductor that has physical dimensions similar to the existing conductor.
N.B. See Table A-0-1 and Table B-0-1 for a list of line ratings and transformer ratings in the Auckland area. See Table C-0-1 for a list of electrical parameters of the new components used in these studies.
3.5 Description of Modelled New Circuits
PEN-HOB cable • 10.21 km of 1600mm2 trefoil in air (tunnel)
HOB-WRU cable • 1.39 km of 1600mm2 trefoil in air (bridge) • 8.46 km of 2000mm2 trefoil in ducts
WRU-ALB cable • 8.45 km of 2000mm2 trefoil in ducts (busway)
PEN-ROS cable • 10.2 km of 2000mm2 trefoil in ducts
PAK-PEN cable • 8.6 km of 2500mm2 direct buried (forced cooled for upgraded options)
Notes:
1. The 220 kV cross-harbour cables are installed such that the winter cyclical rating for the entire length is 630 MVA.
2. See Table C-0-1 for electrical parameters of new components.
3. The cross sectional areas and ratings provided above are minimums. Installed cross sectional areas (and ratings) may differ from those provided following the detailed design phase of the works.
3.6 Distribution System

Attachment B: Technical Report – May 2008 Revision
Grid Upgrade Plan 2007 Instalment 1, Part III – North Auckland and Northland Investment Proposal – May 2008 Revision © Transpower New Zealand Limited 2008. All rights reserved.
16
Vector’s distribution system in the Greater Auckland area is assumed to be configured as follows: • Freemans Bay load is approximately 25% of the total Kingsland load, and as of 2007
is permanently transferred from Mount Roskill to Hobson Street. • Quay Street load will be transferred from Penrose to Hobson Street if and when a
new grid exit point (GXP) is built there • If no GXP is built at Hobson Street, Quay Street will be supplied via new 110 kV
cables out of Penrose. • The Mount Roskill-Liverpool Street cable will normally be in standby mode and not
supplying load. All Liverpool St load is transferred to PEN110 via the PEN-LST cables.
• Hobson Street will be supplied from Penrose until a new GXP is built at Hobson Street.
• If no GXP is built at Hobson Street, the Hobson Street load will continue to be supplied via existing (and if necessary additional) 110 kV Penrose-Liverpool Street-Hobson Street cables
• Paralleling of the local lines company’s network with Transpower’s network will be allowed until it causes overloading, at which time Vectors network will be split
• If no new GXP is built at Wairau Road, Vector will reinforce the 110 kV supply from Albany as necessary
Two new grid exit points (GXPs) are proposed as part of upgrade options 1, 3 & 4. These are at Vector’s existing zone substation sites of Hobson Street and Wairau Road. The studies have assumed the following: • The first 220 kV cross-harbour cable will be diverted into each new GXP, giving n-1
security. • The Hobson Street GXP will include a single 250 MVA 220/110 kV transformer
initially, with a second added when required to maintain n-1 security of supply. This generally occurs when the Lines Company’s and Transpower’s systems can no longer be operated in parallel.
• The Wairau Road GXP will include a single 250 MVA 220/33 kV transformer initially, paralleled with existing supply transformers on the 33 kV side. When the load exceeds the combined post-contingency rating of the three existing 110/33 kV supply transformers, a second 220/33 kV transformer will be added, and 110/33 kV transformers taken out of service.
Note: Specifications of the actual supply transformers installed will be decided in discussion with the customer.
3.6.1 Configuration of 110 kV system into CBD
Vector presently supply their Liverpool Street 110kV CBD substation from both Penrose (via two 110kV cables) and Mt Roskill (via a single 110kV cable). Due to Vector concerns over security of sub transmission into the CBD, they have decided to reconfigure their 110kV sub transmission network so that Liverpool Street substation is supplied solely from Penrose, i.e. the ROS 110kV cable will be out of service and all of the CBD 110kV load will be supplied out of PEN.
The consequence of this is an overall increase of load on the Transpower 110kV bus at Penrose (equating to about 90MW in 2007).
Penrose 110kV bus is supplied from: • T10 (220/110kV transformer) • 110kV PAK – PEN circuit • 110kV OTA – PEN circuit
Attachment B: Technical Report – May 2008 Revision
Grid Upgrade Plan 2007 Instalment 1, Part III – North Auckland and Northland Investment Proposal – May 2008 Revision © Transpower New Zealand Limited 2008. All rights reserved.
17
Prior to Vector’s shifting of load from ROS, PEN will be in need of reinforcement by 2013, this is independent of the installation of the first cross harbour cable, which coincidentally would also occur in 2013. Following the shifting of Vector’s load from ROS, PEN would require reinforcement in 2009 in order to meet increased demand. This reinforcement would include a new 220/110kV transformer at Penrose.
This work can be deferred by switching the ROS cable back into service in 2009, thereby reducing the 110kV load at PEN. Transpower however assume that the Liverpool Street load is now permanently shifted to the PEN 110kV bus, and will not be shifted back in order to manage load peaks at the Penrose 110 GXP.
3.7 Security Criteria
The analysis was carried out on the basis that committed generation from Ngawha is unavailable. It should be noted that the amount of generation at Ngawha is relatively small compared to the NAaN load, and that therefore this assumption does not have a material impact on the results.
3.7.1 Contingencies
In addition to an outage of the Ngawha generation, the following contingencies were considered to determine the development plans for all the options: • Loss of any single 220 kV or 110 kV transmission circuit from Otahuhu to Marsden; • Loss of one of Vectors 110 kV cable connections between Penrose and Liverpool
Street and Hobson Street • Loss of a 220/110 kV interconnecting transformer (from Otahuhu to Marsden).
3.7.2 Steady State Planning Criteria
The planning criteria used in the studies are as follows: • Transmission lines are limited to 100% of their respective winter or summer rating
with no short term overload capability • Cables are limited to 100% of their cyclic rating with no additional short term overload
capability • Existing transformers are limited to their winter or summer 24hr rating, assuming that
the transformers are cyclically loaded • New 220/110 kV 250 MVA interconnecting transformers are equivalent to the existing
Otahuhu T5 transformer, with the same overload ratio (1.27/1.33 summer/winter) • Loading was rounded to the nearest percentage point and anything loaded to 100%
or more was considered to be overloaded
3.8 Planning Horizon
The analysis extends out 32 years to 2040 as follows: • Every second year from 2008 to 2040 • Other years where necessary to determine the accurate timing of the critical
investments
3.9 Methodology for Analysis
This is a steady-state analysis based on load flow calculations. All the plans developed have assumed winter demand and winter component ratings. This is justified by the significantly winter peaking nature of the NAaN area load (see Figure F-0-1), as well as that of all the GXPs in the Auckland area, including Mangere, Pakuranga and Mount Roskill. Penrose loads are less strongly winter peaking and are described in Appendix G - Characteristic of Penrose Load.
Attachment B: Technical Report – May 2008 Revision
Grid Upgrade Plan 2007 Instalment 1, Part III – North Auckland and Northland Investment Proposal – May 2008 Revision © Transpower New Zealand Limited 2008. All rights reserved.
18
Deterministic grid reliability criteria were assumed for planning the transmission grid. The grid is planned to provide the supply reliability to the loads for an outage of one transmission element together with an outage of a single generating unit in the NAaN area (i.e. n-g-1). The transmission plans developed for all the options satisfy the assumed grid reliability criteria.
Transmission development plans ensure that the system remains stable and the transmission assets remain within their rated capacity for all credible contingencies. Appropriate winter demand and circuit ratings were assumed in determining the loading of the transmission circuits.
Note that summer loadings and ratings were also analysed in order to confirm whether the binding constraints would occur in summer or winter. The analysis shows that even though the ratings of circuits drop in the summer, the nature of the load (refer to appendices F and G) is such that the winter situation remains the most onerous and hence winter ratings and winter peak loads are those that are used in the subsequent analysis.
3.9.1 Reactive Power Support
In planning the reactive power support requirements, outages of the critical transmission components were modelled. Adequate reactive power support ensures that: • acceptable voltages (0.90 pu – 1.1 pu) are maintained at all the 220 kV and 110 kV
buses, and • sufficient reactive reserves are maintained, pre-contingency, in the dynamic reactive
devices (generators, synchronous condensers and SVCs) so that post-contingency switching of capacitors is not required
This analysis has not attempted to optimise the location or the quantity of reactive power support. For the purpose of comparing the transmission options, all the dynamic reactive support is assumed to be located at Henderson, Albany and Marsden. The voltage was maintained at 1.02 pu at all buses that had dynamic support. Switched capacitors at Kaitaia were modelled as an SVC with a 24 Mvar limit. Otahuhu voltage is assumed to remain constant under all contingencies.
3.9.2 Dynamic Analysis
The proposed development plans provide adequate transmission capacity into the NAaN area and maintain steady state voltages within the Electricity Governance Rule limits following a contingency. The plans were developed using steady state analysis (power flow and voltage stability) of the power system.
Transient performance of the connected generators and the loads (especially the motor loads) could affect the stability of the power system following a transmission disturbance and will require more detailed power system simulation.
Past studies2 indicate that additional investment in the form of dynamic reactive power support (e.g. synchronous condensers or SVCs) may be required to ensure power system stability. As the extra dynamic reactive support is mainly dependent on the characteristics of the connected rotating plant, it is assumed that additional reactive power requirements will be similar for all transmission alternatives.
2 NP306 “Auckland Reactive Power Requirements by 2010”, Transpower NZ Ltd, October 2005
Attachment B: Technical Report – May 2008 Revision
Grid Upgrade Plan 2007 Instalment 1, Part III – North Auckland and Northland Investment Proposal – May 2008 Revision © Transpower New Zealand Limited 2008. All rights reserved.
19
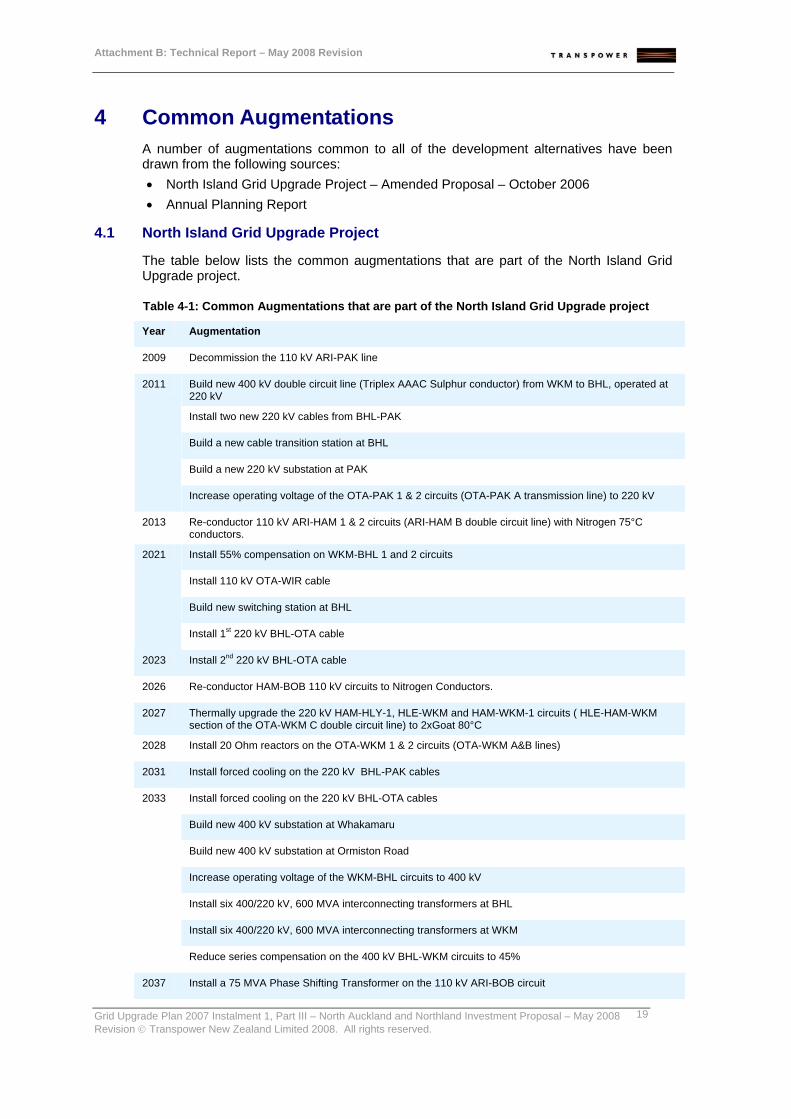
4 Common Augmentations A number of augmentations common to all of the development alternatives have been drawn from the following sources: • North Island Grid Upgrade Project – Amended Proposal – October 2006 • Annual Planning Report
4.1 North Island Grid Upgrade Project
The table below lists the common augmentations that are part of the North Island Grid Upgrade project.
Table 4-1: Common Augmentations that are part of the North Island Grid Upgrade project
Year Augmentation
2009 Decommission the 110 kV ARI-PAK line
Build new 400 kV double circuit line (Triplex AAAC Sulphur conductor) from WKM to BHL, operated at 220 kV
Install two new 220 kV cables from BHL-PAK
Build a new cable transition station at BHL
Build a new 220 kV substation at PAK
2011
Increase operating voltage of the OTA-PAK 1 & 2 circuits (OTA-PAK A transmission line) to 220 kV
2013 Re-conductor 110 kV ARI-HAM 1 & 2 circuits (ARI-HAM B double circuit line) with Nitrogen 75°C conductors.
Install 55% compensation on WKM-BHL 1 and 2 circuits
Install 110 kV OTA-WIR cable
Build new switching station at BHL
2021
Install 1st 220 kV BHL-OTA cable
2023 Install 2nd 220 kV BHL-OTA cable
2026 Re-conductor HAM-BOB 110 kV circuits to Nitrogen Conductors.
2027 Thermally upgrade the 220 kV HAM-HLY-1, HLE-WKM and HAM-WKM-1 circuits ( HLE-HAM-WKM section of the OTA-WKM C double circuit line) to 2xGoat 80°C
2028 Install 20 Ohm reactors on the OTA-WKM 1 & 2 circuits (OTA-WKM A&B lines)
2031 Install forced cooling on the 220 kV BHL-PAK cables
Install forced cooling on the 220 kV BHL-OTA cables
Build new 400 kV substation at Whakamaru
Build new 400 kV substation at Ormiston Road
Increase operating voltage of the WKM-BHL circuits to 400 kV
Install six 400/220 kV, 600 MVA interconnecting transformers at BHL
Install six 400/220 kV, 600 MVA interconnecting transformers at WKM
2033
Reduce series compensation on the 400 kV BHL-WKM circuits to 45%
2037 Install a 75 MVA Phase Shifting Transformer on the 110 kV ARI-BOB circuit
Attachment B: Technical Report – May 2008 Revision
Grid Upgrade Plan 2007 Instalment 1, Part III – North Auckland and Northland Investment Proposal – May 2008 Revision © Transpower New Zealand Limited 2008. All rights reserved.
20
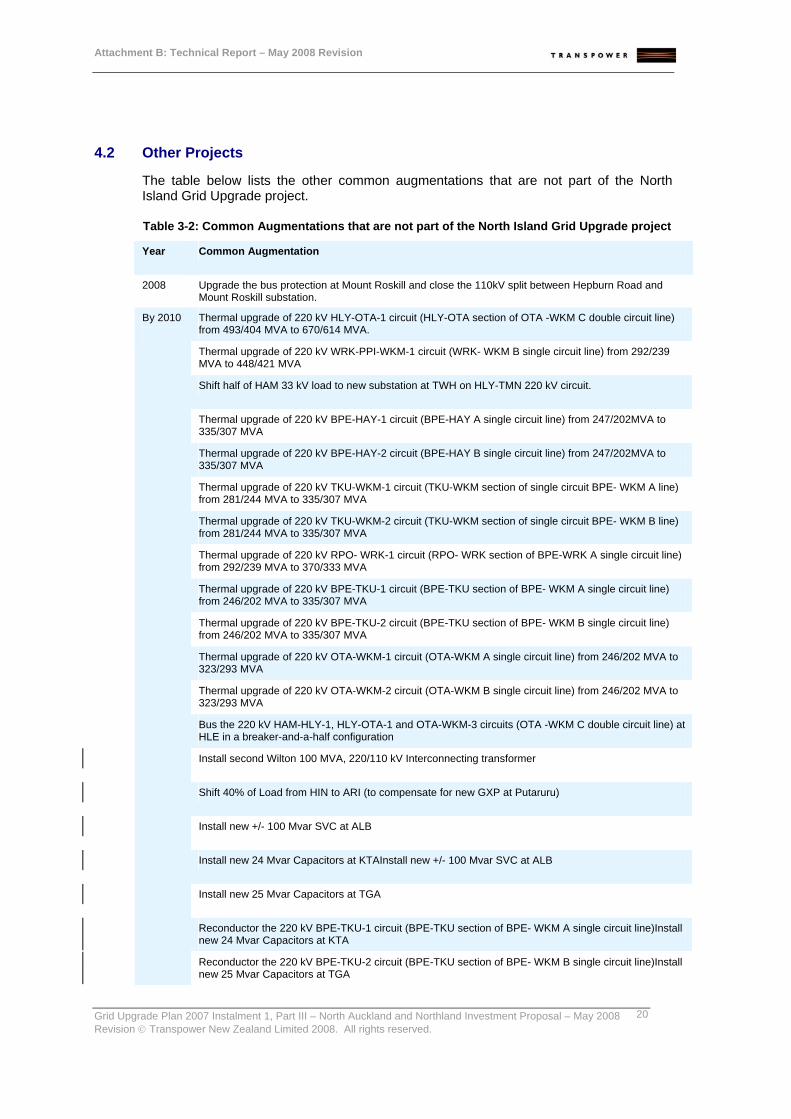
4.2 Other Projects
The table below lists the other common augmentations that are not part of the North Island Grid Upgrade project.
Table 3-2: Common Augmentations that are not part of the North Island Grid Upgrade project
Year Common Augmentation
2008 Upgrade the bus protection at Mount Roskill and close the 110kV split between Hepburn Road and Mount Roskill substation.
Thermal upgrade of 220 kV HLY-OTA-1 circuit (HLY-OTA section of OTA -WKM C double circuit line) from 493/404 MVA to 670/614 MVA.
Thermal upgrade of 220 kV WRK-PPI-WKM-1 circuit (WRK- WKM B single circuit line) from 292/239 MVA to 448/421 MVA
Shift half of HAM 33 kV load to new substation at TWH on HLY-TMN 220 kV circuit.
Thermal upgrade of 220 kV BPE-HAY-1 circuit (BPE-HAY A single circuit line) from 247/202MVA to 335/307 MVA
Thermal upgrade of 220 kV BPE-HAY-2 circuit (BPE-HAY B single circuit line) from 247/202MVA to 335/307 MVA
Thermal upgrade of 220 kV TKU-WKM-1 circuit (TKU-WKM section of single circuit BPE- WKM A line) from 281/244 MVA to 335/307 MVA
Thermal upgrade of 220 kV TKU-WKM-2 circuit (TKU-WKM section of single circuit BPE- WKM B line) from 281/244 MVA to 335/307 MVA
Thermal upgrade of 220 kV RPO- WRK-1 circuit (RPO- WRK section of BPE-WRK A single circuit line) from 292/239 MVA to 370/333 MVA
Thermal upgrade of 220 kV BPE-TKU-1 circuit (BPE-TKU section of BPE- WKM A single circuit line) from 246/202 MVA to 335/307 MVA
Thermal upgrade of 220 kV BPE-TKU-2 circuit (BPE-TKU section of BPE- WKM B single circuit line) from 246/202 MVA to 335/307 MVA
Thermal upgrade of 220 kV OTA-WKM-1 circuit (OTA-WKM A single circuit line) from 246/202 MVA to 323/293 MVA
Thermal upgrade of 220 kV OTA-WKM-2 circuit (OTA-WKM B single circuit line) from 246/202 MVA to 323/293 MVA
Bus the 220 kV HAM-HLY-1, HLY-OTA-1 and OTA-WKM-3 circuits (OTA -WKM C double circuit line) at HLE in a breaker-and-a-half configuration
Install second Wilton 100 MVA, 220/110 kV Interconnecting transformer
Shift 40% of Load from HIN to ARI (to compensate for new GXP at Putaruru)
Install new +/- 100 Mvar SVC at ALB
Install new 24 Mvar Capacitors at KTAInstall new +/- 100 Mvar SVC at ALB
Install new 25 Mvar Capacitors at TGA
Reconductor the 220 kV BPE-TKU-1 circuit (BPE-TKU section of BPE- WKM A single circuit line)Install new 24 Mvar Capacitors at KTA
By 2010
Reconductor the 220 kV BPE-TKU-2 circuit (BPE-TKU section of BPE- WKM B single circuit line)Install new 25 Mvar Capacitors at TGA

Attachment B: Technical Report – May 2008 Revision
Grid Upgrade Plan 2007 Instalment 1, Part III – North Auckland and Northland Investment Proposal – May 2008 Revision © Transpower New Zealand Limited 2008. All rights reserved.
21
Year Common Augmentation
Reconductor the 220 kV TKU-WKM-1 circuit (TKU-WKM section of single circuit BPE- WKM A line)Reconductor the 220 kV BPE-TKU-1 circuit (BPE-TKU section of BPE- WKM A single circuit line)
Reconductor the 220 kV TKU-WKM-2 circuit (TKU-WKM section of single circuit BPE- WKM B line)Reconductor the 220 kV BPE-TKU-2 circuit (BPE-TKU section of BPE- WKM B single circuit line)
Thermal upgrade of 220 kV BPE-TNG-1 and RPO-TNG-1 circuits (BPE-TNG-RPO section of the BPE-WRK A single circuit line)Reconductor the 220 kV TKU-WKM-1 circuit (TKU-WKM section of single circuit BPE- WKM A line)
Reconductor the 220 kV OHK-WRK-1, ATI-OHK-1 and ATI-WKM-1 circuits (WRK-WKM A single circuit line)Reconductor the 220 kV TKU-WKM-2 circuit (TKU-WKM section of single circuit BPE- WKM B line)
Install two new 220/110kV interconnecting transformers at HHI and operate the HHI-TGA-1 circuit at 220kV.Thermal upgrade of 220 kV BPE-TNG-1 and RPO-TNG-1 circuits (BPE-TNG-RPO section of the BPE-WRK A single circuit line)
Build a third 110kV HAM-WHU CircuitReconductor the 220 kV OHK-WRK-1, ATI-OHK-1 and ATI-WKM-1 circuits (WRK-WKM A single circuit line)
Bus the 220 kV HLY-SFD-1 circuit at TMNInstall two new 220/110kV interconnecting transformers at HHI and operate the HHI-TGA-1 circuit at 220kV.
Add BOB Tee (59% from HLY) to 220 kV GLN-HLY circuit and feed BOB via a new 200 MVA, 220/110 kV interconnecting transformer2Build a third 110kV HAM-WHU Circuit
2011
Install a third 200 MVA, 220/110 kV interconnecting transformer ,at TRKBus the 220 kV HLY-SFD-1 circuit at TMN
2014 Reconductor the WRK-PPI-WKM-1 circuit (WRK- WKM B single circuit line)Add BOB Tee (59% from HLY) to 220 kV GLN-HLY circuit and feed BOB via a new 200 MVA, 220/110 kV interconnecting transformer2
Install a third 200 MVA, 220/110 kV interconnecting transformer ,at TRK 2015
Reconductor the WRK-PPI-WKM-1 circuit (WRK- WKM B single circuit line)
The development plan for the common reactive support requirements is shown in Table 4-3. Reactive support specific to each alternative project is provided in section 5.
4.3 Voltage Support Plan
Table 4-3: Voltage Support Common to all Options
YEAR Location Quantity (Mvar)
Static(S) / Dynamic(D)
2008 ALB 100 S
2008 ALB 100 D
2008 KTA 24 S
2009 HEN 100 D
2009 MDN 60 S
2024 KTA 24 S
2024 MPE 30 S
2025 WKO 30 S
2030 MPE 30 S
2033 WKO 30 S

Attachment B: Technical Report – May 2008 Revision
Grid Upgrade Plan 2007 Instalment 1, Part III – North Auckland and Northland Investment Proposal – May 2008 Revision © Transpower New Zealand Limited 2008. All rights reserved.
22
2036 MPE 30 S
2039 HAM 50 S
2039 HAIRINI 100 S
For the purposes of these studies, reactive support at Otahuhu was modelled as a single large SVC of a magnitude no greater than that modelled in the NIGU project.
4.4 Penrose 110 kV Reinforcement
The Liverpool Street load has a forecast 2008 peak of approximately 100 MW. In mid-2007, Vector shifted this load from the Mount Roskill GXP to the Penrose GXP, supplied via the 110 kV PEN-LST cables. Vector now maintain the Mount Roskill-Liverpool Street cable on standby, and will not use this cable to supply load under normal circumstances.
This load shift has an effect on the load flows into the NAaN area, as it removes load from the Mount Roskill GXP, allowing greater capacity for supplying Northland via the 110 kV system. At the same time, the increased load on Penrose and in particular the PEN 110 kV bus, means that the need for reinforcement of this bus is brought forward.
The Penrose and Pakuranga 110 kV loads are supplied from three points; • The Penrose interconnection (PEN T10) • The Otahuhu interconnection (OTA T2 & T4) • The 110 kV ARI-PAK 1 circuit
There is also a 110 kV connection to Bombay but there is virtually no load flow north on this circuit.
In 2009, the ARI-PAK 1 circuit is scheduled to be decommissioned as part of the North Island Grid Upgrade project, leaving the Otahuhu and Penrose interconnecting transformers to supply the Pakuranga and Penrose 110 kV load. By 2009 these interconnecting transformers will not be able to provide sufficient n-1 capacity.
In 2011, the Pakuranga substation will be converted to 220 kV as part of the North Island Grid Upgrade project. This will reduce the 110 kV load in the area (because the PAK 110 kV load is transferred to 220 kV system), but it will also reduce the security of supply into the Penrose 110 kV bus with the removal of the 110 kV PAK-PEN circuit.
Therefore the two issues are: • Not enough n-1 capacity supplying PAK and PEN 110 kV loads from 2009 to 2011 • A loss of n-1 security into PEN110 from 2011
A number of options were investigated to resolve these issues, including • Install another interconnecting transformer at Penrose or Otahuhu • Parallel Vector’s 110 kV network with Transpower’s between Penrose and Mount
Roskill (this will move some of the 110 kV load back to Mt Roskill) • Retain one 110 kV PAK-PEN circuit and either install an interconnecting transformer
at Pakuranga or retain one 110 kV OTA-PAK circuit
The Penrose interconnection option works well if the impedance is chosen to balance flow between the 220 kV and 110 kV OTA-PEN circuits. This will mean that no additional reinforcement will be required prior to the installation of the cross harbour cable until 2016.

Attachment B: Technical Report – May 2008 Revision
Grid Upgrade Plan 2007 Instalment 1, Part III – North Auckland and Northland Investment Proposal – May 2008 Revision © Transpower New Zealand Limited 2008. All rights reserved.
23
The option to parallel the Vector network would require two reactors on the 110 kV cables (approximately 20 Ohm each), which would be redundant once the cross-harbour cable was installed. It would also mean that the Vector assets become part of the transmission network and would require monitoring and control capability for the System Operator.
The option to retain the 110 kV PAK-PEN circuit would require additional interconnecting capacity at Otahuhu initially. Then when Pakuranga is converted to 220 kV, either this interconnector is transferred to Pakuranga or alternatively, one of the existing overhead OTA-PAK circuits can be operated at 220 kV with the other retained at 110 kV. The 110 kV PAK-PEN 1 circuit would be retained, and Penrose 110 kV bus would effectively have another circuit connection to Otahuhu via Pakuranga.
The preferred option is to install a second interconnecting transformer at Penrose, parallel to the existing PEN T10. This is a low cost option that allows the PAK-PEN 1 circuit to be removed and means that two OTA-PAK circuits are available for the 220 kV connection. A suitable Penrose interconnecting transformer would be a 15% impedance, 250 MVA unit.

Attachment B: Technical Report – May 2008 Revision
Grid Upgrade Plan 2007 Instalment 1, Part III – North Auckland and Northland Investment Proposal – May 2008 Revision © Transpower New Zealand Limited 2008. All rights reserved.
24
5 Project Alternatives Four alternatives have been studied to provide comparisons on cost, effectiveness, build ability and operability.
Alternatives considered are as follows:
1. Installing a single 220 kV cross-harbour cable from Penrose to Albany, followed by a second parallel cable as load growth makes this necessary. 220 kV Pakuranga-Penrose circuits are also installed one at a time as necessary to reinforce Penrose.
2. Upgrading the existing 220 kV overhead double-circuit line from Otahuhu to Henderson, including replacing existing conductor with high-temperature conductor (HTC), and upgrading the existing 110 kV transmission system with HTC as required. Assume no new lines are built until all HTC upgrade options have been exhausted.
3. Reinforcing the 110 kV system across Auckland prior to installing the cross-harbour cable. This involves adding an interconnection at Mount Roskill, supplied at 220 kV from Penrose.
4. New generation in the North Isthmus area, connected into the 220 kV HPI-MDN circuit.
The tables below show the system limitations and recommended augmentations based on forecast load growth. The Year column gives the year at which the limitation will first occur. Therefore to avoid the limitation the recommended augmentation would need to be complete before the winter peak of that year
Attachment B: Technical Report – May 2008 Revision
Grid Upgrade Plan 2007 Instalment 1, Part III – North Auckland and Northland Investment Proposal – May 2008 Revision © Transpower New Zealand Limited 2008. All rights reserved.
25
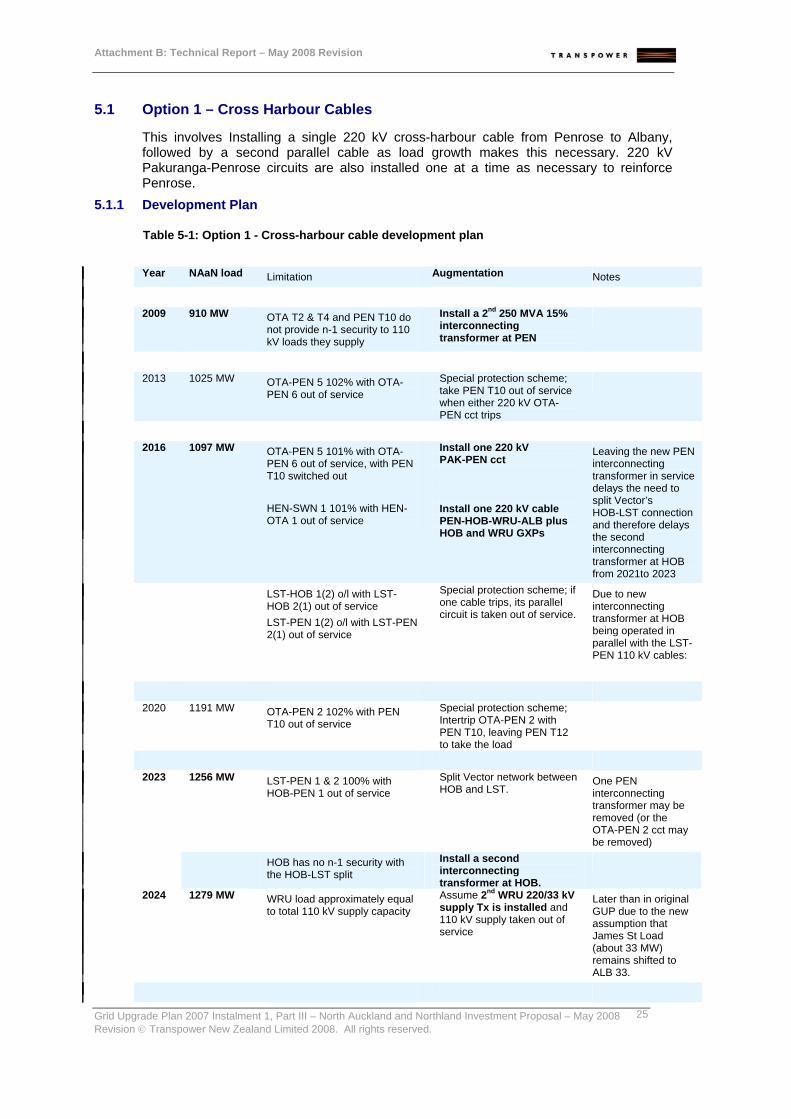
5.1 Option 1 – Cross Harbour Cables
This involves Installing a single 220 kV cross-harbour cable from Penrose to Albany, followed by a second parallel cable as load growth makes this necessary. 220 kV Pakuranga-Penrose circuits are also installed one at a time as necessary to reinforce Penrose.
5.1.1 Development Plan
Table 5-1: Option 1 - Cross-harbour cable development plan
Year NAaN load Limitation Augmentation Notes 2009 910 MW OTA T2 & T4 and PEN T10 do
not provide n-1 security to 110 kV loads they supply
Install a 2nd 250 MVA 15% interconnecting transformer at PEN
2013 1025 MW OTA-PEN 5 102% with OTA-
PEN 6 out of service Special protection scheme; take PEN T10 out of service when either 220 kV OTA-PEN cct trips
2016 1097 MW OTA-PEN 5 101% with OTA-
PEN 6 out of service, with PEN T10 switched out HEN-SWN 1 101% with HEN-OTA 1 out of service
Install one 220 kV PAK-PEN cct Install one 220 kV cable PEN-HOB-WRU-ALB plus HOB and WRU GXPs
Leaving the new PEN interconnecting transformer in service delays the need to split Vector’s HOB-LST connection and therefore delays the second interconnecting transformer at HOB from 2021to 2023
LST-HOB 1(2) o/l with LST-HOB 2(1) out of service LST-PEN 1(2) o/l with LST-PEN 2(1) out of service
Special protection scheme; if one cable trips, its parallel circuit is taken out of service.
Due to new interconnecting transformer at HOB being operated in parallel with the LST-PEN 110 kV cables:
2020 1191 MW OTA-PEN 2 102% with PEN
T10 out of service Special protection scheme; Intertrip OTA-PEN 2 with PEN T10, leaving PEN T12 to take the load
1256 MW LST-PEN 1 & 2 100% with
HOB-PEN 1 out of service Split Vector network between HOB and LST.
One PEN interconnecting transformer may be removed (or the OTA-PEN 2 cct may be removed)
2023
HOB has no n-1 security with the HOB-LST split
Install a second interconnecting transformer at HOB.
2024 1279 MW WRU load approximately equal to total 110 kV supply capacity
Assume 2nd WRU 220/33 kV supply Tx is installed and 110 kV supply taken out of service
Later than in original GUP due to the new assumption that James St Load (about 33 MW) remains shifted to ALB 33.
Attachment B: Technical Report – May 2008 Revision
Grid Upgrade Plan 2007 Instalment 1, Part III – North Auckland and Northland Investment Proposal – May 2008 Revision © Transpower New Zealand Limited 2008. All rights reserved.
26
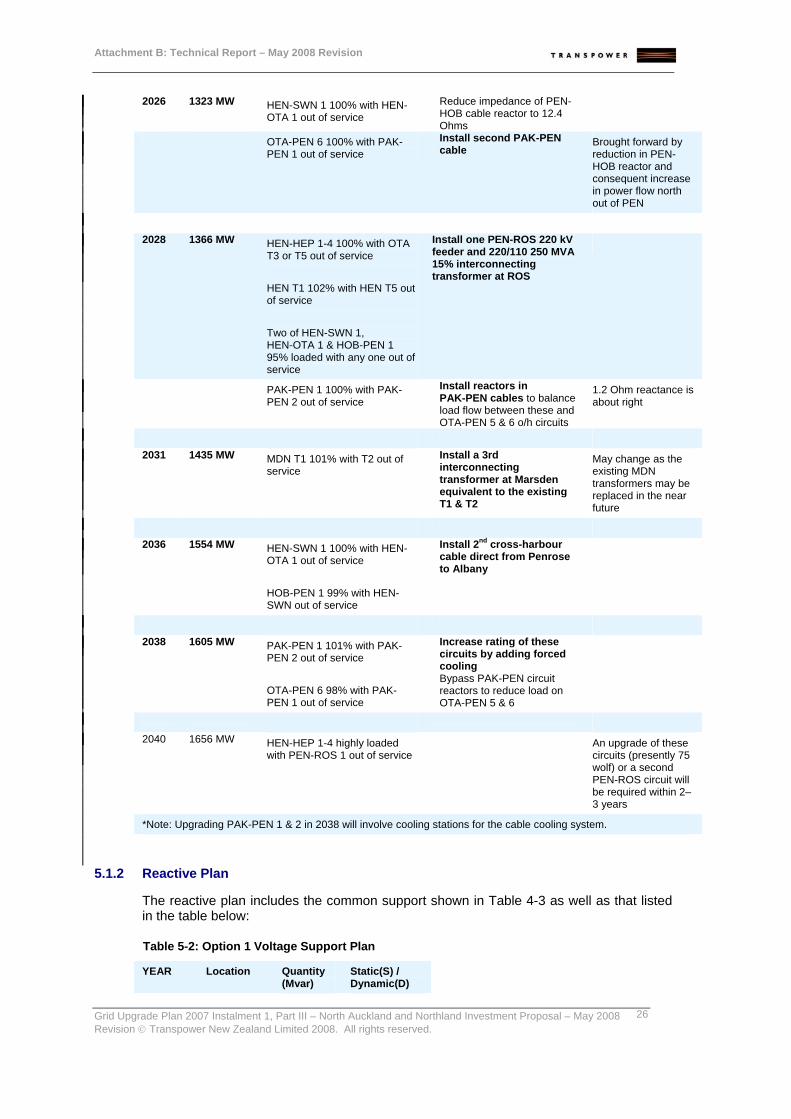
2026 1323 MW HEN-SWN 1 100% with HEN-OTA 1 out of service
Reduce impedance of PEN-HOB cable reactor to 12.4 Ohms
OTA-PEN 6 100% with PAK-PEN 1 out of service
Install second PAK-PEN cable
Brought forward by reduction in PEN-HOB reactor and consequent increase in power flow north out of PEN
2028 1366 MW HEN-HEP 1-4 100% with OTA
T3 or T5 out of service HEN T1 102% with HEN T5 out of service Two of HEN-SWN 1, HEN-OTA 1 & HOB-PEN 1 95% loaded with any one out of service
Install one PEN-ROS 220 kV feeder and 220/110 250 MVA 15% interconnecting transformer at ROS
PAK-PEN 1 100% with PAK-PEN 2 out of service
Install reactors in PAK-PEN cables to balance load flow between these and OTA-PEN 5 & 6 o/h circuits
1.2 Ohm reactance is about right
2031 1435 MW MDN T1 101% with T2 out of
service Install a 3rd interconnecting transformer at Marsden equivalent to the existing T1 & T2
May change as the existing MDN transformers may be replaced in the near future
2036 1554 MW HEN-SWN 1 100% with HEN-
OTA 1 out of service HOB-PEN 1 99% with HEN-SWN out of service
Install 2nd cross-harbour cable direct from Penrose to Albany
2038 1605 MW PAK-PEN 1 101% with PAK-
PEN 2 out of service OTA-PEN 6 98% with PAK-PEN 1 out of service
Increase rating of these circuits by adding forced cooling Bypass PAK-PEN circuit reactors to reduce load on OTA-PEN 5 & 6
2040 1656 MW HEN-HEP 1-4 highly loaded
with PEN-ROS 1 out of service An upgrade of these
circuits (presently 75 wolf) or a second PEN-ROS circuit will be required within 2–3 years
*Note: Upgrading PAK-PEN 1 & 2 in 2038 will involve cooling stations for the cable cooling system.
5.1.2 Reactive Plan
The reactive plan includes the common support shown in Table 4-3 as well as that listed in the table below:
Table 5-2: Option 1 Voltage Support Plan
YEAR Location Quantity (Mvar)
Static(S) / Dynamic(D)

Attachment B: Technical Report – May 2008 Revision
Grid Upgrade Plan 2007 Instalment 1, Part III – North Auckland and Northland Investment Proposal – May 2008 Revision © Transpower New Zealand Limited 2008. All rights reserved.
27
2022 HEN 50 S
2028 ALB 100 S
2034 HEN 50 S
5.1.3 Single Line Diagram
Figure 5-1: Option 1 - Development Plan Single Line Diagram

Attachment B: Technical Report – May 2008 Revision
Grid Upgrade Plan 2007 Instalment 1, Part III – North Auckland and Northland Investment Proposal – May 2008 Revision © Transpower New Zealand Limited 2008. All rights reserved.
28
5.2 Option 2 – High Temperature Conductor
This option involves upgrading the existing 220 kV overhead double-circuit line from Otahuhu to Henderson, including replacing existing conductor with high-temperature conductor (HTC), and upgrading the existing 110 kV transmission system with HTC as required. Assume no new lines are built until all HTC upgrade options have been exhausted.
5.2.1 Development Plan
Table 5-3: High Temperature conductor development plan Year NAaN load Limitation Augmentation Notes 2009 910 MW OTA T2 & T4 & PEN T10 do
not provide n-1 security to 110 kV loads they supply
Install a 2nd 250 MVA 15% interconnecting transformer at PEN
2013 1025 MW OTA-PEN 5 102% with OTA-
PEN 6 out of service Special protection scheme; take PEN T10 out of service when either 220 kV OTA-PEN circuit trips
2016 1097 MW OTA-PEN 5 101% with OTA-
PEN 6 out of service, after PEN T10 is switched out HEN-SWN 1 101% with HEN-OTA 1 out of service
Install one 220 kV PAK-PEN circuit High temperature conductor on HEN-OTA circuits
2018 1144 MW HEN T1 100% with HEN T5
out of service Replace HEN transformers with two 250 MVA 7% interconnecting transformers
2020 1191 MW ALB-HEN 1 & 2 102% with ALB T4 out of service
Install a second interconnecting transformer at ALB equal to existing
2021 1213 MW MNG-ROS 1&2 101% with
HEN-SWN 1 out of service ALB-HEN 3 100% with HEN-HPI 1 out of service
Upgrade MNG-ROS circuits to high temperature conductor Upgrade terminal spans to duplex zebra conductor
2024 1279 MW OTA T5 101% with T3 out of
service HEN-WEL 1 & 2 101% with HPI-MDN 1 out of service
Install a third interconnecting transformer at OTA in parallel with and equivalent to T5 Thermal upgrade of HEN-WEL 1 & 2 from 50oC Coyote to 75oC coyote
OTA-ROS 1 & 2 108% with HEN-OTA 1 out of service
High temperature conductor on OTA-ROS circuits
Brought forward by the lower impedance at OTA due to 3rd interconnecting transformer
2025 1301 MW OTA-PEN 2 100% with PEN
T10 out of service Special protection scheme: Trip OTA-PEN 2 with PEN T10
2028 1366 MW MNG-OTA 1 100% with MNG-
OTA 2 out of service High temperature conductor on the MNG-OTA 1 & 2 circuits
2029 1388 MW HEN-HPI 1 100% with ALB- Upgrade HEN-HPI 1 to

Attachment B: Technical Report – May 2008 Revision
Grid Upgrade Plan 2007 Instalment 1, Part III – North Auckland and Northland Investment Proposal – May 2008 Revision © Transpower New Zealand Limited 2008. All rights reserved.
29
HEN 3 out of service high temperature conductor
2030 1411 MW MDN T1 101% with T2 out of
service PEN T12 100% with PEN T10 & OTA-PEN 2 out of service (Special protection scheme)
Install a 3rd interconnecting transformer at Marsden equivalent to the existing
Assume by now PEN T10 has been replaced due to condition with 15% 250 MVA interconnecting transformer. Install reactor on OTA-PEN 2 to balance load flow into PEN110
Pen T10 is 1972, nearly 60 yrs old by this time. If this is not the case, increase T10 impedance with a reactor
2032 1458 MW ALB-HEN 3 100% with HEN-
HPI 1 out of service OTA T4 101% with T2 out of service
High temperature conductor on ALB-HEN 3 Special protection scheme – trip T2 & T4 together. PEN interconnecting transformers take the load
Likely do this at same time as HEN-HPI 1
2036 1554 MW HEN-SWN 1 100% with HEN-
OTA 1 out of service ALB-HEN 1&2 100% with HEN-HPI 1 out of service
Install PEN-ROS cable and 250 MVA interconnecting transformer at ROS Install 10 Ohm reactors in ALB-HEN 1&2 circuits
PAK-PEN 1 overloads for various outages due to installation of new PEN-ROS circuit HEP-ROS 1&2 overload with HEN-SWN 1 out of service due to new PEN-ROS circuit
Install 2nd 220 kV PAK-PEN circuit Upgrade HEP-ROS circuits to high temperature conductor
2039 1631 MW HEN-WEL 1&2 100% with
HPI-MDN 1 out of service High temperature conductors on HEN-WEL 1 & 2
2040 ALB-HPI 1 101% with ALB-
HEN 3 out of service HEN-OTA 1 96% with HEN-SWN 1 out of service
Upgrade ALB-HPI 1 to high temperature conductor
Likely done at same time as HEN-HPI 1 First ALB-PEN cable will be required within about 2 years
5.2.2 Reactive Plan
The reactive plan includes the common reactive plant shown in table 4-3 well as the reactive plant support listed in the table below.
Table 5-4: Option 2 Voltage Support Plan
YEAR Location Quantity (Mvar)
Static(S) / Dynamic(D)
2016 ALB 50 S
2016 HEN 100 S
2024 ALB 50 S
2026 HEN 100 S
2030 ALB 50 S
2038 ALB 50 S
Attachment B: Technical Report – May 2008 Revision
Grid Upgrade Plan 2007 Instalment 1, Part III – North Auckland and Northland Investment Proposal – May 2008 Revision © Transpower New Zealand Limited 2008. All rights reserved.
30
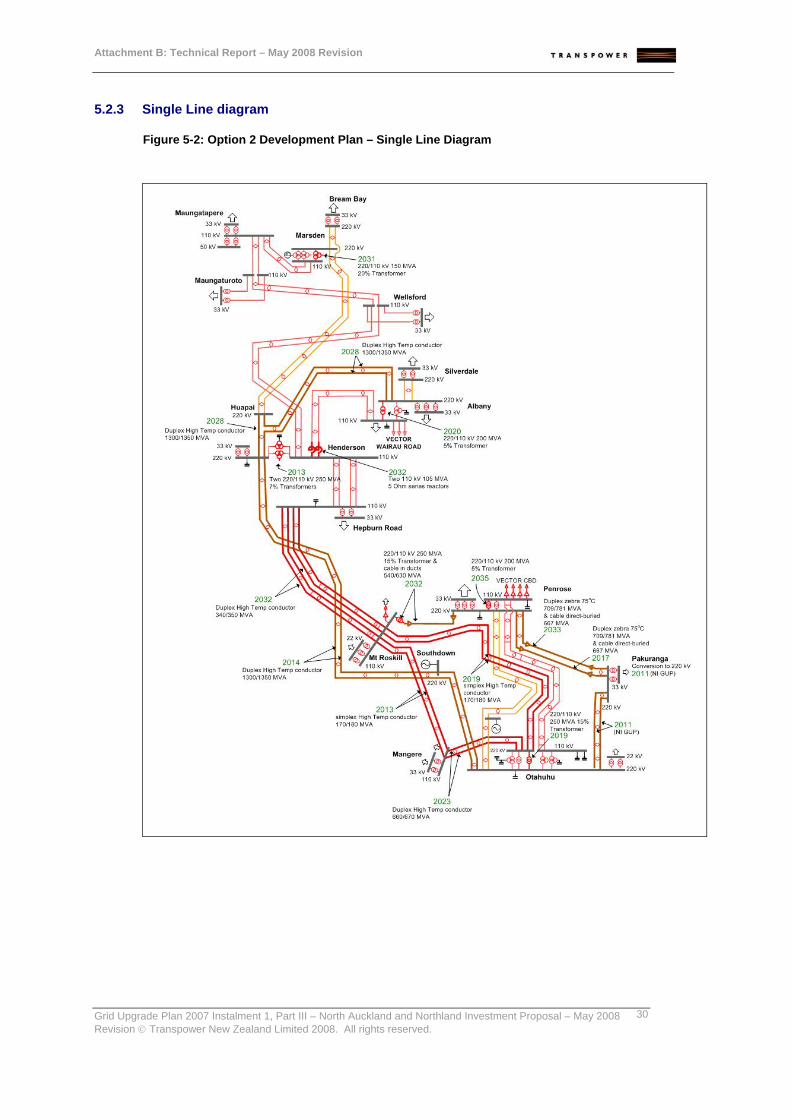
5.2.3 Single Line diagram
Figure 5-2: Option 2 Development Plan – Single Line Diagram

Attachment B: Technical Report – May 2008 Revision
Grid Upgrade Plan 2007 Instalment 1, Part III – North Auckland and Northland Investment Proposal – May 2008 Revision © Transpower New Zealand Limited 2008. All rights reserved.
31
5.3 Option 3 – New interconnection at Roskill
This option involves reinforcing the 110 kV system across Auckland prior to installing the cross-harbour cable. This involves adding an interconnection at Mount Roskill, supplied at 220 kV from Penrose.
5.3.1 Development Plan
Table 5-5: New Interconnection at Roskill
Year NAaN load Limitation Augmentation Notes 2009 910 MW OTA-PEN 5 (6) exceeds
branch capacity when cct 6 (5) is out of service OTA T2 & T4 & PEN T10 do not provide n-1 security to 110 kV loads they supply
Remove branch restriction Install a 2nd 250 MVA 15% interconnecting transformer at PEN
2013 1025 MW OTA-PEN 5 102% with OTA-
PEN 6 out of service Special protection scheme; take PEN T10 out of service when either 220 kV OTA-PEN cct trips
2016 1097 MW OTA-PEN 5 101% with OTA-
PEN 6 out of service, with PEN T10 switched out HEN-SWN 1 101% with HEN-OTA 1 out of service
Install one 220 kV PAK-PEN cable Install PEN-ROS cable and 250 MVA interconnecting transformer at ROS
2020 1191 MW ALB-HEN 1 & 2 101% with
ALB T4 out of service Install 2nd interconnecting transformer at ALB, equivalent to ALB T4
2022 1234 MW HEN-SWN 1 100% with HEN-
OTA 1 out of service Install 2nd interconnecting transformer at ROS
HEP-ROS 2 101% with HEN-OTA 1 out of service
Upgrade a single span to get the full capacity of the existing HEP-ROS 1&2 circuits (184/202 MVA)
2023 1256 MW PAK-PEN 1 101% with OTA-
PEN 6 out of service Install a series reactor (1.2 Ohm) in this circuit to balance flow between this and OTA-PEN 5&6
Balancing the power flow delays the cable installation work for ~3 yrs, until the cross harbour cable is installed
2024 1279 MW HEP-ROS 2 102% with HEN-
SWN 1 out of service Upgrade HEP-ROS 1 & 2 from 75oC wolf to 90oC wolf
This delays need for cross-harbour by about 2 years
2026 1323 MW HEN-SWN 1 100% with HEN-
OTA 1 out of service Vector’s WRU load exceeds the capacity of their 110 kV supply system OTA-PEN 5 & 6 overload with PAK-PEN 1 out of service
Install first PEN-HOB-WRU-ALB cable and HOB and WRU GXPs Install 2nd supply transformer at WRU Install a second 220 kV PAK-PEN cable (including a series reactor)
Assuming that the reinforcement that Vector do in 2010 is removed to allow for installation of the 220 kV ALB-WRU cable

Attachment B: Technical Report – May 2008 Revision
Grid Upgrade Plan 2007 Instalment 1, Part III – North Auckland and Northland Investment Proposal – May 2008 Revision © Transpower New Zealand Limited 2008. All rights reserved.
32
OTA-PEN 2 o/l with PEN T10 out of service
Special protection scheme to take OTA-PEN 2 out of service when PEN T10 trips
2028 1366 MW OTA T4 102% with OTA T1
out of service Special protection scheme – inter-trip OTA T4 with OTA T2
PEN interconnecting transformers take the load
2031 1435 MW MDN T1 100% with T2 out of
service Install a third interconnecting transformer at MDN equivalent to existing
2032 1458 MW OTA-PEN 2 101% with PEN
T12 out of service Install a series reactor (10 Ohms) on OTA-PEN 2 to balance flow between this circuit and the two interconnecting transformers.
If T10 hasn’t been replaced by this time, increase it’s impedance using a series reactor (5 Ohms). PEN T10 is circa 1972
2036 1554 MW Vector lose n-1 security on
their PEN-LST cables about this time
Assume 2nd HOB interconnecting transformer is installed at this time, and LST-HOB cables and PEN-QUAY cable are normally open
2040 1656 MW PAK-PEN 1 101% with PAK-
PEN 2 out of service HEN-OTA 1 100% with HEN-SWN 1 out of service HEN-WEL 1 & 2 100% with HPI-MDN out of service
Upgrade these cables to force-cooled, increasing capacity from 660 MVA to 1100 MVA Install the second cross harbour cable, ALB-PEN Reconductor these circuits
Bypass series reactors to reduce load on OTA-PEN 5 & 6 circuits
*Note: Upgrading PAK-PEN 1 & 2 will involve cooling stations for the cable cooling system.
5.3.2 Reactive Plan
The reactive plan includes the common reactive plant shown table 4-3 as well as the reactive plant listed in the table below
Table 5-6: Option 3 Voltage Support Plan
YEAR Location Quantity (Mvar)
Static(S) / Dynamic(D)
2016 ALB 50 S
2018 HEN 50 S
2028 HEN 50 S
Attachment B: Technical Report – May 2008 Revision
Grid Upgrade Plan 2007 Instalment 1, Part III – North Auckland and Northland Investment Proposal – May 2008 Revision © Transpower New Zealand Limited 2008. All rights reserved.
33
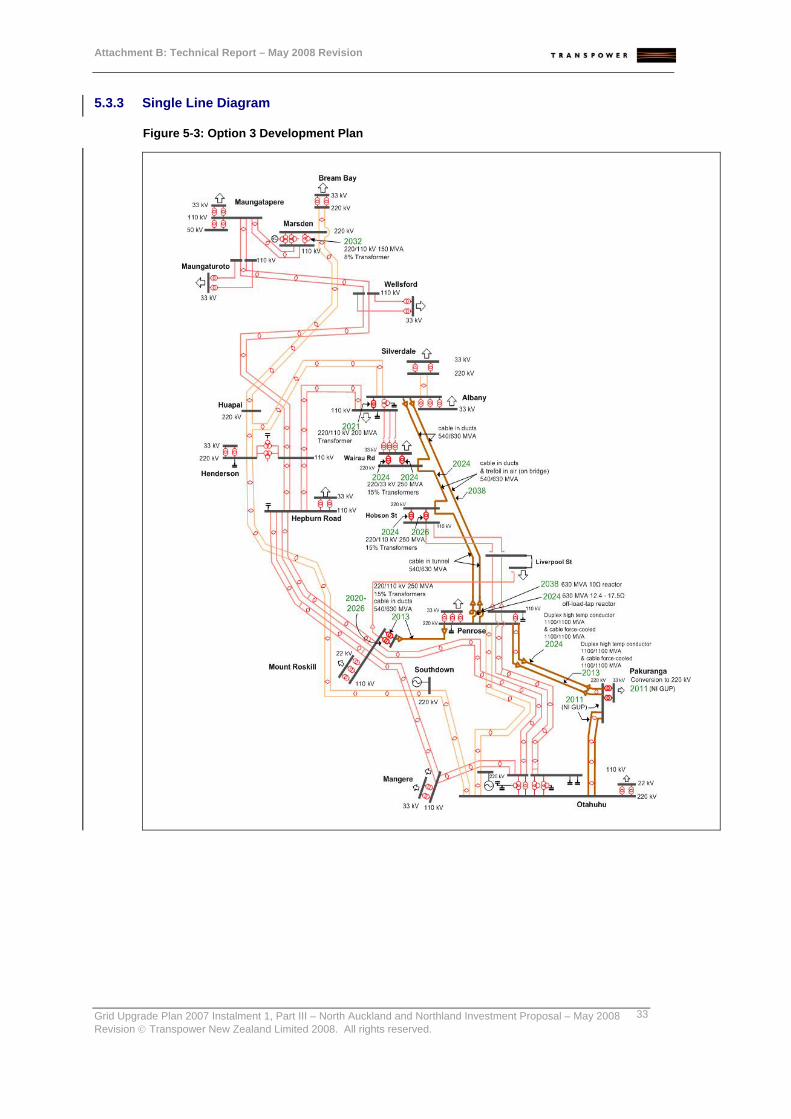
5.3.3 Single Line Diagram
Figure 5-3: Option 3 Development Plan
Attachment B: Technical Report – May 2008 Revision
Grid Upgrade Plan 2007 Instalment 1, Part III – North Auckland and Northland Investment Proposal – May 2008 Revision © Transpower New Zealand Limited 2008. All rights reserved.
34
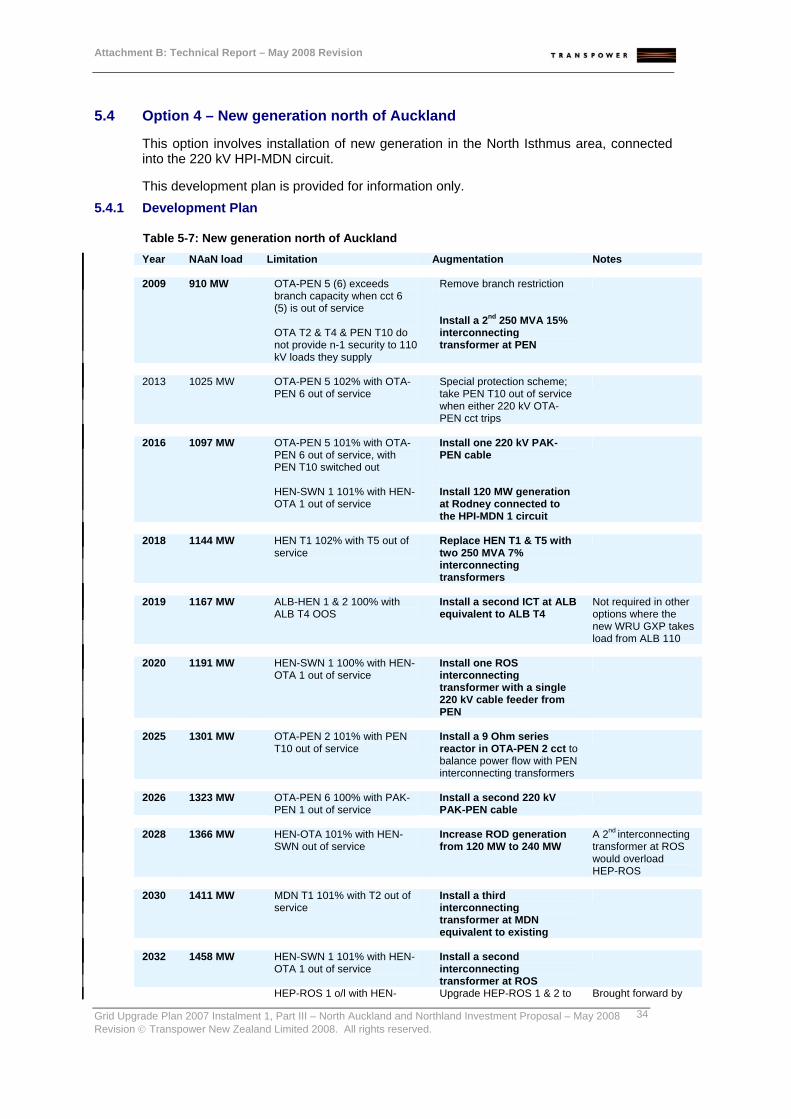
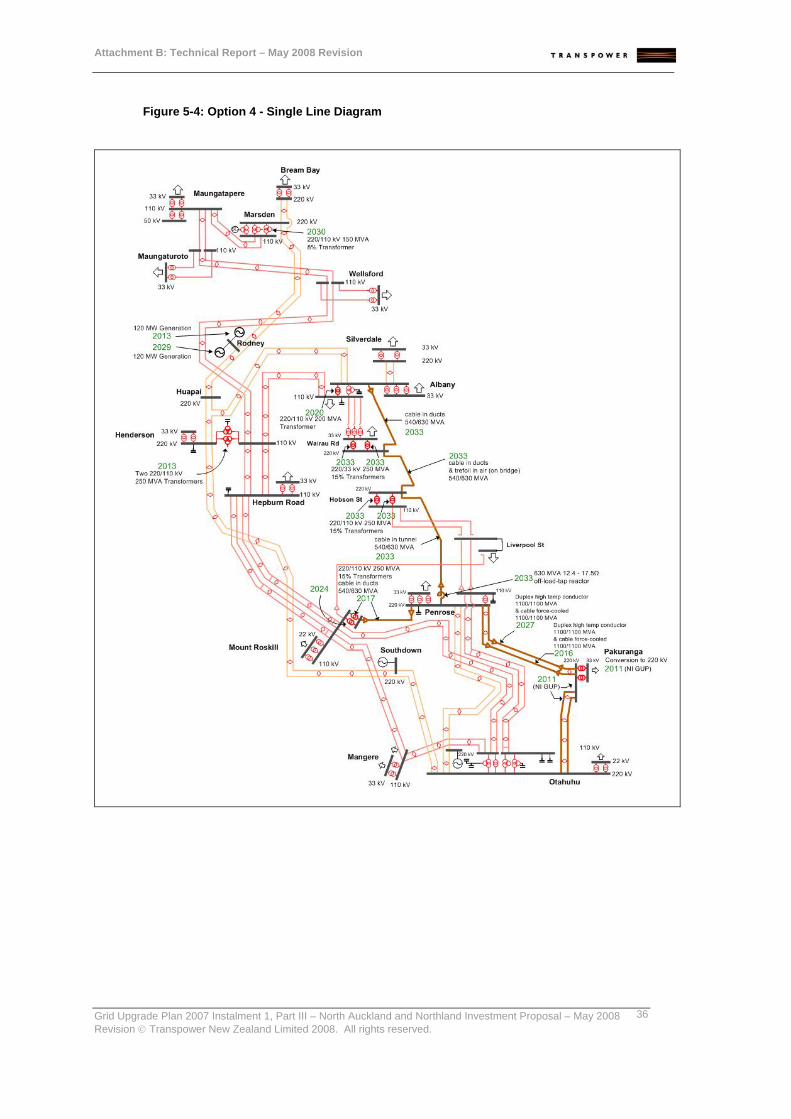
5.4 Option 4 – New generation north of Auckland
This option involves installation of new generation in the North Isthmus area, connected into the 220 kV HPI-MDN circuit.
This development plan is provided for information only. 5.4.1 Development Plan
Table 5-7: New generation north of Auckland Year NAaN load Limitation Augmentation Notes 2009 910 MW OTA-PEN 5 (6) exceeds
branch capacity when cct 6 (5) is out of service OTA T2 & T4 & PEN T10 do not provide n-1 security to 110 kV loads they supply
Remove branch restriction Install a 2nd 250 MVA 15% interconnecting transformer at PEN
2013 1025 MW OTA-PEN 5 102% with OTA-
PEN 6 out of service Special protection scheme; take PEN T10 out of service when either 220 kV OTA-PEN cct trips
2016 1097 MW OTA-PEN 5 101% with OTA-
PEN 6 out of service, with PEN T10 switched out HEN-SWN 1 101% with HEN-OTA 1 out of service
Install one 220 kV PAK-PEN cable Install 120 MW generation at Rodney connected to the HPI-MDN 1 circuit
2018 1144 MW HEN T1 102% with T5 out of
service Replace HEN T1 & T5 with two 250 MVA 7% interconnecting transformers
2019 1167 MW ALB-HEN 1 & 2 100% with
ALB T4 OOS Install a second ICT at ALB equivalent to ALB T4
Not required in other options where the new WRU GXP takes load from ALB 110
2020 1191 MW HEN-SWN 1 100% with HEN-
OTA 1 out of service Install one ROS interconnecting transformer with a single 220 kV cable feeder from PEN
2025 1301 MW OTA-PEN 2 101% with PEN
T10 out of service Install a 9 Ohm series reactor in OTA-PEN 2 cct to balance power flow with PEN interconnecting transformers
2026 1323 MW OTA-PEN 6 100% with PAK-
PEN 1 out of service Install a second 220 kV PAK-PEN cable
2028 1366 MW HEN-OTA 101% with HEN-
SWN out of service Increase ROD generation from 120 MW to 240 MW
A 2nd interconnecting transformer at ROS would overload HEP-ROS
2030 1411 MW MDN T1 101% with T2 out of
service Install a third interconnecting transformer at MDN equivalent to existing
2032 1458 MW HEN-SWN 1 101% with HEN-
OTA 1 out of service Install a second interconnecting transformer at ROS
HEP-ROS 1 o/l with HEN- Upgrade HEP-ROS 1 & 2 to Brought forward by

Attachment B: Technical Report – May 2008 Revision
Grid Upgrade Plan 2007 Instalment 1, Part III – North Auckland and Northland Investment Proposal – May 2008 Revision © Transpower New Zealand Limited 2008. All rights reserved.
35
SWN 1 out of service PAK-PEN 1 100% with PAK-PEN 2 out of service
90oC wolf Install series reactors on PAK-PEN 1 & 2
the installation of a second interconnecting transformer at ROS
2036 1554 MW HEN-OTA 1 101% with HEN-
SWN 1 out of service and vice versa
Install the first cross harbour cable PEN-HOB-WRU-ALBN, and HOB and WRU GXPs
Vector lose n-1 security on their PEN-LST cables about this time Vector’s WRU load exceeds the capacity of their 110 kV supply system
Assume 2nd HOB interconnecting transformer is installed at this time, and LST-HOB cables and PEN-QUAY cable are normally open Install 2nd interconnecting transformer at WRU
Assuming that three 200 MVA cables supply the CBD from PEN (a new PEN-QUAY is installed by Vector around 2013) Assuming that the reinforcement that Vector do in 2010 is removed to allow for installation of the 220 kV ALB-WRU cable
2040 1656 MW OK
5.4.2 Reactive Plan
The reactive plan includes the common reactive plant shown table 4-3 as well as the reactive plant listed in the table below.
Table 5-8: Option 4 Voltage Support Plan
YEAR Location Quantity (Mvar)
Static(S) / Dynamic(D)
2016 ALB 50 S
2022 HEN 50 S
2024 ALB 50 S
2038 HEN 50 S
5.4.3 Single Line Diagram
Attachment B: Technical Report – May 2008 Revision
Grid Upgrade Plan 2007 Instalment 1, Part III – North Auckland and Northland Investment Proposal – May 2008 Revision © Transpower New Zealand Limited 2008. All rights reserved.
36
Figure 5-4: Option 4 - Single Line Diagram

Attachment B: Technical Report – May 2008 Revision
Grid Upgrade Plan 2007 Instalment 1, Part III – North Auckland and Northland Investment Proposal – May 2008 Revision © Transpower New Zealand Limited 2008. All rights reserved.
37
6 Discussion on Reactive Plans The reactive power losses in the power system increase quadratically as the loading in the transmission circuits are increased. The reactive power losses in the transmission circuits are supplied from the two ends of each transmission circuit. Generally a higher amount of reactive power needs to be supplied from the receiving end compared to the sending end.
For the cross-Auckland transmission, the sending end reactive power requirements are supplied from the reactive support at Otahuhu. The reactive power available from Otahuhu based on the NI GUP reactive plan Option 2 is sufficient to provide this reactive requirement. Additionally, planned and committed reactive power support in the NAaN area will be sufficient to meet the reactive power losses in the transmission system until at least 2010.
6.1 Static Reactive Requirements
For each modelled option, sufficient reactive power was supplied at the Henderson, Albany and Marsden 220 kV buses to maintain 1.02 pu voltage at these buses at peak load times and with normal operating configuration. The additional static reactive support required in the NAaN area for the four transmission options is shown in Figure 6-1.
Figure 6-1: Reactive Support Requirement in NAaN Area
0
100
200
300
400
500
600
700
800
900
2010 2015 2020 2025 2030 2035 2040
Year
MVA
R
Option 1
Option 2
Option 3
Option 4
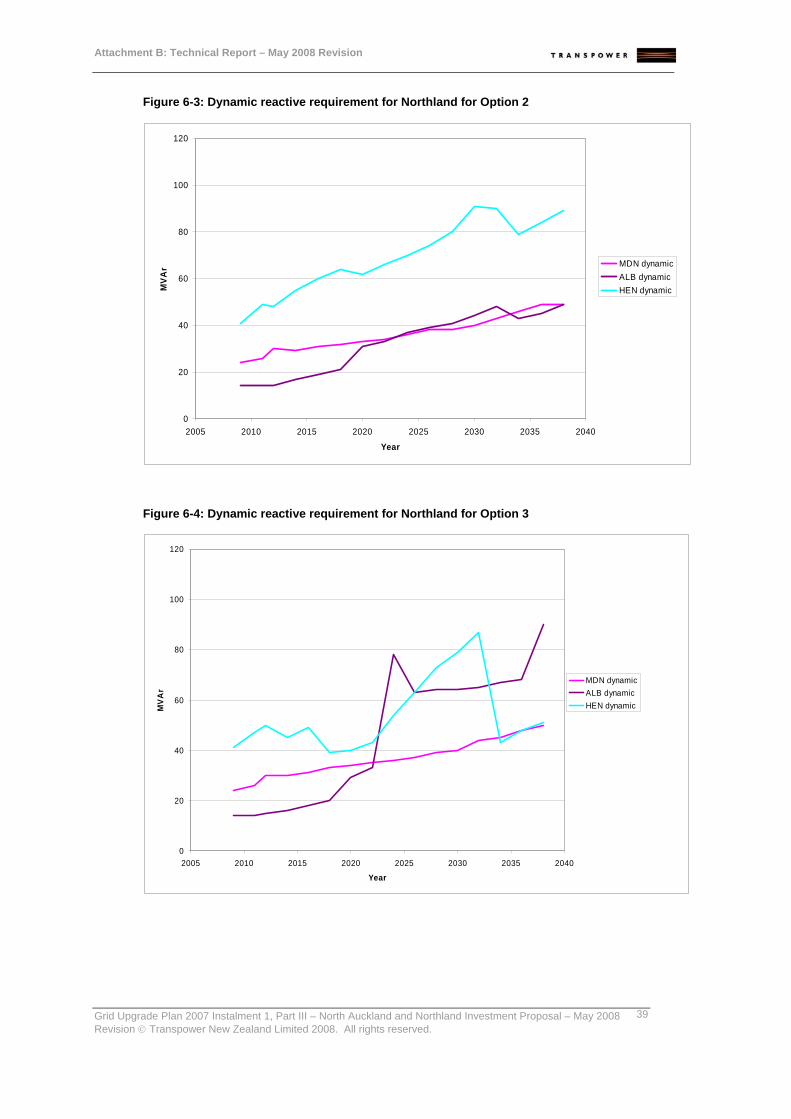
6.2 Dynamic Reactive Requirements
The reactive power loss in the transmission system north of Otahuhu may undergo a significant step change following an outage of a transmission circuit. In a voltage stability constrained system such as the power system supplying the NAaN region, it is not prudent to rely on post-contingency switching of the capacitor banks for ensuring system stability. It is considered good industry practice to carry sufficient dynamic reserves in the system, pre-contingency, to cater for such events. The dynamic reactive power reserves

Attachment B: Technical Report – May 2008 Revision
Grid Upgrade Plan 2007 Instalment 1, Part III – North Auckland and Northland Investment Proposal – May 2008 Revision © Transpower New Zealand Limited 2008. All rights reserved.
38
can be maintained in the form of reactive power from synchronous generators, synchronous condensers, SVCs and thyristor switched capacitors.
In analysing the dynamic reactive power reserves required in NAaN region for power transmission north from Otahuhu, the total reactive power supplied to the transmission system from Henderson, Albany and Marsden under the worst contingency is assessed both pre and post-contingency. The reactive power difference between the pre and post-contingency situation represents the minimum level of dynamic reactive reserves required at these substations.
By 2010, it is likely that the dynamic reactive support in the Northland area will be supplied from three sources; synchronous condensers at Marsden and Henderson (1 x 60 Mvar and 2 x 50 Mvar respectively) and an SVC at Albany (100 Mvar). The dynamic reactive power requirements for Option 1, 2, 3 and 4 are shown in Figure 6-2, Figure 6-3, Figure 6-4 and Figure 6-5.
Figure 6-2: Dynamic reactive requirement for Northland for Option 1
0
20
40
60
80
100
120
2005 2010 2015 2020 2025 2030 2035 2040
Year
MVA
r
MDN dynamicALB dynamicHEN dynamic
Attachment B: Technical Report – May 2008 Revision
Grid Upgrade Plan 2007 Instalment 1, Part III – North Auckland and Northland Investment Proposal – May 2008 Revision © Transpower New Zealand Limited 2008. All rights reserved.
39
Figure 6-3: Dynamic reactive requirement for Northland for Option 2
0
20
40
60
80
100
120
2005 2010 2015 2020 2025 2030 2035 2040
Year
MVA
r MDN dynamicALB dynamicHEN dynamic
Figure 6-4: Dynamic reactive requirement for Northland for Option 3
0
20
40
60
80
100
120
2005 2010 2015 2020 2025 2030 2035 2040
Year
MVA
r
MDN dynamicALB dynamicHEN dynamic

Attachment B: Technical Report – May 2008 Revision
Grid Upgrade Plan 2007 Instalment 1, Part III – North Auckland and Northland Investment Proposal – May 2008 Revision © Transpower New Zealand Limited 2008. All rights reserved.
40
Figure 6-5: Dynamic reactive requirement for Northland for Option 4
0
20
40
60
80
100
120
2005 2010 2015 2020 2025 2030 2035 2040
Year
MVA
r
MDN dynamicALB dynamicHEN dynamic
The graphs for each option indicate that the existing dynamic support (at Marsden) plus that already committed (Albany SVC) and under consideration (Henderson condensers) in the NAaN region will be sufficient to maintain a stable power system following the worst likely single transmission contingency.

Attachment B: Technical Report – May 2008 Revision
Grid Upgrade Plan 2007 Instalment 1, Part III – North Auckland and Northland Investment Proposal – May 2008 Revision © Transpower New Zealand Limited 2008. All rights reserved.
41
7 Summary The existing transfer limit into the NAaN area is limited by the capacity of the 220 kV HEN OTA circuits. This limit will be reached by winter 2011. One interim measure planned to increase this transfer limit is closing the 110 kV HEP-ROS split.
Under present load growth forecasts and with existing interconnecting transformers in service, the power flow will be well balanced between the 220 and 110 kV systems when the HEP ROS split is closed. This allows the best possible load transfer given the circuit ratings. Where interconnecting transformers are added in the reinforcement plans, 15% impedance is preferred as the standard value except where a variation is required to achieve a higher n-1 transfer limit, or where the new transformer has to match an existing transformer.
To increase the transfer limit into the NAaN area further, four transmission options have been developed and analysed. Each option takes a different approach to supplying the increasing NAaN area load for the next thirty years. The four options are:
1. A new 220 kV cable circuit across Auckland from Penrose to Albany
2. Replacing existing 220 & 110 kV conductors with High Temperature Conductors
3. Additional 220/110 kV interconnection to increase transmission across the existing 110 kV transmission system
4. New generation in the NAaN area used to delay new transmission options
A new 220 kV cable circuit is required to be built by winter 2016 in option 1. The new transmission system reaches its capacity by 2028 when the 110 kV system needs to be reinforced, and then in 2036 the transmission capacity needs to be further augmented by adding a second 220 kV cable.
Option 2 minimises the number of new lines required to be built. Existing circuits are upgraded using high temperature conductor; the first upgrade being required by 2016. The entire 110 and 220 kV systems from Otahuhu to Henderson must be upgraded as the load increases, beginning with the 110 kV MNG-ROS and 220 kV HEN-OTA circuits. Eventually in 2036 an interconnection is required at Mount Roskill to prevent the upgraded lines from overloading.
This option has the highest reactive support requirement of all those studied, being about double that of the other options. By the end of the study period this option has about 800 Mvar of support in the NAaN region, compared to about 400 Mvar for the other options.
Option 4 assumes that new generation is installed north of Auckland, reducing the load on the cross-Auckland transmission system. This generation does not remove the overloading on the 110 kV system, which is relieved by an interconnector at Mount Roskill in 2017. Assuming a maximum of 240 MW of new generation in the Rodney area, the first 220 kV cable is required in 2033.
Reinforcement of the 110 kV system in preference to the 220 kV system is examined in Option 3, where the Mount Roskill interconnection is installed in 2016 when the system reaches its limit. This delays the reinforcement of the 220 kV system until 2025, when the first cross-harbour cable is installed between Penrose and Albany.

Attachment B: Technical Report – May 2008 Revision
Grid Upgrade Plan 2007 Instalment 1, Part III – North Auckland and Northland Investment Proposal – May 2008 Revision © Transpower New Zealand Limited 2008. All rights reserved.
42
Appendix A – Existing Circuit Ratings Table A-0-1: Existing Circuits in Upper North Island south of Albany
Circuit Asset Conductor Conductor
Rating (MVA)
Branch Rating (MVA)
Notes
ALB-HEN 1 ALB-HEN A Simplex Wolf 80oC 96/105 96/105
ALB-HEN 2 ALB-HEN A Simplex Wolf 80oC 96/105 96/105
ALB-HEN 3 ALB-HPI A & HEN-MDN A
Duplex Zebra 71oC 680/756 561/617 200m simplex chukar
HEN-HEP 1 HEN-ROS A Simplex Wolf 75oC 92/101 92/101
HEN-HEP 2 HEN-ROS A Simplex Wolf 75oC 92/101 92/101
HEN-HEP 3 HEN-HEP A Simplex Wolf 75oC 92/101 92/101
HEN-HEP 4 HEN-HEP A Simplex Wolf 75oC 92/101 92/101
HEN-OTA 1 HEN-OTA A Duplex Zebra 120oC 938/985 915/915 Disconnector
HEN-SWN 1 HEN-OTA A Duplex Zebra 120oC 938/985 915/915 Disconnector
HEP-ROS 1 HEN-ROS A 2 bonded Wolf 75oC 184/202 114/114 Disconnector at 114 MVA then single span at 174/191 MVA
HEP-ROS 2 HEP-ROS A 2 bonded Wolf 75oC 184/202 114/114 Disconnector at 114 MVA then single span at 174/191 MVA
MNG-OTA 1 MNG-OTA A Duplex Zebra 75oC 355/390 305/305 Disconnector
MNG-OTA 2 MNG-OTA A Duplex Zebra 75oC 355/390 305/305 Disconnector
MNG-ROS 1 MNG-ROS A Simplex Wolf 75oC 92/101 92/101
MNG-ROS 2 MNG-ROS A Simplex Wolf 75oC 92/101 92/101
OTA-PAK 1 OTA-PAK A Duplex Chukar 75oC 561/617 235/235 Earth fault relay
OTA-PEN 2 OTA-PEN A & OTA-PEN B
2 bonded Wolf 75oC 184/202 174/191 Connecting spans of simplex zebra
OTA-PEN 5&6 OTA-PEN C Simplex Zebra 120oC 469/492 455/455 Transducer limit
OTA-PEN 7 OTA-PAK A Duplex Chukar 75oC 561/617 Inactive
OTA-ROS 1 OTA-PEN B & PEN-ROS A
Simplex Wolf 75oC 92/101 92/101
OTA-ROS 2 OTA-PEN B & PEN-ROS A
Simplex Wolf 75oC 92/101 92/101
OTA-SWN 1 HEN-OTA A Duplex Zebra 120oC 938/985 912/912 transducer
PAK-PEN 1 PAK-PEN A 2 Bonded 19/2.57 Cu 50oC 114/140 114/140

Attachment B: Technical Report – May 2008 Revision
Grid Upgrade Plan 2007 Instalment 1, Part III – North Auckland and Northland Investment Proposal – May 2008 Revision © Transpower New Zealand Limited 2008. All rights reserved.
43
APPENDIX B - Interconnection Transformer Ratings Table B-0-1: Ratings of Auckland Area 220/110 kV Interconnecting Transformers
IC Transformer
Winding
(for 3 winding transformers )
Continuous Summer Winter Notes
ALB T4 H 200 274 290 Limited to 267 MVA by MV & HV protection settings
M 200 274 290
HEN T1 H 200 254 270
M 200 254 270 Limited to 229 MVA by MV circuit breaker rating
HEN T5 H 200 274 290 Limited to 267 MVA by MV circuit breaker rating
M 200 274 290
MDN T1 H 141 190 201 Limited to 183 MVA by tap changer rating
M 141 190 201
MDN T2 H 141 190 201 Limited to 183 MVA by tap changer rating
M 141 190 201
OTA T2 H 117 158 170
M 100 135 145
OTA T3 H 250 324 338
M 260 337 351
OTA T4 H 200 254 270
M 200 254 270
OTA T5 2-winding 250 318 332
PEN T10 H 206 309 313 Limited to 291 MVA by HV protection settings
M 200 296 300

Attachment B: Technical Report – May 2008 Revision
Grid Upgrade Plan 2007 Instalment 1, Part III – North Auckland and Northland Investment Proposal – May 2008 Revision © Transpower New Zealand Limited 2008. All rights reserved.
44
Appendix C - Parameters of New Components Used Table C-0-1: Parameters of New Components used in Studies
Component Length (km) R (Ohms) X (Ohms)
Winter Rating (MVA)
Summer Rating (MVA)
notes
x-harbour cables (ALB-PEN):
ALB-WRU 8.45 0.127 1.463 543 630 cyclic rating
HOB-WRU 9.85 0.152 1.618 543 630 cyclic rating
HOB-PEN 10.21 0.183 1.133 543 630 cyclic rating
Total (ALB-PEN) 28.51 0.462 4.214 543 630 cyclic rating
220 kV PAK-PEN ccts - cable section
8.6 0.085 1.424 667 667 Direct buried
220 kV PAK-PEN ccts - cable section
8.6 0.085 1.424 1115 1115 Force-cooled
220 kV PEN-ROS cable 10.2 0.153 1.766 543 630 cyclic rating
4th ALB-WRU 110 kV cct (cable) 8.5 0.252 1.038 120 120 Vector's
Vector CBD 110 kV cables:
LST-PEN 1&2 8 0.238 0.982 205 205 Vector's
LST-ROS 1 10.2 0.304 2.228 150 150 Vector's
HOB-LST 1&2 1.5 0.070 0.202 150 150 Vector's
Transformers:
HEN ICT1 & 2 0.2% 7% 318 338 Continuous 250 MVA
HOB ICT1 & 2 0.2% 15% 318 338 Continuous 250 MVA
ROS ICT1 & 2 0.2% 15% 318 338 Continuous 250 MVA
WRU T1 & 2 0.2% 15% 250 250 Continuous 250 MVA
High Temperature Conductor
ALB-HPI / ALB-HEN / HEN-HPI 1350 1300 R & X as per existing
HEN-OTA 1350 1300 R & X as per existing

Attachment B: Technical Report – May 2008 Revision
Grid Upgrade Plan 2007 Instalment 1, Part III – North Auckland and Northland Investment Proposal – May 2008 Revision © Transpower New Zealand Limited 2008. All rights reserved.
45
HEP-ROS 350 340 R & X as per existing
MNG-OTA 670 660 R & X as per existing
MNG-ROS 180 170 R & X as per existing
OTA-ROS 180 170 R & X as per existing
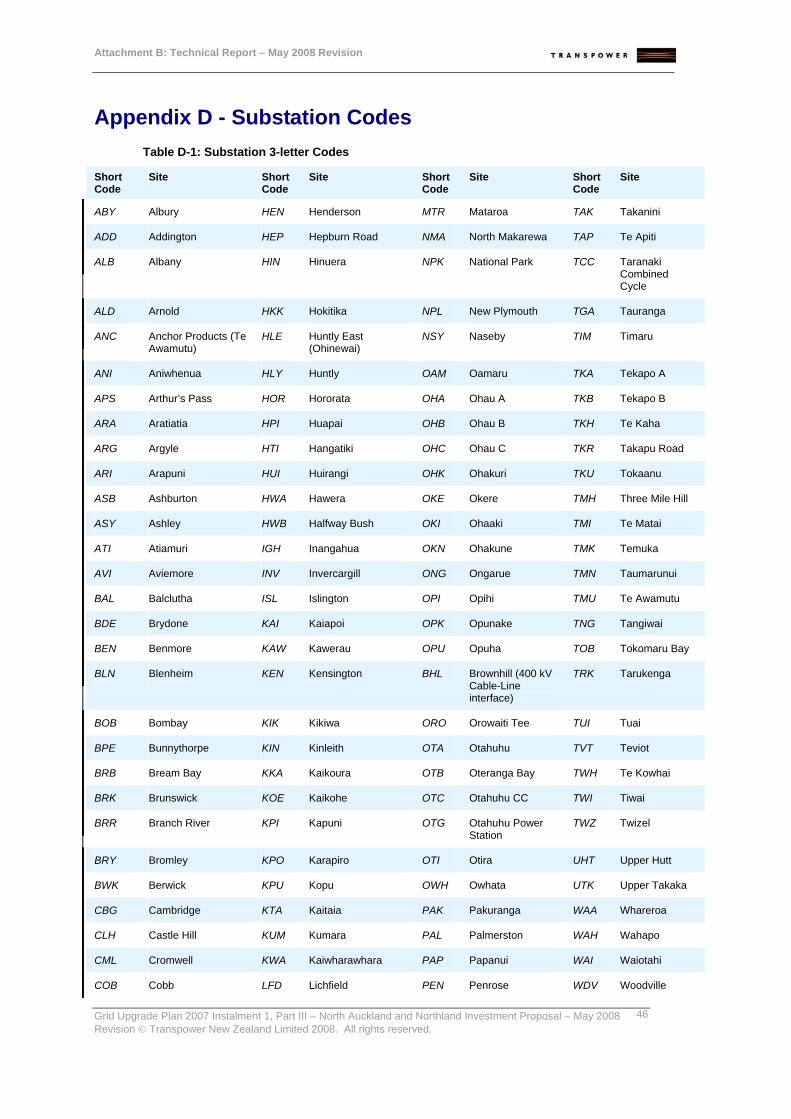
Attachment B: Technical Report – May 2008 Revision
Grid Upgrade Plan 2007 Instalment 1, Part III – North Auckland and Northland Investment Proposal – May 2008 Revision © Transpower New Zealand Limited 2008. All rights reserved.
46
Appendix D - Substation Codes Table D-1: Substation 3-letter Codes
Short Code
Site Short Code
Site Short Code
Site Short Code
Site
ABY Albury HEN Henderson MTR Mataroa TAK Takanini
ADD Addington HEP Hepburn Road NMA North Makarewa TAP Te Apiti
ALB Albany HIN Hinuera NPK National Park TCC Taranaki Combined Cycle
ALD Arnold HKK Hokitika NPL New Plymouth TGA Tauranga
ANC Anchor Products (Te Awamutu)
HLE Huntly East (Ohinewai)
NSY Naseby TIM Timaru
ANI Aniwhenua HLY Huntly OAM Oamaru TKA Tekapo A
APS Arthur’s Pass HOR Hororata OHA Ohau A TKB Tekapo B
ARA Aratiatia HPI Huapai OHB Ohau B TKH Te Kaha
ARG Argyle HTI Hangatiki OHC Ohau C TKR Takapu Road
ARI Arapuni HUI Huirangi OHK Ohakuri TKU Tokaanu
ASB Ashburton HWA Hawera OKE Okere TMH Three Mile Hill
ASY Ashley HWB Halfway Bush OKI Ohaaki TMI Te Matai
ATI Atiamuri IGH Inangahua OKN Ohakune TMK Temuka
AVI Aviemore INV Invercargill ONG Ongarue TMN Taumarunui
BAL Balclutha ISL Islington OPI Opihi TMU Te Awamutu
BDE Brydone KAI Kaiapoi OPK Opunake TNG Tangiwai
BEN Benmore KAW Kawerau OPU Opuha TOB Tokomaru Bay
BLN Blenheim KEN Kensington BHL Brownhill (400 kV Cable-Line interface)
TRK Tarukenga
BOB Bombay KIK Kikiwa ORO Orowaiti Tee TUI Tuai
BPE Bunnythorpe KIN Kinleith OTA Otahuhu TVT Teviot
BRB Bream Bay KKA Kaikoura OTB Oteranga Bay TWH Te Kowhai
BRK Brunswick KOE Kaikohe OTC Otahuhu CC TWI Tiwai
BRR Branch River KPI Kapuni OTG Otahuhu Power Station
TWZ Twizel
BRY Bromley KPO Karapiro OTI Otira UHT Upper Hutt
BWK Berwick KPU Kopu OWH Owhata UTK Upper Takaka
CBG Cambridge KTA Kaitaia PAK Pakuranga WAA Whareroa
CLH Castle Hill KUM Kumara PAL Palmerston WAH Wahapo
CML Cromwell KWA Kaiwharawhara PAP Papanui WAI Waiotahi
COB Cobb LFD Lichfield PEN Penrose WDV Woodville
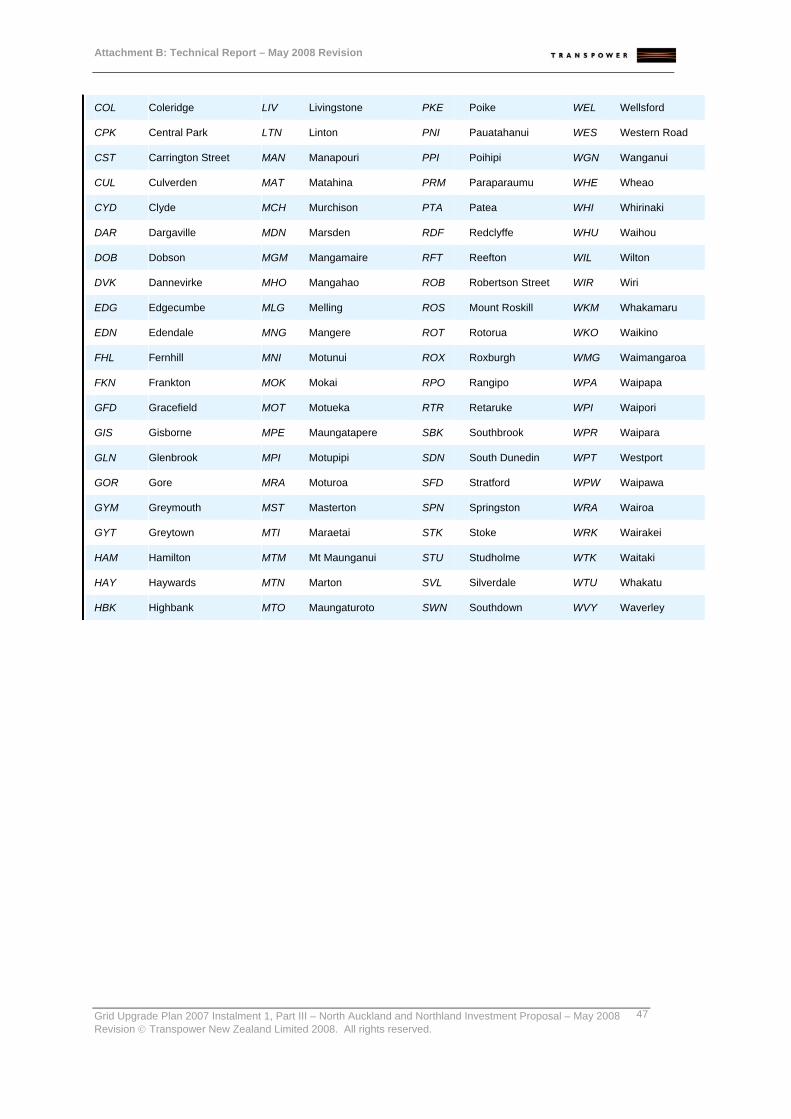
Attachment B: Technical Report – May 2008 Revision
Grid Upgrade Plan 2007 Instalment 1, Part III – North Auckland and Northland Investment Proposal – May 2008 Revision © Transpower New Zealand Limited 2008. All rights reserved.
47
COL Coleridge LIV Livingstone PKE Poike WEL Wellsford
CPK Central Park LTN Linton PNI Pauatahanui WES Western Road
CST Carrington Street MAN Manapouri PPI Poihipi WGN Wanganui
CUL Culverden MAT Matahina PRM Paraparaumu WHE Wheao
CYD Clyde MCH Murchison PTA Patea WHI Whirinaki
DAR Dargaville MDN Marsden RDF Redclyffe WHU Waihou
DOB Dobson MGM Mangamaire RFT Reefton WIL Wilton
DVK Dannevirke MHO Mangahao ROB Robertson Street WIR Wiri
EDG Edgecumbe MLG Melling ROS Mount Roskill WKM Whakamaru
EDN Edendale MNG Mangere ROT Rotorua WKO Waikino
FHL Fernhill MNI Motunui ROX Roxburgh WMG Waimangaroa
FKN Frankton MOK Mokai RPO Rangipo WPA Waipapa
GFD Gracefield MOT Motueka RTR Retaruke WPI Waipori
GIS Gisborne MPE Maungatapere SBK Southbrook WPR Waipara
GLN Glenbrook MPI Motupipi SDN South Dunedin WPT Westport
GOR Gore MRA Moturoa SFD Stratford WPW Waipawa
GYM Greymouth MST Masterton SPN Springston WRA Wairoa
GYT Greytown MTI Maraetai STK Stoke WRK Wairakei
HAM Hamilton MTM Mt Maunganui STU Studholme WTK Waitaki
HAY Haywards MTN Marton SVL Silverdale WTU Whakatu
HBK Highbank MTO Maungaturoto SWN Southdown WVY Waverley

Attachment B: Technical Report – May 2008 Revision
Grid Upgrade Plan 2007 Instalment 1, Part III – North Auckland and Northland Investment Proposal – May 2008 Revision © Transpower New Zealand Limited 2008. All rights reserved.
48
Appendix E - Forecast Load Data Table E-1: MW Load Forecast for Northland and Auckland as per EC Website April 2007
Year Northland MW Auckland MW
2007 839 1365
2008 870 1424
2009 910 1481
2010 1538
2011 978 1594
2012 1001 1638
2013 1025 1683
2014 1049 1730
2015 1073 1776
2016 1097 1822
2017 1121 1867
2018 1144 1912
2019 1167 1958
2020 1191 2004
2021 1213 2047
2022 1234 2090
2023 1256 2133
2024 1279 2179
2025 1301 2223
2026 1323 2266
2027 1345 2309
2028 1366 2351
2029 1388 2394
2030 1411 2439
2031 1435 2486
2032 1458 2531
2033 1482 2580
2034 1505 2626
2035 1529 2673
2036 1554 2724
2037 1579 2775
2038 1605 2826
2039 1631 2878
2040 1656 2930

Attachment B: Technical Report – May 2008 Revision
Grid Upgrade Plan 2007 Instalment 1, Part III – North Auckland and Northland Investment Proposal – May 2008 Revision © Transpower New Zealand Limited 2008. All rights reserved.
49
Appendix F - Characteristic of NAaN Load The graph below gives the 2006 load profile of the NAaN area based on half-hourly SCADA logs of the HEN-OTA 1 and HEN-SWN 1 MW circuit loading.
Figure F-0-1: NAaN Area 2006 MW Load Profile
0
100
200
300
400
500
600
700
800
900
30/0
1/20
06
1/03
/200
6
31/0
3/20
06
30/0
4/20
06
30/0
5/20
06
29/0
6/20
06
29/0
7/20
06
28/0
8/20
06
27/0
9/20
06
27/1
0/20
06
26/1
1/20
06
26/1
2/20
06

Attachment B: Technical Report – May 2008 Revision
Grid Upgrade Plan 2007 Instalment 1, Part III – North Auckland and Northland Investment Proposal – May 2008 Revision © Transpower New Zealand Limited 2008. All rights reserved.
50
Appendix G - Characteristic of Penrose Load The graphs below indicate the nature of the total load on the Penrose GXP. Data for these graphs comes from half-hourly SCADA data for the 2006 calendar year.
There is occasional load shifting to Penrose from the Mount Roskill GXP. This makes the summer/winter nature of the usual load unclear.
Figure G-0-1: Total 2006 Penrose GXP Load including 22 kV, 33 kV, Liverpool St Feeders and Quay St Feeders
0
100
200
300
400
500
600
31/0
1/06
2/03
/06
2/04
/06
2/05
/06
1/06
/06
2/07
/06
1/08
/06
1/09
/06
1/10
/06
1/11
/06
1/12
/06
31/1
2/06
Date
MW
Figure G-2 below shows the load on the Liverpool St feeders from Penrose. The occasional high peaks indicate periods when the lines company has shifted the Liverpool St load from Mount Roskill to Penrose. Apart from those periods and an apparent step change around August, the load on the Penrose-Liverpool St feeders is seen to be flat across the year.

Attachment B: Technical Report – May 2008 Revision
Grid Upgrade Plan 2007 Instalment 1, Part III – North Auckland and Northland Investment Proposal – May 2008 Revision © Transpower New Zealand Limited 2008. All rights reserved.
51
Figure G-0-2: 2006 Liverpool St Feeder Load
0
20
40
60
80
100
120
140
160
31/0
1/06
2/03
/06
2/04
/06
2/05
/06
1/06
/06
2/07
/06
1/08
/06
1/09
/06
1/10
/06
1/11
/06
1/12
/06
31/1
2/06
Date
MW
Figure G-3 shows the Penrose GXP load without the Liverpool St feeder load. This graph indicates clearly that the Penrose loads as a whole are winter peaking, if load shifting from Mount Roskill is avoided.
Figure G-3: 2006 Penrose Load without Liverpool St Feeder Load
0
50
100
150
200
250
300
350
400
31/0
1/06
2/03
/06
2/04
/06
2/05
/06
1/06
/06
2/07
/06
1/08
/06
1/09
/06
1/10
/06
1/11
/06
1/12
/06
Date
MW

Attachment B: Technical Report – May 2008 Revision
Grid Upgrade Plan 2007 Instalment 1, Part III – North Auckland and Northland Investment Proposal – May 2008 Revision © Transpower New Zealand Limited 2008. All rights reserved.
52
Figure G-4 shows the annual load profile at Liverpool St supplied from Mount Roskill. This may be added to the Penrose load under certain upgrade scenarios. The profile indicates that Penrose will remain winter peaking overall if this load transfer occurs.
Figure G-4: 2006 Mount Roskill Liverpool St Feeder Load
0
20
40
60
80
100
12031
/01/
06
2/03
/06
2/04
/06
2/05
/06
1/06
/06
2/07
/06
1/08
/06
1/09
/06
1/10
/06
1/11
/06
1/12
/06
Date
MW