website | deutsche beteiligungs ag
TRANSCRIPT

QUARTERLY STATEMENT
AT31 DECEMBER 2019
1 ST QUARTER 2019/2020
ANALYSTS ‘ CONFERENCE CALL10 FEBRUARY 2020

2
SPEAKERS
SUSANNE ZEIDLERChief Financial Officer
THOMAS FRANKEHead of
Public Relations and Investor Relations
Q U A R T E R L Y S T A T E M E N T A T 3 1 D E C E M B E R 2 0 1 9 - A N A L Y S T S ' C O N F E R E N C E C A L L - 1 0 F E B R U A R Y 2 0 2 0
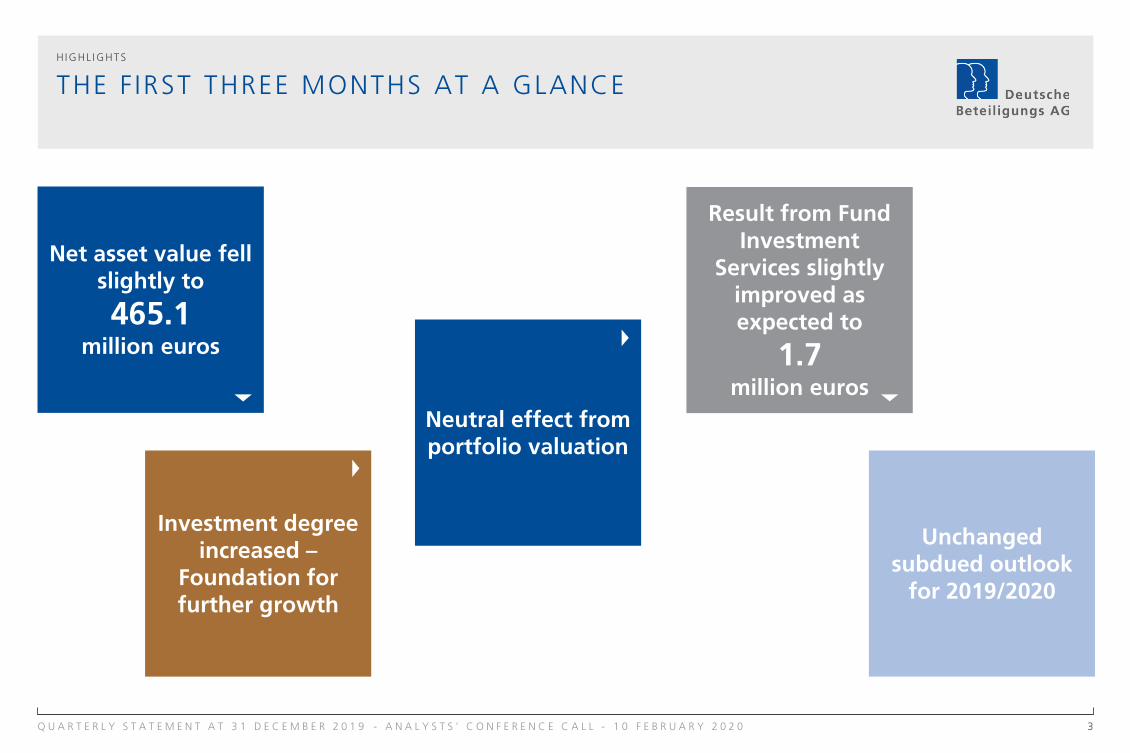
Investment degreeincreased –
Foundation forfurther growth
3
THE F IRST THREE MONTHS AT A GLANCE
HIGHL IGHT S
Unchangedsubdued outlook
for 2019/2020
Neutral effect fromportfolio valuation
Net asset value fellslightly to
465.1million euros
Result from Fund Investment
Services slightlyimproved asexpected to
1.7million euros
Q U A R T E R L Y S T A T E M E N T A T 3 1 D E C E M B E R 2 0 1 9 - A N A L Y S T S ' C O N F E R E N C E C A L L - 1 0 F E B R U A R Y 2 0 2 0

4
CONTROL BASED ON OUR NEW TARGET SYSTEM.. .
T HE F I RS T T HRE E M ONT HS AT A GLANCE
BUILD THE VALUE OFFUND INVESTMENT
SERVICES
BUILD THE VALUE OFPRIVATE EQUITY INVESTMENTS
SHAREHOLDER PARTICIPATION IN
SUCCESS – THROUGHA STABLE (AND
PREFERABLYINCREASING) DIVIDEND
GARNERING ESTEEMAS ADVISORS
OF PRIVATE EQUITYFUNDS
GARNERING ESTEEMAS A FINANCIAL
INVESTOR IN MID-SIZEDCOMPANIES
RETAIN EXPERIENCEDAND MOTIVATED
EMPLOYEES
FINANCIAL TARGETS
NON-FINANCIAL TARGETS
21
NEW:
Q U A R T E R L Y S T A T E M E N T A T 3 1 D E C E M B E R 2 0 1 9 - A N A L Y S T S ' C O N F E R E N C E C A L L - 1 0 F E B R U A R Y 2 0 2 0
CORE BUSINESS OBJECTIVELONG-TERM INCREASE OF DBAG’S ENTERPRISE VALUE

5
…WITH NEW KEY FIGURES FOR THE FINANCIAL TARGETS
T HE F I RS T T HRE E M ONT HS AT A GLANCE
PRIVATE EQUITY INVESTMENTS FUND INVESTMENT
SERVICES
NET INCOME BEFORE TAXES:
1.7MILLION EUROS
DEUTSCHE
BETEILIGUNGS AG
NET INCOME
-0.2MILLION EUROS
NET ASSET VALUE PER SHARE:
30.91EUROS
NET ASSET VALUE:
465.1MILLION EUROS
Q U A R T E R L Y S T A T E M E N T A T 3 1 D E C E M B E R 2 0 1 9 - A N A L Y S T S ' C O N F E R E N C E C A L L - 1 0 F E B R U A R Y 2 0 2 0
ASSETS UNDERMANAGEMENT:
1.7BILLION EUROS
CASHFLOW FROMINVESTING ACTIVITIES:
-43.8MILLION EUROS
NET INCOME BEFORE TAXES:
-1.9MILLION EUROS
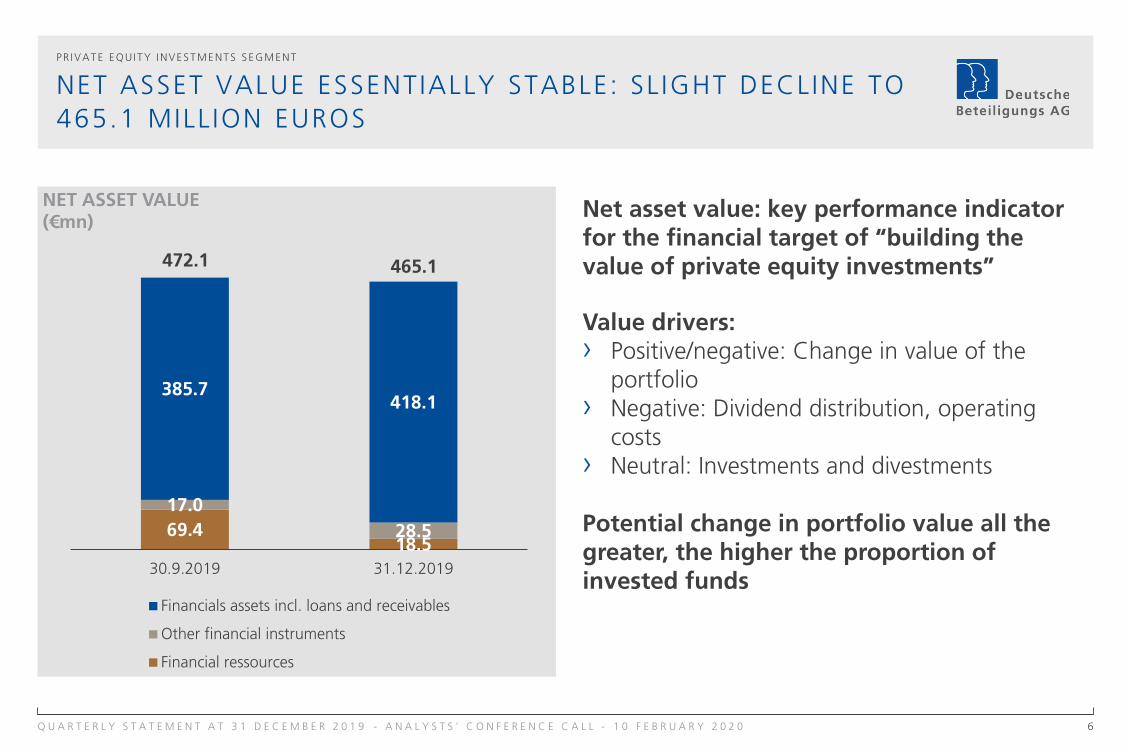
69.418.5
17.0
28.5
385.7418.1
30.9.2019 31.12.2019
NET ASSET VALUE(€mn)
Financials assets incl. loans and receivables
Other financial instruments
Financial ressources
6
NET ASSET VALUE ESSENTIALLY STABLE: SL IGHT DECLINE TO
465.1 MILL ION EUROS
PR IVAT E E QUIT Y INVE S T M E NT S S E GM E NT
472.1 465.1
Q U A R T E R L Y S T A T E M E N T A T 3 1 D E C E M B E R 2 0 1 9 - A N A L Y S T S ' C O N F E R E N C E C A L L - 1 0 F E B R U A R Y 2 0 2 0
Net asset value: key performance indicatorfor the financial target of “building thevalue of private equity investments”
Value drivers:› Positive/negative: Change in value of the
portfolio› Negative: Dividend distribution, operating
costs› Neutral: Investments and divestments
Potential change in portfolio value all thegreater, the higher the proportion ofinvested funds

7
Additions to the portfolio
› DBAG Fund VII− Cartonplast: agreed upon in Q4 2018/2019,
closed in Q1 2019/2020
› DBAG ECF− STG Group: agreed upon in Q4 2018/2019,
closed in Q1 2019/2020
Portfolio disposals
› DBAG ECF:− inexio: agreed upon in Q4 2018/2019,
closed in Q1 2019/2020, Disposal from portfolio, fundsstill on balance sheet of co-investment vehicle, not yetreceived by DBAG
Acquisitions in the portfolio
› DBAG Fund VII− blikk radiology group: one acquisition closed, one
more agreed upon
› DBAG ECF− STG Group: one acquisition agreed upon, two more
being prepared for Q2 2019/2020− netzkontor nord: one acquisition closed, one more
agreed upon
LEVEL OF INVESTMENT FURTHER INCREASED – FOUNDATION
FOR FURTHER GROWTH
PR IVAT E E QUIT Y INVE S T M E NT S S E GM E NT
Q U A R T E R L Y S T A T E M E N T A T 3 1 D E C E M B E R 2 0 1 9 - A N A L Y S T S ' C O N F E R E N C E C A L L - 1 0 F E B R U A R Y 2 0 2 0
Cashflow from investment activities
› Net cash and cash equivalents of 43.8 millioneuros invested
› Invested to non-invested funds ratio− As at 31 December 2019: 24.1 times− As at 30 Sepetmber 2019: 5.8 times

8
“Other” predominantly reflects other assets and liabilities of investment entity subsidiaries, as of31.12.2019 including proceeds from inexio, offset in “Disposals portfolio value”
PORTFOLIO DISPOSALS EXCEED ADDIT IONS FROM
NEW INVESTMENTS
PR IVAT E E QUIT Y INVE S T M E NT S S E GM E NT
422.1 406.4
51.6
418.1
43.3-58.8
-0.2 -39.9
Portfolio value30.9.2019
Additions Disposals Change in value Gross portfoliovalue 31.12.2019
Carried interest Other Financials assetsincl. loans and
receivables
PORTFOLIO VALUE DEVELOPMENT(€mn)
Q U A R T E R L Y S T A T E M E N T A T 3 1 D E C E M B E R 2 0 1 9 - A N A L Y S T S ' C O N F E R E N C E C A L L - 1 0 F E B R U A R Y 2 0 2 0

-23.9
-9.9-47.8
0.2 2.4 0.2
Change inearnings
Change indebt
Change inmultiples
Change inexchange rates
Other Realised gainson
disposals
Result ofvaluation and
dispoal
RESULT OF VALUATION AND DISPOSAL PORTFOLIOQ1 2018/2019 (€mn)
-4.9
0.038
-1.5
5.1
0.1 1.0 0.3
Change inearnings
Change indebt
Change inmultiples
Change inexchange rates
Other Realised gainson
disposals
Result ofvaluation and
dispoal
RESULT OF VALUATION AND DISPOSAL PORTFOLIOQ1 2019/2020 (€mn)
9
NEUTRAL EFFECT OF PORTFOLIO VALUATION ON NET ASSET
VALUE
PR IVAT E E QUIT Y INVE S T M E NT S S E GM E NT
30.9
Q U A R T E R L Y S T A T E M E N T A T 3 1 D E C E M B E R 2 0 1 9 - A N A L Y S T S ' C O N F E R E N C E C A L L - 1 0 F E B R U A R Y 2 0 2 0
Value contribution from theoperating performance of theportfolio companies› -6.4 million euros after 21.0
million euros› Positive effects from focus
sector companies overcom-pensated by negative effectsfrom core sector companies
Value contribution fromchanges in capital marketmultiples › 5.1 million euros after
-47.8 million euros› Not influenceable, extremely
volatile

10
Belastung durch konjunkturelle Abkühlung und handelsstreit
Positive value contributions: Twelve portfoliocompanies (previous year: eight)
Negative value contributions: Twelve portfoliocompanies (previous year: fourteen)
Broadband telecommunications enterprisesoffer examples of positive operatingperformance – but lower multiples in the sector
Numerous companies burdened by recession in the industrial sector
Diversification through investments in the focussectors pays off
POSIT IVE AND NEGATIVE VALUE CONTRIBUT IONS ARE
BALANCED
The two investments in foreign buyout funds managed by third parties delivered negative value contributions (previous year: one fund with a positive, one with a negative value contribution)
PR IVAT E E QUIT Y INVE S T M E NT S S E GM E NT
13.6 17.8
-37.4
-17.8
Q1 2018/2019 Q1 2019/2020
RESULT OF VALUATION AND DISPOSAL (€mn)
Positive results Negative results
Q U A R T E R L Y S T A T E M E N T A T 3 1 D E C E M B E R 2 0 1 9 - A N A L Y S T S ' C O N F E R E N C E C A L L - 1 0 F E B R U A R Y 2 0 2 0

11
INVESTMENTS OUTSIDE THE FOUR CORE SECTORS ACCOUNT
FOR HALF OF PORTFOLIO VALUE
Not included: other investments, including investments in externally managed international buyout funds (3.8 percent of the portfolio value)
PR IVAT E E QUIT Y INVE S T M E NT S S E GM E NT
9% of portfoliovalue
Other focus sectors
50% ofportfolio value
Four core sectors
22% ofportfolio value
Broadbandtelecommunications
Other investments
15% ofportfolio value
Q U A R T E R L Y S T A T E M E N T A T 3 1 D E C E M B E R 2 0 1 9 - A N A L Y S T S ' C O N F E R E N C E C A L L - 1 0 F E B R U A R Y 2 0 2 0

7.67.4
1.51.7
Q1 2018/2019 Q1 2019/2020
Fee income from Fund Investment Services (€mn)
Earnings before tax (€mn)
12
Result from fund investment services: key per-
formance indicator for the financial objective
of “building the value of fund investment
services”
Income from fund investment services slightly
lower
› Lower fees from DBAG Fund VI, DBAG Fund V,
as expected
› Higher fees generated from DBAG Fund VII, in
line with investment progress
Reduced net expenses from other income
components
› Changes in other operating income and
expenses
› Multitude of items
RESULT FROM FUND INVESTMENT SERVICES SL IGHTLY
IMPROVED AS EXPECTED TO 1.7 MILL ION EUROS
Income from the Fund Investment Services segment includes internal management fees of 0.3 million euros from the PE Investments segment (Q1 2018/2019: 0.2 million euros)
FUND INVE S T M E NT S E RV ICE S S E GM E NT
Q U A R T E R L Y S T A T E M E N T A T 3 1 D E C E M B E R 2 0 1 9 - A N A L Y S T S ' C O N F E R E N C E C A L L - 1 0 F E B R U A R Y 2 0 2 0
Net expenses5.7 millioneuros
Net expenses6.2 millioneuros

13
UNCHANGED ECONOMIC ENVIRONMENT WARRANTS A
CAUTIOUS OUTLOOK
F INANC IAL OUT LOOK
Actual2018/2019
Forecast2019/2020
Ambition for2021/2022
Net asset value 472.1 million euros Slightly lower Significantly higher
Net income from Fund Investment Services 3.0 million euros Significantly higher Moderately higher
Dividend per share €1.50 No change No change
Investment opportunities p.a. 258 No change No change
Capital commitments by investors in previousDBAG funds (in %)
>75 No change No change
Average length of service 7.6 years No change No change
Net income* 45.9 million euros Moderately lower Significantly higher
* Typically, net income may fluctuate considerably, which is why reference is made to the average of the past five years(46.8 million euros) and other grading; “slight”: +/- 0 to 20% “moderate”: +/- 20 to 40% “significant”: > +/- 40%
“slight”: +/- 0 to 10%“moderate”: +/- 10 to 20% “significant”: > +/- 20%
Q U A R T E R L Y S T A T E M E N T A T 3 1 D E C E M B E R 2 0 1 9 - A N A L Y S T S ' C O N F E R E N C E C A L L - 1 0 F E B R U A R Y 2 0 2 0

Q U A R T E R L Y S T A T E M E N T A T 3 1 D E C E M B E R 2 0 1 9 - A N A L Y S T S ' C O N F E R E N C E C A L L - 1 0 F E B R U A R Y 2 0 2 0 14
FURTHER INFORMATION ON
THE LATESTACQUISITIONS

15
Business:› Pool system operator for the rental of reusable
plastic layer pads used for the transportation ofglass bottles or containers for beverages and food
Ownership summary:› Initial investment date: November 2019› DBAG’s largest investment:
16.4% (24.9 million euros) › Co-investment alongside DBAG Fund VII and
its top-up fund
Investment case:› Exploring new, attractive markets› Extension of product portfolio
INDUSTRIALSERVICES
CARTONPLAST MBO
DE VE LOPM E NT OF PORT FOL IO
Q U A R T E R L Y S T A T E M E N T A T 3 1 D E C E M B E R 2 0 1 9 - A N A L Y S T S ' C O N F E R E N C E C A L L - 1 0 F E B R U A R Y 2 0 2 0

16
Business:› Service provider for the telecommunications
sector, with a focus on the construction of fibre-optic networks
› Operation, upgrading and maintenance ofnetworks
Ownership summary:› Initial investment date: November 2019› DBAG’s investment: 36.0% (9.6 million euros)› Expansion capital investment alongside DBAG ECF
Investment case:› Upselling potential with existing customers› Expansion into adjacent markets and applications› External growth through buy-and-build strategy
(based on acquisitions made since the start ofinvestment – further acquisitions in the pipeline)
INFORMATION TECHNOLOGY,
MEDIA AND TELECOMMUNI-
CATIONS
DEVELOPMENT OF THE PORTFOLIO
DE VE LOPM E NT OF T HE PORT FOL IO
Q U A R T E R L Y S T A T E M E N T A T 3 1 D E C E M B E R 2 0 1 9 - A N A L Y S T S ' C O N F E R E N C E C A L L - 1 0 F E B R U A R Y 2 0 2 0