· web viewfinally ,four years ago the government recognized that its own seat, delhi, with its...
TRANSCRIPT
Volume-Two
MASTER PLAN FOR DELHI
1957
Part -1
P R E A M B L E
Planning as a concept and as policy needs no elucidations in the India of today. However, strangely enough, planning methods have not yet been applied to reforming the physical environment within which planned economic growth and social development are to take place. Except for the design of new towns, for the dramatic new steel mills and the capital of newly created states, our old cites growing at a vertiginous rate have been left to sprawl over the land. Finally ,four years ago the government recognized that its own seat, Delhi, with its population doubled since 1941, was in dire need of some drastic surgery, dynamic proposal to accommodate its expected growth, as a major city of India, and as a major world capital . As a result the preparation of a master plan for Delhi and its region was undertaken. Thus Delhi will be the first to have a comprehensive urban development plan with metropolitan and regional proposals. It is hoped that the preparation of this plan will point the way towards solving the growth problems that are besetting other urban areas in the country. In this respect the proposed plan becomes an all India prototype.
A Regional Plan –why?
The Delhi citizen or the visitor to Delhi daily sees and deeply feels the need for intelligent planning and action. He experiences the delays and tensions and hazards of chaotic traffic. He sees the miserable hovels of Jamuna Bazaar and a dozen other squatters colonies , the incredible overcrowding and lack of sanitation in the old city , where in some wards people are huddled 1000 to the acre, In contrast to a New Delhi density of at places, as low as 3 families per acre. He knows how difficult and expensive it is to find a dwelling for himself, and often when he does find one, he suffers from lack of water supply , or of drainage, or connected sewerage.
But what may not at first sight be so clear is that to remedy those desperate conditions we must not work only at these immediate tasks. Unless we plan at a much larger scale as well as, on a regional scale, then the immediate remedies will inevitable fall. Even if we plan and build large quantities of good housing in Delhi, and even if we simultaneously supply the water and the Sewerage and the shopping, we will still fait to catch up. For the possibly major problem of every metropolis everywhere is in-migration from rural areas and from smaller towns, and this problem is especially acute in Delhi. From 1941 to 1951 the total population of India increased by 13.3 per cent. But the urban population increased by about three times that. Urban places of up to 100,000 population increased by 23.2 per cent, but much more spectacular and alarming was the increase in cities of 100,000 and over, where the population rose by 125 per cent.
Delhi s growth in this period was especially drastic for well known reasons: the lakhs of mass refugee migration from Pakistan ; the massive growth of Government employment from
colonial law-and-order State to the Capital of a great country dedicated to the planned welfare State ; the proliferation of Embassies, business representatives from India and all over the world, of National Associations and Institutes; all this piled on top of natural growth and regular in migration- especially drawn by all these factors.
*The preliminary figures of the 1961 census also reveal that the urbanization has been maintained at a high level.
Unless therefore the plan is for the Region , so that the smaller cities, the larger villages all around offer employment opportunities and reasonable living conditions to share the burden of rapidly increasing population and of in-migration, Delhi will be swamped, and even the most desperate attempts to cope with the problem here will still fall further and further behind. In short, to solve the miseries and short-coming of the city itself, one must think and operate and control in terms of the metropolitan urban –rural integration . Or to put it another way, Regional counter-magnets must be created for the vast numbers of in migrants.
Thus the most self –centered Delhi-ite, to cure the ills of his own Mohalls or of this own housing colony or of his one traffic –beleaguered streets, or the impossibility of renting a proper offices, must agree to the urgent necessity of Regional planning. He must interest himself in the Rural and Regional aspect of the Delhi Plan, as well as in the much more precise and recognizable features which apply in his own neighborhood and place of work.
The plan which attempts to foresee and deal with the development of Delhi up to 1981 .has estimated Delhi s; population than at five million. But this projection of population is not by any means on; the high side; was in fact chosen more nearly on’ the low side’ of a number of standard methods of projection . Also, demographic projection for so long a period are far from infallible. If this low side projection is indeed to prove out, Large numbers of rural in-migrants must be attracted elsewhere. Indeed, it is not only a question of rural in- migrants. Projections for the other group of districts , such as Meerut , Bulandshaher ,Karnal and Gurgaon with towns such as panipat and Hapur themselves show a big rate of increase if they, or at least some of the cities in the large region, are not reasonably planned and developed, Delhi will be receiving in-migrants from these, and these towns in turn will suffer depletion , even incipient decay , if they are not equipped to attract virile enterprise.
For working purpose, the 1981 urban population for urban Delhi including Narela has been estimated at 46 lacs and the population Delhi Metropolitan Ares has been estimated at about 60 lacs.
There are also more immediate reasons for planning the Region. The automobile , the truck , the bus have erased’ the political boundaries of cities .Regulations within the city simply lead to
unbridled haphazard development just over the border, as witness the burgeoning shambles on the Grand Trunk from the borders of Delhi Territory to Ghaziabad; and the same ribbon development is now beginning on the Mathura Road southward.
Thus the problem shared by Delhi and its surrounding cities is a mutual one, not merely a worry for Delhi.
The city of Delhi- New- Delhi some general Urban Features:
The Delhi Regional plan is particularly significant for two reasons. It deals with a specific problem- namely, the ordering of the future of the Delhi area for the maximum benefit of its residents and those whose business brings them benefit of its residents and those whose business brings them of the National Capital from time to time. This in itself is adequate reason for its having been prepared at this crucial time when the Delhi area is about to experience a growth that probably will reach fifty lakh or more in population in twenty years.
Delhi is a unique city. Both the substantive elements of the plan, and its texture and character endeavour to do it justice in modern terms. It has an ancient history of splendor and of squalor, of destructions and of persistent reconstructions. It thus has a symbolic and spiritual connection which the planning and architecture must seek to live up to, and to exemplify. There is a current and recent deficiency here which must to be made good. In short, THE PLAN, must be not only technically skilful, but must have character, to combine in modern terms characteristics of a symbolic and cultural centre, the Heart of a Great Nation , and the work –a –day Metropolis.
Delhi as a city is unique in other ways. it is relay a number of cities quite separate in character, origin, and to a great extent a function. It is the over crowed old walled city, with its overspill into crowded and haphazard paharganj, Naya Bazaar, Sadar Bazaar with no open spaces and almost no proper community facilities. it is the dignity of Civil Lines to the North, with its great University, and its own overspill of colonies largely refugee in origin. It is the prestige- ful official New Delhi its westernized Connaught shopping centre, which it is the sought to keep entirely aloof from the old areas. It has its own recent overspill of colonies , refuges and other, to the south and west, without utilities, without shops, with unpaved roads, with no or makeshift schools.
The task is not to less these special positive and functional characters by trying to erase them and superimpose a uniform character. The task is to set and to implement minimum acceptable basic living standards for all, more closely to equalize living conditions and community facilities, to improve and sanitize and thin out the old city without sacrificing its essential character and virtues, some of which are actually modern, and sought by latter-day cities. Families must no
longer need to queue up at public taps in back lanes for their water requirements. Better solutions must be found for its intensive business activities, huddled in among small back shops and living quarters. But while internal circulations must be somewhat improved, it must not be pierced by through roads or wide circulations roads. One must remember that the centers of modern cities are right now sending great sums to rearrange themselves for the automobile free existence. THE PLAN, to a large extent, attempts to retain this happy situation.
In the New Delhi area, further development is essential to obtain balanced economic in land and services in the heart of the Government complex in which more people can live and work.
The city of Delhi- New Delhi- proposed form of the city:
Planning has two major concerns. First, it is necessary to make certain that proposed development shall correct the consequences or past growth. Most urban areas are confronted with problems arising from their having developed in a haphazard manner, more often than not without benefit of control in the public interest. Under such circumstances, private interest runs rampant, overlooking , or not being concerned with, the efficiencies and facilities that are required for the building of urban areas that must serve lakhs of people, varying functions that must be performed in harmony, and needs of the population that must be fulfilled.
The second concern of planning has to do with future change, ranging from new in hitherto rural environs to rebuilding and modifying what exists so that it is integrated with what is to be. A comprehensive plan must provided the guide lines for new growth at the same time as it makes proposals for the correction of the consequences of past growth.
The basis pattern or scheme of the Urban Delhi plan, is to organize all new developments, and re-form old areas, on the basis of large District relatively self- contained for daily purpose and needs: housing, employment, with district and neighborhood centers for recreation shopping, commercial, cultural activities. This close location relationship is of over-riding importance in greatly diminishing the demands on the costs of transport and highways.
This pattern and its economics are a main feature of The Delhi imperative which will be discussed latter, of course, there will be a very large remaining component of central employment in Government and business. But it is anticipated that this will be a smaller percentage of employees and customer travel then now.
The nuclei or constituent cells of the ‘District’ and a series of compact residential neighborhood based on the pattern of elementary schools and area unpierced by through traffic streets so that children can walk safely unaccompanied to school. Each such neighborhood has its own small community and shopping center for daily needs.
Regional plan: principles, objectives and Methods .
The Delhi plan is so prepared that it meets these objectives:
First - The best possible location of employment centre and housing facilities. This involves creating the optimum distribution of work centers of different types in such a way as (1) to make employees housing both accessible to such centers and also protected from any deleterious influences that might derive from their unplanned juxtaposition, and (2) to ensure the location of employment centers which are in places accessible to needed facilities and services.
Second - The elimination of slums and squatting and provision of adequate housing and related community facilities. This requires planning not only for well designed structure with full utilizes but also their arrangement visa- vis regardless of occupation and income, can benefit from them. Housing for low income families is especially important.
Third - The development adequate transportation facilities for the movement of people and goods, bearing in mind the anticipated improvement due to locality- district development described above, for the city. In the case of Delhi great care has been taken to achieve a consider-able degree of segregation of bicycle traffic from others from, and especially to create certain separate bicycle tracks.
Fourth – The rebuilding of deteriorated areas and the application of effective regulations for new developments, consistent with the three above objectives.
Fifth – The combination of utilitarian solutions to development problems.
Sixth - The assignment of stages for development.
Seventh – The analysis of the cost of undertaking the solutions to planning problems.
Experience has shown that a balanced, comprehensive development plan is impossible to achieve unless all of these objectives are met. The first five objectives are, of course, basic. But the best and most practicable comprehensive plans must include, in addition, detailed attention to objective 6 and 7. The fixing of priorities among various goals is closely connected with means at hand for their fulfillment. It is clear that scarcely a city in the world has the resources to undertake all of the improvements and development that would be desirable. The more restricted the resources, the more imperative is it to provide means and allocate their disbursement according to priority. The great benefit of such a procedure is that, no matter how little or how much can be undertaken in a particular five- year period, what is done fits into a long run plan, becomes organic rather than haphazard.
Eighteen - Having arrived at possible for these needs in the first step, i.e. the initial plan, studies must continue, actual conditions checked against the projections of the plan. Continued study and thought must be directed towards further planning, partly to keep in motion the execution of the present plan, and partly to make any adjustments that may become necessary as new factors emerge to affect the area.
Continued planning is mandatory for still another reason. The present plan is based on detailed analysis, from which major principles and proposals guiding the future growth of Delhi have been developed. This general framework is supplemented by prototype solutions to problems of various sorts, with suitable modification and consistent with sound planning.
The plan deals with four distinguishable but closely built-in areas up to 1981.
(1) Delhi-New Delhi urban area, present and future: 170 sq.miles.(2) Rural areas in DelhiTerritiry:400 sq.miles.(3) Metropolitan Area: that it towns very close to Delhi whose development is inextricably connected- Loni, Ghaziabad, Faridabad, Bahadurgarh, Narela and to an extent Sonepat also : about 800 sq. miles.(4) The National Capital Region: about 4,500 sq. miles.
The need for a protective inviolable green-belt around the city to limit its physical growth, to prevent the ultimate oozing together of Delhi and nearby cities, to provide the availability of close-at- hand countryside to the urban family.
The gross residential densities of population vary from high to low in various part of the future city, from 50 persons per acre to 250. These latter densities are higher than desirable. They characterize the old city areas and certain central densification areas. They are a considerable improvement over the present congestion. After much consideration, it seems the best that can be accomplished now.
Rural Areas in the Delhi Territory . There are over 300 villages. This problem has a negative or holding action, aspect, and a more creative one.
On the holding action side, one most never repeat the tragic village enveloping or village engulfing as illustrated by the example of Muburkapur kotla. A number of village will be included in the proposed expansion of Delhi urban area, whose inhabitants will need to be relocated, instead of hemming in the mud houses and the cattle and the insanitation.

On the fully creative side, the plan is to include groups of villages in small clusters surrounding a central village which has or ill have facilities such as a mandi a secondary school, processing industries in some cases facilities which the individual village cannot afford. The villages in the group are close enough to this centre so that they can readily make use of and benefit from them. New work centers for handicrafts presently located in the crowded squalor, scattered all over Delhi and shahdara are all proposed for the Urban Villages surrounding Delhi.
Metropolitan Area:This embraces the group of towns around Delhi previously listed. Being within Delhi s ’orbit they have manifold financial, purchasing , marketing and other contact with a rather high degree of dependence on Delhi . Part of their population works in Delhi. Several points are specifically noted here. In addition to their own rate of growth, it is hoped they will so develop as to be able to offer homes and employment to a substantial number of in-migrant workers who would otherwise reach Delhi. Aside of the general merit of this thesis, it will be noted in the Land Use chapter that Delhi’s urban limits are pushed as par out as they economically can be. Beyond them, development costs would be excessive due to problem of topography , rock – out –cropping , flooding . It would cost much more to develop and to channel the people into these towns. These towns are actually a little nearer to Delhi’s than could be normally wished for maintenance of separate identity. For prevention of joining by mutual spread. To take care of this, a particularly generous green-belt must be established , and vigilantly maintained.
National Capital Region : This varies from point to point , from some 70 miles to 115 miles. Actually , from several view-points, it would be will to develop these towns in the manner prescribed for the ‘ring’ towns in the metropolitan area. The whole question of counter-magnets is of course on a national plan as well. Not only is it a question of developing over the nation the kinds of cities here noted and there surrounding rural areas. Of the size from, say 25,000 to several lakhs. Industrially and commercially. This is already receiving substantial thought. What may not be so generally realized is that the four largest Indian cities Delhi, Bombay , Calcutta and Madras are disproportionately absorbing the cultural life of the country as well –which means that factors is operating in favour of the excessive magnetism of the metropolis , The erstwhile cultural life of relatively large cities such as Lucknow, Allahabad , Agra, Nagpur , has deteriorated markedly in the last two decades. They thus lost ground vis-à-vis the metropolises.
The Delhi Imperative :
The Delhi Imperative is used in this context to describe the essential concepts, measures and attitudes towards the plan that are indispensable. These imperative must be the guiding factors in the evaluation of the individual action programmes and projects and in the detailed project planning.
The Delhi Imperative-I Economy:
The first of the imperatives is ECONOMY. Unless economy permeates THE PLAN, from conception through implementation to operation, the country cannot afford such plans. THE PLAN must offer the cheapest way of accomplishing absolutely necessary results, cheaper than any other plan.
The built- in economy of self- contained districts with work centers in and around the districts is necessary in order to minimize the journey to work. The potential of staggered and double shift of industries will save cost of rental and of equipment-twice the production can be turned out on the same premises and with the same equipment. In addition, economics in land and transport by diminishing peak loads will be achieved.
The economy of electric supply price policy, air conditioning and water supply must be kept in mind. An inducement for two shifts in industry can be made by lowering substantially the industrial rates for night users. The present trends in air- conditioning loads seem to be indiscriminately using precious power. The normal device of surcharge on domestic consumption can be used.
The economy in redevelopment of the walled city through minimal road changes and widening is an important consideration. Thus obtaining a feature for the Central city which western cities. The world over are striving for the elimination of through traffic. Along with this, the economy of and use through the densification of certain residential areas in the New Delhi garden city. The over generous gardens provided with each bungalow make present densities as low as three families per acre, This can be brought up to densities comparable to the extended residential area of 16 to 20 dwelling units, per acre, without altering the character and board tree- lined avenues. This will bring Government employees closer to their offices, the secretariat, reducing time and cost of transport. The cost of land for the densification would be an additional saving.
The economy of construction is another feature with the maximum use of the minimum urban row house built around a utility core, which permits self- help participation in the construction. Development of the urban village on the periphery of the city for handicrafts presently manufactured in the slum areas of the old city should be undertaken. Economies of land, construction and development are obvious. Simplified construction of schools is another major
economy. It is imperative that all of these devices should be set into a time-table of development to avoid premature subdivisions without utilites. With this time-table of development the obvious economies in large scale land acquisition permit enormous savings in land costs.
The Delhi Imperative-III:
In the initial stage and the subsequent decade for the development of New Delhi, the imperial garden city, large scale land acquisition was carried out and effective planning of the new city emerged. In the latter years this policy was ignored and since partition land speculation has vitally prohibited the low income families from obtaining a reasonable lot, forcing them into the presently overcrowded slum areas. Without large scale acquisition as a general policy long before the need for each specific use, planning cannot be fully effectuated. Public purchase and ownership and subsequent phased development of land creates legitimate land value enhancement, which when leased for commercial and industrial use of high level residential can produce substantial revenues which should be applied to the social goals, helping development or supply of land for development would then become a general public consideration based on the overall welfare of the city.
The Delhi Imperative-III
Active Social Component :
Physical planning and redevelopment are not in themselves enough. Physical improvement may be refused by people affected, or accepted reluctantly after much delay and thus obstruct the development programme. The physical improvement in many cases disrupts social patterns and relationships and for some people the net balance is negative. This means planners must deal with the people considerably before the improvement or action is undertaken. Their problems and needs must be considered and where feasible provided for in the new location and layout. This problem of communicating the plan to the people can mean the difference between successful and negative development . Facilities and amenities at certain socials levels are actually rejected and money wasted, especially in the sanitary facilities. There are many organizations presently in Delhi that provided part of these social services. They must be formed and combined into sensitive groups of social workers within each agency carrying out the work.
The Delhi Imperative- iv
Promptness in Small projects: citizens

Satisfaction in the plan.
In the nature or things, planning is a long term process whose benefits take years to flower, particularly when there are limited resources. There, are however, innumerable small items which can be accomplished quickly, whose remedy is simple and inexpensive. Vast amounts of good – will for he plan can be achieved by these small actions. They require alertness, and trained observation by the officials.
The Delhi Imperative – v.
Determination and Decisiveness in Execution.
Enforcement , Follow-Through.
Examples of failure to execute a project through determination and latter enforcement and follow- through, with adequate staff has done great damage to the planning administration as a whole.
Planning development is a complex, sensitive job. Each operation is itself difficult and compounded because of their interdependency. Slums cannot be cleared until new development is ready and then the empty slums must be kept empty and not be occupied, so that redevelopment will not be hampered. Employment opportunities and locations must be synchronized with housing locations and power availability. This kind of planning and development needs adequate supervisory and technical staff. The organization whose sole business and duty is to carry forward these activities from start to finish must be et up to coordinate and negotiate and complete. The Delhi Imperative is a recognition of these necessities.
CHAPTER ONE
ORIGIN AND GROWTH OF DELHI
Here we Stand in Delhi city, symbol of old India and the new. It is that the narrow lanes and houses or Old Delhi or the wide spaces and rather pretentious buildings of New Delhi that count , but the spirit of this ancient city. For Delhi has been an epitome of India’s history with its succession of glory and disaster , and with its great capacity to absorb many cultures and yet remain itself . It is a gem with many facets, some bright and some darkened by age, Presenting the course of India life and thought during the ages . Even the stones here whisper to our ears of the ages of Ling ago and the air we breathe is full of the dust and fragrance of the past, as also of the fresh and piercing winds of the present . we face the good and of India in Delhi city which has been the grave of many empires and the nursery of a republic . what a tremendous story is here; the tradition of millennia of our history surrounds us at every step, and the procession of innumerable generations passes by before our eyes…’ –Jawaharlal Nehru
The origin of Delhi is lost in antiquity . The earliest settlement is traceable to the 10th century B.C., to the epic period of the Mahabharate. It is believed that the pandavas founded the city of Indraprastha somewhere between the historic Purana Qila and Humayun,s Tomb. However, no archeological evidence has, as yet, been unearthed to support this 3,000 year old origin of this ancient capital . The past of this city remains shrouded in darkness until about the 1st century B.C. before the Mecedonian invasions when Raja Dillu of the Mauryan Dynasty founded a new city near about the site where the Qutab Minar stands today . It is believed that christened the city after his own name and all the corrupted names ,Delhi ,Delhi, Dilli, seem to follow after the original name given by Raja Dillu.
There is again a Lapse of another 10 centuries or so until any concrete evidence is found about the existence of a city in this general vicinity. It is said that in the middle of the 11 th
century a Rajput King named Anangpal founded another city on the old ruins of the city founded by Raja Dillu . Under his reign ,and under the other Rajput Kings that followed and ruled for over a century , numerous works were executed for the development of the city and to provide various amenities for the citizen . It is believed that several dams and tanks were constructed for providing adequate water supply to the city . The well-Known Qilla Rai Pithora was built according to the Rajupt style of architecture.
As the centre of Hindu Empire , it flourished till the end of the 12th century when the defeat of Prithvi Raj Chouhan , the last of the RAJPUT kings , Delhi passed into the hands of the Muslim invaders ,. The Muslims established it as their capital until their empire crumbled in the 18 th
century and the Marathas raided the city.
The choosing of Delhi , therefore , as the capital of successive generation of ruler and empires was not altogether accidental but with several definite advantages . it is in this light and
ovserving these consideration that the growth of Delhi has to be viewed and analysed through its days of glory and defeat, sometimes patronized by the rulers and at other neglected by them but still rising as if from its ashes for it could not be ignored for the long .
The Rajput Kings developed a system of dams and tanks for regular water supply to the city and built forte (Qila Rai pithora) to suit their needs and for their deference. No sketches or plans are available for this period.
For the next three centuries (from early 13 th century to early 16th century ) various Sultans ruled Delhi and developed their capitals at several places in the vicinity of the Qutav Minar , Numerous habitations , some of which were large enough to be termed as cities, took shape during this period and became seats of the ruling Kings.
Qutab ud- Din Alvak , the founder the Slave Dynasty , established his capital towards the end of the 12th century on the same site from where the Rajput Kings ruled. He gave India the famous Qutab Minar, a 238’ high tower from the top of which can be viewed the entire landscape of Delhi . This tower stands on one side of the mosque which was later enlarged to twice its original size by ALLA- ud –Din Khilji in the 13th century , Qutab–ud-Din extended his city towards the north –east in the plains.
Another important capital stood further north-east of the Qutab Minar on the sits of the present ruined ramparts of Siri. This capital city was built at the end of the 13 th century. The village of Shahpur Jat is inside the fortification of these ruins.
Between the late 13th century and early 14th century , when ALLa-ud-Din Khilji was the ruler Delhi is said to have become very important ,begin both a political capital and a commercial and cultural centre.
When the Tughlak Dynasty seiized power ,the founder King , Mohd, Tughlak built his new capital in 1320 A.D. 5miles east of the old city and gave it a new name, Tughlakabad. This new city , however, had to be abandoned because of scarcity of water. The seat of the Government was, therefore , moved back to the old city near Qutab Minar by the succeeding Tughlak who extended the city further northeast , built new fortifications around it and gave at a new name, Jahanpanah, in 1330 A.D. These new settlements were between the old cities near Qutab Minar and Siri Fort.
The last Tughlak ruler , Firoz Shah Tughlak , however abandoned this site altogether and in 1354 A .D. moved his capital further north near the ancient site of Indraprastha and founded a new city named Firozabad. He also founded a university for the study of Arabic literature and opened up the Yamuna Canal with a branch to Firozabad . The new city developed rapidly and the population started increasing .
The Sultan were great builders , and the spirit of their rule has been preserved in their architectural achievements. It is believed that Delhi had several colleges for the study and spread of Arabic literature , a number of hospital , extensive bazaar and marketing areas, Public baths and recreation gardens etc. and luxurious palaces , Delhi was the noblest and the largest city in the Islamic world. It is said that under the reign of Mohd. Tughlak poets sang of Delhi as a ‘Twin sister of Heaven , a very paradise on earth ‘ . It combined strength with beauty and elegance with comport .
In the latter half of the 14 th century , Amir Taimur the Lame invaded Delhi . He pillaged the city to this heart’s content and took away enormous wealth from this ancient city. Than the last of the Sultan dynasty shifted the capital to Agra and Delhi faced a temporary set-back in important , until Babar , the first Moghal ruler, re-established Delhi as the seat of his empire. The city again revived in the importance and became a most important commercial and cultural centre besides being the seat of the Moghal empire.
Delhi later faced another set-back when Akbar and Jahangir moved their headquarters to Fatehpur Sikri and Agra. Akbar planned and built the fascinating capital at Fatehpur Sikri but eventually had to abandon it became of scarcity of water. It is of a significant importance to town planners because this citadel is a magnificent contribution of Moghal Architecture and still stands today as one of the principal landmarks of Moghal rule in India.
Delhi again got nit due importance when Shahjahan the fifth Moghal ruler, returned to this ancient city in 1648 A.D . and undertook the construction of an altogether new capital north of Firozabad . He built an entirely new city on the banks of the Yamuna and named it ‘Shahjahanabad’. He also built a massive fortification around it and the city was approached by seven gateways from north . west and south . The east side touched the waters of the Yamuna . He also built his royal palace called the Red Fort to the north-east , inside this walled city . In Chandni Chowk , the great bazaar of the orient , where motor cars and tangas ply today, used to flow the beautiful canal ending against the eastern entrance of Fatehpuri Mosque , true west of the main entrance to the palace. Shahjahan also built the great Jama Masjid. These building have given Delhi a majestic dignity which it has since retained.
This Moghal Emperor who gave the world the ‘Taj Mahal’ was a great architect and planner. His design of the city as he laid it then , had wide roads, gracious parks and houses of nobles with large courtyards. The city was planned to meet the community requirement of the times. Public residential streets were Kept narrow to protect the people on the streets from the scorching summer sun and biting wind of the winter . The layout of the city itself has much to commend it. Quist streets meander past the houses has much to commend it. Quiet streets meander past the houses which were closely built and not more than two storeys high . The city hummed with activity. Business flourished and travelers from far and wide came not only to
see the Moghal splendor but also to partake in the rich cultural life of this city. It is said that the population of Shahjahanabad arose to a lakh and half during his reign.
Shahjahan’s successor . Aurangzab , further developed the city.Beacuse of increasing activities in commerce and trade , It was extended southwards to Firozabad and the population grew to over two lakhs . The lower started of the society come to inhabit the older cities near Qutab Minar , Siri . etc. These now stand in ruins reminding the present generation of their glorious past and the relentless march of history .
Shahjahanabad of the 17th century combined in itself the alien Moghal architecture with its one spirit of concentration . The whole city is reminiscent of the Moghal architectural conceptions and varied necessities of the 17th century life. Occasional invasions from outside made it essential for the inhabitants to live together with walls and gates to protect them. The city was inhabited mainly by rich landlords having large estates and therefore needing extra protection . People were not very different from one another. They had almost the same callings and necessities. Such a compactness of the social classes gave rise to the development and construction of compact structures for living.
Today the same area , Having grown in population over the past three centuries within the precincts of its fortification s. presents a very dismal picture of sub human existence in its narrow and rather dark lanes flanked by two and three storeyed building s, its exposed sullage and storm water drains running on both sides of dead and streets.
With the fall of the Moghal empire during the middle of the 18 th century , Delhi faced another series of calamities . Chaotic condition and lawlessness prevailed all over the ancient city . First came the Maharatta raids and then the founds among the nobles themselves. This culminated in Nadir Shahs mass massacre in chandi Chowk , in which almost two thirds of the population was slaughtered . The city was left in desolation and lost much of its glory.
At this stage the Maharattas marched in and secured control over the city. Their power, however, did not last very long. The British defeated them in 1803 A.D. and the city future passed into the hands of the new and altogether foreign masters. At this time the city population was less than a lakh; except for parts of shahjahananbad, Delhi was nothing but a large grave.
It is interesting to prove the reason that led succeeding dynasties of rulers to make this historic city the seat of their power.
Ancient legend has it that He who rules Delhi rules India and it is in recognition of its strategic position that Delhi has been the ancient and historic capital of this sub-continent for centuries.
Delhi occupied a very strategic position in the way of onward march of the wave upon wave of invaders from the North and North-west. Once the invading army crossed the Punjab, the fertile land of the five rivers, the ruling king last chance of keeping it from sweeping across the rich plains of the Gangetic valley was to fight outside Delhi, protected by the river Yamuna in the east and the Aravali Ranges in the west and south which protrude up to the northern end of the present city.
Besides its strategic importance from defence considerations, there are several other factors governing the location of this city. All over the world, history has given evidence that key settlements spring up at that point where a river leaves the hills and enters the plains and become navigable, or where two major thoroughfares or trade routes cross, or where there is change in the mode of transportation of goods and passengers.
Taking an example in India, the city of Hardwar grew on the banks of the holy Ganga as it emerged out of the mountains and entered the plains.
Delhi, located on the right bank of the yamuna, is not exactly on the above breakline, but a little lower down stream. It is, however at the convergence of several trade routes both national and international. Its primary importance as a market centre derived from the fact that roads converge here from north-west, east, south and west. It early became the major distribution centre for the entire north and north-west India. The river crossing was an additional important factor for the growth of a settlement.
The river Yamuna gave the city a perennial supply of water for drinking purpose and for the other needs of the community. The raised plateau on the right bank of the river Yamuna gave an ideal location for the capital, free from floods and at the same time, having due protection on the west from the possible invaders. The Himalayan ranges in the north and west and desert land of Rajasthan in the south and –west Delhi a temperate in the south and –west give Delhi a temperate climate.
Moreover, Delhi has a vast hinterland on the north-western portion, rich an agriculture , irrigated by the Yamuna and the Hindon. It is, therefore, natural it is slowly to emerge as a major marketing centre.
When railways were built , Delhi again became the hub of the network. Railway lines coverage here from the Punjab, Calcutta, Madras and Bombay. This added further importance to this city and also enlarged its trading hinterland.
Once the British got control, peace prevailed in Delhi save for the 1857 disturbances – famous as the first war of Indian Independence – and the communal riots on the eve of Independence 1947. In 1829 the British constituted the District of Delhi including two paraganas in the south and the north with shahjahanbad as the centre. At this time the settlement near Indraprastha was no more than a small suburb and the city near Qutab Minar had declined to nothing more than country town.
In the initial stage the new masters settled within the walled city in the Kashmere Gate area, but later on, as conditions improved, they crossed the fortifications to the north and established an entirely new settlement now known as the Civil Lines. This new settlement had informal planning with large and spacious residential plots. An extensive park area between the walled city of shahjahanbad and the new settlement of Civil Lines was created to act as a buffer between the rulers and the ruled. The present Nicholreson park, Qudsia Garden etc. from part of this buffer area. In the initial stages the new settlement was confined to the area east of the northern range of the Aravalis but as time passed and the British consolidated their power, the city continued to flourish, new abadies being developed towards the west of the ridge well. A small shopping center (Exchange stores and service station) was built for their daily needs in the Civil Lines area, whereas the major and fashionable shopping centre, having facilities like restaurants, theaters, cinemas, dance – halls etc., was built in the cashmere Gate, area. A church and a collage were also built in this area.
After the 1857 disturbances Delhi started growing faster. In the latter half of the 19 th century, Delhi saw the coming of the railways and postal services. Metalled roads were built to link various parts of the city. Some industries came to be located. Commerce also developed, goods and commodities started coming in from distant places and Delhi, ones again, became one for the largest commercial and cultural centers of north and north-western India.
At the historic Delhi Darbar in 1911,the visiting king George v announced the shifting of the capital of British India from Calcutta to Delhi. Calcutta had been the capital in the very early stages because the headquarters of the British tradesmen – the East India Company –were located there. This was a very important announcement for Delhi and its impact can be seen through the years and is still being felt. Following this announcement, what is known as the old secretariat of the Imperial Government was built in Civil Lines on the right bank of the Yamuna. The victory palace or viceregal Lodge was built on the western colony was also developed for the vicergal staff. Barracks for the police guard were also developed in the area. Except for the temporary secretariat, all these were later transferred to the University of Delhi which was established in 1924. The vice-Chancellor occupies the same room that viceroy used to occupy. The present residential colony of Maurice Nagar was developed by the University on the same site where the original staff quarters, called Rajpur quarters, of the viceregal lodge existed, some of the barracks still existing around Miranda House, Arts Faculty and the New library buildings are reminiscent of the police and military guards residences. The coronation pillar to the far north of the new settlement is the historical landmark reminding the Delhi citizens and the country of December 12th ,1911 when king George v was crowned in Delhi as the Emperor of India.
Along with this proclamation, King George v also announced that an entirely new city would be built as the capital of British India. It may be of interest to note here that while the site selection committee recommended Saugor in the Central provinces as the site for the new capital location, the British Government still chose New Delhi against their recommendations to follow the ageold tradition that he who rules Delhi rules India.

The British Government appointed a committee of architects headed by Sir Edwin Lutyenes to plan the new capital. Messrs . Luteyens and Baker were the principal architects in a committee which planned the layout of the new Capital city and saw it executed according to their plans. The original site to the north of shahjahanbad was abounded as the land was divided by the ridge and parts of it were also subject to inundation during the monsoons.
The New city therefore was located at Raisins, south of Shahjahanabad and east of the ancient city of Indraprastha. Today New Delhi stands before the country as a unique example of the garden city planning movement in the world.Like the Civil Lines settlement to the north , New Delhi is also separated and Kept away from Shahjahanabad by a rather narrow but long park strip now called Ram Lila Ground, running along the southern fortifications of the Old City.
The New Delhi plan followed the garden city pattern , with wide avenues having double rows of these on either side , creating vistas, and connecting various points of interest. Almost every, and connecting various points of interest. Almost every major road has a specific focal point closing the vista so that no avenue is lost in the horizon. Beside the diagonal road pattern, the most prominent feature of the entire plan is the central Vista Park starting from Irwin Stadium (now called National stadium) in the east through the Memorial Arch, the imperial Secretariat (now named Central Secretariat) culminating in the west oat the Viceroy’s palace (now Rashtra- pati Bhawan ) against the slopes of thye Aravalis . This was the main east-west axis of the new city, and new has become the focal point where government employees by the tens of thousands come every day from far flung areas of the Metropolis . The two secretariat block and the president. House are some of the very finest contributions combining Roman classic architecture with Indian architectural details. The council Chamber ( which now houses the parliament of Free India) was built to the north-east of the North block of the Secretariat, while similar space was Kept to the south- east of the South block to house a proposed – but never built on the site- Federal Court (now called Supreme Court) this central park divided the new city in to two parts . Towards the northern end was located the fashionable shopping centre , called Connaught place ,designed around a circular park. To the west of this shopping centre were located the residences of the lower and middle income employees whereas to the east and the south , but still north of the central vists, larger houses were built to accommodate senior Indian officials. The southern portion of the city was reserved for vary senior official of the government ,who were almost all British . The area was laid out in hexagonal pattern and was rather of a plantation type than urban in pattern . plots were 4to 5 of the estate. Immediately to the south of this garden was located the Willingdon ( now called Safdarjang) Airport . It was not expected that new Delhi would grow beyond this point. Adequate parks and playground s were provided in the plan for meeting the needs of the new town . Clerks quarters were laid out around large open squares, so as to provide plenty of play areas in the immediate vicinity of the houses where the children could play and be still under the eyes of their mother. Gole Market , a local shopping centre was provided to meet their daily needs. No shopping centre was provided in the south side of the vista since only very senior government officials lived there who could easily drive to the main commercial and retail business center, Connaught place , located in the north. just north of this commercial centre
was built the new Delhi railway Station . Adequate land was provided for schools to meet the then projected foreign population of the new capital ; no school for servants were provided. Three large hospitals were built to provide medical facilities to the residents . Whereas the railway line and the river were the limits of the new town in the east; the northern range of the Aravalis provided a natural barrio in the west where horse riding , hunting and other sports were developed. A race course and golf course were developed in the southern portion to provided additional sport facilities for the senior Government officials. The total plan area covered about 3,200 acres and was planned for a projected population of about 65,000.
Pahar ganj, which was included by the Committee in the proposed plan areas , was later on excluded because of the alleged high Cost of acquisition and the difficulty of paying compensation to those who would have been displaced by this programme . It was than felt that the cost of buying paharganj , which then had nothing more than a few hundred houses, would be prohibitive and thus was left out. But with the growth of the new city, The pressure of development was bound to grow and in a few years time paharganj became one of the most thickly population areas. Its ideal location between the old and the new city was the key factor, because of this lack of foresight and planning the entire Paharganj is now a large slum. The cost of clearing it and rebuilding it today is many times more than it would have been there docades ago. This is a good illustration to show how piece-meal planning and lack of foresight can hamper the over-all development of a city. Leaving Paharganj to its own fate was a big mistake , but Messrs. Lutyens and Baker, While preparing their layout plan for New Delhi, appear have to entirely ignored the old city of shahjahanbad and its extensions to the west. It is quite conceivable that the British Government had directed these architects not to prepare an integrated plan for the entire population of Delhi, but to plan the new capital city in such a manner that in stood as a separate entity quite independent capital with the minimum number of physical links with the old city. The areas of shahjahanbad were as densely populated then as in the beginning of 1947 when additional population was thrust upon it. No thought was given to the preparation of over-all plan for the entire metropolitan area nor was any scheme prepared for re-distribution of the population from the older areas to the new settlements. If the two cities had been planned to exist and function together, better physical links would have been provided to connect the two, but this obviously was not the architects, and resulted in the disastrous consequences that area all too obvious today.
With the decision to would a new capital city south of shahjahanbad, it was felt that the cantonment, then located to the north-west of the viceregal lodge in the Civil Lines should also be moved somewhere in the south and not too afr from thye new city. Thus about 10,000 acres were notified and acquired towards the southwest of the new capital. The site lies between Delhi Jaipur Railway Line and the western slopes of the ridge. It is directly linked with Delhi by the Delhi- Gurgaon Road. North of this site was developed a large farm covering about 1,000 acres for facilities in agricultural research Institute. It now also houses the National physical Laboratory.
New Delhi was planned and developed as a capital city by the then Government of India who retained ownership of all the land within its limits, whether it was built by Government or by the private sector. Given such ideal conditions and with a preconceived plan he future development of Delhi should have proceeded on an integrated pattern based on sound planning principles. But unfortunately it did not happen so. A close examination of the current situation shows that necessary regulatory powers were not fully enforced and there was no coordination of activities are plans prepared by the various government agencies involved in land improvement and building construction.
In 1939 Government set up Delhi Development Committee to study the existing situation and to make suitable recommendations so as to guide the future development of the capital. The committee recommended that No single authority had a complete picture in any general or overall plan for the capital, and therefore while there was no conscious intent to work at cross purpose, this appeared inevitable because of the working of so many agencies involved in planning and development. The Committee therefore recommended that an advisory body be formed at the technical level to coordinate the activities and programmes of the various government agencies involved.
The Advisory Committee had hardly been constituted when the second world war broke out and this had its own effect on the entire pattern of the city, and the Advisory Committee could not function. Industry grew wherever it could find place to locate itself. Delhi was no more only a capital or the major commercial centre for distribution shipment of goods to the north and the north-west. Industry had started taking its requisits place in the economy of the city. This sporadic industrial growth and increase in commercial activities attracted more and more people from the neighbouring areas. During the war years substantial migration took place from the adjoining villages and the towns to meet the increasing labour requirements. Population grew very rapidly and assumed enormous proportions. The large influx of people who migrated from the neighbouring areas increased the total population of Delhi from 348,000 in 1931 to 522,000 in 1941. The city assumed altogether new dimensions.
As a result of the war, government activities increased rapidly. New areas had to be developed to house this additional population. Lodi colony with two storyed apartments on grid iron pattern was developed during this period of emergency. The Lodi estate bungalows, west of the golf course and partly wedged on the east side of the Lodi Gardens, were built for senior officials. For military personnel additional accommodation was built in the new cantonment to the south-west of this new city.
Hundreds of single and two storeyed temporary hutments were built around the secretariat blocks to provide additional office accommodation to meet the war needs. In addition to these hutments barracks were built in the vacant plots around the Hexagon, which had originally been allocated to the princely states(Gwalior House, Jodhpur House, Bundi House, Bikaner House etc). Most of these barracks still stand today even though they have outlived their leaves.
When the war over in 1945, the question of Independence for India was energetically taken up. The British Government ultimately agreed to transfer power to India in August 1947. Along with this new era also came the partition of the sub-continent into two independent dominions of India and Pakistan . Communal riots out on the eve of independence and there was mass movement of population across the borders . Refugees from west Punjab ,Baluchistan ,Sind and North west Frontier Province started coming to Delhi and within a period of two months Delhi had to accept about five Lakhs of additional refugee population . These were the uprooted families who sought shelter in the lap of free India. There were, however , some Muslim families who had left Delhi and gone to Pakistan. Delhi was not at all prepared for this Sudden and unprecedented influx. Government , however rose to the occasion and immediately set up numerous camps to houses these families, The Immediate problem was shelter , and for this purpose nothing could be faster than pitching of tents in all available open spaces . This had to be done in sufficiently large concentrations to give these families a sense of security , besides providing immediate shelter from the monsoons . The camp at Kingsway was the largest in Delhi , having some three lakhs of people . Other camps were established at Tibbia college in Karol Bagh and at Shahdara. Along with this programme of providing immediate and temporary shelter , the Rehabilitation Ministry, which was constituted along with the formation of the new Government , also started preparing long term programmes for the permant rehabilitation of these families . consequently agricultural lands were acquired all around Delhi wherever immediately available. First preference was given to evacuees agricultural property . Construction of pucca houses was undertaken in south and west Delhi where land was cleared , developed, and roads were land out. As a result , a number of townships sprang up all around the city except in the north where land was subject to floods almost every year. Nizamuddin ,Lajpat Naghar , Kalkaji and Malviya Naghar were built in the south. The two Rajendra Nagars , the three Patel Naghar , Moti Naghar , Ramesh Naghar Tilak Naghar , were built in west Delhi . In the north , the Kingsway camp was developed as a permanent rehabilitation colony ,Gandhi Nagar was built in Shahdara . As these various colonies were getting nearing completion , people from these camps were moved into these areas for permanent rehabilitation . Some of the land occupied by these colonies was already under the control of the Government , which helped to a great extent in speeding up the construction work. In each of these colonies provision was made for some shops, schools , clinics , post offices etc. Though on very marginal standards. These were emergency projects and no time was available for formulating or following planning standards. It was a national emergency and had to be met with immediate action . This situation was, however, must unfortunate , since it resulted in a legacy of large areas having developed at below standard levels. With the formation of the national government now responsibilities were added and expansion of governmental activity become essential . The existing two secretariat blocks were no longer sufficient to accommodate the new offices . The temporary barracks and hutments

built during the war around the secretariat blocks and around the Hexagon came handy and new offices were located in them on a temporary basis until permanent accommodation could be found or built. Along with this addition in government activity , there was need for providing residential accommodation for these new employees. The Ministry of Works , Housing and Supply , therefore , undertook the construetion of Vinay Nagar Shan nagar , Man nagar , Kaka Nagar , and Moti Nagar in the south- west. They also development Sunder Nagar , Golf Links , Jorbagh and Krishan Nagar and sold the developed plots for private construction . The Ministry of railways undertook construction of houses for their own employees. . Private colonizers came in the market and started buying land and developed it for sale to the general public . All these activities helped a great deal to overcome the acute shortage in houses . New commercial areas were also developed and new industries started taking shape in the west and in the south.
Thus Delhi started expanding in all directions . unfortunately , there was no over-all plan to follow and the advisory committee , mentioned earlier , was just getting started . These various new colonies scattered in all directions had most inadequate road connections , little transportation facilities and a very marginal system of public utilities . These new disjointed towns provided only physical shelter to the mass population but did not solve the real rehabilitation problem on a community basis . This, however , could not be expected since the problem was tackled on piece-meal basis . They increased the overhead and social costs of the community which manifested itself in increasing number of accidents, unending delay and grater insecurity number of accidents , unending delay and grater insecurity ,
The Delhi of to-day ,having a population of about 22 lakhs, has arrived at one of its most important stages of development Through the centuries of its chequered history. The physical characteristics are no less representative of the vicissitudes the city of Delhi has gone through . Almost with every change of dynasty, a new Delhi was born and laid claims to independence from the earlier ones . This led to the present sporadic growth spread over vast areas in all direction. Delhi has therefore seen the rise and fall of many impires and has absorbed the cultyre and tradition of many generations and of different people. The physical pattern within Shahjahanabad was geared to the 17th century environment when the tempo of life was slow, and the inter-relationship between home, work and play was more intimate and the family relationship was more close. But , with the growth of population and increase in trade and commerce, government and industrial activity, acute congestion , undesirable mixture of land uses, and insanitary conditions, the pleasant city has been reduced to an anachronism in the 20th century. Adjacent to it, but standing apart from it, is Lutyen New Delhi with its extravagant and in some cases improper use of valuable land. There are rehabilitation colonies requiring utilities and services and community facilities . There are also the new Government built colonies attempting to give shelter to its employees. These also are lacking in community facilities. Hence in Delhi the old and the new meet both being inadequate of the demand of the times and the future. The job of the planner is to harmonize the two both at the physical and the social level. Failure to do both this will result in increasing conflicts and tensions. It is with this thought in mind that this plan has seen conceived. It has high objective but is bazed on a realistic approach towards current and future
problems. It attempts both to solve the consequence of past growth and to anticipate growth and change in the future.
CHAPTER TWO
REGIONAL STUDY
Summary Statement
The purpose of this chapter is to review I broad terms of regional problems which areas in the acres surrounding and including Delhi, and to suggest t terms of the planning process the general approach which should be adopted towards these problems as well as the regional limits in which different types of organization planning, and joint action will be appropriate.
In view of the fact that most of this report will deal with the problems of the metropolitan centre of Delhi, and its surroundings towns and rural areas, attention is given in this chapter to the broad planning problems of the larger areas.
It is the conviction underlying this report that the Regional planning here outlined is fully as essential for Delhi itself, as for each single city in the Region. It will be clear after the breakfast consideration that no single city or area within the Regional orbit, can be developed with assurance and maximum efficiency and minimum of waste, without close inter-planning with the functional and geographic Regional areas.
This chapter is placed in the forefront of the Report to emphasize this importance. The fact that the major part of the report deals with Delhi Urban area present and future, most not be equated with the relative importance of the two. This disproportion is simply explained: in the time and with the manpower available it was impossible to do both with anything like equal thoroughness. Delhi itself is certainly the most urgent, with slums, its squatters, its new- colonies without sanitation and with inadequate water, and above all its rapid growth. It is Delhi with its vital functions and symbolic importance that demands priority.
Three important points must be stated and underlined. That in creating the Delhi- Urban plan with its carefull investigation, studies, proposals, we had before us the specific Regional requirements and the interlinking of Urban, Rural, Regional. It will be seen in this chapter that there is a clear picture of the specific Regional requirements and of the inextricably close relationship of the two.
This chapter formulates and outlines the concepts of the Regions, (the immediate Metropolitan Area; the larger National capital Region; the Central Yamuna valley Resource Region), indicates the types of organization, study, planning required as the immediate step for study and development.
Before going into consideration of the Regional proposals, it will be well at this point to present the broad sweep and implications of Delhi as a symbol, a functioning material and Regional focus.
The general problems of a metropolis of the character of Delhi may be first considered by reference to its functioning in the national and regional setting and by reference to the overlapping geographical regions to which these function apply.
In the largest sense, as a national capital, Delhi influence extends throughout India and, indeed throughout the world. This aspects of the functions of the metropolis is not without important implications for physical planning, some of which receive appropriate attention at later point in this report. Because of its national and international importance, Delhi requires adequate communications with the outside world, and these communications are achieved in this respect largely through telephone, telegraph, mall, and air travel connections. Rail travel represents a mixture of local, regional and national influences expressed through the movement of goods and people. The fact that Delhi has enjoyed this importance in one way or another for a number of centuries has increased its historic importance and made it a centre of tourist attraction in India as well as a centre or national and international influence.
At the next stage below that of national influence entire broad region of northern India. This importance has been greately intensified since the partition of the sub-continent, as Delhi has replaced Lahore as the major distributing centre for Northern Indi. The various functions of regional cultural activities, regional collection and distribution , and regional services which are discharged by Delhi in Northern India require a variety of connections with different parts of this broad hinterland and encompass the movement of goods and persons.
Within the broad North Indian region the influence of some activities is more intense then of others. At the broadest level, for example, Delhi as a centre of the cloth trade serves to a very considerably extent the entire North Indian market, and to some extent the entire North Indian market, and to some extent and all India market. On the other hand, the marketing if grain from the western U.P. and the Punjab is accomplished to a very limited extent through Delhi. While grain collection from the entire areas flows to Delhi for purpose of consumption, onl about 20% of all grain so imported into Delhi is re-exported to other parts of India. Nearby entrs such as Hapur in the U.P. and others in the Punjab are price-setting markets for wheat which in shipped to other place then Delhi. It is therefore clear for that every commodity and services whose handilng or dispose-tion to some extent centres or Delhi, there is a varying zone of influence in roughly concentric circles moving outward from the city. We shall now consider these various, areas, regions, or circles.
The Delhi Metropolitan Area –Relation of Delhi to surrounding Towns and Rural areas
Within the general overlapping zones of influence of a major centre such as Delhi, it is possible to distinguish increasing intensity of interaction between the central city and the surrounding towns and countryside. Examiniing the result offield studies which were made in various towns surrounding Delhi in the preparation of this plan, it is clear that within 75 miles of the central city all towns and centres feel its influence to some degree, but that the intensity of contact nd interaction increase as we some closer and closer to thecity itself. At any given distance from ,Delhi the larger cities such as Meerut and Rohtak and Mathura are more independent than the smaller centres. In preparation for planning metropolitan regions and for setting up the administrative instruments of such planning, it is ddesirable to establish a distinction separating those zones of influence of the central city where interaction is most intense and where joint planning measures of a special character mat be required from those which interact in a more general way with the center through the exercise of its many overlapping functions. It is quite clear from the nature of the problem that any such definition will be somewhat arbitrary, but as is seen , the necessity for it is quyite clear and imperative.
The problem of definition of a significant zone of intimate metropolitan influence of this tpe may be clouded by two related considerations which are not identical with those from which we have taken oyur departure. In couptries where administrative boundaries are firmly established by law and custom, metropolitan definitions may be set up which take congizence of administrative considerations in a general sense and which therefore fail short fo the most desirable functional definition of a metropolitan area. This is to some extent true of the system of standard metropolitan areas used in the United states, which have been defined in the main to include whole countries , since the county in that country is a most durable administrative unit with certain possible powers and with long historical continuity. it will be recognized immediately that from a developmental and planning point of view these considerable importance, but that they require some modification to serve adequately. Urbanization should in principal include not only present, but also future potential urbanization . The experience of other Indian cities, as well as of cities throughout the world, has indicated that uncontrolled development outside of an area of present urbanization can have disastrous consequences for future development patterns. Contiguity is likewise not wholly adequate, in a much as it fails to allow for interaction at a distance which modern technology and communications and the increasing complexity of urban life are making more and more possible. It is partly for this reason that the metropolitan districts were abandoned by the Bureau of the Census in America subsequent to 1940 and replaced by the standard metropolitan area, which is central city and generally urban in character are included in the area. In define the metropolitan area of Delhi, similar criteria will be followed, but the definitions to be derived will not respect existing district and tehsils boundaries, nor is the inclusion or whole tehsils and +districts considered necessary for achieving statistical continuity.
We may therefore look at the problem of defining the metropolitan area from two points of view in this preliminary consideration. First, the area to be defined as the Delhi Metropolitan Area should be sufficient ti include not only present urban developed closely related to Delhi on a daily basis, but also such area as may become the object of development within the actionable future. Second, the definition should include presently non- contingous areas which are already urbanized and which maintain a strong daily interaction with Delhi regardless of whether they will ultimately become part of a continuous urban development. It will be seen subsequently in this report that these two criteria tend to coincide and overlap.
We are now in a position to make a rough examination of the implications of these two main criteria to the situation of Delhi and its environs. We first consider the daily interaction between Delhi an the surrounding towns. Conclusions in this regard are based upon a field survey of most of the town within 50 miles of Delhi, supplemented by census data and by detailed surveys of industrial and commercial conditions in a number of the loser towns. Interaction between Delhi and the surrounding towns takes place n a daily basis in a number of different ways. The most widespread of these is the movement of goods and services in the process of economic activity, and at present levels of living the most important of these activities is probably the provision of foodstuff for the central city. At the same time, the growth of manufacturing and secondary productive activities in the general Delhi position as a wholesale and trading centre where the presence of a variety of good is in itself an indispensable service. Many subsidiary problems continue to exist, including in particular the barriers to trade which areas out of the licensing of goods lorries by the states, and differential sales taxes. Insofar as Delhi serves as an entrepot for trade between two or more localities in the environs or between its environs and the rest of India, the operation of the octroi tax may frequently impose a burden on the movement of goods. Problems of this type certainly require concerted action, but do not necessarily indicates the desirability of large scale joint planning activities, when taken by themselves. On the other hand, they second variety of movement within the metropolitan area is of major importance. This is the movement of people primarily once again the process of production and distribution. As an extreme example, retailers and wholesalers of cloth of nearby areas are accustomed to travel business in that market. This creates a regular flow of movement and requires accommodation in a pattern which is typical of Delhi role as a commercial centre but sharply accentuated in the cloth trade. Much larger movements in commerce and services, however, are accounted for by the cultural and shopping trips of people from a large region centered on Delhi in regular and occasional trips to the metropolitan centre for routine household needs and specialized needs, the range in this direction depending largely upon the distance of the residence from Delhi itself. Owing to the much larger variety of goods and services offered in the metropolitan centre and the relatively low cost of railway and bus travel, even comparatively poor families in towns as distance as Mathura and Meerut will travel with some regularity to Delhi for certain types of purchases at
extended intervals. Most important of all in this second main category of movement is the movement to and from work. This movement occurs in two directions, but primarily toward Delhi. In spite of irregular and inadequate train service, there is evidence that commuting at lower volumes extends far into Delhi hinterland, just as does shopping .More particularly the inner ring of towns of intermediate size surrounding Delhi Ghaziabaad, Faridabad,Gurgaon,Bahadurgarh and sonpat, as well a sother towns within the limits of Delhi territory such as Narela and Najafgarh contribute rather substantially to the working population of Delhi tough regular commutation. Data on this commutation based on the sale of season tickets are analyzed elsewhere in this report. There is also scatter evidence of a small but growing trend toward reverse commutation outward from Delhi in recent years. The largest volume of such commutation is apt to originate with the creation of new industrial portion of their skilled working force which prefers for a variety of reasons to maintain residence in Delhi and to commute to the outskirts. At the same time, still more distant relocations such as those in Faridabad tend to draw a number of managers and technical personnel from Delhi who will also commute, though frequently by automobile rather then by bus or train.
The transportation pattern referred to in the preceding paragraph indicates strongly that beyond the five towns there mentioned, commuting to the central city falls off extremely rapidly. All of these towns, with the exception of sonpat, are within a 25 mile- radius of Central Delhi, and sonpat lies but slightly outside of this radius. Under present conditions a distance of 25 miles of thereabouts represents one hour or more in commuting time station to station, plus the additional time which may be needed to make connections at either end of the trip. An overall commuting time ranging up to nearly four hours per day seems to be a practical limit for even middle-level workers, who place but a moderate value in their time. Unskilled workers cannot be considered because the expense of an extended journey is too great in relation to their incomes. At the same time, this distance would appear to be a practical limit under present conditions for the regular movement of goods from factory to warehouse and vice versa in a regular pattern of industrial production. Numerous interviews with manufacturers indicate that approximately fifteen to twenty miles is the present limit of distance for the relocation of a factory from downtown Delhi under management which prefers to reside in Delhi itself, or places importance on relation to Delhi- which practically all do. While these limits mat be extended by improved transportation in the future and while at higher levels of income more employees may be able to consider the journey to work from outlying locations, it seems unlikely that the next more distant ring of moderate size towns can be expected to be integrated as closely with Delhi as the towns already enumerated for a number of decades to come. It is therefore recommended in this repot that the five towns enumerated be considered for close integration at this time with Delhi itself in the administrative and planning process developed herein. As well be seen , this recommendation coincides area for planning purposes. The Delhi Compact Urban Area.
The considerations governing the urban development of the Delhi area during the next two to three decades rain force this thinking. They are three- fold in character: developable area, anticipated population growth, and development densities. Each of these is treated in considerable detail later and only brief reference is made at this point to the findings of other parts of the study. With respect to population growth , this study finds that the population of Delhi territory will approximately treble in the period between 1951 and 1981. At the same time , the very substantial rates of increase of population in the tehsils surrounding Delhi will continue and even accelerate slightly. As the result of transportation improvements and higher standards of living, the expending residential areas of Delhi will in general be constructed at much lower densities than now obtained in the centre of the old city. Additional demanis for land will be created by the expansion of manufacturing industry on a modern basis and by the more systematic provision of community facilities, including parks. The potential developable land in the immediate vicinity of the presently built-up areas of central Delhi is relatively wide in extent under old standards, but is likely to prove inadequate for extended development at the densities and rates of growth which appear likely.
Before 1981, natural obstacles to economical urbanization on a contiguous basis will be encountered in the expansion of Delhi. To the south rather substantial expansion is possible up to the point where the ridge is encountered., Expansion to the west and south-west in the direction of Bahadurgarh and Gurgaon will be limited by north west along the Grand Trunk Road and the Ambala Rail Line is limited by the lowying character of the land which leads to relatively frequent flooding. Similar conditions apply on the east bank of the Yamuna in the area of Delhi-Shahdara. Beyond the presently flooded lands of shahdara the Hindon cut interposes some barrier to expansion in the direction of Ghaziabad outside the borders of Delhi State. Many of the natural obstacles which at present render land development too costly for immediate consideration may be overcome at a late time, or at heavier expense. At the present time, the most immediately feasible method for increasing the volume of available contiguous land appears to be the reclamation of flood plain areas between the Ghaziabad Rail Line and the rail cut off between Nizamuddin and Ghaziabad.
It will also be noted that beyond the natural barriers of unbuildable land which have been described here, many additional areas outside of Delhi Territory with substantial volumes of useable land open up. To the south at Faridabad and further from Delhi, the available space between the yumna and the ridge rapidly becomes wider. To the north west , in the direction of sonpat, more buildable land is available as the Grand Trunk Road veers away from the yumna. To the east on the far side of the Hindan cut, a large area of the U.P. around Ghaziabad is suitable for further development. Thus it would appear that, while there is no dearth of buildable and within a fifteen to twenty mile radius of central Delhi, most of this development cannot be continuous, and the connection between the compact urban area of Delhi and its

outlying neighbouring towns is likely to be via rather long channels of controlled, with very little development on either side of such corridors. Such corridors. Such a pattern of development will serve to accentuate the usual phenomenon of satellite or star- shaped development which in any case has been observed to even-tuate in the development of most cities because of the superior communications along the main channels.
A recapitulation of the interaction of these three factors in the growth of Delhi over the next twenty to thirty years leads to conclusions somewhat along the following lines. The expected growth of the compact urban area of Delhi within the limits of Delhi Territory as a result of natural increase and in-migration would in all probability more than exhaust the contiguous land which can maintain close economic contact with the central city. At the same time , the growth in population of the eight tehsils surrounding Delhi concentrates a more than proportionate share of the expected growth of the districts containing these tehsils. These demographic projections reflect the fact that the past growth over the thirty years preceding 1951 of the most rapid within these districts. Apparently this in part reflects the higher intensity of agriculture which is possible in supplying a large metropolitan area from sources close by, and in part the more rapid growth of towns and villages in the general surrounding territory of Delhi when those towns are close to and under the direct economic influence of the central city.
From the rates of growth sustained in the past, it is apparent that these tehsils have both exhibited natural increase and attracted migration. Although detailed studies of this problem have not been made and should be undertaken in the course of the future development of the planning process, it some evident that the agricultural development on a more intensive basis cannot continue to absorb the same proportion of this two-fold population growth as in the past. It also seems likely that the towns closer to Delhi will exhibit the same increasing attraction between Delhi and the closer portions of the tehsils surrounding it with respect to estimation of future population growth. Whether or not this population will become still more highly concentrated in Delhi and lead to a growth of population even higher then that projected, with the accompanying problems of congestion, overbuilding , and insanitation remains to be seen. This, however, involves clear implications with respect to the development of policy.
The discussions which follow will take up the major regional planning and administrative problems.
Within the National Capital Region the core of development centres on Delhi in an area which has been identified to include the present and probable future area of strong daily contract between localities. On the basis of evidence at hand, this area has been identified to include the present Union Terrotiry of Delhi , and five major towns outside of the Terrotory in the U.P.

and the Punjab, Ghaziababad , Sonpat, Bahadusgarh,Gurgaon and Faridabad , together with the main channels of communication and partial development which connect these areas with the Union Territory . only in the cases of sonpat and Faridabad to we find that these corridors are of any very significant length. The other three towns lie very close to the present boundaries of the Union Territory. The indications of the future growth of population in Delhi and in the eight tehsils surrounding it suggest that the population of each or any of these five towns may rise rapidly during the next two decades, the extent of this increase depending on the one hand on the relative attraction of Delhi for industry and residents, and on the other hand on the relative growth of the larger towns in the outer ring of the National Capital Region. In the event that present trends are continued and agricultural densities do not increase and with the further provide that decentralization from Delhi into this immediate ring of tons is substantially possible, it then seems likely that a balanced development would give a few of these towns an ultimate population by 1981 ranging between 250,000 and 500,000 persons, while an unbalanced development or other alterations of circumstances might increase the population of individual cities to substantially more than half a million. Such growth for towns of this size and condition will introduce planning and developmental problems of a most acute kind.
The development of public facilities and urban services in cities of this size will demand very sizeable financial resources and the conservation of these resources requires detailed planning. Under the strains imposed by such rapid or growth by the initial stage of such rapid growth, it would be entirely impossible that these towns, in the absence of adequate planning and financing, would be unable to accommodate a continued influx of population and that growth would once again be diverted to Delhi. It can therefore readily be seen that in the most intimate sense that the development of these towns is a reflex of the development of Delhi and that the planning and implementation of their growth is necessary for the continued health of the centre as well as of themselves. Likewise in purely physical terms, it is difficult to conceive how at a later stage of development , when the compact urban core of the metropolitan area has extended much further outward and when these towns have achieved the size of substantial cities, problems of water supply , electricity, transportation , highways, and the like can be independently resolved.
On the contrary, it is quite clear that he planned development of the compact urban area of Delhi must proceed hand in hand with the development of these towns and that if decentralized development is to occur successfully, it must be achieved as the result of planning activities not only within the present limits of Delhi Territoory but outside as well. Within this area large volumes of rural land will remain for many years to come and the process of its absorption into existence of unfavourable physical conditions for urban development. All the reasons to be discussed in connection with the potential control control of rural land in the periphery of the national capital region apply with redoubled force to the control of rural land
within the Delhi Metropolitan area. Here most of the rural land will tend to be even more densely settled, and will tend to come into continually closer proximity to areas of intense urban development.
Within the areas of urban development of the structure of government policy will require the collection of all taxes and other levies to maintain urban benefits. There will arise a strong pressure for the clandestine development of land by way of unauthorized construction, conferring some of the benefits of urban conditions, but without the burden of taxes of developed land and without the safeguards to public health and convenience which those taxes finance. The operation of this process of premature development would then force the planning and governmental agencies to extend services in a haphazard ill- considered, and expensive manner in order to preserve the health of the community. For this reason , negative controls over land development within the Delhi Metropolitan Area are an inevitable reflex of the positive controls which facilitiate orderly development through the designation of development areas and the systematic provision of roads and public transport, electricity, schools and other urban services.
The general character of the Delhi Metropolitan Area which is the zone of present intimate daily contact has no been established and some of its general futures been outlined. It is desirable to examine the character of the problems which will Arias in this area in more detail and to establish in general the planning principles and procedures which will have to apply within this area.
A number of general principles and related facts and trends which influence conditions within the Delhi Metropolitan Area are discussed in substantial detail in later portions of this report, some of these will now be reviewed for their current application.
First, population projections of the present Delhi Territory indicate a growth of urban population of nearly there and one half million persons between 1951 and 1981, with and additional growth of one- quarter million of rural population largely in rural villages and small centres within the boundaries of the Delhi Territory. In the light of the probable job opportunities in commercial and government activity, it would appear likely that this population cannot be well supplied with jobs without further expansion of the industrial manufacturing sector of the economy. At the same time, a population projection for the eight tehsils immediately surrounding Delhi indicates an increase in population in he natural increase in these area might be expected to migrate to Delhi. In the absence of detailed analysis it is further anticipated that of this two million growth, a large proportion perhaps as high as 50% or more, is apt to be concentrated in the rural area close to Delhi and to seven to ten closet towns of importance, among which be may identify Ghaziabad, Loni, Bagpat, Sonpt, Bahadurgarh, Gurgaon, Faridabad, and Ballabhgarh. In the absence of provision whereby the areas occupied
by these towns may receive and accommodate a large proportion of the population growth in these eight tehsils, it is very likely that the population growth estimates for Delhi will be expected. It therefore appears to be a matter of some importance to provide dynamically for a very large increase of population and employment in the areas immediately influence. However, if we are to avoid an undesirable flowing together, a very generous greenbelt needs to be set up, and very rigorously protected from encroachment.
As has been indicated, a review of the land which is presently developable under existing economic conditions shows that the anticipated population of Delhi can be barely accommodated at reasonable densities over the next twenty to twenty- five years. Even this process of accommodation will involve considerable spreading out of population , the relocation of substantial population to make way for substantial volumes of land for industrial development. On account of the many uncertainties surrounding the actual development will continue far beyond the period provided for directly in the plan, it seems desirable to create some degree of flexibility by reserving land for future development, even at present levels of feasibility Additional reserves may be created at a latter date by the fact that development could be undertaken on land which is now not considered suitable, owing to the increase in general income in the economy.
Metropolitan Area : Desirable characteristics of towns. It is now possible to bring all of these considerations together and to develop a complete picture of the type of planning controls which are needed in the Delhi Metropolitan Area and their geographic extent.
It is first necessary to consider once again the role of the neighbouring towns which are in intimate daily contact with the general city. It has been made clear that, unless these towns develop rapidly, they cannot absorb a population increase which would otherwise probably converge on Delhi and raise even the outer of expected population growth to new high levels. In addition , in order to relive the pressure on developable land within the limits of Delhi State and of compact urban development, it would be desirable to divert a Part of Delhi anticipated population growth outward into these areas. At a minimum, a combination of the present population of these areas plus natural growth from the tehsils around Delhi plus a diverted growth from Delhi indicates a future population in the vicinity of one million, which if distributed amongst seven towns would yield an average population for these towns of about 1.5 lakhs. concereted in four or five towns yielding an average well in excess of half a million. At present, not a single one of these towns has a population in excess of half of the absolute minimum expectations, and none is prepared by public facilities already planned or by virtue of < an established planning capacity and financial resources to cope with the growth which may be anticipated . The organized control, planning, and guidance of the growth of these towns is a matter of major concern for the economic health of the Delhi Metropolitan Area as a whole.
A few further remarks may be added as to the future probable character of these towns. In general, they will be more strongly oriented towards manufacturing than will Delhi proper. This inevitably follows since, of the activities which we are discussing, the decentralization of manufacturing is the most feasible means for redistributing population. At the same time, however, since the population of several towns will exceed one quarter of a million, it is possible for them to become more balanced in employment than might be the case in a purely manufacturing suburb such as the vicinity of the textile miles in Bombay. For a number of reason , these centres will not be fully self-contained and independent of Delhi itself. This dependence consists of a number of aspects. Materials and services used in manufacturing will tend to circulate somewhat freely within the metropolitan area, while cetain services such as banking, wholesaling, and the like will probably be focused on the central city. Some proportion of the population will commute for employment to commercial and government centres in the city. Much of the management and technical personal, together perhaps with some of the skilled employess, of decentralized manufacturing centres may reside in Delhi and commute outward to work. For all of these reasons, rapid and easy communications with the central city will be required and the failure to provide facilities for such communications will turn cut to be an impediment to growth.
At the same time, however, the existence of these ready methods of communications would have a tendency to discourage the growth of consumer services in these areas and thus to lead to an undesirably excessive imbalance of employment. The planning of these centres must therefore include a number of positive measures designed to increase their independence o the central city with respect to certain types of services and to improve their balance of employment. Amongest these provisions will be adequate centres for retailing and a limited amount of wholesaling, plus adequate professional offices. The balance and flavor of the community will be improved if an effort is made to decentralize local and Union government offices to function adequately in these centres. Finally, positive planning measure designed to prevent sprawl, congestion, and squalor usually associated with industrial towns will do much to improve the amenity of these areas and their attraction as places of residence for the professional and other groups whose activities are conducted in them, as well as, for members of the community whose mobility permits them to live at some distance from their work. Since from the outset it will prove useful to take up the development of centres in series and to accelerate this development as rapidly as possible in order to place one community after another on a self-starting basis. This also permits the concentration of financial resources in the development of ways of communication and overcomes the dangers of inadequacy which are inherent in a dispersion of efforts.
We thus arrive at the conclusion that within the area of metropolitan Delhi, which includes Delhi Territory and the portions of the U.P. and the Punjab immediately adjacent the identical

planning measures are desirable. Land use and development must be carefully controlled. The objective of this control are both positive and negative. The negative controls include the prevention of adjacent conflicting land uses, the prevention of land for needed future facilities, and the prevention of unnecessary development not only can be costel in terms of the provision of streets, highways, and utilities, but can reduce densities and stand in way of future orderly development. If this takes place , the possibility of accommodating the anticipated population growth without excessive transportation and undue lengthening of utilities will disappear and the future cost of the development of Delhi Metropolitan Area tons ill be greatly increased, while their efficiency and economy will be irreparably damaged. The positive means of the control of development are even more important than are negative. They include in particular the provision of all the facilities which are necessary in urban communities, the orderly development of highway and transit facilities connecting different parts of the metropolitan area, and the provision of services such as electricity, water and bus services. These positive activities provide an organizing force for the growth of the metropolitan areas and a framework against which the negative controls play a useful and rational role.
In this plan, the detailed application of and use controls and positive measures of community development have been worked out for the compact urban area of Delhi. They are presented with supporting material regarding costs and feasibility in the following sections of this report. The inclusion of areas outside of Delhi Territory has been recognized from the outset as desirable, but the frame of reference of the study and the time and surrounding areas described in this chapter. In view of the considerations adduced, however, the recommendations on governmental structure for planning suggest means by which the planning outside of the present Delhi Territory may be closely unified with planning inside tis area. The unified planning activities to be set up require the extension of the analysis of this report to the surrounding areas and their inclusion in a geographically more extensive master plan.
National Capital Region
Within the central yumna watershed an area of influence of Delhi may be distinguished larger than the area of intimate daily economic contact, but substantially smaller than the complete market and supply area of Delhi. This area is characterized in that it consist of tehsils in which 40% of the population is engaged in non- agricultural activities according to the 1951 census and at least 15% of the population lives in urban areas according to the same census. Each of these tehsils also has a population density of at least 600 per squire mile, 1.e. substantially higher than agricultural. Regional transportation is not so intense as in the Metropolitan area previously described, some such commutation exists and there is an observable substantial volume of shopping and related trips. In general, this zone of presently moderate influence Is
about for miles in diameter. The total area including the extended boundaries of the tehsils is about 4,500 squire limes; this takes in the towns of sonpat, Bagpat, Meerut, Hapur, Bulandshar, Khurja, Panipat, Jhajjar, Sohna and palwal.
The importance of this zone from the point of view of planning in the Delhi area is manifold in the discussion no further reference will be made at this point to the gone of more intense influence . Attention will now be centered on the ring surrounding this latter zone. Taken as whole , area might be thought of as corresponding roughly in the mental image of rural migrants as the area of Delhi as a whole. This is especially true for migrants from more distant parts of north India rather than those lying within the area itself . It is generally true however that a large proportion of migrants into the area probably make Delhi their first destination because of the superior economic opportunities in the city itself . At the same time that this area corresponds to such an image of Delhi to outsiders , it also constitutes on area of very substantial reserves for rural as Delhi remains so much more the completely developed centre and as a wider variety of economic opportunities , such migration will be focused towards Delhi in preference to other town in the whole region .Consequently , lower rates of population growth are exhibited by districts lying further from Delhi This may be examined in the chapter on population . while the outer ring of these area is not suitable for the immediate developed ring of this area is not suitable for the immediate development of close day-to –day relationships with Delhi .It represents an area in which Delhi can conceivably supply the needed services for a more rapid development , in which case the extreme focusing effect of present migration and the in migrants into the total region might find it desirable to make their destination one of the larger towns not so very directly dependent on Delhi.
When the population growth problems of this National capital region are view as a whole. We see the emergence of three possible lived of action . With respect to the total area, in-migration from other parts of India can only be slowed by the creation of new economic opportunities in the zones of origin of migration . a matter of national policy. These zones include particularly Rajasthan and the U.P. and to a lesser extent the Punjab and other and more distant areas. Wherever there is in these areas a strong impulse to in-migration to larger industrial and productive centres there almost certainly exists situation of regional poverty and an excise of lavour force in relation to job opportunities . This is a problem of belanced development for all the India and its solution requires both additional provisions for the accommodation of in-migrants to established centres and the development of new centres in the less developed states and region where this impulse to in-migration is a problem . To some extent many of the programmes of development of the First and second Five-Years Plan have been almost at redressing the in-balance between regions which is expressed by this large scale migration from one part of the country to the other hand and doubtless such programmes will continue in the future. Clearly than can be substantially aided by the establishment of efficient
productive centre in the states affected, and the findings of this study may be effective in demonstrating efficient patterns of urban development and methods for achieving planning objectives which can use to other less advantageously placed states and regions. Until resources are available and effective action has been taken to provide local employment Indian Metropolitan scale, Delhi and other large and successful Indian Metropolitan centres will continue to receive migration from the outside, and grow unpredictably.
Within the National Capital Region the general policies of the government of Indian with respect to attempting to discourage rural to urban migration may be applied. These measures include agricultural improvements with associated increase in income, and the establishment of village industries and cultural opportunities; through the community development programme and in other ways. To some extent this should tend to discourage migration within the National Capital Region as a whole from rural to urban areas. The limits o such discouragement in a region as well as small as this are, however, substantial a relatively highly urbanized region is within easy travelling distance of every rural resident. The example of urban life and their attraction to rural resident regardless of the validity of this attraction in the long run are close to hand. Immediately available employment in construction of buildings and highways tends to draw people directly of the land into urban activities. The production of cash crops for the consumption of the ;’urban areas tends to break down the traditional subsistence peasant economy which characterizes large portions of India and to reduce the force of the ties which wide the Indian present to his land. In the light of all these circumstance , the local administration and planning agencies in the National Capital Region should land all assistance possible and create new physical vehicles for the further organization of community development projects with their efforts to discourage rural to urban migration but no undue reliance should be placed upon the effectiveness of these measures in an area so saturated with urban communities of relatively substantial size, until actual evidence of effectiveness is visible.
The second level at which this problem may be attacked and one in which the planning organization contemplated in this report can play an effective role is at the level of population growth distribution within the national capital region. Here the plan must deal with very substantial growth through natural increases to which is added an additional component of in-migration from outside the region itself. Much of the in-migeration is first attracted to Delhi and it is only at this time to a very extent re distributed in other centres of the national capital region. At the same time however, there is migeration from farm to town and from village to town as well as from smaller towns to larger towns within the area, much of which is believed to have been directed at Delhi and at the major centres surrounding Delhi.

A program which is directed at building up the capacity of the towns in the outer ring of the national capital region to attract migration, to absorb it, and to hold it, offers many attractions as a long term development policy. Functions of farm marketing and distribution are already well established in a few towns and will in all probability not offer expanding employment. Many functions such as wholesale trade and business services can be performed more economically in a larger metropolitan center such as Delhi. The decentralization of State Governments into such towns as Meerut and Rohtak seems unlikely, and any decentralization of Union government offices to centers as far away as this but within the immediate reach of Delhi seems unlikely as well, especially since the drastic implications of any such Union Government decentralization would probably be faced only with respect to aiding the less developed states and regions of India and moving offices far from the orbit of Delhi proper. In the light of all of these considerations, it seems quite probable that only the fairly rapid and determined expansion of manufacturing industry in select centers of the Punjab and U.P. in the outer ring of the national capital region can effectively attract migration from the National Capital Region’s rural areas and small towns and divert if from Delhi proper.
This report examines the suitable conditions for substantial industrial development in much more detail at a later point. Towns such as Meerut and Rohtak and Hapur do not have sufficiently strong attraction for industry under existing conditions. To a considerable extent, certain industries will have to be attracted to them by Government action.* Conditions encouraging the growth of industry can only be established by further attention to many aspects of planning and development. Without such attention, industries will not be able to function adequately, and natural growth will founder, while steady resistance will develop amongst business men and government officials to enforced location in these towns. Better planned centers and especially those in the immediate vicinity such as Delhi and its closer neighbors will tend to thrive at the expense of these centers but with consequent planning problems in Delhi and the Metropolitan area itself.
Factors in planning the Nation Capital Region.
It would be inappropriate to suggest at this time and probably in the future that strong independent centers of long historical development like these should be in any sense subordinated to planning measures undertaken in Delhi and its immediate environs. In any event, the distance factor makes detailed planning from a single centre impractical and inadvisable. The problem is to identify the main needs and to determine whether appropriate forms of regional planning exit through which these needs can be met in connection with the planning of Delhi, and at the time when a master developmental plan for the core area of the National Capital Region is being considered in an appropriate time, to establish instruments and objectives for the
development if the region as a whole. In the light of these considerations, it seems appropriate to suggest that there are certain major areas of planning in which the Delhi Metropolitan area and the jurisdictions covering the outer ring of the National Capital Region should cooperate.
First, the major towns of this ring are not adequately planned for the great upsurge of growth which they face in the immediate future. Their planning is haphazard and piecemeal, and the municipal boundaries ordinarily do not extend much beyond the areas which have already been built up. Since it can readily be predicted that they will expand manifold in area during the next few decades, some device for the gradual expansion of their jurisdiction should be considered.
At the same time that this expansion of municipal boundaries is pressed forward, additional aid in planning techniques must be provided to local municipalities together with necessary financial allocations from the state and Union budgets, where appropriate planning assistance should emanate from established centers either in the State Governments of the Punjab and the U.P. or in metropolitan Delhi itself, which might logically, in any event, be a member of whatever group planning instrument may be set up to effectuate needed measures in the outer parts of the national capital region. This planning assistance would extend to all aspects of local planning to permit local officials to have best knowledge of modern techniques of developmental control and stimulation until such time as they are able to establish complete planning services of their own.
Second, considering the critical importance of industrial development in these towns, a joint or federative agency dealing with problems of industrial development should be established in cooperation with the state and Union governments and should pursue the objectives of balanced industrial development within the entire national capital region. Such an industrial development agency would have as some of its most important initial undertakings the continuous review of industrial conditions and development trends, and the organized provision of suitable industrial land. The second activity implies broad powers to direct local governments or to engage directly in the acquisition, planning, and development of industrial zones or districts, and the protection of these zones from encroachment and unsuitable competing land uses.
Third, since balanced industrial development in this area will proceed in increasingly intimate relation with the developments in Delhi, the maintenance of sound communications and transportation facilities is of utmost importance. The growth of travel and communications along the main arteries will undoubtedly provide a stimulus to private development in strips or ribbons which can have a most deleterious effect upon the utility of these communication arteries and indeed upon the ultimate efficiency of the private development itself. It is therefore important that one of the major planning powers to be exercised in this zone should be both a major highway and transport plan and the control and regulation of strip development within approximately one mile of all highways.
The constellation of planning powers applicable in the outer ring of the National Capital Region therefore impinges most clearly upon the major highways and urban centers of the region. For this reason, it might seem desirable to exclude the rural regions between the major communication lines and urban centers from eincorrect, especially in view of the anticipated rate of development in this region. Such development will undoubtedly mean that areas which are now small towns will become larger centers and areas which now contain villages may contain
small or medium size towns. It further implies that these towns will need to be connected by new or enlarged highway connection which should than automatically come under the jurisdiction of the planning agency. Since the transition from rural to urban conditions must be carefully controlled the jurisdiction of the planning agency should encompass the entire area , even though this jurisdiction will be exercised limited spheres and in limited areas for some time to come .As experience and knowledge increase the planning agency will also deal more effectively with rural industry and village clusters which may arise or be stimulated in line with the general development outlook sketched above, and for this reason as well rural areas should come within its purview. Ed in
In the chapter of this report dealing with organization it is recommended that the most appropriate form of organization for ceding paragraphs. The. and the Punjab creating in the National Capital Region a new level of operation t o undertake planning activities and secure implementation, with powers corresponding to the needs outlined the preceding paragraphs. This joint agency should not limit its activities to research consultation, and advice regarding such matters of common concern as transportation development.
While the work in this areas does not yet have the urgency characterizing Urban Delhi and the Metropolitan Area, there are certain specify aspects that are quite significant and that fully justify the formation of a Regional planning agency now. This is important so that a sound land policy may be framed well in advance of development in the region to prevent speculation and misuse due to urban sprawl. The location of new towns and the development of outer wing cities would also have to be planned simultaneously. It is obvious that such comprehensive planning would need to consider a proper system of highways, planning of urban utilities and services like bulk water supply and sewage treatment facilities, joint schemes power distribution. flood control, drainage and irrigation works and a network of power distribution. In addition, planning factors like regional recreation and afore-station are equally important in the National capital Region. Finally, there should be a proper economic phasing of development programme, and their synchronization with the National Development plans.
Central Yumna Valley Region.
By still another criterion Delhi interests and problems extend many miles from the centre of the city, in a fashion which overlaps and interlocks with the discharge of economic, cultural, and service function for north India previously discussed. Delhi is situated on the Yamuna River. The major tributary of the Ganges . In the ecology of man ,both agricultural and urban , water playa a most important part . Through canalization , the influence of the Yamuna from Delhi northward is extended 120 miles south to Agra and 100 miles west to Hissar , as well as about 50 miles east beyond Meerut ‘ The origin of this influence reaches far north into the Himalays , 125 miles north of Delhi . This makes a total area of approximately 30,000 square miles. The geographic complexity of water control is being extended by modern method , the productivity and complexity of the system themselves are being increased . Function of flood control and control of soil erosion on a regional basis, and hydroelectric generation are being added to the earlier functions of irrigation and elementary urban water supply. The increased demands are closely related to the modernization and urbanization which are proceeding so
rapidly in India, and in the particular case under consideration are related to the growth and modernization of Delhi and of the towns and rural areas surrounding it in the upper Yamuna basis . with increasing population and rising standards of living , these towns require more domestic water of well as water for industry. At the same time. They generate more sewage effluent whose treatment and disposition must be controlled , The increasing pressure for land and the increasing value and complexity of structure installed on the land means that river –bank cities like Delhi increasingly require protection from floods , In short, therefore , the increase of population and activity in the central Yamuna watershed is placing increasingly exigent demands upon the proper management of the water resources of the valley.In this connection there are related problem of afforestation, agricultural practice, marketing of agricultural produce, and so an. In additional there are problems of communication and general economic development which tend to be more less focused on Delhi as the centre of the region of the source of many production services, marketing services, financing services, and the like . The partial inter-dependence of this portion of the whole region of north India, of Delhi and its closer Region, raises problems of communication. All of the problems which have been enumerated so far in connection with this region are therefore problems of state action with which the Union Government and the states are quite properly concerned. In most cases the inter-dependence of different areas is not so sharp as to require joint action expect in the case of the management of water resources. Here, as has been indicated , the complexity of modern river basin development, including features of flood control, navigation, hydroelectric generation, irrigation, and the provision of potable water is combined with the complexity of the management of inter-related river system and with the related and overlapping needs of the agricultural and urban areas.
In this area of India in particular, the existence of the state jurisdiction and the Union Territory of Delhi creates possible governmental complications as well as special opportunities. The findings of this study indicate that within the foreseeable future the shortage of power for development purpose and the shortage of potable water in the rapidly urbanizing areas of the Yamuna valley around Delhi and including Delhi will create severe pressure or proper planning and management. It is quite apparent on the basis present planning that the full future magnitude of this problem has not yet become apparent in the realm of the policy making. Although this report does not recommend any specify from of planning organization to deal with this problem, it should be realized that critical problems of water supply and water management have, in the area of Delhi and the Central Yamuna valley, a delayed action fuse which will expire within a short time and create an explosive situation in sanitation and other fields. Any long range planning by the Union and States governments should start now and take into account the explosive growth fo the urban areas and their rapidly increasing needs for water. Experience in other parts of the world in rapidly urbanizing areas has indicated that no reliance can be placed upon the absence of adequate water to serve as a break upon urbanization. But a failure to lay adequate plans can definitely result in latter inequities, imbalances, and require costly solutions which could have been avoided.
C H A P T E R T H R E E
P O P U L A T I O N
1. INTRODUCTION The purpose of this chapter is to present a description of the most significant characteristics of the population of Delhi and its surrounding regions and to indicate its prospective growth over the next 25 years. The reason for these two objectives as a basis for planning need not be explained in great detail. The presents population and its potential rate of growth is one of the fundamental facts upon which planning of any kind must be based. The characteristics of the present , population notably its sex and age composition, and its settlement patterns are also important factors which will influence not only the kind of planning that is required, but also the overall objectives and possible means of a plan.
Though the present and the past characteristics of Delhi population can be described fairly accurately, any estimate of future population meets with much greater uncertainty. We cannot indicate with certainty what will be future death and births rates and what will be the migratory patterns which will prevail to influence the size of the population of any given area. We must assume that present patterns will tend to continue, as modified by possible national policy decisions with respect to dispersion and smaller city counter magnets. We must also assume that some of the features of population growth which have been discerned for India as a whole will operate in a smaller fashion in Delhi. On the whole, the projections which are presented in this/chapter have been fairly conservative. If we err, it is rather on the low than on the high side. Yet, the estimate which are presented have been arrived at after considerable study and many more projections using various more-less-plausible assumptions as to future population trends in Delhi have been made than are presented here. It is on the basis of this very widely accumulated material that the projections here presented have been chosen as those most likely to have reliability.
Up to 921 Delhi was a city of moderate size with primarily regional significance. Since 1912 several events have occured in Delhi which have had a powerful influence not only on its growth, but also on its general situation within the structure of Indian cities. The establishment of the capital of the new independent India, and the partition which brought a flood of immigrants form Pakistan into the city have been the most important events in Delhi recent history. It is now the third largest city of India and appears to be growing at a faster rate than any other large metropolis on the whole sub-continent.
In 1951 the urban population of Delhi amounted to 1.44 million persons, the population of Delhi Territory to 1.74 million persons, and the population of Delhi Territory and the surrounding eight tehsils in Uttar Pradesh and the Punjab to somewhat over 4 million. By 1981 this area, slightly less than the National Capital Region, is expected to have a total population close to 10 million with about 5.5 million in Delhi Territory of which about 5 million will be in the Delhi urban area. In other words, the population of Delhi and its surrounding region is expected to more than double and the population of the urban metropolitan core to more than triple. Although these rates of growth seem very high. It should not be forgotten that in the thirty years between 1921 and 1951 the urban population more than quadrupled and the population of Delhi Territory more than tripled in size.
The result of this nucleated centre of the metropolis, but it will merely an extension of the urbanized region into adjoining regions. Though Delhi is likely to have the highest rate of amount of growth, nearby towns will grow into cities, and some of them even into large cities. Delhi in 1981, if the plan is successful , should present picture of a heavily populated centre, surrounded at varying distances by a number of relatively self- contained cities, rather than resembling Calcutta with its string of suburbanization. The tehsils which adjoin Delhi Territory, and which even today are predominantly rural, will take on as more urban character. Not will only the urban proportion of their population increase, but even villages and small towns ill take on the character of non- rural places.
Although the absolute growth of population in Delhi and the surrounding tehsils will be large, it is not expected that there will be major shifts in either the age or sex composition of the population, nor will there be likelihood of large changes in the average household size. Though birth and death rates will doubtless decline, it is likely that, in the absence of very startling changes in procreational habits of the population of Delhi, these effects will tend to cancel each other out; so that the absolute growth rate of urban Delhi population. Which in the decade from 1941-51 was well above 4.5 per cent per year, will not fall much below this rate and will most probably stay above 4 per cent per annum. The result of these trends will be on overall growth from less than 1,5 million in 1981, also relative stability of age and sex composition of the population can be expected; as well as the relative stability of household size at a level of approximately 4.5 members per household.
The significance of these projections will become clearer in later discussion in this report, notably when the prospective labour force, the need for housing, schools, neighbourhood facilities, and shopping centres will be discussed, as well as when consideration is being given to future needs of transport, industrial and commercial development and the disposition of landuse.
2. HISTORICAL DEVELOPMENT OF Delhi population

Much of the early history of Delhi population is unknown. Though it is reported that at the height of the power of the Moghuls Delhi had a population of around 20 lakh persons, this figure, as so many other reports of earlier times, must be taken with a grain of salt. More of less reliable figures for the population of Delhi exist since the beginning of this century. The population trends in Delhi Territory since the Census of 1901 are presented in Table 1.
TABLE 1.
Population of Delhi 1901-1961
Year Total Delhi State
% inc. Urban popul.
% inc. Rural Popul. % inc.
(1) (2) (3) (4) (5) (6) (7)1901 405,819 .. 208,575 .. 197,244 ..1911 413,851 2.0 232,837 11.7 181,041 8.21921 488,452 18.0 304,420 30.7 184,032 1.71931 636,246 3.3
447,44247.0 188,804 2.6
1941 917,939 45.0 695,686 55.5 222,253 17.71951 1,744,072 90.0 1,437,134 106.6 306,938 39.91961 2,644,058 51.6 2,344,051 63.2 300,007 0.3
urce : Census of India, 1951 : District Census Handbook Delhi Territory Simla 1953.
*Source : 1961 Census : provisional population Totals : office of the Registrar Geal India.
From this table it appears that the population of the state has been growing at an increasing rate, due mainly to the progressive urbanization of Delhi Territory, a trend which has taken on predominant proportions in the laost two decades. In fact, there is no other major urban area in all India which has shown such a high rate of growth in the period of 194151 as Delhi. As well be shown later, this unusual rate of growth is due to two main factors, the great influx of refuges from Pakistan and the unusual impetus given to population development in urban Delhi as a consequence of its becoming the capital of independent India. The magnitude of Delhi growth in the decade 1941-51 can best be appreciated if it is compared with the mean decennial growth of all Indian cities with populations in 1951of over 100,000 . this all – India figure is 36.2 per cent , whereas the figure for urban Delhi is almost three times that rate.
Looking further back in the history of Delhi . population , we find that the rural population of the State remained almost constant until 1931 . After that date it began to rise rather sharply, but the increase in the period 1931,41 dose not seem to exceed the amount of population which could have been added during this decade through natural growth . In the decade 1941-51b the rule population of Delhi Territory Jumped by almost 4- percent . This means that immigration must have taken place into the

rural areas of Delhi, and since there is only small scope in the agricultural base of the State to support this growth of population, we must draw to support this growth in population , we must draw the conclusion that a portion of the population classified as rural , makes it livelihood in urban Delhi.
This is shown also by the fact that of the population of rural Delhi 48 percent derived their livelihood in 1951 from non-agricultural occupations ,whereas this figure is much Lower in other rural parts of North India. This development is not surprising and has been going on for several decade preceding the last . For although the urban population of Delhi has grown more rapidly than the rural population of the State , the period since 1931 also show a tendency to greatly enhanced growth . In the decade 1901 to 1911 the rate of increase of the urban population of Delhi was 11.7 percent . This corresponds roughly to the natural rate of increase of the population and immigration apparently did not play in important role in the decade . In the decade 1911 to 1921 Delhi urban population rose by 70,000 persons or more than 30 percent . This sudden spurt was largely due to the establishment of the capital of imperial India at Now Delhi . But subsequent periods have shown even greater increases in absolute numbers and percentagewise and each successive decade has added a larger population to the urban population of Delhi than the preceding one.
The result of this was that the urban population of we consider that a portion of the population classified as rural , ultimately depended upon employment in the city and merely resided in Village , the population depending upon the urban center was more than seven times that of 1901. This rate of growth is very high and matched in only few cities in India or elsewhere . and it is unlikely that is will continue at such a high rate, To be sure, several extraordinary events , notably the establishment of the national capital at Delhi and the influx of refugees, contributed to this result and it is unlikely that any similar development causing a sudden population upsurge in Delhi will occur . Thus we may safely assume that the population of Delhi will increase at a less rapid rate than it has in the past five decades , and especially in the past two decades .
The increasing rate of population growth in Delhi can also be shown in another way , In table 2 we present mean annul growth rates for Delhi during the Last decades.
TABLE 2
Mean annual growth of population of Delhi State; 1921-1961
Decade Mid-decade population Annual per cent Increase Number
1921-31…………………. 562,349 2.62 14,7791931-41……………………. 772,092 3.62 28,1691941-51……………………. 1,208,113 4.80 58,0341951-61…………………….. 297,036 4.80 110,592
Source ; Demographic Section , Town Planning Organisation .
This table indicates the rate and absolute magnitude of actual increase in population during the last three decades and the estimated increase the current decade . It can be observed that , whereas in 1921-31 less than 15,000 person were added annually to Delhi’s and in the present decade it is estimated to exceed more than a lakh every year , To illustrate this magnitude it mean that whereas in 1921-31 Delhi was annually adding to its population the equivalent 1941-51 it was adding a larger –size town in the present decade , every year the equivalent of a city is added to Delhi,s population . The implication is that every five years , a city of the size of Lucknow would be added to Delhi . It is worthwhile to remember that there are several States in India which do not have any city of this size. And even Lucknow has grown to this size over a period extending over centuries.
2. The population of the National Capital Region around Delhi up to 1951.
The expansion of population in Delhi and the consequent increase in the economic in Delhi and the consequent increase in the economic potential of the city and the State around it, has had an influences on the demographic condition in the surrounding: ring region. Moreover, as Delhi continues to grow, this influence will be increasingly felt. The process of growth of population in relatively self-contained units partilly depends economically on the national capital ,Located in the surrounding districts and tehsils , will continue in dependence upon demographic and economic development in Delhi itself . For this reason it is important to gain even a rough picture of past and present demographic trends in this region.
As was argued in a previous chapter Delhi hinterland has a radius of about 200 miles around the central city though a deep functional and economic impact is confined to a narrower area with a radius varying between 40 and 50 miles. It would have been desirable to present population data for these regions, but this would have been excessively difficult since adequate data on a comparative basis are available only for districts and tehsils. Hence we confined our analysis to the following for districts : Meerut and Bullandshahr in U.P. and Gurgaon and Rohtak in Punjab. The influence of Delhi is currently , most keenly felt in an area which is covered almost entirely by the limits of the National other functional characteristics, yet the region comprised roughly by the eight tehsils around Delhi ( and particularly the towns and cities in these Tehsils), is one of which Delhi economic and demographic influence is most clearly felt.
A mong the eight tehsils which and sikandrrabad are in U.P. and Balllabgarh, Gurgaon, Jhajjar, Rohtak and Sonpat are in pnujab. Tables 3 and 4 below present the population picture in these tehsils and districts in 1941 and 1951. It may be observed that the rate of population growth in Delhi exceeded those in the surrounding tehsils. In turn, these tehsils, in general, show a higher growth trend then the tehsils which area further away from Delhi, expect for those which themselves contain sizeable urban centres like Meerut, and Rohtak.
TABLE - 3Population and Related Figures on Districts Adjoining Delhi State
Districts Area in sq. miles
Population 1941 and 1951
Population 1951 Population % depending on
1941 1951 % Inc.
Rural Urban Rural Urban Agr. Non Agr.
In the Punjab
4,679
1,883,005 2,089,710 11.0
1,798,498 291,212 86.1 13.9 67.1 32.9
Gurgaon 2,348
895,940 967,664 8.0 827,511 140,153 85.5 14.5 68.5 31.5
Rohtak 2,331
987,065 122,046 13.6
970,987 151,059 86.5 13.5 65.6 34.4
In Uttar Pradesh
4,189
3,213,805 3,781,101 17.6
3,047,989 733,112 80.7 19.3 53.9 46.1
Bulandshahr 1,889
1,317,223 1,499,884 13.9
1,266,448 233,436 84.5 15.5 63.1 36.9
Meerut 2,300
1,896,582 2,281,217 20.3
1,781,541 499,676 78.1 21.9 47.7 32.3
Total of Uttar Pradesh and Punjab
8,868
5,096,810 5,870,811 15.2
4,846,487 1,024,324 82.6 17.4 58.6 41.4
Delhi State 578 917,939 1,744,072 90.0
306,938 1,437,134 17.5 82.5 9.8 90.2
GRAND TOTAL
9,446
6,014,749 7,614,883 26.6
5,153,425 2,461,458 67.7 32.3 47.4 52.6
SOURCE: Adapted from the District Census Hand book, 1951.
TABLE – 4
Population data on Tehsils around Delhi state, 1941 and 1951.
Tehsils Area in sq. miles
Population 1941 & 1951
Population 1951 % Population depending on
1941 1951 Numbers Percent Agr.
Non Agr.
1951 Density
%inc
Rural Urban Rural
Urban
Baghpat 400 361,800
417,317
15.3
364,747
52,570
87.5 12.5 53.4
46.6
1,043
Ballabgarh
257 97,707 128,703
34.7
91,310 37,393
70.9 29.1 38.7
41.3
448
Ghaziabad
445 338,218
425,187
25.7
243,451
32,736
80.6 19.4 46.5
53.5
955
Gurgaon 411 140,45 169,50 20. 140,80 28,69 83.1 16.9 62. 37. 412

3 6 6 8 8 2 8Jhajjar 814 290,28
6324,431
11.8
292,795
31,636
90.3 9.7 71.2
28.8
398
Rohtak 517 263,924
312,058
18.2
240,156
71,902
76.9 23.1 53.1
41.9
604
Secundrabad
521 282,235
317,238
12.4
277,117
40,121
87.4 12.6 65.5
35.5
609
Sonepat 447 215,008
253,808
17.4
223,619
30,189
88.2 11.8 61.0
39.0
568
TOTAL: 3,842
1,990,781
2,348,248
18.0
1,973,003
375,245
84.1 15.9 58.7
41.3
611
SOURCE: Census of India, District Census Hand books, 1951.
The total 1951 population on Delhi Territory an dthe adjoining districts was 7.6 million; of this the population of districts in U.P. and Punjab alone was 5.87 m,illion. The increase of population in the 1941-51 decede in the entire area amounted to 1.6 million persons or roughely 26 per cent. This, however , does not give the whole story because the districts outside Delhi, in U.P. and Punjab had an increase of less than 15 per cent whereas the increaseof population in Delhi Terrotory was 90 per cent. In fact, only one of the districts adjoining Delhi Territory registerged more than a 20 per cent increase in population.
Of the total increase of about 1.6 million during the 1941-51 decade in the area bounded by Delhi and four adjoining districts,,, almost 49 per cent(827, 800) occurred in Delhi Territory itself. The districts in U.P. registered an increase of 17.6 per cent whereas the districts in pnjab registered anincrease of only 11.0 per cent.
The pattern of population change in the period 1941 to 1951 for each adjoining tehsils is presented graphically in map No.1.
Population figures of the tehsils around Delhi Territory indicate that tehsils Ballabgarh in the districts of Gurgaon registered the maximum increase of 31 per ccent. In the 1941-51 decade, with Meerut second with an increase of 26.4 per cent. And Ghaziabad third with 25.7 per cent. Tehsils adjoining Delhi Teritory registered the largest population increase; example are Ballabgarh; 31 per cent. All these tehsils are approximately 20 miles from Delhi.
Among the adjoining tehsils the smallest growth are registered in HJhajjar where it amounted to only 11.8 per cent. Perhaps on the reasons for this slow growth may be that compared to other tehsils adjoining Delhi Territory this one does not have good or rail connection with the capital.
Two tehsils, namely Ferozepur Jhirka and Nuh.both in district of Gurgaon, registered a decline of 8.9 per cent, and 6.8 per cent, respectively during the 1941-51 decade. This is probably due to large scale Muslim emigration after 1947.

In the districts adjoining Delhi Territory there is a fairly uniform proportion of the urban and rural and 18 per ccent. Is urban. However, if Delhi Territory is included, this picture changes considerably with the urban population rising to 31 per cent. This is due to the high proportion of Delhi population living in urban areas. On the whole, the districts in U.P. were slightly more urbanized (19.3 per cent urban ) than the districts in the Punjab(15.6 per cent urban).Meerut is thye most urbanized districts adjoining Delhi. In 1951 more than 22 per cent of Meerut population lived in urban areas. The other three districts do not have more than 15.0 per cent of their population living in urban areas. Among the tehsils it appears that Ballabgarh Tehsils had the largetst proporation of urban population ( 29.1per cent); Rohtak being second with 23.1per cent ; Ghaziabad third wth 19.4 per cent urban population , Gurgaon had 16.9 per cent. The remaining tehsils did not have than 12.0 per cent urban and rural population in each tehsils as agriculture and non-agriculturl livelihood classes, is graphically presented in Map No .3.
It is of equal significance that In the tehsils located close to Delhi, towns have developed which have shown rates of population growth similar in magnitude to those of Deli itself. In Uttar pradehs the closet town to Delhi is Ghaziabad this town, which is 1951 had a population of 43,745, showed an increase of population in the period 1941 to 1951 of 83.5 per cent. In the Punjab, there are several towns at located at distance under 20miles from Delhi among; those are Gurgaon : 87.3 per cent , Faridabad and Faridabad Township (19 mile), and Bahaduurgarh (19 miles). These towns had the Gurgaon : 87.3 per cent, Faridabad : 31.0 per cent, Bahadurgarh 36.1 per ccent. Faridabad Township is a new city which was only foundedin 1947 and which in 1953 had a population of approximately 25,000 persons. Compared to such high growth rates at those of Gurgaon, Ghaziabad, and Faridabad Township, the other cities and towns in the four Districts adjoining DelhiTerritory have remained substantially lower. Thus there have already been built up rapidely growing towns on the outskirts of Delhi which in the future will become increasingly integrated in their demographic composition and their economic specialization with Delhi. These areas adjoining Delhi Territiry ,are, therefore , important regions in which town planning must be more intensive and more highly integrated with Delhi plan than in the remainder of the surrounding area.
CHARACTERISTICS OF DELHI URBAN POPULATION IN 1951.
The urban population of Delhi Territory resided in 1951 in ten administratively distinct citiesof township. These units were the cities of Delhi and New Delhi and the towns of the Civil Lines, west Delhi Cantonment, shahdara. Red Fort, Narela, Mehrauli and Najafgarh. All these areas were contiguous with the exception of Narela, Mehrauli and Najafgarh. These various units increased at different rates of population growth during the period 1941-1951. The highest growth rates were exp[erienced by Civil Lines and New Delhi : their population increasing by 329 per cent and 173 per cent respectively ( Red Fortnot considered). The actual population increase In various urban areas is given in Table 5.
TABLE 5Increase in population During 1941-51 and 1951 city Densities
Place 1951 population IncreaseNumber
1941-51Per cent
1951 city density-persons acre
Old Delhi 914,790 392,941 75.3 213.3New Delhi 276,314 182,581 173.4 13.2Civil Lines 83,273 63,878 329.3 14.7Delhi Cantt 40,950 17,810 76.9 3.4Shahdara 30,802 14,847 93.0 1.0Red Fort 10,022 8,282 476.0 19.3Narela 9,597 1,547 19.2 10.0Mehrauli 7,436 1,386 22.9 61.5Najafgarh 5,088 --8,686 --13.9 57.2West Delhi 58,862 58,622 .. ..TOTAL DELHI URBAN
1,437,134 741,448 106.5 27.1
Former Delhi Municipal Committee Area.Source : Delhi District Census Handbook, 1951.From Table 5 it can be seen that old Delhi which includes the walled city of Shahjahanabad had the maximum net addition and the highest density, although probably most Muslims who left Delhi 1947 actually emigrated from this area.Apart from Najafgarhwhich lost some population and Narela hich was far from the urban area, the minimum increase was not less than 23 per cent. The densitiespresented in Table 5 are only approximations, and may be regarded as overall densitics. But over these densities are some of the highest , compared with cities of similer size in Europe and America. These overall city densities are only a rough indication because almost all urban land uses are included. The overall density of the main urban area of Delhi which exclusive Narela, Mehrauli and Najafgarh was over 50 person sper acre for the developed area. Detailed data on densities in different sectors in different sectors of Delhi are presented in Appendix A of this chapter.
A measure that gives a more realistic picture of the congestion of people on urban land is the neighbourhood or Gross Residential Density. The gross density was computed for Delhi after excluding predominantly non- residential areas, work centres, large open spaces, etc., and these are presented in Map 5( Delhi Urban Area- Density 1951). It will be seen that there exists a great variation in residential densities in urbanm areas. In new Delhi and Civil Lines gross residential sensities of 15 persons per acre are prevalent, whereas in the walled city there are portions which in 1951 had the astounding griss residential densities of 840 persons per acre; but the walled city of shshjqhanabad has close to 350 persons per acre; in Motia Khan it is 270, and in karol Bagh it is 174 persons per acre. In comparison the highest residential density in New Delhi was in the Minto Road and the Bangali Market areas, but in each case it was below 100 persons per acre. The range of gross residential densities in the Civil Lines area is between 28 persons per acre and 102 persons per acre. In the newly developed area of west Delhi the gross density ranges from about 20 persons per acre to about 90 persons per acre. There are reasons to belive that since 1951, there has been an upward change in these density patterns.
A further significant pont is that there are approximately 75 villages in Delhi Territory which are veryclose to the urban area ; fro about a quarter of a mile to about a mils . There gross residantal denicty has been computed on the basis of their developed areas as indicated on the 3’ map of the SURVEY OF india and extracted from aerial photograph . Cross residential dencity in these village range from as low as 10 to as high as 240 persons per area . These Village are significant because by 1981 many of them may be absorbed into urven expansion .
The cansus of India dose not furnish any date on family size , which varier greatly as between the different parts of india and even within a given urvan area . In large urban like Delhi, there are significant deviation from the all-India averages ,Some date are however avilablble on the number of, households , and on the household population in Delhi . From this it is possible to computer the everaze hosehold size in the main units within about Delhi. These date adapted from Delhi Census Handbook are presented in Table6.
Table-6
Household size and population for Delhi Urban Areas
Place 1951 house hold population
Number ofHousehold
Average HouseholdSize
Old Delhi 905,518 160,903 5.65New Delhi 271,426 58,576 4.65Civil Lines 76,795 18,861 4.05Shahdara 28,633 5,244 5.48Red Fort 8,417 2,350 3.58Mehruali 7,436 1,505 4.95Najafgarh 5,088 1,021 4.90Delhi Cantt. 40,950 8,194 5.01Narela 9,957 1,957 4.85West Delhi 54,871 12,731 4.70
From table 6 it may be concluded that the average household size in these urven areas is about 5.2 persons . Household sizes are largest in old Delhi [5.65] and in Shahdra [5.48] and comparatively small in the Civil Lines and new Delhi area. Those areas are also , repectively , high and low density areas. Subsequent studies – the creater Delhi SURVEY UNDER THE Delhi School of Economics , the Bharat Sewak Samajs Report on Sulm of old Delhi , and survey of the Slum and urban Renewal Section in T.P,O, on various parts of Urban Delhi indicate the average household size in Delhi to be 4.55 persons.
From the available information on the number of household , household sizes , number of occupied houses in the Census of India of 1951, the estimated new family formation , not migration and an estimated amount of new construction , it was computed that in 1957 there was a housing deficit of at Least 70.000 dwelling in Delhi. This dose not include houses which were dilapidated and unfit for human habitation . This study projected that after gibing due consideration and allowances for present building
activity and its capacity ,the housing deficit is actually on the increase every year. IN 1957 , the estimate of the relative housing deficit taking into account absolete and unsafe housing , was 110,000 units; and in 1961 this is expected to rise to 120.000 units . This fact must be borne in mind if one considers the implications of a substantial rise in Delhi ‘s urven population which is extimated to be more than a lakh every years.
THE POPU-LATION PROSPECTIVES ; DELHI, the METROPOPU-LATION area and the NATIONAL CAPITAL REGION
To plan for various types of land-use to assess the prospective needs for different Kinds of urvan amenities , housing , water Supply , educational and recreational facilities and other service , it is of important to Know the magnitude of population which probably will be in Delhi in the next twenty-five to thirty years, Speciatists in the field of demography have developed a number of methods for population projections . In general , these methods are based upon the assumption that cortain existing population yrends in a given area will continue to operate in approximately,the same way in the future as they have operated in the past.
The main factors influencing population change in an area are the number of births and deaths , and the number of migrants in and out of that area. In working out a projection as a whole , migration as a factors of population change can be normally ignored . But in an urban region which
The projection for Delhi and the region around it have therefore been attempted by the region around it have therefore been attempted by the well-known methods of second degree parabole and logarithumic strasight lines , as well as the application of overall annual and decennial growth projection for Delhi as well as the region around it are presented in Table 7.
On the basis of the projection presented in Table 7 it may be expected that in 1981 the population of urvan Delhi will be between 3.75 millions and 5.25 millions , with the most probable estimate around five millions persons. Similarly , the population of Delhi Territory will be 5.5 million, and the population of the four surrounding districts of Gurgaon , Rohtak ,MEERUT , AND BULANDSHAHAR will be approximately 2.5 time the size of Delhi alone , I.e around 12 million . of course , it may be expected that by 1981 this region will contin , in addication to Delhi , several more cities with population very much over one lakh.
In a ring comprised of the eight tehsile which immillion persons in Delhi territory , there will be living another 4,5 to 5 millions persons , so that the total populationof this ring and Delhi Territory together will be 9.5 to 10 million person . There are several metropolitan gegions in developed countries which have reached this size ,. The metropolitan regions of Londan . New York , Tokyo and Moscow have population in this neighbourhood , or even exceeding ten million.
The growth of the population of urban Delhi from 1.44 millions in 1951 to 4.98 or almost five millions in 1981 corresponds roughly to an Increase of a little less than 4.25 per-cent year. This is not an unreaseonable assumption to make. One estimate of the normal rate of growth of urban Delhi and

Delhi Territory in the period 1941-51 yielded 4,7 per-cent per year . It this rate of growth were to continue until 1981 would mean an annual growth rate of less than four per cent. In other words, the assumption made in our projection for urban Delhi and Delhi Territory are modest as indepen-dently computed figures, based on recent data.
Since the projection in Table 7 are, on the whole, rather on the low side, the probability that the population of Delhi city and Delhi Territory may be larger than the projected averages( 5 and 5.5 million) is greater than the probability that these limits will not be reached. However, the reasons for this statement as to balance of probability are the following.
TABLE 7
Projected population of Delhi and Region
A. Population of Urban Delhi.Low (Parabola) 1.44 2.07 2.84 3.75Medium A (4.25 per cent annual) 1.44 2.18 3.30 5.01Medium B (4.5 per cent annual) 1.44 2.23 3.47 5.38High (4.75 per cent annual) 1.44 2.29 3.64 5.78Average of 4 projection 1.44 2.14 3.31 4.98
B. Population of Delhi TerritoryLow A (Parabola 2nd degree) 1.74 2.46 3.35 4.42Low B (Log. Str. Line) 1.74 2.40 3.29 4.51Medium A (per cent of annual) 1.74 2.58 3.82 5.66Medium B (par. 3rd degree) 1.74 2.67 4.00 5.81High A (4.25 per cent annual) 1.74 2.64 4.01 6.08High B (4.5 per cent annual) 1.74 2.71 4.21 6.55Average of 6 projections 1.74 2.58 3.78 5.50
C. Population of 8 tehsils around Delhi(inner ring)Low (Coale and Hoover “low”) 2.35 2.76 3.27 3.70Medium (C and H “medium”) 2.35 2.76 3.45 3.97High (C and H “high”) 2.35 2.80 3.50 4.49Very High (Parabola) 2.35 3.06 3.88 4.90Average of 4 projections 2.35 2.85 3.53 4.28
D. Population of 4 districts around Delhi, beyond the 8 tehsils accounted under letter C. above outer ring)
Low (Coale and Hoover “low”) 4.60 5.41 6.39 7.24Medium (C and H “medium”) 4.60 5.41 6.75 7.77High (C and H “High”) 4.60 5.47 6.95 8.79Average of 3 projections 4.60 5.43 6.70 7.93
E. Index number of population growth..Average of A 100 148 230 346Average of B 100 148 217 316Average of C 100 121 150 182Average of D 100 118 146 172Foot Note: the provisional population of the Delhi State, as published by the office of the Registrar General, India, was 2,644,058, while that of urban Delhi (inclusive of New Delhi and Delhi Cantonment), was 2,344,051 on March 1/1961.
The net population increase of Delhi is made up of two components : not growth due to the excess of births over deathe, and net immigration. It is likely that both these factor will not decrease in the yars, and perhaps decades, to come. That death rates will decline is almost certain as a consequence of economic development and improvement of health and hygienic facilities. Thoughbirth rates may decline also, it is common experience that a decline in birth rates usually follows rather than precedes a decline in death rates, and some recent spot checks in and around Delhi have shown that birth rates are as yet very high.
As regards the migration component, it should be said that according to preliminary findings of the Delhi School of Economic, Greater Delhi Survey, immigration to urban Delhi has stedily increased since the early 1940. Table 8 represents the number of immigrants from India (1.e. immigration of non- refuges) in the llast sixteen years. As may be seen from this table, the index of non- Refuges Immigration into Delhi moved very high over the 14- year period 1942 to 1956. For the purpose of analysis, this period may be considered in three parts, with ranges 1942-46, 1947-56. The index during these phases followed the same pattern, though at different levels, reflectingpoltical and economic events of each phase.
During the period 1942-46, the index showed only a slow increase ; a shift from 100 in 1942 to 118 in 1946. The job opportunities offered by urban Deli during this period were slightly above normal because of war effects, but the primary incentive to move to Delhi was not very high. However, Delhi establishment as the capital of free india in 1947 provoked an acceleration of in- migration. The opportunities offered by Delhi as a primate city of the region widend. The index, during this phase, jumped from 118 in 1946 to 192 in 1950 and 171 in 1952. In the third phase, 1952-56, the index registered a still sharper increase. This was because the increased developmental and construction activities generated by the five year plan served as a much stronger centripetal force. The enhanced opportunities for jobs in Delhi and relative paucity of employment opportunities in rural areas led large numbers of immigration to come to Delhi every year during this period. The index in 1955 thus rose up to 283, and most probably this rush continue unabated.
The study of Table 8 indicates that the past pattern of migration into Delhi is to likely to change unless drastic steps are taken to prevent further migrante from coming to Delhi. It is difficult to see how this could be achived in the absence of strongly totalitarian measures except by the establishment of industrial towns in the surrounding areas of Delhi ( e.g. Ghaziabad, Faridabad, and others) which might absorb a large part of the immigration destined for the national capital. However, if these likely that the area comprising Delhi and the adjoining eight tehsils would have, by 1981, a population of close to 10 million.
TABLE 8 Number and Index of Non- Refuge Immigration to Urban Delhi
Year of Arrival Non-refugeImmigrants
Index 942-100
1940 6,0361941 7,3731942 13,4231943 10,568 79.81944 13,992 105.61945 13,710 103.51946 15,614 117.91947 21,403 161.61958 20,792 157.01949 15,139 114.31950 25,435 192.01951 16,684 126.01952 22,635 170.9 135.71953 24,847 187.6 148.91954 31,059 234.5 186.21955 37,468 282.9 224.61956 28,753 217.1Source : Delhi School of Economic, GreaterDelhi Survey.
RELATION OF URBAN TO RURAL POPULATION IN 8 TEHSILS around DELHI IN 1981.
It remains to estimate the relationship between urban and rural population in the eight tehsils surrounding Delhi. As can be seen from Table 9, it is estimated that the total population of this area will increase from 235 million to 4.28 million in our average projection, 1.e. that it will increase by 82 per cent. At present only about 16 pr cent of the population of this area is urban, but this proportion is undoubtedly rising, since, as we have already mentioned, the areas contiguous to Delhi territory have developed in recent decades sizeable urban aggregations.

In order to obtain a picture of the urban – rural distribution of population in these tehsils in 1981, assumptions had to be made about the probable weight of urban centres in the demographic picture of this area with reference to the distance and accessibility of each area from Delhi, their geographical location with reference to the main present and prospective transport arteries, the actually facilities, such as water power, etc., which must be provided if the urvan centres assumed to develop in these eight tehsils will actually be established.
TABLE - 9
Estimated population ( Urban and Rural) Tehsils around Delhi (figures in lakhs)
Percentage of urban to population Total population 1981(estimated) Urban Rural Total Actual mod. Urban Rural Total Ghaziabad 0.83 3.42 4.25 19.4 50.0 4.4 4.4 8.8Bagpat 0.52 3.65 4.17 12.5 30.0 2.3 5.5 7.8Sonpat 0.30 2.24 2.54 11.8 40.0 2.0 3.0 5.0Rohtak 0.72 2.40 3.12 23.0 40.0 2.2 3.3 5.5Jhajjar 0.31 2.93 3.24 9.7 15.0 0.7 4.1 4.8Gurgaon 0.28 1.41 1.69 16.9 33.0 1.0 2.0 3.0Ballabgrh 0.38 0.91 1.29 29.1 60.0 1.4 1.0 2.4Sikandarabad 0.40 2.77 3.17 12.6 20.0 1.1 4.4 5.5TOTAL 3.74 19.73 23.57 15.9 35.3 15.1 27.7 42.8
Thus it might be expected that the tehsils of Ballabgarh, Ghaziabad, Sonpat, which already possess significant urban areas ( e.g. Faridabad, Townsip, Ghaziabad and Sonpat) and which offer good prospects ( though at different levels) of development of progressive uurban communities, will have 60, 50and 40 per cent respectively of their 1981 population in urban areas. On the other hhand the tehsils of Jhajjar and Gurgaon which in 1951 had only 10 per cent and 17 per cent respectively of their populations in the urban sector, have relatively poor possibillties of developing substantial urban communities because of their inadequate communications, poor drainage, and non- availability of good water. The proportion of urban population in these tehsils in 1981 may therefore not be expected to be above 15 and 33 per cent respectively. Similarly, estimates of the urban population for the tehsils of Bagpat and Sikandarabad are rather low because of their being primarily good agricultural areas.
To sum up : by 1981 thh epercentagee of urban population in the tehsils around Delhi would be 35.3% or about one – third of the total projected population. In 1951 the proportion of their urban population was only 15.9 per cent, and only 3.74 lakhs of persons were living in urban areas in the eigt tehsils adjoining Delhi. According to estimate in 1981 the total urban population may be 15.1 lakhs or more than one-third of the total projected population. Thus three would occur approximately a five- fold increase in the urban population in the tehsils around Delhi, compared to less than a doubling of the totl population in these tehsils.7. THE CHARACTERISTICS of the Future population of Delhi

In the preceding section we have described the approximate magnitudes of the prospective population of Delhi City , Delhi State , and the surrounding contry – side . We now turn to a brief statement on the haracteristics of this population . We shall be concerned chiefly with three sets of magnitudes . First the sex composition of the population secondly , its age structure and finally , the number of house holds and the distribution between person in the labor force and those dependent upon them. All thres of these distribution are of significance fir planning The first two are important in indicating the need for housing , school , and other facilities , the last one in order to serve as a basis for estimation the needs for housing of the working force and its allocation between different branches of production . [Estimates relating to the working force will be presented in the next chapetar].
Although there nexist fairly accurate methods of projecting the ago and sex distribution of a population for future periods , lack of adequate date make the application for future periods, lack of adequate data make the application of these methods inadvisable in our case . The component methods is generally considerd to yield the most accurate population projections , it involves a separate analysis of the changes affecting each component of population namely fertility, mortality and migration , In the case of Delhi we have felt it inadvisable to apply this methods , using ago cohorts , because of the vital role of migration in the growth of Delhi population, data on which are extermialy defective; and secondly, because the degree of fefinment which this method would have yielded was out of proportion to the amount of effect that would have been required to obtain adequate are specific life tables for Delhi. Since this method was used by Coale and Hoover and the planning Commission in their projection of the population of all india, we have preference to use proportional figures for Delhi ntom those presentd in their work.
Table 10 presents in its upper park the distribution of Delhi population, as contrasted to that of India by sex. As can be seen from this Table, the age and sex distribution of Delhi differ from those of india in several respects. Let us first at the age distribution.
TABLE – 10
Comparison of Demographic Characteristics : Delhi & all India, 1951
Classification Age GroupsYears.
DelhiState
All India
1.Infants and youngChildren
0-4 14.6 37.7 13.5 38.3
2. Boys & Girls 5-14 23.1 24.83. young Men and women
15-2425-34
19.615.8
17.415.6
4. Middle agedMen & Women
35-4445-54
11.4 54.7 7.9
11.9 53.48.5
5. Elderly persons 55-6465-7475 and above
4.32.3 7.61.0100.0 100.0
5.12.2 8.31.0100.0 100.0
Sex Groups Males Females
56.843.2
41.448.6
SOURCE ; Census of India, 1951 Delhi State Handbook and All – india Tables.
See Ansely J.Coale and Edgar M. Hoover , population Growth and Economic Development in Low-income Countires, Princeton, 1958 , and Central Statistical Organization, population projections fpr official use pending 1861 Census ( No.cso/pu/59-5), New Delhi, 1959 (mimeographed)
The major differences between the age distribution of Delhi and india are the following. India has a higher percentage of children under 14 yearsthan Delhi, but in Delhi as a whole. The proportion of the population in the most active age group, 15-54, is higher inDelhi, than in inmdia, and the proportion of elderly and old people is higher in india than in Delhi. The differences are not very great , and , in general, the two distribution show fairly similar pattern. It is interesting to observe that the main reason for the fact that in Delhi 54.7 per cent of the population are in the age group 15-54 , as against the somewhat smaller percentage of all –india of 53.4 is due to the relatively high preponderance of persons in the age group of 155-34 in Delhi as compared with india. For whereas young men and women make up 35.4 per cent of Delhi population , they make up only 33 per cent of the population of india.
The explanation for the higher proportion of infants and young very childernin Delhi, as compared with india, may be due to the fact that the refuge population, which had arrived only a few years or even months before the census, brought many children along, whereas some adults remained in Pakistan, and others who might have come ere killed n the troubles taking palce at the time of partition. The higher proportion of persons innthe younger working ages is due to the attractiveness of Delhi as an endpoint for migrants in search of employment for economic betterment. Inthis respect Delhi differs little from other large cities in india. For as has been shown in a study on migratory pattern in Bombay, Calcutta, and Madras, the largest proportion of migrants to these cities are in the younger age groups between 15 and 34, whereas in the age groups above 35 there occurs either not emigration or only a small trickle of in- migration.
The pattern of migration is also mainly responsible for the divergence from equality of the ratio between the sexes. Delhi, as other large Indian cities, presents this unequal sex ratio, which has been confirmed by numerous among the population in the working ages. Thus we find that whereas in India the ratio between males and females amounted 51: 49 , in Delhi the corresponding ratio in 1951 was 57:43.
The data for 1951 on the distribution of Delhi population by age and sex are only the base – line from which further projections for these distribution may be made. In the explanatory Memorandum on population projections of the Central Statistical Organization , there are contained a series of data on the future age and sex distribution of Delhi population which are presented in Table 11.
TABLE - 11 Age and sex Distribution of The population , 1956-1981
Year
0 - 14 15 – 64 65 & over All Ages 0 - 14 15 – 64
65 & over
All Ages
Males
Females
Males
Females
Males
Females
Males
Females
Males +Females
Males +Females
Males +Females
Males +Females
I In 1000’s of Persons1956
490 386 670 502 39 31 1199
919 816 1172 70 211
1961
587 508 778 606 40 32 1405
1146 1095 1384 72 255
1966
710 615 850 757 47 47 1607
1419 1325 1607 94 3026
1971
780 720 1100
950 50 50 1930
1720 1500 2050 100 3650
II Percentage within Each Age Class III In percentages of Total Population1956
55.9 44.4 57.2 42.8 55.7 44.3 56.6 43.4 41.4 55.3 3.3 100.0
1961
53.6 46.4 56.2 43.8 55.6 44.4 55.1 44.9 42.9 54.3 2.8 100.0
1966
53.6 46.4 52.9 47.1 50.0 50.0 53.1 46.9 43.8 53.1 3.1 100.0
1971
52.0 48.0 53.7 46.3 50.0 50.0 52.9 47.1 41.1 56.2 2.7 100.0
1956*
50.4 49.6 50.5 49.5 48.0 52.0 50.4 49.6 41.4 55.0 3.6 100.0
1981*
50.3 49.7 50.4 49.6 48.4 51.6 50.4 49.6 42.1 54.4 3.5 100.0
Source: Data for 1956-1971 from Central Statistical Organization, Population Projections for Official Use Pending 1961 Census, (Document No. CSO/PU/59-5), New Delhi, 1959.
Data for 1976-81 from A.J. Coale and E.M. Hoover, Population Growth and Economic Development in Low-Income Countries, Princeton, N.J., 1958, p.35.
The outstanding trond which is discernible in the Table is the gradul evening out of the ratio between males and females in the entire population as well as each age group . In fact , it is anticipated that in the later years the number of females in the age group 65 and over will exceod that of males , It should be remembered , lowever , that the age and sex distribution for 1976 and 1981 are computed not on the

basis of the data provide by the Central statistion organization but rather on the basis of date taken from the kork of A.J. COALE AND e.m. Hoover , so that the date for these two years are not atrictly comparable with those for carlier years . It is likely , ebove all , that the number and proportant of miles in the working ago from 15 to 64 is understated and that even in 1981 the rateo between males and females in Delhi is more likely to be closer to 52;48 [as is expected to be the ratio in this ago group in 1971 than to a ratio of almost 50;50 as is indicated by the Table.
The general pattern of development in the distribution of Delhi population age-wise is more difficult to discern. Here lo, an element if doubt seems to be introduced by the fact that the data for 1976 and 1981 come from a source than those for earlier years . it may be expected that th3 decline of the proportion of persons in the age group 0-14 will be faster than shon in the table, and hence that the proportion of the population in the working force ages will be larger in the last two yers. In other works, though it may well be expected that 42.1 per cent of the population will be in the age group 0-15 in all India in 1981, the incidence of lower births rates in a predominantly urban area, such as Delhi, likely produce the result that the proportion of the population in Delhi State in the age group 0-14 will not be above 40% in 1981. And that the proportion of the population in the working force ages will be larger than indicated in the ximately only 39.5 per cent of the population will be in the age group 0-14 and close to 57 per cent in the age group 15-64.
On the basis of this reasoning we may assumc that if the population of Delhi Territory reached the lavle of 5.5 millions in 1981 ,and if 57 per cent of this number is in the working forco ages. This ago group would comprise. 3.135,000 persons . If 52 per cent are males and 48 per cent femelas we would have 1,63,000 males and 1,505,000 fameless in the age group corresponding to the working ages; Since the total working force of Delhi in 1981 is estimated to comprise 2,090,000 persons , and since we may assume that persons younger than 15 years or older than 65 years will make up a negligible sharo of the working force more than 500,000 women will comprise the working force , assuming that not all males of corking force ago are capable of willing to work . There are a number of trends already visible which are likely to contribute to this result . There are more training facilities made available for women, age of marriage tends to move upwards and the custom of married woven accepting employment is far from in exception .These factors need to be borne in mind in planning for the housing and other overhead investments for the community
The estimates mentioned in the preceding paragraph are based on the assumption that the total population of Delhi willing a size corresponding to the average of the 6 projections presented for Delhi Territory in Table 7. If population should rise more steeply , each age group will of course have a large number of members , and if the population should grow more slowly, It well have a smaller number . Howe ever it must be repeated that throughout we have made rather conservative estimate as to the overall growth of the population and that , for this reason , the figures presented in the proceeding paragraph should be regarded as minims.
It finally remains to make an estimate of the future number of households in Delhi . This is also a datum which is of important for planning , Since it determines the prospective housing needs of the urban population As already mentioned , population estimates drawn from the Greater Delhi Household Survey of the Delhi School of Economics show that the average household in urban Delhi comprised 4.55 persons . It may be assumed that this proportion will not decline significantly up to 1981 in view of the overall trends of population distribution between different age groups . hence if we assume that the average size of a house-hold in urban Delhi will be composed of 4.6 persons we arrive at the following number of households in the coming decades,
Table-12 Number of household in Urban Delhi 1961-81
Population Gorwth 1961 1971 1981Total population in millions 2.14 3.31 4.98Number of Households 475,600 735,600 1,06,700
From this table , it is apparent that the number of households in Delhi city will increase between 1961 and 1971 by about 260.000 and between 1971 and 1981 by 370,000 or during the earlier decade by approximately 26,000 households per year , and during the subsequent decade by approximately 37,000 houseeholds per year . These global figures are only of limited value for planning purposes . As has been already peinted out. The major value of date on households is for the use of planning of housing school sands other neighbourhood facilities . For these purpose a breakdown of households by size and preferably also by income would be welcome . Unfortunately it was impossible to adduce these date since they depend upon extensive field surveys which are not available at this time . However, it is to be hoped that by the time the Greater Delhi Household Survey , undertaken by the Delhi School of Economics , will be published data on distribution of households by size and income will became available and that future plans for housing and associated neighbourhood facilities can be based on more precise date than are available now.
NOTE ON 1961 CENSUS A Census of population was conducted in India in 1961 ,the preliminary figures of which have been released . Accordingly as of March 1, 1961, the population of India excluding the population of Manipur , North –east Frontier Agency , Nagaland and Sikkim , was 436,424,429, people . However , it the population of the territories mentioned above However , it the population of the territories mentioned above is included ,the probable population figure would be about 438 millions ,. This count is thus considerably more than the upper limit of population projection [431 million] worked out by several experts and Including those assumed earlier by the planning commission . According to the preliminary and provisional figures of 1961 census the population of the Delhi union Territory [Delhi States] as on March 1, 1961 was 2,644,059 , The decade 1951-61 has shown an increase of 51.6 per cent or of over five per cent per annum . Thus , during the preceding decade Delhi population increased by over nine Lakhs of people.
It well be observed that throughout this planning report as also in this chapter and the related figures on working force composition etc . In Economic Base Chapter and for the assessment of housing needs ,etc . the basic figures used are taken from the Census 1951 . It may ,however , be seen from Table 7 of this Chapter that the provisional 1961 census population figures of 2.64. Million for the Delhi States are quite close to the estimated projected population of 2,58 million [average of four projection ] for1961 and, in fact ,the Census figures for Delhi State compare exactly with the population . [see Table 7,population of Delhi Territory High] [4.25 per cent annum] on the other hand the estimates for urban Delhi fall short of the ‘actuals’ by about two lakhs million but is rather close to one of the high projection of 2.29/ [Refer Table 7. Population of urban Delhi ; High 4.76 per cent per annum].
Refer 1961 Census Table office of the Registrar GENERAL , India /.
IT may be mentioned here that in preparing the general land use plan, in assessing the prospective needs for urban amenities and utilities of housing and land for various uses. As well in other contexts also the basis for the calculation was the data provided by Census 1951 and of the preceding decades .
With the availability of the 1961 census data on the composition of the working force, household structure livelihood classes etc., it may become feasible structure , livelihood classes etc . it may became feasible at a later stage to modify the various assumptions and accordingly certain recommendation may become necessary . Moreover ,the basic pattern of land use proposal and the planning frame work embodied in the Master Plan is flexible enough to accommodate such minor deviations. .

CHAPTER 4THE ECONOMY OF DELHI
1. INTRODUCTION :
The purpose of this chapter is to provide a general description of the economic structure of Delhi as it appears at present and has developed in a recent part, to relate this to the special position which Delhi occupies in the economy of India and the region of Northwestern India, and to indicate the major trends in the development of the economy of Delhi and its immediate environs which have relevance for the process of urban planning. It is clear that, especially with regard to this last point, the extrapolation of past trends allows only very limited projections. Assuming that the past trends would continue unabated, the future of Delhi’s economic structure could be determined to a certain extent. But since India is in the midst of a planning experiment of vast proportions and since economic planning in India is designed to break through past trends and replace them by new approaches, there is little justification for simply extrapolation past trends into the future and we must make assumption about Delhi’s prospective economic structure which will, in some measure, be correlated with the overall economic planning under the present and future Five Year Plans.
It may, however, be assumed that the fulfillment of overall economic planning will require the most rational and efficient use of resources and that any projection of Delhi’s future economy can be based on the assumption that it will be in the interest of the accomplishment of overall planning in India. If any special advantages which already characterize Delhi’s economy, will be preserved. In other words, in making projections for Delhi’s economy for the next 25 years period, it has been assumed that the general advance in India’s economy will remove the economic rationale for some highly uneconomical occupations which are still carried on in Delhi and that these will be replaced by more efficient and economical ones.
The determination of the projected economic structure of Delhi can be made in terms of the distribution of the gainfully employed or the distribution of the State income by major sectors of economic activity. It has been attempted to carry out both our projections, but more reliance can be placed on projections of the labor force, rather than of State income.
In making these projections of some indicators of the prospective economic structure of Delhi, it is important to being with the situation as it is now and as it has developed in the last few decades. The past development and the present economic structure (and hence present distribution of the labour force) of Delhi is determined by a number of geographical and socio-structural realities which must be taken account of Delhi is the capital of a great country and has, for this reason, a large number of administrative and other governmental functions to perform for the country as a whole. Delhi is, moreover, the center of a network of urban places in Northwest India, and in this role performs many of the central city functions appropriate to such a center, in such field as commerce, finance, transport and professional and other skilled services. These features which are due to Delhi’s location and overall function within the Indian political and economic system have their reflection in Delhi’s working force structure and in the sectoral distribution of Delhi’s State income. Moreover, these features are likely to continue to operate in the future and any projection of working force or State income data must take this into account.
In more concrete terms, the working force of Delhi State in 1951 showed that almost 20 percent were engaged in commerce and finance and only slightly smaller proportions in industry and mining and in public service. Together these three sectors provided gainful employment for 55 percent of the labour force of the State. In agriculture, on the other hand, which also where in India employs the largest proportion of gainfully employed, a livelihood was provided for a little over 10 percent of the working force. If Delhi’s economic structure is measured in terms of State income, rather than the distribution of the working force, a similar picture can be obtained. In 1955 about a quarter of the State income was earned in commerce and finance, another 20 percent in public service, and a further 18 percent in industry and mining. Here again these three sectors of economic activity combined account for 63.25 percent of the total State income, and agriculture, which normally accounts for the greatest proportion of income earned in other state, only comprised less than 4 percent of all income earned in Delhi state in 1955. These facts clearly point to the overwhelmingly urban character of Delhi,

and are responsible more than any other single factor for the superiority of average income in Delhi state over that of all other states and that of India as a whole.
This heavy concentration of the working force and state income in commerce and related activities, public service and industry is the basis from which projections of the future composition of the working force and structure of the economy of Delhi must proceed. Yet it should be remembered that the future composition of the working force, and hence the sect oral distribution of the state income, will depend to a considerable extent on policy decisions, i.e. the rate and effectiveness of implementation of the all India Five Year Plans, as well as the plan for metropolitan development presented in this report. These considerations are reflected in our projections for the next 25 years. The overall result of these projections is the following. The working force of Delhi is expected to rise from approximately 635,000 in 1951 to over 2 million persons in 1981. It is expected to increase by almost 50 percent per decade, so that in 1981 it will be more than three times the absolute size of 1951.
The distribution of the working force among the main economic sectors will remain rather stable, although commerce and public services will be slightly less prominent, as compared with the present, and a higher rate of growth is foreseen for industry than for either commerce or public service. In brief, whereas industry is likely to employ around 25 percent of the total working force, the share of commerce and finance will remain at the present level of 20 percent and the share of public service workers will fall slightly from almost 17 percent to somewhat less than 15 percent. The decline in the share of public services works will be more than counter balanced by the growth of the working force in the professions and liberal arts, and in transport and communications. The declining trend of agriculture is likely to continue, and its share in the working force may fall by 1981 to less than 5 percent of the total.
These projections parallel on the whole a general trend observable in other cities of India, and are in congruence with general developments which may be expected in a country experiencing economic growth. As a result, the organized modern sector of Delhi’s economy will increase, and the non-organized traditional sector will decrease in significance. It is estimated that in 1951 about 61 percent of the total working force of Delhi was in the non-organized sector, and this proportion is expected to decline, by 1981, to 41 percent. If this figure seems too high, it may well be remembered that Japan, being a widely industrialized country still has 37 percent of its non-agricultural working force in unincorporated, small, tradition-oriented establishments.
A final observation on the place of manufacturing in Delhi may be in order. It is desirable that those manufacturing plants which are obnoxious, because of their impact on air or water pollution, or plants which require large space be removed from the center of the city to relatively outlying areas or into the open country. Though most of the industries which are probably to be established in Delhi will have few or more of these obnoxious characteristics, it may still be desirable to decentralized manufacturing activity not only within Delhi territory but within the Delhi Metropolitan Area. It has been estimated that such a process of decentralization could move some 114,000 workers in manufacturing away from Delhi and into the outlying parts of the Delhi Metropolitan area chiefly to the towns of Ghaziabad and Faridabad. The net result of such a shift would be that Delhi’s working force would be smaller, that it would have a significantly smaller share in manufacturing and that the working force of these outlying towns would have close to 40 percent of their working force in manufacturing. It would also have the effect of reducing the projected total population of Delhi urban area from close to 5 million persons in 1981 to 4.6 million and the total population of Delhi state from 5.5 million in 1981 to 5.0 million.
2. THE CONCEPT OF ECONOMIC BASE:
To a considerable extent the character of a city’s economy is relayed to its size, and there is normally a significant distinction in the economy of a large metropolitan centre with more than a million inhabitants and that of smaller cities and towns with populations between 20,000 and a million. The large a city, the more varied are the services which it renders, and the larger is the hinterland over which it exercises some kind of economic influence. Though in each community a considerable proportion of the workers earn their livelihood by producing goods and services for one another, all, except some totally self-contained isolated villages, produce some goods and services for persons residing in other communities. In the larger urban centre a sizeable proportion of the goods and services produced are exchanged against goods and services brought into the urban centre from the outside. A city gets most of its foodstuffs and raw materials from outside its borders, and supplies in exchange urban-made goods and services. With enhanced division of labour, we witness not only a specialization of production between urban and rural regions, but also between different cities. In consequence a modern city not only produces commodities and services which it exchanges with the countryside, but also with other cities. Hence, we may regard a city’s economy as being composed of two parts, one part consisting of activities which keep the inhabitants of that city supplied by mutual exchange of goods and services
among themselves, and that part which comprises all those productive activities designed to produce the ‘exports’ against which the city exchanges the commodities it brings in from the outside.
These distinctions between activities having their end and origin within the city and those which have an impact on areas beyond the city have led to a widely used classification distinguishing a city’s ‘basic’ and ‘non-basic’ economic activities. The basic activities of a city consist of all those forms of production which are exchanged with the outside. For example, the basic function of a city like Kanpur or Ahmadabad is the production of textiles and other consumption goods which are consumed primarily in other parts of India. Similarly, the basic function of Delhi is its supplying the services of the Central Government for the entire nation and various wholesale trading and banking services for Northwest India. But Delhi has also some basic functions in some fields of manufacturing, though they are less pronounced than those in public service and wholesale commerce.
Yet, there is not necessarily a close correlation between a city’s basic active ties and the distribution of its working/force or its total income. In a large metropolitan center, moreover, there are a considerable number of activities and employment opportunities which are directed towards the production of commodities designed to fill the needs of the inhabitants of the city. The persons who sell at retail, the repair-shops and institutions such as schools, medical and recreational establishments, but also laundries and cleaning establishments, barbershops and beauty operators, and many other professional and personal services have primarily a non-basic character, i.e. they are rendered by inhabitants of a metropolis to other inhabitants of the same metropolis.
It is therefore not simply to work out to a clear-cut distinction between a city’s basic and non-basic functions. Only if we, had adequate data on ‘imports’ into and ‘exports’ from the city could we measure the distribution of the working force and the sources of income earned as between basic and non-basic activities. For this reason also the judgment on what are the basic activities of a city cannot be made on a strict quantitative basic, but it is rather a qualitative or interpretative statement.
It is noteworthy, moreover, that there exists in most countries a rather fixed ratio between the expansion of a city’s basic activities and its non-basic activities. For every additional 1000 governmental employees who find work in Delhi, there must also be added a certain number of ‘services’ workers in retail business, educational and health services, and other fields to sustain this additional population. It would
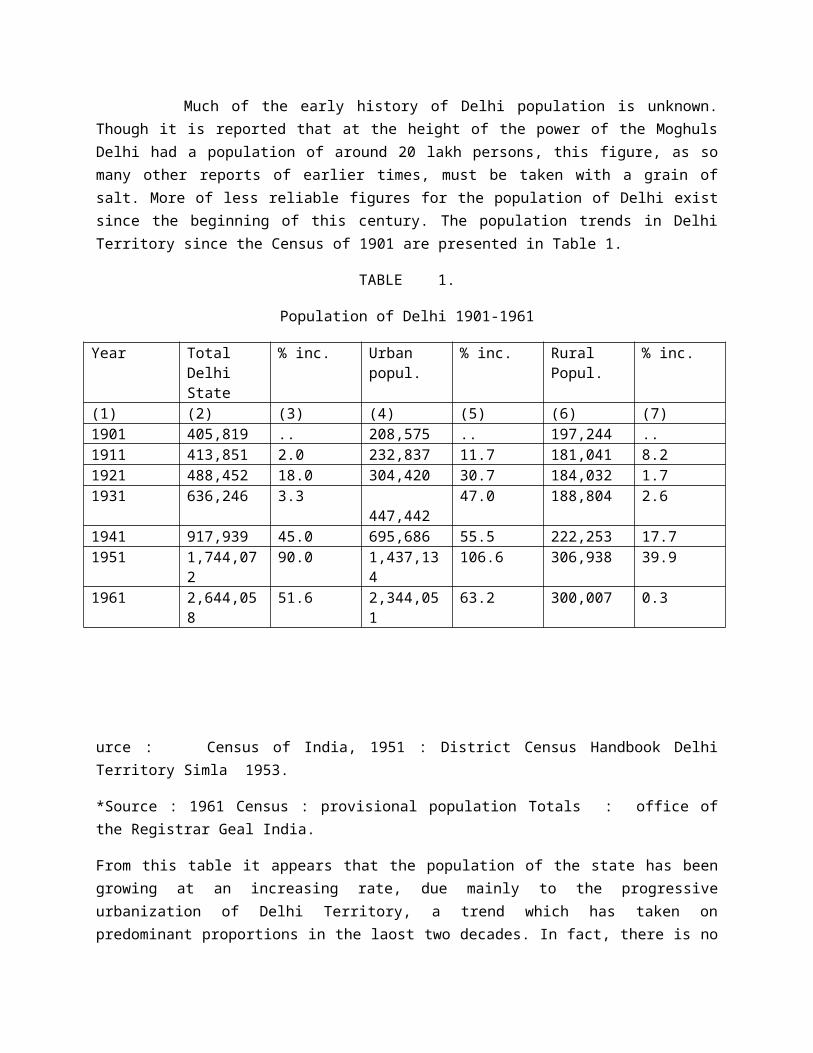
be very useful if these ratio could be determined accurately, since this would provide a guide to how many and what kind of additional facilities must be planned for, if an expansion of a given size in one of the city’s basic activities is contemplated. Unfortunately, these data are also unavailable, and it is difficult, for these reasons, to analyze the economy of Delhi strictly in terms of the basic/non-basic dichotomy.
Although this distinction provides a useful foundation for the study and analysis of the economic structure of an urban area, the ratio between basic and non-basic or between primary, secondary, and tertiary activities cannot be reduced to a fixed formula which can be applied to foretell the future of the growth of a community. An urban economy is too complex and too closely inter-depended to allow a mechanical application of these ratios, and the treatment of the economic base of a city must, therefore, give way before a discussion of its economic structure as a whole.
It is therefore essential that in the formulation of policies for a comprehensive development plan for a large metropolitan area, which covers a period of twenty to twenty-five years, attention must be paid to the force and to the major variable that influence its growth. Such long term projections naturally involve some elements of uncertainly, especially when the past data do not lend themselves to easy interpretation. An added complication derives from the fact that the urban economy of Delhi will most certainly be influenced by the forthcoming five year plans. In this chapter an attempt is made to study Delhi’s economy in its various aspects, with the surrounding region as a frame-work, and to indicate some reasonable estimates of its future growth.
The variables affecting the future pattern of urban development are to be found in the demographic and economic relations of an urban area and its surrounding region and of the surrounding region in the national picture. In the preceding chapter, estimates of future population of Delhi territory and the adjoining areas have been presented. Future space and land-use requirements can be better determined if more is known about the economically active (and semi-active) population; its distribution between different branches of economic activity, and the role of each sector in the overall picture.
This knowledge of the present form and composition of Delhi’s economy, its relationship with the surrounding region, and its role in the national picture enables one to appraise its future prospects. Apart from the general demographic and economic characteristics, other aspects that have been studied in connection with
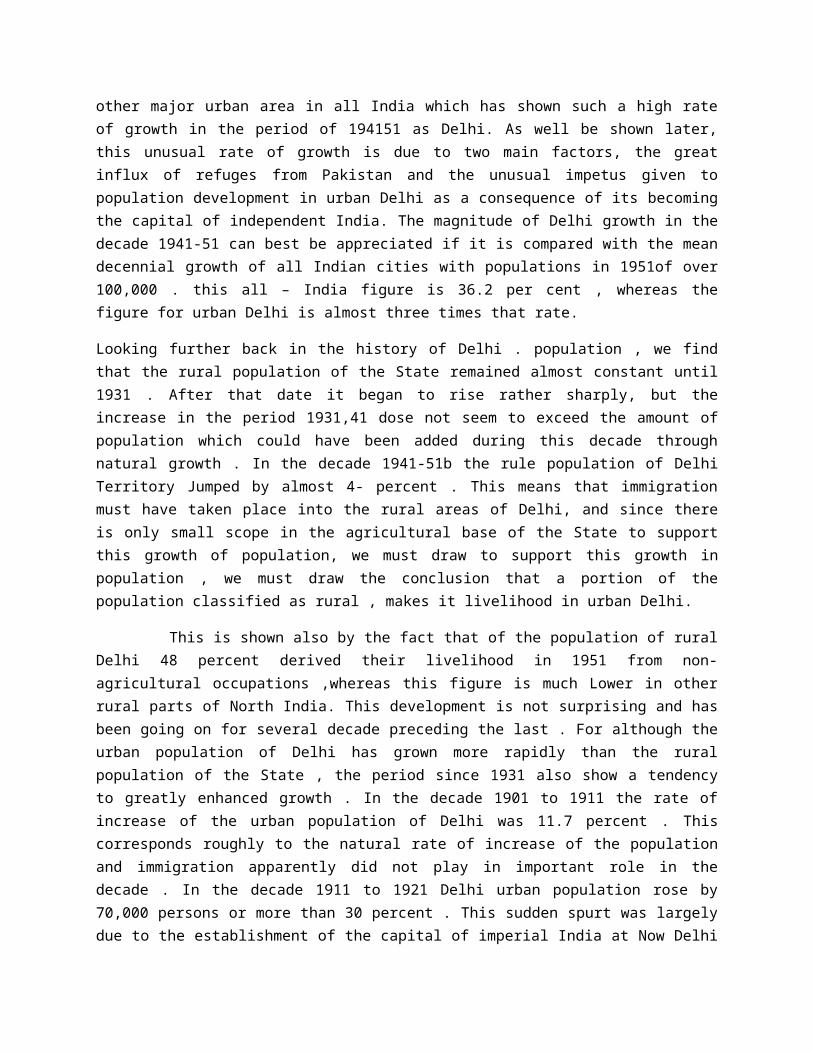
the economic base of Delhi are: its comparison with certain selected towns and cities by livelihood classes; the proportion of the working age groups to total population; the composition and characteristics of the working force; and a preliminary but comprehensive study of Delhi State’s income. Finally, some projections of the future working force have been made on the basis of which the land use requirements of the plan could be appraised. The economic base study thus provides the underpinnings in the formulation of the comprehensive physical plan, as well as the basic prerequisite for extended regional planning.
3. THE GEOGRAPHIC CONDITIONS OF DELHI’S ECONOMY:
The chief determining factors of the economy of Delhi are, part from those which affect the economy of India as a whole, (1) the natural resources to be found in Delhi and its environs; (2) the spatial relations between Delhi and other centers in India, especially as expressed in facilities for transport and communication; and (3) the social and occupational structure of the Delhi population. These factors together tend to determine the functional specialization of Delhi in the economy of India as a whole. In turn, these factors shall be investigated in order to derive the present and potential future economic base of Delhi.
In terms of location Delhi is situated very favorably. It is not an accident that on this very old site these has been for most of India’s history an important town, which beginning with the time of Muslim rule has been intermittently the major city of North India.
Delhi is located at the western end of the great Gangetic plain and the southeastern end of the access routes from inner Asia through Kashmir and the Punjab. At the same time, Delhi is the point at which the access routes from the ancient Cambay ports converged and reached the Yamuna-Ganga Doab. To be sure, the uestablishment of the India-Pakistan frontier has detracted somewhat from the relatively central position of Delhi, but the transfer of Lahore, the natural capital of the former undivided Punjab, to Pakistan has enhanced Delhi’s importance as the undisputed major urban center in northwest India. The nearest cities with populations of over 5 lakh are several hundred miles away, and within a radius of 200 miles around Delhi there are no important major towns besides Agra, Meerut and Jaipur. Amritsar is too close to the Pakistan frontier to command an important Indian hinterland, though it does from a secondary center with respect to Delhi.
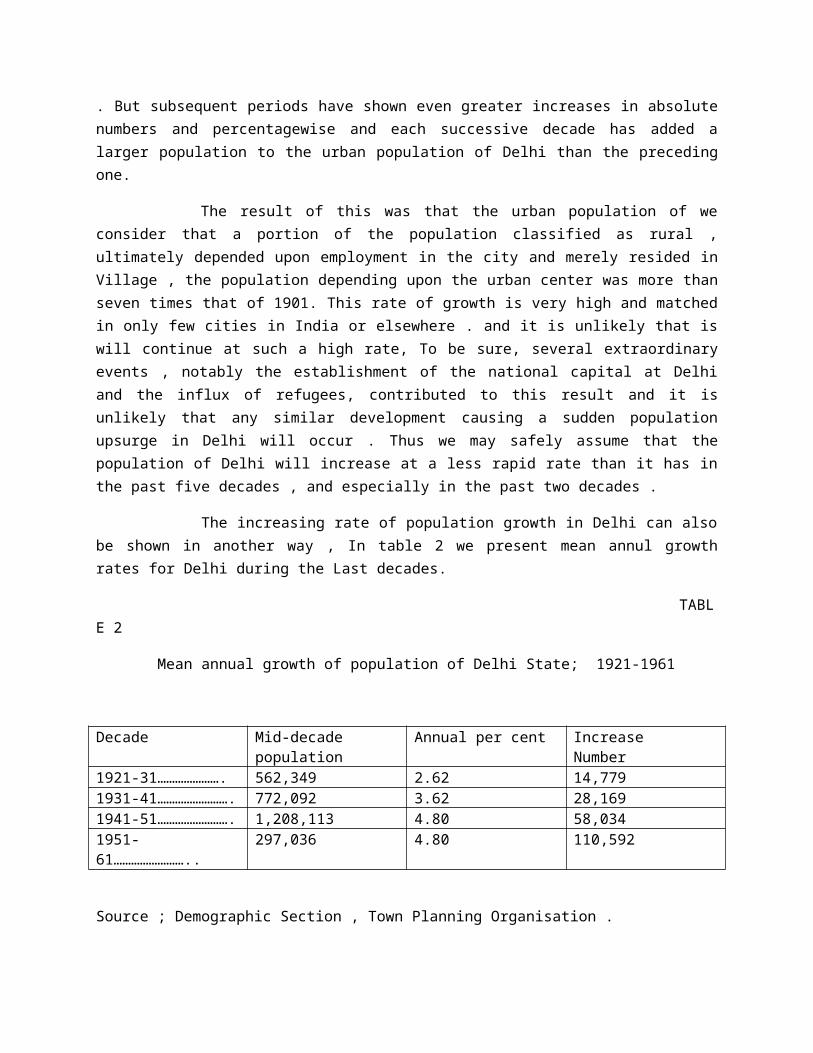
This means that in terms of location, and quite apart from the fact that Delhi is the national capital of India, it is the central city of an area which covers the Punjab, the western portion of U.P. and most of Rajasthan.
To the east and northwest of Delhi, moreover, there is to be found one of the most fertile and agriculturally most important areas in India. The districts in U.P. lying between the Yamuna and Gangas (Saharanpur, Muzzafarnagar, Meerut, Bulanshahar, Aligarh, Etah and Manipur), as well as the districts immediately east of the Ganges (Bijnor, Moradabad, Budaun and Shahjahanpur), contain some of the richest and most productive agricultural lands in India. Their output of wheat and sugar provides a portion of the most important food resources of India, and much of the land in these districts is irrigated and represents a higher capital investment than many parts of Indian agriculture elsewhere.
Similarly, the districts of the Punjab, especially north and northwest of Delhi, though drier and less productive than the parts of western U.P., are among the agriculturally more fortunate ones in the country. Though the Punjab primarily known for its food crops, it has, because of its drier climate and hence the prevalence of grazing ranges, an additional importance as a producer of cattle and other animal products.
In other words, unlike many other large Indian cities, Delhi is surrounded by relatively good agricultural land, and only in the southwest and the regions of Rajasthan is agricultural land less productive and poverty among rural dwellers considerable. This is an important factor in determining migratory patterns, since as a rule persons migrate primarily from those parts of the countryside in which agriculture is poor. The main immigrant stream into Delhi thus is likely to come from the southwest i.e., part of the southern Punjab, Rajasthan and the southwestern portions of the U.P. Of course, migrants to Delhi also come from other parts of India, e.g., some migrants come from as far as Madhya Pradesh and the eastern U.P. portions of which are also poor agriculturally. But migration patterns from these parts of India to Delhi are unclear, and Calcutta experts a strong pull on migrants from Bihar and the eastern U.P., and Bombay on migrants from Madhya Pradesh.
Apart from migration the relatively favorable conditions in the agricultural regions around Delhi also mean that the provisioning with food is not excessively difficult. Delhi is not likely to suffer greatly from famine and the costs of transporting most foodstuffs to Delhi should not impose excessive burdens / In other words. IFit can
be foreseen that agricultural produetion improves in India in the ceming decades , the unavailability of foodstuffs is not likely to be a serious impediment to Delhi,s future growth . Though it is not a port town into which foodstuff could relatively cheaply be brought from abroad , it is yet located within close relation with telatively productive food production areas, which will make certain that the availability of relatively casily and cheaply transported foodstuff will not impose a bottleneck on Delhi oxpansion .
The problem of creating sources of power in Delhi and Delhi,s onbirons is a more serious concern . With the development of the Bhakra Nangal and the Chambal power development schemes, the supply of power west of Delhi should be relatively abundant at least for the next few years. However , in the next fitcen years more new sources of power , elthr thermal of hudro- electric , will became important in the Punjab , the power situation in the western U.P. is worse at present and would from a scrious bottleneck to repaid industrial and general expaxion in that part of Delhi,s environs , However , there are under study a number of large-scale power projects which might greatly case the situation [and some of which might also add to the irrigated land in U.P. ] IF THEY ARE ACCOMPLISHOD , Among these the three most important ones are the proposed Nayer Dam near Hardwer , U. P. the Sarda Canal project which would serve mainly northern oudh; and the Jamuna schemewhich would harness the water –power of the Jumana River to serve mainly the western U.P. It is not likely that these project s will be completed by the end of the Third Five year plan will be completed by the end of the third Five years plan , but by 1981 they should allbe in operation .
Hence , a look at the resource basis of the hinter land of Delhi would reveal that from the long-rang point of view [i.e. considering time span of some 25 years ] It would mako possible considerable expansion in the population and the industrious carried on in Delhi and the region surrounding it provided that advances in agricultural techniques can be made and that already contemplated and eventually planned extension of power-production facilities will actually be accomplished.
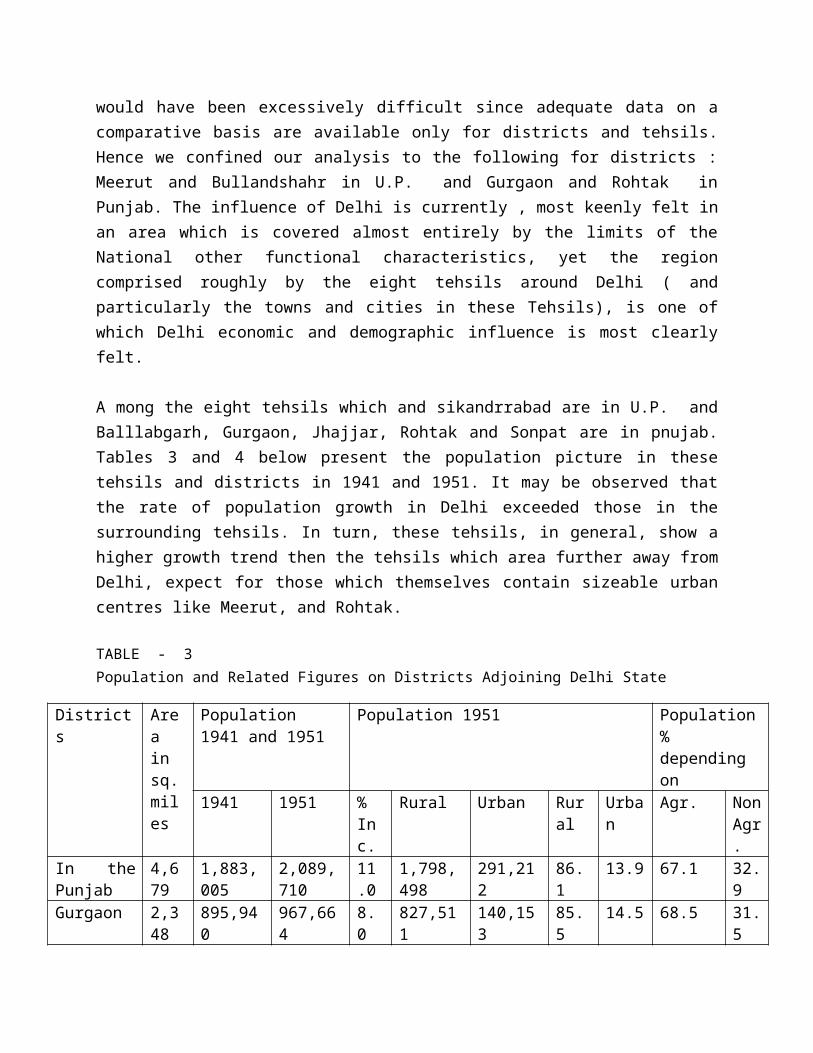
A brief consideration of the spatial aspects of Delhi economic is equally important to discuss here. As already pointed out, Delhi is the undisputed center of northwest India. It is in a certain sonce of dominant over all the cities in the north- western part of the country and its general sphare of dominance includes not only the Punjab and Rajasthan but also the western U.P.1.e. that portion of U.P.which stretch to approximately the old border between the provinces of Agra and oudh. In other words the, dominance of Delhi extends well in to the western U.P. up to Bareilly ,Shahjahanpur, and probably beyond Agra.
Delhi dominance, which makes itself specially fult in such centeral city functions as banking wholesale trade, to some extent education and research and facilities associated with research, is emphasized moreover by Delhi relativelty good transport connections with the rest of Northwest India. The very fact that the jamuna presents an important impediment to easy transport from one bank to the other makes Delhi location increasingly strategic. To be sure, there are other bridges crossing the jumna, but the jamuna bridge at Delhi is the most central and moreever is located in Delhi 1.e. is a functional appendage of an already extent mmajor economic and demographic concentration. Delhi is connected by direct railred lines with the main secondary centres surrounding it , and since some rail lines are borad gauge and other motre gauge, their mutual inter-connection at any place other than Delhi would be impractical. Delhi, moreover, is a road centre in hich of the main east-west and north- south highways cross one another. Even if an extension of the road system is contemplated, it would most economically and most suitably to built up as an extension of the presente over land road system with Delhi as a central nodule.
In other words, it may be said that the centrally which Delhi has enjoyed by becoming first the capital of British India and latre the capital of independent india is in itself a factor which will tend to enchance the ruturo centrally of Delhi from the transport and communications view point. But with enhanced centrality in this field, Delhi certrality with respect to north west india will also be reinforced in such fields as wholesale trade, banking, the skilled services industries (e.g., liberal professions and arts, business and scientific and educational services), as well as certain manufacturing industries which are closely associated with these
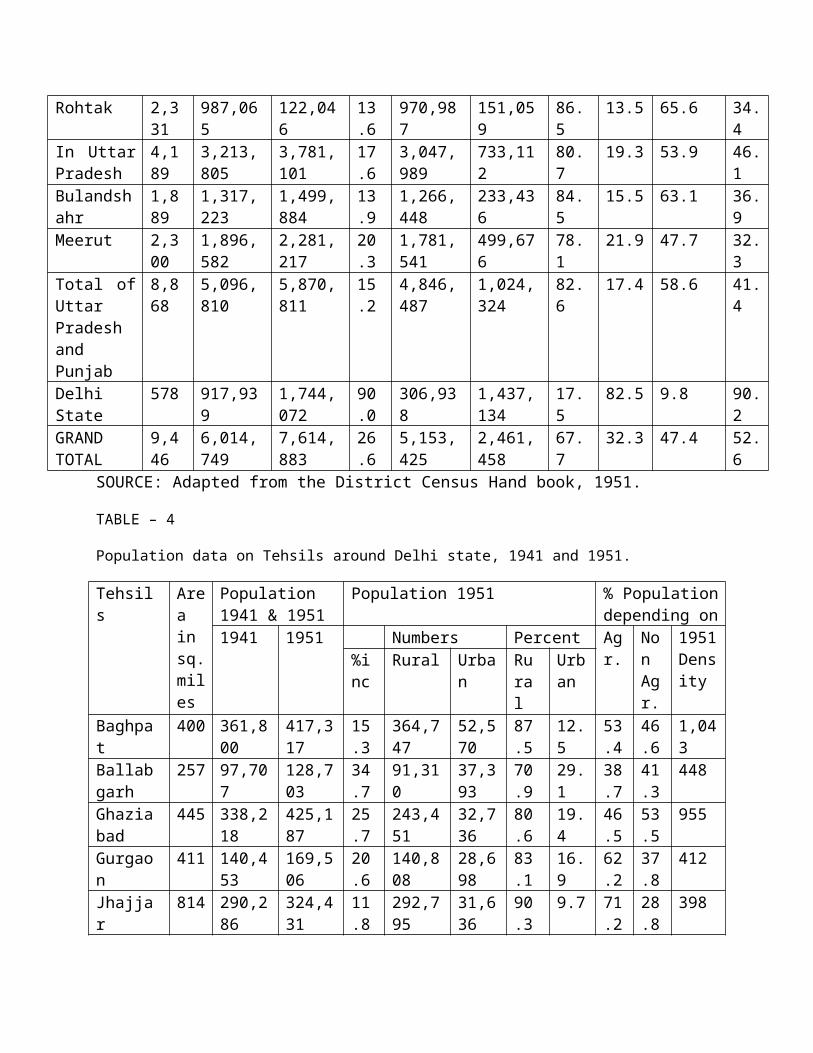
services ( e.g., printing and publishing, the manufactures of instruments and scientific apparatus), and some ancillary skilled trades associated with these industries ( e.g. watchmaking, production of jwellery , glass and precision machinery).
In other words, the historical developments, as well as the conditions provailling in Delhi geographical environment , have an important though nota ompletely determining influence on the composition of Delhi labour force and on Delhi economy. The actual and prospective composition of the working force of Delhi and the general structure of its economy in terms of Delhi territory income and its composition is now examined below in detail.
THE GENERAL CHARACTERISTICS OF THE WORKING FORCE OF DELHI.
The working force of an area is composed of all persons who are actually or potentially gainfully employed of engaged in productive activity. The working force thus comprises persons who are employed e.g., seeking work , but it is dies not include beggars, receivers of income fom rents or other sources without having to work: that is , it does not include these who receive an income without performing productive labour.
In 1951 the proportion of the working/force to total population on an all-India average was approximately 40 per cent. Delhi corresponding proportion was 36.34 per cent of total population . In urban Delhi , the percentage of the working force was 36.0persent in the rural portions of Delhi State it was 39.41 percent. In other words, the working force in the urban areas made up a smaller proportion of the total population than in predominantly rural areas. This appears to be a normal characteristics of India, in general. A number of studies by the National Sample survey and other agencies have yielded very similar percentages for the working force in other Indian cities of similar size.
These studies also indicate that in terms of the sexes the urban labour force contains 56.4 per cent of all males and 15.0 per cent of all females. The corresponding percentages for the working force in rural areas is 59.0 per cent for males and 32.3 per cent for females. In comparison with these data the working force of Delhi state in 1981 comprised 58.9 per cent of all its mles and 7.7 per cent of its feales, and in urban Delhi the corresponding proportions were 59.1 per centfor males and 5.4 per cent for females. In the rural parts of Delhi State the proportion of males in the working force amounted to only 57.8 per cent, whereas 17.4 per cent of all females were in the working force . Table 1 presents a comparative picture of the proportion of males and females in the working force in india as a whole and in Delhi.
It will be observed from Table 1 that females form a relatively small proportion of tye/working force , as compared with the all-india picture. It may be expected tht in future years the proportion of female participation in the working force will rise.
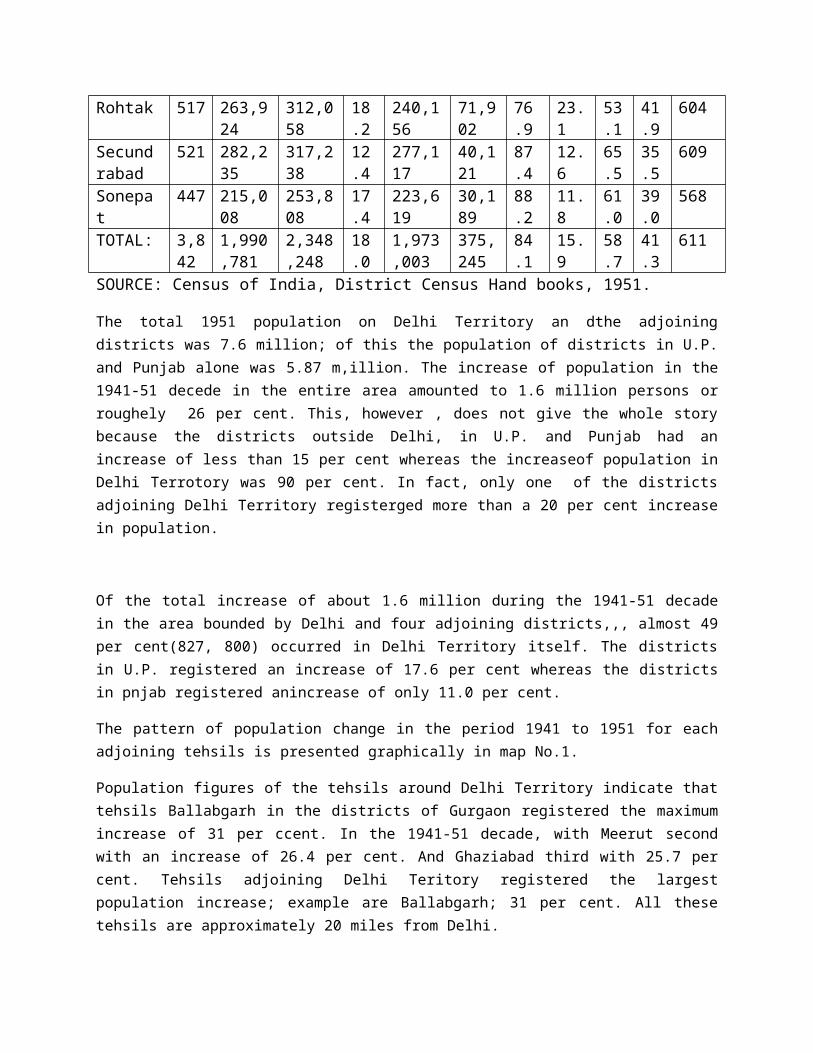
A examination of the absolute size of Delhi working force reveals that in 1951, Delhi State had a population of 1,744,072 persons of whom 639,129 were economically active. Among these latter 561,738 were classified by the Census of india as self-supporting persons and 77,391 as earning dependents. TABLE 1 Working Force Percentage to Total Population , Delhi and india 1951.
Working ForceAll India 40.1Urban 36.2 55.4 15.0Rural 45.8 59.0 32.3Delhi State 36.64 58.9 7.7Urban 36.05 59.1 5.4Rural 39.41 57.8 17.4
Source : Census of India, 1951, District Census Handbook Thus Delhi State.
Thus, as already peinted out, the portion of Delhi working force accounted for 36.6 per cent of total population, 32.3 per cent wrer self -suporting and 4.4 per cent were earing dependants. In the rural areas the number of earing dependants formed a large percentage of the total working force than in urban Delhi. The precise proportions were : rural Delhi total working force was 39.4 per cent of population, with 28.92 per cent self- supporting ,,and 10.49 per cent earing dependants. In urban Delhi, the total working force made up 36.05 per cent of the total population , with 32.91 per cent self-supporting workers and 3.14 per centearning dependants.
A similar picture is provided if the Delhi working force in 1951 with regard to sex is examined. In Delhi State out of every 100 persons in the working force, there were 91 miles and 9 females. In the rural areas out of 100 persons in the working force there were 80 males and 20 females, whereas in urban Delhi the proportion between males and females was 94 to 6. Yet urban women were, on the whole , better educated and more skilled and hence better equipped to participate in the working force than rural women.
The Census of India of 1951 did not classify the working force in terms of self- supporting persons and earning dependants, or by sex, but in terms of the main livelihood classes into which they belonged. Though the classification by livelihood classes has many defects and inaccuracies, a very rough but fairly interesting picture of the general nature of the occupational distribution of the working force of urban Delhi can be gained if it is compared with that o some of the other major towns of India. Table 2 presents a classification of the occupational distribution of the population in the ten major cities of India, as between the five majo livelihood class; agricultural ; production and other cultivation ( 1.e. manufacturing and mining); commerce ( including finance) ; transport; general service(including public service, professional, personal and miscellaneous services). TABLE 2
Distribution of population by Livelihood Classes in the Ten Largest Cities or India, 1951.
City Population Agr. Percentage inMtg.andMiD. Comm.and Finance Trans. Serv.
Greater Calcutta
4,578,071 1.3 31.0 25.1 9.8 32.8
GreaterBombay
2,889,270 0.5 35.1 24.3 8.4 31.7
Madras 1,416,056 1.9 24.8 22.0 9.3 42.0Delhi 1,384,211 0.6 17.3 26.1 6.1 49.4Hyderabad 1,085,722 2.0 19.1 19.8 7.8 51.8Ahmedabad 793,813 0.7 51.7 12.1 3.5 23.0Bangalore 778,977 1.6 32.1 19.1 5.2 42.0Kanpur 705,383 2.2 41.6 23.3 4.5 28.4Poona 588,545 3.2 25.1 16.4 5.8 49.5Lucknow 496,861 3.0 23.1 20.2 6.6 47.1Average(un-weighted)
1.7 30.2 20.8 6.7 40.1
Source : Census of India , 1951.
The general structure of Delhi overall occupational specialization can well be seen in distinction if compared with the proportional distribution of Delhi population by livelihood classes with the average of the ten largest cities presented in Table 2. The proportion of those depending on transport is close to the averge. The greatest deviations occur while comparing the proportion of these depending on manufacturing and mining on the one hand in Delhi and in other citis, on the other, and if we cpmpare the commerce , finance, and services sector in Delhi with other cities. Of all the ten cities , than has least emphasis on manufacturing . whereas on an average a little over 30 per cent of the population of the ten largest cities depends upon secondary industries for a livelihood, the corresponding proportion in Dellhi is only somewhat more than 17 per cent. HENce, Delhi may be side to be relatively little industrial city . and even if the population of the population field would rise to above 20 per cent , it would remain among the industrially least important large cities of India . The character of Delhi as a center of commerce , finance , and services stands out clearly from the table . The proporten of the population dependent upon commerce and finance in Delhi is larger than in any other large city of India, large even than in Bombay or Calcutta . In fact, there is scarccly another city in India , which has such a large population of its population depending upon commerce , and this fact would stand out even more plainly if be singled out old Delhi , where well over 30 per cent of the population depands upon commerce and finance for its livelihood . Only Ludhiana and Amirtser have a higher population of there population dependent upon commerce and finance than ‘id Delhi .
Finally . It is noted that Delhi,s concentration upon service is also clearly marked. Although the classification ‘services is a rather heterogeneous composite of miscellaneous activities administrative and professional service provide employment for a large share among Delhi,s earhers , and this is not surprising in a capital city. Again, the very high proportion of Delhi,s population engaged in service for a livelihood would be facussed more sharply it the various component parts of the city for comparision were selected . In New Delhi the proportion dependent upon services for a livelihead amounted to as per cent in 1951 . In comparison with the ten largest cities of India , the share of Delhi population depending upon services for a livelihood is 20 per cent larger than the average for than all , and larger proportion of its population dependant upon services than Calcutta , Bombay and Madras ,
THE GENERAL ChARACTERISTICS OF THE WORKING FORCE IN THE DISTRICTS SURROUNDING DELHI: Since as has been shown in a previous chapter in a previous chapter (chapter II of part I ) the area over which more or less detailed planning decisions will be made reaches beyond the boundaries of Delhi State, it is of interest to provide a brief description of the general livelihood patterns which prevailed in the four districts surrounding Delhi and some important portions of them in 1951. The region around Delhi conforms , in terms of distribution of settlements , fairly closely to the patterns found generally elsewhere in which a number of cities are related to one another in a network pattern . At the centre of this network is Delhi – within a radius of some 100 miles around
The ‘classical‘ Statement of this network arrangement of cities is contained in the work by Walter Christaller , Die Zentralen Orte in Suddeutsch land , Jena , 1933, more accessible Descriptions are to br found in the essay by Charles T., Stewart The size and Spacing of cities Georgraphical Review , Vol . 48 [1958] PP. 222-245.
It are several secondary cities, like Agra Meerut or Jaipur which , though much smaller in population than Delhi nevertheless maintain a ring of subsidiary cities around themselves , However , in some way ,these cities are dependent upon Delhi , though this dependence is slight , Within a narrower ring around Delhi is a much greater , Among this second group of cities and towns are places like Aligarh Karnal , and Mathura . In still narrower circul with a radius not exceeding 50 miles are yet smaller cities and towns which form ,or are beginning to from bedroom suburbs for persons employed or otherwise earning their livelihood in Delhi. Among this oven closer group of towns are sonpat, Faridabad, Ghaziabad Grugaon and others. In Map No.20 all the urban centre around Delhi urban within a redius of 100 miles are shown graphically.
But Delhi influence is not exercised only uon urban places within this region, but also on the rural parts of it, provided they are at all accessible . For the countryside in the environment of Delhi produes much of the food which is consumed in Delhi, and the closer one gets to the capital city, the more dependant are agriculturistson selling their vegetables and fruits, eggs, milk, and other perishables In the urban market. In view of the tendency of Delhi to expendinto his region, its present economic characteristics, which are at least approximately represented by the distribution of its populations among livelihood classes, must be studied. In Table 3 present data on the distribution of the population by livelihood
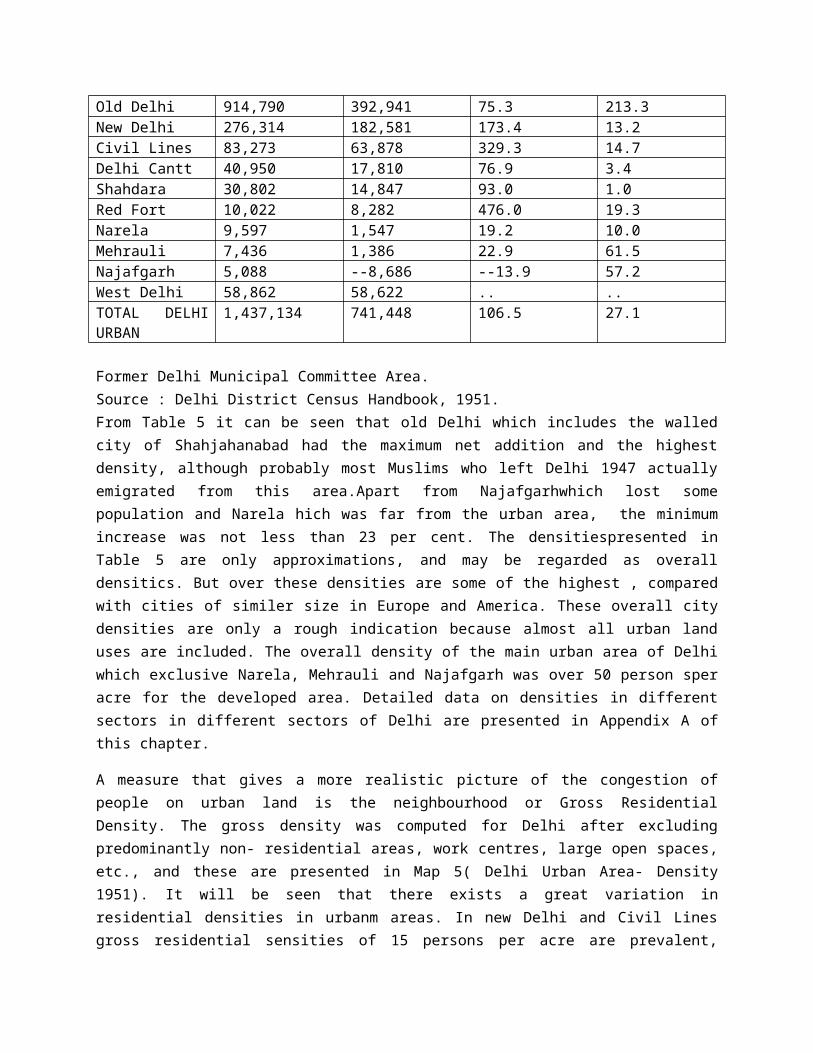
classs in the four districtsof Bulandshahar and Meerut in Uttar Pradesh and of Gaurgaon and Rohtak in Punjab. We also present dat for the eight tehsils immediately surrounding Delhi State: Jhajjar, Rohtak, Sonpat,Gurgaon and Ballabgarh in the Punjjab; and Bagpat, Ghaziabad and Sikandrabad in Uttar Pradesh.
From Table 3 we may see that the largest proportion in the four districts around Delhi derives its livelihood, from agricultural. Expect for the District of Meerut, all Districts have well above 50 per cent of their population dependant upon agricultural for a livelihood. As regards the eight tehsils around Delhi, we find that manufacturing appears to be a somewhat more important ource for the livlohood of the population in the tehsils east of Delhi than in thoe west or south of DELHI. ONLY THE TEHSILS OF Sonpat in Punjab has more than 10 per cent of its population dependant upon production other their cultivation. Another important feature of the livelihood classification presented in Table 3 is the vvery low level of persons deriving their livelihood from commerce, transport, and communications, and general services, especially if compared with the correspondi ng proportions for urban Delhi presented inTable 2. This shows more clearly than almost any other fact, the extent to which the towns and villages in this general region depend upon Delhi for mnay of these functions, and how important is the role of Delhi in performing manifold services, especially skilled and specially skilled and apecialized services for the population in this part of India.
This picture is partly underlined and partly contradicted if the livelihood pattern in six towns very close to Delhi were studied.These six towns are Narela in Delhi State, Ghaziabad in Uttar Pradesh and Faridbad9jointly with Faridabad Township, the new refugee settlement), Ballabgarh, Gurgaon, and Bahadurgarh. Their present population and its distribution among livelihood classes in presented in Table 4(underneath Table 3).
TABLE : 3
Distribution of population by Livelihood classes in Districts & Tehsils around Delhi 1951Tehsil or District
Population (1000’s) Percenntage of Persons (including Dependents) Deriving Livelihood from
1931 1941 1951 Classes I – IV Agriculture
Class V – Production other than cultivation.
Class VI – Commerce.
Class VII – Transport.
Class VIII – Other Services
Jhajjar 228 260 324 71.6 9.6 5.6 0.6 12.6Rohtak 321 264 312 58.0 9.6 11.6 1.6 19.2Sonepat 180 216 254 61.0 11.8 9.5 1.2 19.2Gurgaon 120 140 169 62.1 7.1 8.3 0.6 21.9
Ballabgarh 84 98 129 58.1 6.2 7.7 1.6 26.4Baghpat 312 362 417 53.7 13.9 6.9 1.0 24.5Ghaziabad 280 338 425 46.6 20.5 8.5 3.5 20.9Sikandrabad 248 282 317 65.5 11.9 5.1 1.8 15.7Total of 8 Tehsils
1,673
1,960
2,347
58.7 12.4 7.9 1.6 19.4
District Rohtak
834 987 1,122
65.6 9.8 8.6 0.9 15.1
District Gurgaon
779 896 967 68.5 8.2 7.0 1.2 15.1
District Meerut
1,702
1,897
2,281
47.8 16.9 8.3 2.2 24.8
District Bulandshahar
1,137
1,317
1,500
68.1 11.5 6.4 1.5 17.5
Total of 4 Districts
4,452
5,097
5,870
57.0 16.5 7.0 1.5 19.0
TABLE : 4
Demographic and Economic Characteristics of Slelected Towns in Delhi Metropolitant Area 1951.Tehsil or District
Population (1000’s)
Percenntage of Persons (including Dependents) Deriving Livelihood from
1931
1941
1951
Classes I – IV Agriculture
Class V – Production other than cultivation.
Class VI – Commerce.
Class VII – Transport.
Class VIII – Other Services
Ghaziabad 19 24 44 2.7 20.0 28.2 19.8 29.3Faridabad and F Township
5 6 31 6.1 7.7 14.8 2.3 69.1
Ballabgarh 4 5 6 13.7 17.3 35.9 1.2 31.9Gurgaon 7 10 19 2.3 6.7 22.0 2.4 66.6Bahadurgarh
7 8 11 19.2 9.8 35.0 3.4 32.6
Narela - 8 10 24.2 13.6 25.2 \4.3 32.7(*Sonepat) (15) (18) (30) (11.5) (13.1) (30.1) (3.9) (41.4)Total of 6 towns
42 61 121 7.4 13.2 24.0 9.1 46.3
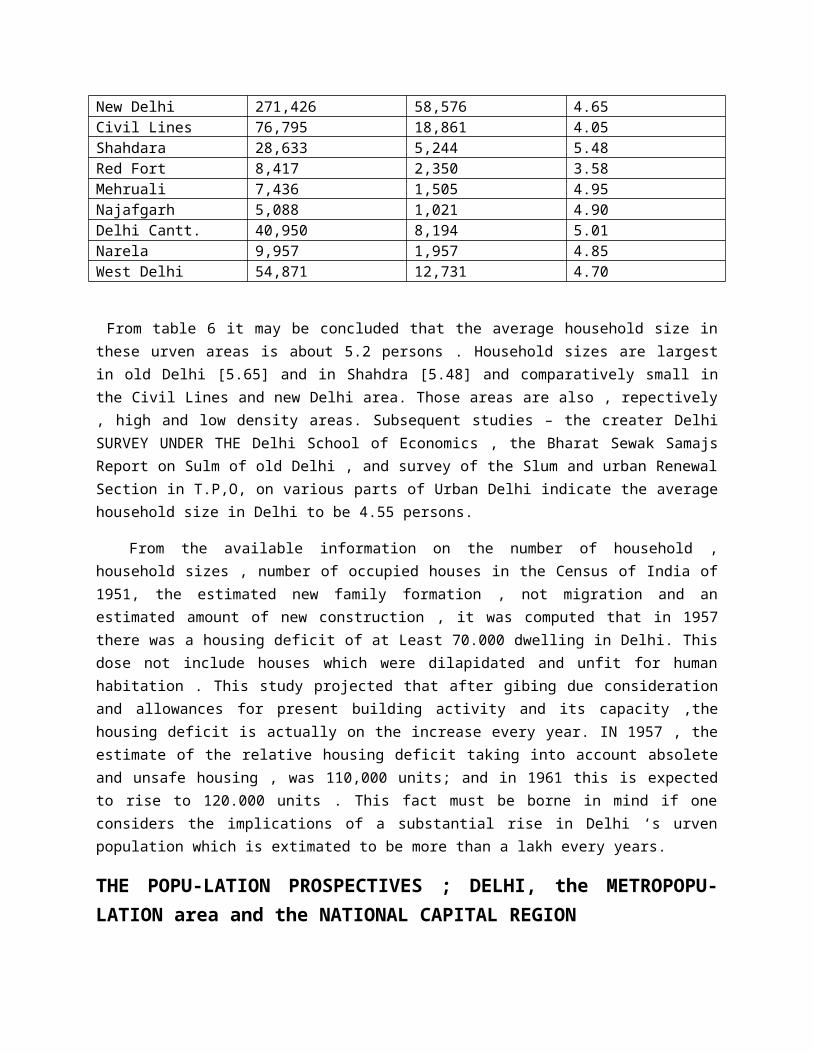
As can be seen from the table, industry does not yet play a very important role in these towns. The very low figures for Faidabad ( including Faridabad Township) and the very high proportion of persons deriving their livelihood from general services, seem to be accidental by the time the Census of 1951 was taken, the population of the Township were still without regular employment and engaged in occupation. Many persons were still without regular employment and engaged in occasional , mostly unskilled services. By 1953 the occupational structure had changed considerably. In Faridabad Township 24.5 per cent of the working force were industrial workers of artisans and an additional 22.5 per ccent were classified as labourers and doubtless a large proportion of these were active in manufacturing. In other words, it would not be assume that at present Faridabad and Ghaziabad are the two highly industrialized towns of the region immediately surrounding Delhi, and that the share of persons ongaged in manufacturing and allied occupations in these two towns ( and probably also in Balabgarg) is higher then in Delhi itself. These centres, therefore, already hav the makings of industrial suburbs of the capital city.
It is further more worthy of note that a very large proportion of the population of Ghaziabad depended for its livelihood on transport and communication. This is explained of Yamuna and a transshipment point to and form Delhi. The high proportion of persons deriving their livelihood from servces in Gurgaon is explained by the fact that this relatively small town is the headquarters of a district.
THE STRUCTURE AND STRUCTURAL CHANGES OF DELHI WORKING FORCE :A more precise picture of the economic base of a given region can be obtained if, instead of livelihood classes,we
See National Sample Survey of Faridabad Township (Report No.6), Delhi 1954,p.41.
Study the structure of the region working force and the development of this structure over time is studied. In this section is presented a more detailed examination of the economyof Delhi at present and in the last few decades by an analysis if its gainfully occupted population and in the next section by a study of Delhi Stateincome and its distribution among component sectors.
In Table 5 we present the distribution of Delhi working force from 1921 to 1951 by major industrial branches.
TABLE 5
Composition of the working force in Delhi State, 1921- 1951.
Fields of Economic activityAgricultural 44,139 66,754 55,463 64,730Mining and Industry
43,775 54,617 81,704 116,880

Mining 198 581 256 295Industry 43,577 54,036 81,448 116,585Construction 9,763 16,598 30,706 62,054Transport and communication
10,632 18,795 17,762 36,019
Commerce and business
33,023 33,822 50,583 124,806
Professions and liberal arts
5,606 7,760 15,935 32,727
10,924 15,022 30,308 107,183Public ultiliies 7,515 10,409 8,410 8,511Other services 31,533 39,955 52,956 82,522Unproductive 4,583 4,956 7,211 3,696Total working force(including unproductive)
202,493 258,688 351,038 639,128
Total population 408,188 636,246 917,939 1,744,072Working Force as per centage of Total Population
41.48 42.23 38.24 36.64
Note ;- Labourers unclassified have ben distributed between industry and construction at the rate of 30% and 70% respectively.
Source : Census of India, 1921,1931, 1941, and 1951, District Census Handbooks,Delhi State ; and Registrar General office.
As can be seen from Table 5, its size has more than triple ince 1921 but the proportion of the population gainfully employed has fallen from more than 40 per cent of total population to little more than 35 per cent of total population. This drop in the share of the gainfuly employed is due to two changes.
One is the ising income odf the population of Delhi in the last 30 years, as well as the change in its professional composition. The share of more highly paid services workers, governmental officalls, and businessman has increased,and hence there is now a large proportion of familles in Delhi on a standard of comfort which frees the females in these families from seeking gainful employment outside the home. Another region for the shift in the proportion of the working force as a share of toal population . Delhi now-as compared with prewar years. Has a more equal sex ration and has more families with children in the non- working ages.
It is likely that the overall proportion of the population in Del orking force will continue to decline somewhat because the trends outlined in the previous paragraph are continuing. But, on the other hand, there are likely to take place some increase in employment of adult females, the impact of
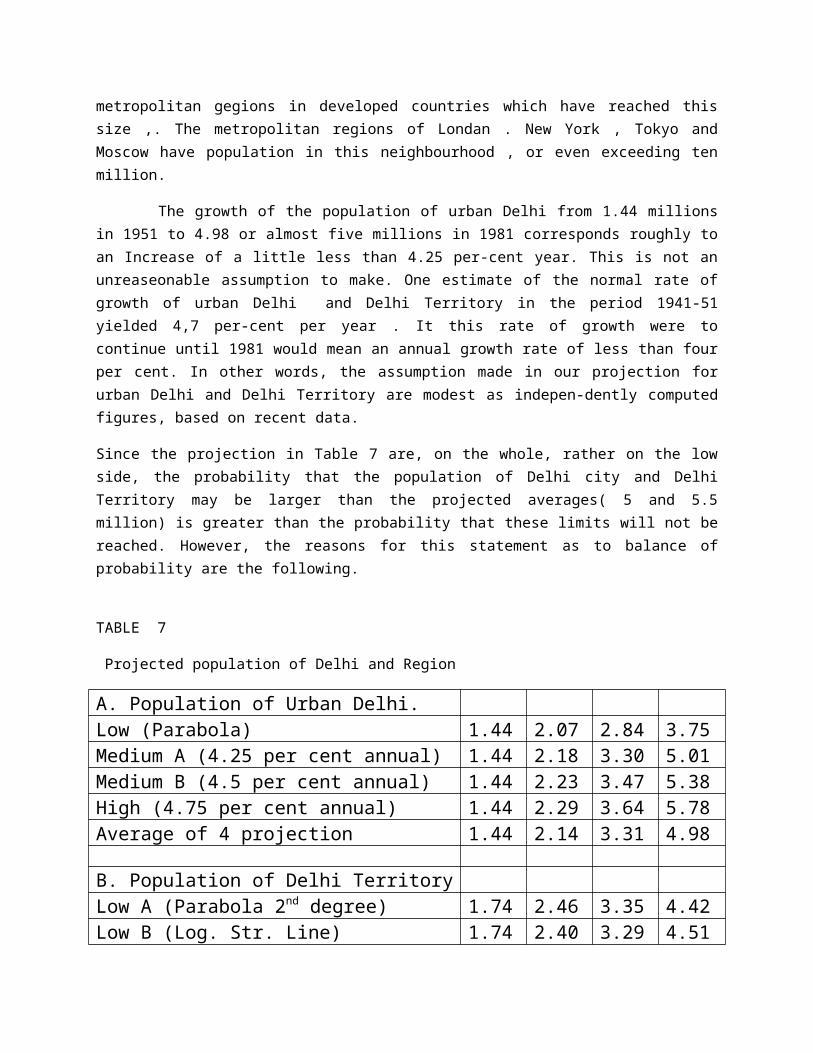
hygienic measures hich ill extend the average life span of the Delhi population, and inn this way tend to increase the share of perons in working ages.
Turning now to the absolute figures presented in Tabe,5 it can be noted that thy are not fully comparable with one another because of ccanges in concepts, definitions, and census classifications. However, the figures which are presented in this tabe have een ccarefullly matched, and they do, therefoe, ge a fairly good picture of the cange in Dehi working force structurs in the period from 1921 to 1951. The adjustments which were madein the classification system of earlier census to obtain comparable figure are presented
See on this point Daniel and Alice Thorner comparability of Census Economic Data, Calcutta, 1958(Mimeographed).
In Appendix A to thischapter. It can be noted in this context that in the prewar period the largest number of gainfully occupied persons among the economic classes listed in Table 8 were employed in agricultural, and that the number employed in manufacturing and commerce was well below the number of persons in agricultural. In 1951, in contrast, the economic sector providing the largest employment in Delhi State was commerce, closely followed by manufacturing and government services,, and agriculture hhad fallen to fourth place, employing scarcely of employment in agricultural is best exhibited by a comparison of the figure of agricultural employment fall between these two dates, but the absolute num,ber of persons gainfully employed in agricultural wwas less time, it was observed than in 1931.
At the same tiome, it was observed that in manufacturing the number o gainfully employed persons rose from 43,557 to 116,585, persons, registering an almost three fold increase, and a similar volume of increase is presented in the sector transport and communication and other services. In commerce the increase between 1921 and 1951 has bbeen almost fourfold, in professions and liberal arts it ose from 6,606, to 32,727, or registered on almost fivehold increase, but in public services, comprising employment, in the service of the Central Governemnt, the state Government, and local governments, the increase was from 10,924 to 107,183, or an almost tenfold increase.
Certain changes in the structure of the working force are exhibited more clearly if compared with the percentage distribution of the orking force at a gien time. In Table 6 are presented these proportional distribution for the last census years since 1921.
This table has bbeen computed on the basis of the data presented in Table 5, expect that unproductive persons have been left out of the computation, and that, for this reason, slightly different totals were used. The data presented in Table 6, suffer, therefore, from the same weaknesses and display the same degree of strength as those presented in Table 5.
TABLE 6
Percentage Distribution of working Force in Delhi State 1921 - 1951.
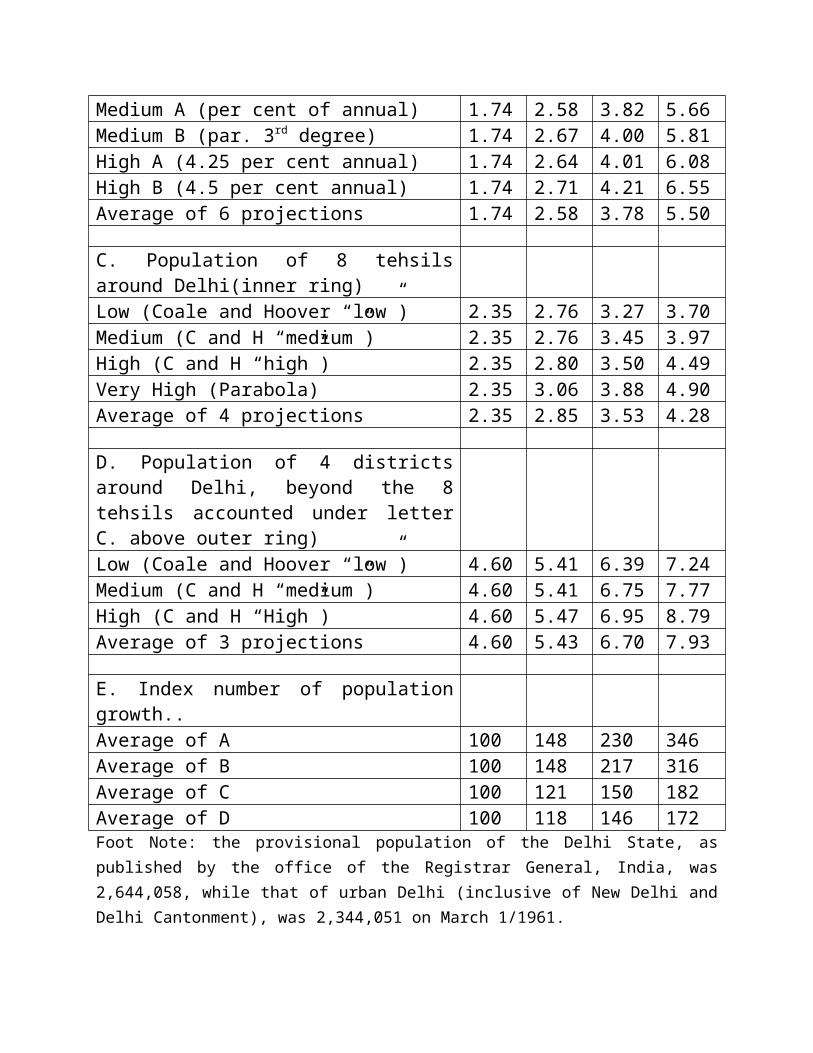
1921 1931 1941 1951Agricultural 22.30 25.31 16.31 10.19Industry and Mining
22.12 20.71 23.76 18.39
Mining 0.10 0.22 0.07 0.04Industry 22.02 0.49 23.69 18.35Construction 4.93 6.29 8.93 9.77Transport and Communication
5.37 7.13 5.17 5.67
Commerce and finance
16.69 12.82 14.71 19.64
Professions and liberal arts
3.34 2.94 4.63 5.15
Public service 5.52 5.70 8.81 16.87Public utilites 3.80 3.95 2.45 1.34Other services 15.93 15.15 15.40 12.99Total: 100.00 100.00 99.99* 99.99*
*Totals do not add up to 100,00 because of rounding.
Source : Table 5 of this Chapter.
Table 6 displays oven more clearly than Table 5 the most important structural changes in the orking force of Delhi State. Gainfully employed persons in agricultural declined from more than 20 per cent in the prewar period to scarcely 10 per cent by 1951: the proportion of persons of commerce and finance has increased from around 15 per cent to about 20 per cent; and the proportion of persons in the public services has growth from slightly more than 5 per cent to well over 15 per cent. The category other sevices which contain, on the one hhand persons engaged in personal services ,e.g. domestie,servants, cooks, washermen, etc. and on the other, a ggroup of miscellaneous, unclassified services, has also declined, though not very drastically. This, in part,is due to better methods of census enumeration and the general, though slight, improvement in the definitions and reporting of occupational and professional speciallsation in the census questionnaires.
The structural changes in Delhi working force discussed so far do not persons gainfully employed in agricultural is normal in a region which is becoming increasingly urbanized. Similarly, the increase in the proportion of persons employed in public services and in commerce is due to the centrality of Delhi, 1.e. its basic function as the capital of India and the major commercial centre of Northwest India.
There has been a sizeable increase in the proportion of persons engaged in professions and liberal arts and in construction. The former is also an outflow of the centrality of Delhi. As the national capital it attracts a larger than normal number of professional persons, especially in the research and educational field, but also in business and legel services, as well as health services. The increase in construction is due to the widespread building activity going on in Delhi and appears to be a phenomenon which does not establish a trend. In other words, between 1921 and 1951 the share of the gainfully employed
persons in this sector has roughly doubled and in 1951 amounted close to 10 present of the total working force of Delhi. It is not ,ikely that construction will evon employ substantially more than 10 percent of Delhi woking force , except if it should be used at some future data as a temporary anti-depression measres. However, the implementation of the plan outlined in this report will remain at least at the 1951 level.
Development in two sectors, Industry and Mining and Transport and communications has been somewhat erratic. Both have fluctuated around central values during the last three decade. Indutry and mining employed about 20 per cent of the total active working force, and transport and communications may rise slightly in the future especially if Delhi transport network is developed in accordance ith the proposals made inthis plan. As regards the proportion of the working force in ndustry and mining, more extended discussion of this point will be presented below in section 8 and 9 of this chapter and in later chapter on industry.
Afuther interesting breakdown of Delhi oking force in 1951 can be made between the urban and rural portion of it. As was pointed out earlier, out of the total numberof 635,432 of gainfully ployed persons, 111, 719 or 17.58 per cent were resident in the rural parts of Delhi State and the remainder in urban Delhi .In Table 7 we presebt the structure of the urban and rural portions of Delhi working force in1951.
TABLE 7
Urban Rural Breakdown of the Delhi working Force, 1951
Urban Rural Total Number Number Number
Agricultural 6,242 1.2 58,488 52.3 64,730 10.2Minsing and Industry
94,468 18.1 22,412 20.1 116,880 18.4
Construction 59,784 11.4 2,270 2.0 62,054 9.8Transport and Communication.
34,104 6.5 1,915 1.7 36,019 5.7
Commerce 117,328 22.4 7,478 6.7 124,806 19.4Professions 31,588 6.0 1,139 1.0 32,727 5.2Public Utilities. 8,366 1.6 145 0.1 8,511 1.3Public Services 104,075 19.9 3,108 2.8 107,183 16.9Other Services. 67,758 13.0 14,764 13.2 82,522 13.0Total: 523,713 00.1 111,719 99.9 635,432 99.9
Source : Census of India, 1951, Districts Cenus Handbook,Delhi State.
This table show the dominance of the urvan sector of Delhi States . The propnational distribution of the total working force is roughly the same as that the urvan worlding firce, the only exception being the agricultural sector . But this is quite normal agriculture is tipically net carried on in urvan areas, and the bulk of the agricultural wording force in Delhi State resides in thr rural parts on the States , One further
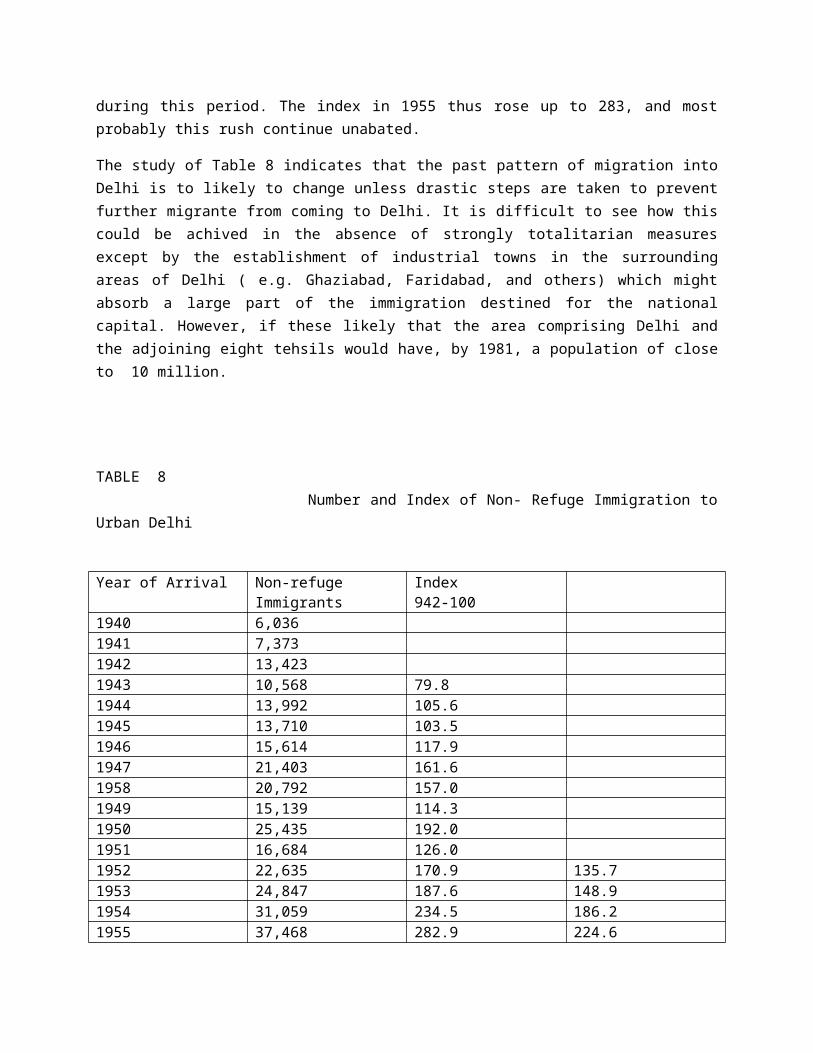
remarkable fact in Table 7 is the high proportion of persons employed in mining and manufacturing who reside in rural Delhi. In face ,the proportion of the ruralworking force in this branch of economic activity is higher than the propatio of the urvan working force ,thought the difference is not very large. Allinall, there were 22,000 persons in the rural areas of Delhi States who derived there livelihood from manufacture . This fact can be explained , on the one hand ,bricknorks, and on the other by the fact that some person who live in rural Delhi State commute to the city of work there in industrial occupations.
The division of the working force between the rural and urvan sector again stresses the great important of commerce and public service as the two main basic functions of Delhi. Those two fields of economic activity are the largest and together account for somewathless than half the total working force inurvan Delhi . Next in impottance are industrial and minning and construction , which together with public utilities sumply close to a third of the total gainfully active urvan working force . Delhi,s working force differs from that of some of the new capital . like washingtion , Canverra or Brasilia , which are exclusively administrative contres and resembles more that of the older capital cities , like Londan ,Paris Moscow , or Tokuo which are not only the centres of administration but also towns. Since Delhi is an old city rather than a new artificial creation , this structure of its working force and its economy is not supreisting .
Comparod to public service m commerce and industry . and allied fields of economic activity , the other sectire ompoly relsticely small propations of the total working force . Hewere , it should be noted that the number of persons in the professions and liveral arts has increased substantially in the last few decades and that this sector of the urvan working force of Delhi is likely to grow in size and relation importance.
It would be intresting to examine more in detail the various sub-classifiation of service of the main classes of economically active persons , for example , it would be useful to have more detailed data on the composition of the working force in trade , banicing , the professions, personal service , and industrial unfortunately , the differ nces in terminology and concepturalization in post census years makes a compartision of the development of the worlding force in most suveasses extromoly difficult and somewhat devoid of significance. Presonated here is a list containing some detailed break- downs of the working force of Delhi territory during the period 1981 to 1951 in APPENDIX bto this this chaptor . This table does not present any development which appear surprising , in view of the major classes presented in Tabels 5and 6 of the text of this chapter , and it is for this reson unnecesseary to discuss the atructural features of Delhi working force and the changes in the structural over the last three decades in any grater detail than that represented by the classification exhibited in Table 5 and 6 . THE appendix table is presented mainly for the sake of providing as complets a picture as was possible to obtin.
More important than the detailed structural break down of the working force is the breakdown of the working force between those persons occupied in the organized, as comrared with the ‘non-organized sector of production . In other words, distinction between these persons who work in the factories falling under the Factory Act. In well organized banking , financial and commercial instiution ,
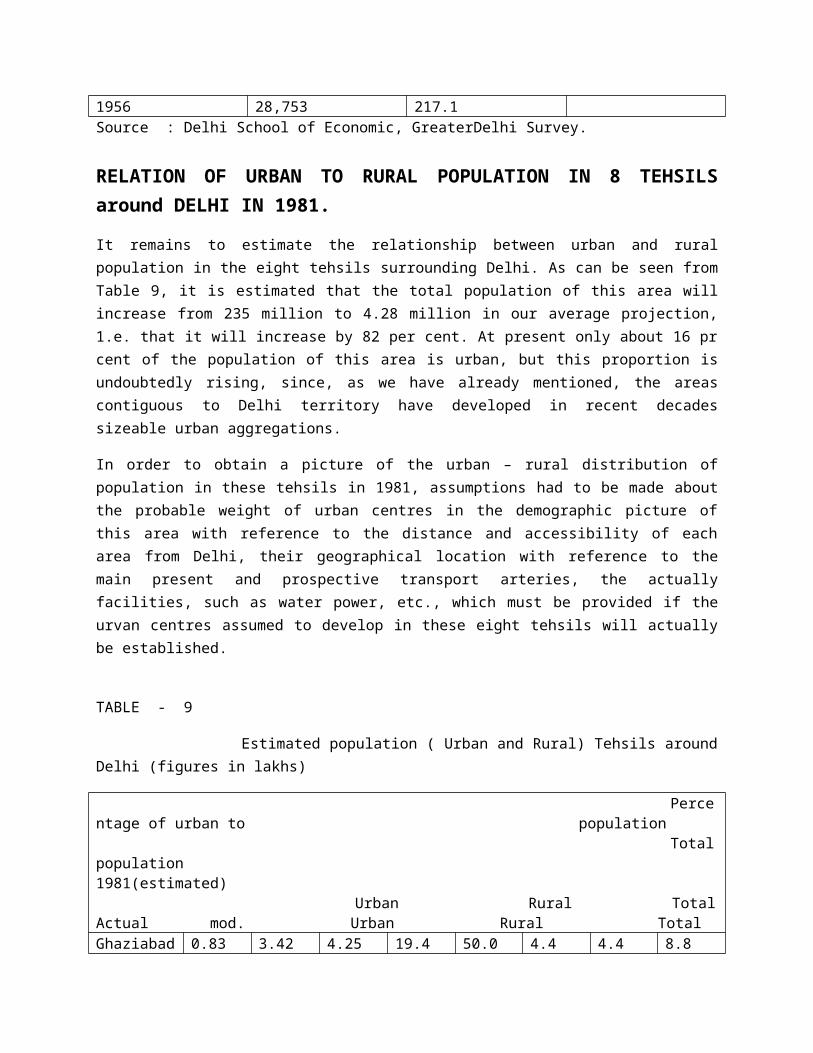
and the like , as against persons wh for this division between the organized and the non-organized sectors of the working force are not available on any systematic sca,e
However , it has been attempted to make some estimates of this distribution on the basis of date collected by the directorate general for Resetlement and Emlopyment and some investigations in the composition of Delhi,s working forces which were made in connection with the study of the States income of Delhi [ which will be reperted on in the next section of this chaptar ].
In table 7 it was shown that in the fied of industry and mining there were approximately 05,000 person gainfully employed in the urban and 22,000 in the rural parts of Delhi . Among these 44,000 were employed in factories falling under the Factory Act. And another 10,000 in brickworks , almost all of the latter in rural areas . this leaves 12,000 workers in the pural areas and hence 63,000 workers in all the Delhi States who were employed in small-scale industrial establishments employing normally fewer than a workers .
CONSTRUETION IN Delhi city employed close to 60,000 workers in1951 . AAlmost all of these were casul workers , but it may be estimated that about one-quarter of this group ,I,e, approximately 15,000 wrkers , ,were agaged in various construction work undertaken by the government or by large contractors and similar persons who carried on their activites without making use of largo- acale capilal .
Commers and finance employed some 184,000 persons in 1951 . Among these there were somewhat over 9,000 in banking and other financial instritutions , and the remainder in wholesale and retail trade. Similarly , in the field of public utilities there were employed 8,36 workers in urvan Delhi . Among these pearheps one-third I,c, approximately 2,750 were working for publicity owend undertakings like electricity , water supply and sewage disposal works. The remainderin wholesale and retail trads. The larger proportion or persons engaged in banking and insurance were employed in the organized sector of the economy thought there were quite a few money landers and money changers who operated outside the major Nanking and other ifinancial establishmants , perhaps 6,000 person of those in banking and finance were employed in the organized sector , and some 3,000 persons outside it. In trade the proportion of persons in thr organiged sector was much smaller , The Director-General of Resettlement and Employment extimates that approximately 10,000, person in the wholesale trade and about 9,000 persons in the tetailtrsde were employed in regularly reporting establishments in 1956. In1951 the number was perhaps smallier by 1.000 in each of these two sectors of trade and hence we many not go far wrong if we assume that retail and wholesale trade together provided 17,000 jobs in the organized sector and around 98,000 in the non- organized sector. Many of the small refuges stalls would be included among establishment in the non- organized sector. The organized sector would comprise only the well established shops on Cannaught Circus, the main arteries leading away from it, and in such established shopping centres as Chandni chwk, Karol Bagh, and a few others.
In transport and communications there was a relatively large share of persons in the organized sector. The estimate undertaken in connection with the state Income Study has yielded the result thsat of the roughly 36,000 persons in this class 16,000 were axi and tonga drivers, and other persons engaged I transport services of an unorganized sort. Againstthis number there were 20,000 persons in the
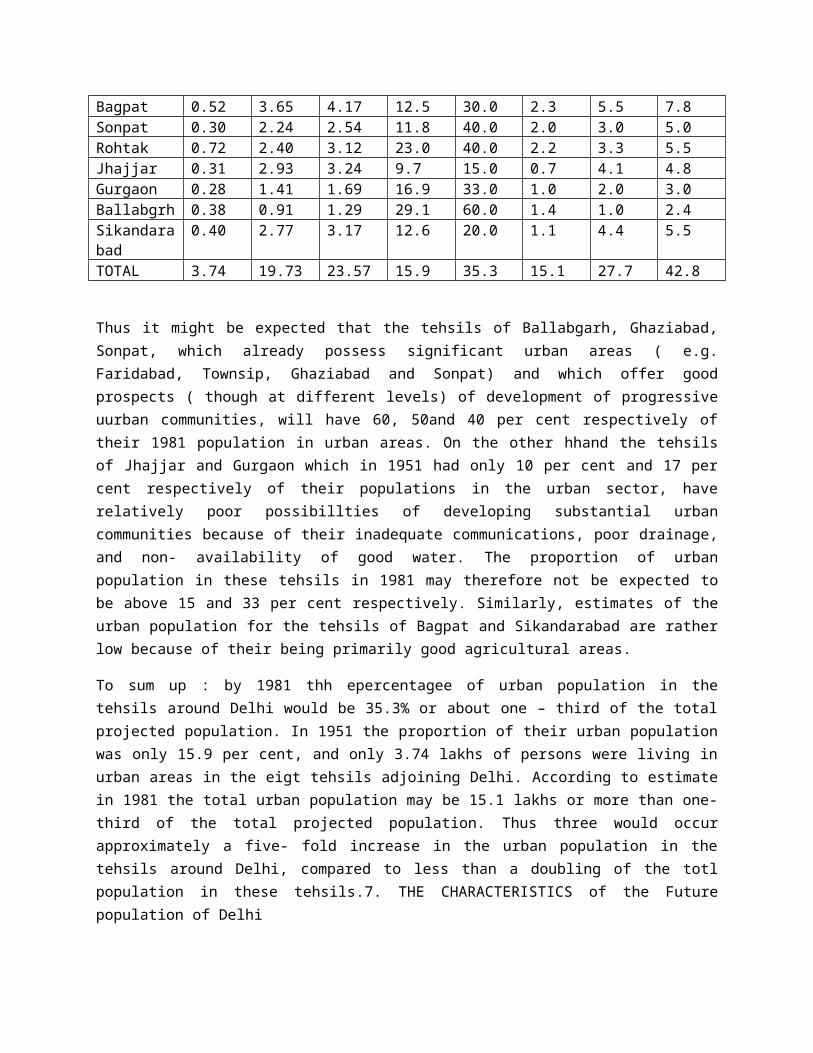
organized sector, 1.e. working for the railways, air lines, Delhi Transport Authorty, and other larged sized private transport establishments . close to 3, 500 persons in this classification , telegraph, and telephone services.
There is no difficulty presented by persons in gainful employment in public service. Apart from a few village watchmen, and perhaps an additional small number of village accountants, patwaris, and other personnel , all gainfully employed persons in the public service were within the organized sector. More difficult is the apportionment of persons between the organized and non- organized sector in the professions. The total number of gainfully employed persons in this sector in 1951 was 32,727. Of these , 17,585 were in medical services and 7,889 in oducational, scientific,and research services. The remainder were in recreational services, and religious services. Most of the persons in medical and educational services were in permanent establishments ,school, hospital, university,and research organizations. In fact, the number of persons in education was larger than 7,889, ince among the more than 10,000 persons employed by local bodies ( and classified in Table 5 and 6 under public services) there were some 4,000 to 5,000 school teachers. Similarly , among the persons classified in these tables in the service of local government , some ere employed in municipal hospitals, and among the persons classified as being in the employment of the State Government, there were some who taught or engaged in health services. In other words, out of the total of some 17,000 persons and state and local government service, only about 10,000 were in genuine administrative , police, and similar occupations: some 5,000 in education and 2,000 in health services.
On the basis of these estimates, it is concluded that the group of persons in liberal arts and professions comprised not only close to 3,000 ainfully employed persons, but approximately 40,000 persons. About 20,000 of these were in medical services, and about 13,000 in educational services. It may be assumed that two- thirds of the gainfully employed in each of these categories were in the organized sector, the remainder being wetnurses and midwives, herb doctors, an ayurvedic doctors in medicine, and village teachers or educators in non-established school in education.
AAs regards the remaining persons in the professions and liberal arts, it may be assumed that perhaps half of them were in well established organized occupations , e.g. legal offices, newspaper and magazines, cinemas, museums and exhibits , etc. The remainder were wandering entertainers , free lance artists and writers, astrologers, and the like.
The proportion of persons in the sector other services, who were employed in modern well- organized establishment was sall. Of the 82,000 persons in this sector, 23,000 ere in domestic services, and close to 40,000 were unclassified labourers and their earning dependants. The remaining persons were employed in such personal service trades as babrba r and beaity shops, laundries and dry cleaninig establishment and hotels and restaurants. It will probably be not far wrong if it is assumed that no more thha 55 of all persons in this clas, 1.e. roughly 4,000 persons, were engaged in modern well-organized establishments, laundries. The remaining 78,000 persons in this class were all active either in odd jobs or on their own account in small establishment employing fewer than 10 workers, or in domestic service.
A summay of the distribution of the working force of Delhi in 1951 as between the organized and the non-organized sectors I given in Table 8.
TABLE 8
Working Force in Delhi as Distributed between organized and Non-organized sectors.
Economic Class Organized
Total Organized Non-Organized %Org. Non-Org
Agriculture 65,000 - 65,000 0 100Industry and MiningUrban Delhi City 95,000 44,000 51,000 46 54Rest of Delhi State
22,000 10,000 12,000 45 55
Construction 62,000 15,500 46,500 22 75Commerce and FinanceBanking and Insurance
9,000 6,000 3,000 67 33
Wholesale trade 15,000 9,000 6,000 60 40Retail trade 100,000 8,000 92,000 8 92Transport & CommunicationTransport by road
22,500 6,500 16.000 29 71
Transport by other than road
10,000 10,000 - 100 0
Communication 3,500 3,500 - 100 0Public Utilities 8,500 2,500 6,000 30 70Public ServiceCentral Government
88,000 88,000 - 100 0
State and local government
11,000b 10,000 1,000c 91 9
Foreign governments
2,000 2,000 - 100 0
Professions and Liberal ArtsMedical 20,000b 14,000 6,000 70 30Educational 13,000b 9,000 4,000 69 31Other 7,000 3,500 3,500 50 50Other ServicesDomestic 23,000 - 23,000 9 100Personal 17,000 4,000 13,000 24 76Unclassified 42,000 - 42,000 0 100Total 635,500 245,500 390,000 39 61
Notes for Table 8
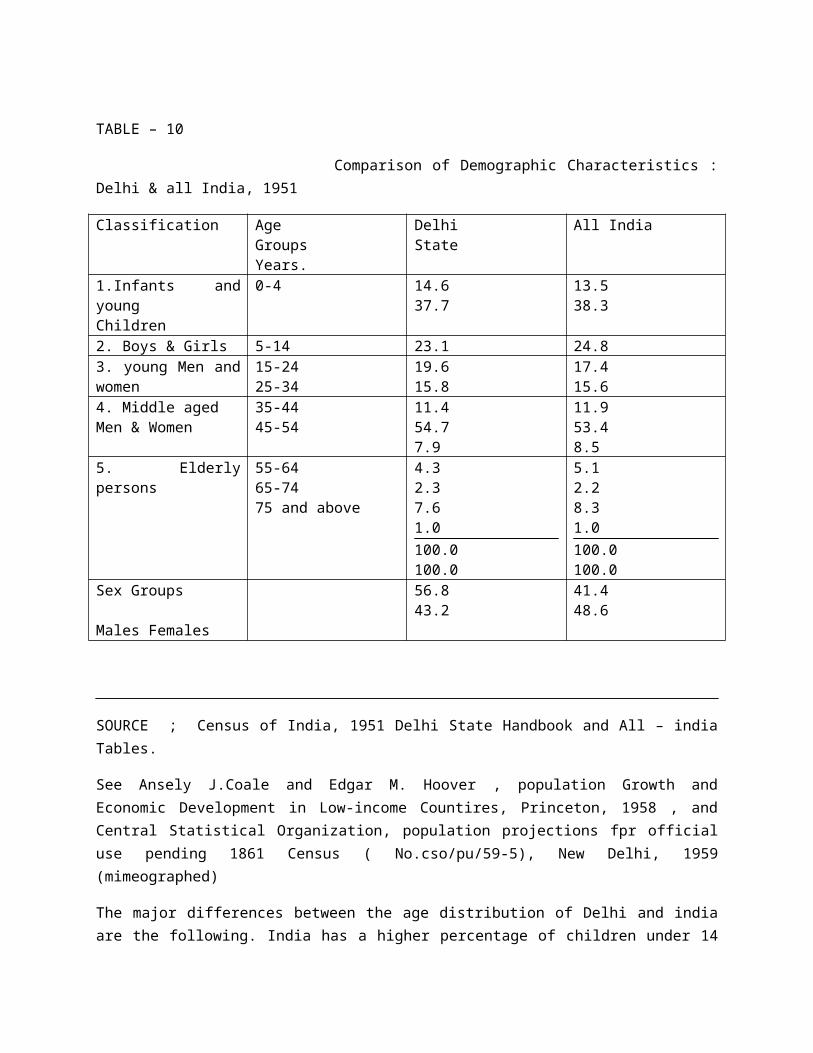
a. This groups of workers does not constitute persons in strictly organized enterprises but, as in indicated in the text, is madeup of person brickworks and [persons employed in organized factories within the city of Delhi ho reside in the rural portion of Delhi State. The bulk of these 10,000 workers, however, may be assumed to be employed in the manufacture of bricks and related clay products.b. 7,000 persons have been transferred from state and local government to Me4dical and Educational services in the following shares, Medical- services-2,000;Educational services-5,000.c. It was assumed that there were approximately 1,000 village watchmen and other village officials in Delhi State.
As in seen from the table only round figures are used, so as not to evoke the impression that these are estimates are precise. They are perhaps only guestimates but they have been chacked against a number o f independent sources, such as the reports of the Direct General of Resettlement and Employment, trade directories , and other, and provide the best available figures for the breakdown of the labour forceof Delhi between the modern organized and traditional non-organized setors. The importance of this breakdown for planning need not be stressed. In the total working force of 635,500 persons in 1951 in Delhi State,390,000,or 61 percent did not work in independent permanent structures which served as there work places. They either worked in the fields, or in the streets, in their homes, or the homes of their employers , or in temporary shacks and other non-permanent structures. Only 39 percent of the total woking/force worked in regular work places requiring permanent buildings or other structures. Of this group about one-third worked for the Central Government , one sixth for industry, and almost another sixth for state and local government and professional enterprises. In the other words, about half the working force of Delhi which made use of peranent structures worked in governmental ,educational, medical,or research and allied services, as an additional one-sixth in industry. All other miscellaneous occupations,including construction, trade, finance, transport, utilities, and other services employed only the remaining third of the working force which used permanent structures and hence ws relatively permanently tied to a given set of locations in the city and the reas surrounding it. These facts are significant for planning of transportation and other features or the urban economy.
7. THE STATE INCOME OF DELHI. An alternative procedure to prsnt the structure of the economy ofa given region is by presenting its total income or gross product. For this region an attempt has been made to estimate the State income of Delhi for the period 1951 to 1955. The value of these estimates as an addition to the study of the structural features of the working force is that they indicate not merely how many persons wrer engged in any given field of activvit , ut also that they indicate the magnitude of the economic condribution of each sector to Delhi overall economy. In other words, the estimation of the state income provides us ith an approximate measure of average productivity in various branches of the econom and hence also with average income earned in the different fileds of economy activity. Since shifts in the economic structure of Delhito occur in features years are anticipated, the relative contribution made within each sector of the economy of Delhi state providesa baseline for the estimation of approximate overall results of these
shifts in economic structure. In more concrete terms, if we assume that some of te economically marginal kinds of economic activity(e,g, occasional peddling and similar mental services) will tend to increase,the sheer change in Delhi structure, even without any improvement increase in the value of goods and services produced in the city. If in addition, the various forms of economic activity are subject to improve4ments of productivity the growth in income and product may be even grater.
It is not considered necessary to enter into a technical discussion of the nature of national or State income accounting. Te final Report of the National income committee contains a discussion of the general and many of the special problems involved in the estimation of the total income o gross product of a region. The methods suggested in this report have, on the while, been followed in estimating the state income of Delhi, and wherever deviations from the produres recommended by the National Income Committee have occurred, the nature and reasons for alternative produres have been noted. The complete tablesand supporting evidence for the totals in the State income estimates are so voluminous thatit would be impracticable to publish them as an appendix to this chapter. It is planned to publish the full textand spporting evidence of the state income estimates for Delhi State for the years 1951 to 1955 as a separate monograph.The Table 9are presented the general development of Delhi State income form 1951 to 1955, and in Table 10 the distribution of the state income by sectors, the estimated working force, and the average earnings within each sector for the year 1955.TABLE 9Not Income at Factor Cost by Sector Delhi State, 1951-1955, in Millions at Current prices.
1951 1552 1953 1954 1955Agriculture (including animal husbandry,forestry,and fishing)
56.5 54.9 61.8 53.4 52.9
Mining and manufacturing
206.0 201.2 219.2 215.9 249.6
Construction 57.3 60.2 61.3 62.7 71.6Public utilities(including sweepers)
8.0 10.4 11.4 12.2 13.6
Commerce and finance 286.7 285.9 297.9 337.1 355.7Transport and Communications
55.8. 61.9 66.8 73.2 81.4
Public Services 240.6 248.4 255.5 262.6 269.8Professions and liberal arts
81.2 85.6 89.3 91.4 95.7
Personal Services 35.2 36.4 37.5 38.8 41.9Other services 19.7 20.3 20.9 21.6 22.1Income from house property
78.4 81.2 83.3 86.5 89.0

Income subject to income tax not elsewhere allocated
29.6 12.1 33.6 29.9 40.0
TOTAL: 1,155.01 1,158.5 1,238.5 1,285.3 1,383.2
Source : Town planning Organisation Study of the State Income of Delhi.
TABLE: 10
Net Income of Delhi State, 1955, by Sectors and by number of Workers.
Net income in rupees (millions)
% No. of Workers Income per Worker (rupees)
Agriculture and allied
52.8 3.82 73,265 721
Mining and manufacturing
249.6 18.05 133,085 1,875
Construction 71.6 5.18 71,363 1,003Public utilities 13.6 0.99 11,582 1,178Commerce and finance
355.7 25.71 139,971 2,541
Transport and Communications
81.4 5.88 50,008 1,628
Public Services 269.8 19.50 120,214 2,244Professions and liberal arts
95.7 6.92 36,720 2,592
Personal Services 41.9 3.03 43,897 954Other services 22.1 1.60 46,189 478Income from house property
89.0 6.43 - -
Income subject to income tax not allocated elsewhere
40.0 2.89 - -
TOTAL: 1,383.2 100.0 726,293 1,904
Source : Town planning Organisation Studyof the State income of Delhi.
First it is to be noted that total sate income has risen from1,155 million rupees in 1951, to 1,382 million ruppes in 195. This implied, in prt, arise in the total number of gainfully employed persons, but it implies alsoa rise in income per worker r an average if 1,818 rupees in 1951 to 1,904 rupees in1955. Since these figures are expressed in current prices, thaey do not in themselves indicate an increase in real earings. If the figure for earinngs per worker are deflated by the index for working class consumer price index for Delhi, we find that the 1,904 rupees were wirth only1,811 rupes in terms of 1951 prices. Hence ther

does not seem to have occurred a riseiin real earings per orker in Delhi in the five ear period. Ths result , is however , some what in doubt, since in the computation of the economic contribution in a number of sectors, average money wages were assumed to have remained constant throughout the five yearperiod. What these data do seem to show is that structural changes in the five year period from 1951 to 1955 were not large enough to effect a rise in real earings, but form this it cannot be concluded that over a longer period of time then five years these shifts in structure ould not make themselves felt. It is also likely that with the general economic groth of the country,average money wages would rise, and this would alsocontibute to a rise in real earings per gainfully employed persons in Delhi.
It is also noted from this table that proportionally the largest share of income was earned in commerce, followed by public services and by industry and mining. While company this order will the proportional distribution of the working force, ( se Table 6) , it is found that the order of the three large st sectors is :commerce and finance, industry and mining, and public services. Moreever, the percentage f income earned in commerce and financeis substantially greater than that earned in manufacturing, whereas the labour force in commerce only slightly exceeds that in manufacturing , whereas . There are other interesting discrepancies in the two table. For example, whereas slightly more than 10 percent of Delhi working force were engaged in agricultural, they earned only less than 4 per cent of the aggregate state income, and whereas only a little over 5per cent of Delhi labour force was made up of persons in professions and libral arts, they earned around 7 per cent of the total state income.
These results are due, of course to the varying levels of average income earned in the different sectors as can be seen, the lowest income per worker was earned in “other services”, agriculture, personal services, construction and public utilities (this category includes sweepers who bring down the average, where as workers in electricity and water works had incomes commensurate with other workers in industry). These low average earnings are the result of the high proportion of unskilled workers in these branches of the economy. With the exception of construction and perhaps public utilities, it is likely that these sectors of the economy will contract proportionately as time goes on. Hence the share of persons in unskilled and lowly paid occupations in Delhi is likely to decline somewhat, though in view of the large prospective population increase this decline in the number of semi – skilled persons will not occur too rapidly.
On the other hand, in professions and liberal arts, public services and commerce and finance, incomes were high for the average worker, and since much of the income from house property and the unallocated income subject to income tax probably secure to persons in these three sectors of the economy, the average earnings of workers in these sectors were even slightly higher than indicated by the figures in Table 10. Even if the allocation of income from house property, etc. and only the average earnings per worker is disregarded, and only the average earnings per worker is considered there were found in 1955 sectors of the economy in which on the one hand, a worker earned, on the average 2,500 rupees, as against others in which the annual earnings per worker were well below Rs. 1,000.
This consideration leads, however, to yet a further conclusion. Sector by sector, average income in Delhi was not substantially higher than in India at large. Therefore, that average earning in Delhi was higher
than in India as a whole this id due not to the higher wages or other incomes which could be earned in say commerce or industry or agriculture in Delhi, as against what could be earned in these fields elsewhere in India. It is due rather to the urban character of the state, the relatively large proportion of tertiary production, as against primary production in Delhi, as compared with other States. Table 11 gives some comparative data on per capital (not per worker) incomes in Delhi, all India, and a number of other States for which State income data are available.
TABLE: 11
Per Capital Annual Income, Delhi and other States, Rupees in Current Prices.
State 1951 1952 1953 1954 1955Delhi 665.00 641.80 661.20 663.30 689.60Assam 298.00Bihar 204.00Bombay 257.10Madhya Pradesh
221.00
Madras 250.00Uttar Pradesh 244.50West Bengal 303.10All India 274.00 266.40 280.70 254.40 260.60
From this table, Delhi’s superiority in terms of per capita income stands out clearly, but if the differences between States are observed, it is found that the lowest per capita incomes are recorded for Madhay Pradesh and Bihar, the most rural states for which we have data are available, and that per capita income tends to rise as the degree of urbanization rises. It is significant to note, however, that per capita income in Delhi is more than twice the average for all India, and, in fact, more than twice the average for any other State for which income figures are recorded. The relationship of the per capita income movements during the years 1951 to 1955 in Delhi and all India are graphically presented in the Figure below.
The graph shows that total per capita national income in India and in Delhi did not rrise much before 1954, and only began to increase slightly after the First Five year plan was well under way. It has been estimated that over the long run real per capita income in India has risen by somewhat less than 2 percent annually since the beginning of the First five year plan, but they it may be expected to increase at a somewhat higher rate during the Third Five year pln.Given the increase in population, and hence in the working force, it may be expected that Delhi total income will rise faster than that of India as a whole, and that for this reason the overall State income ,of Delhi tate may double by 1876. In other words, whereas Delhi State income in 1955 amounted to somehat less than 1,400 million rupees, it may amount to ,and even surpass. Rs.2,800 million by 1976. If Delhi population and working force increase at a faster pace than those of India as a whole, a development which seems quite certain, as shown in tis that the total income of Delhi State by 1976 may well surpass the amount of Rs. 3,000 million.
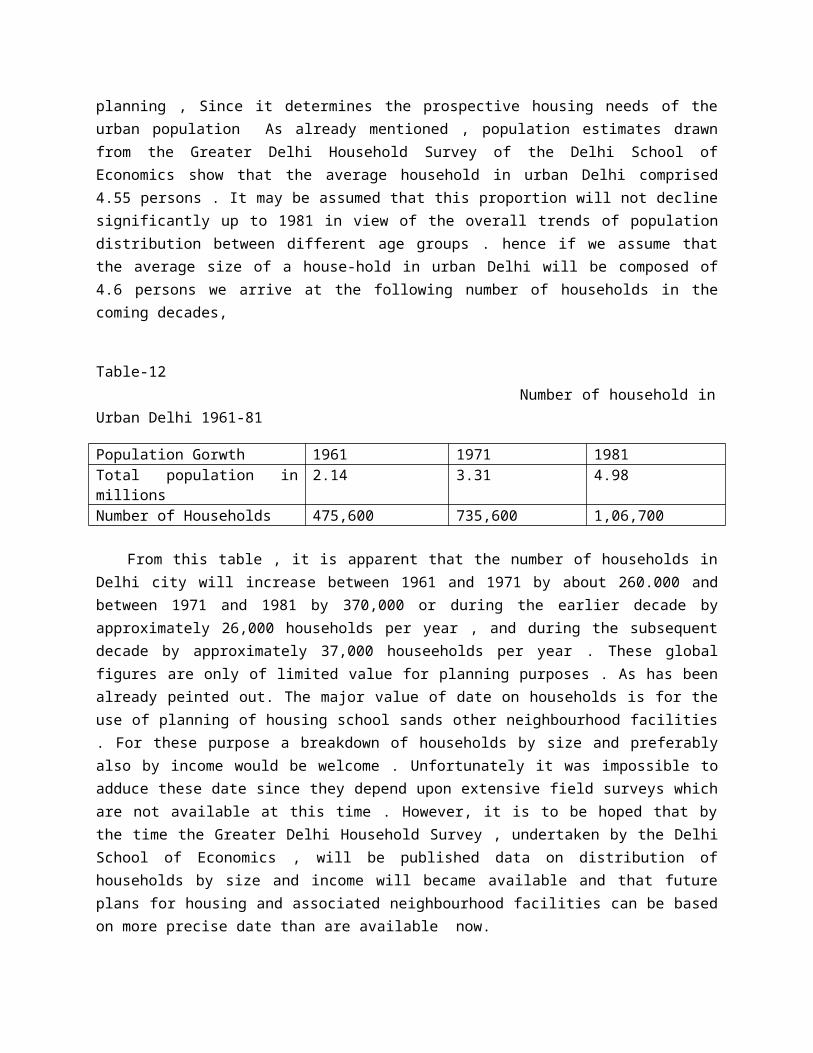
8. The prospective Development of the working Force and Total Income in Delhi.
In the preceding section of this chapter is presented the past development and present state on the structures and magnitude of the working force and of the state income of Delhi. A discussion of some projections of theses two aspects of the economic base and economic structure of Delhi follows.
In estimateing the future working force , two procedures may be employed .The first , which permits at best estimation of the working force for a relstively brief future period , is extrapolation of past trends . The other , which allow estimate to be made for period future ahead – of course , which much less precion – is consumption based upon analogies with other Indian city as even with city in the western world . It is propesedcto give here an extimate of the total working force, of its distribution into different occupstional classes . There exist several estimate of the prospective working force of India as a whole . Perhaps the most exhaustive figures which have been published so far are those of coale and Hoover . The share of total population in the working force in India in 1951 was epproximately 40 per cent . In Delhi the corresponding proportion was 36 .64 per cent . In other world , the working force in a predominantly urvan State made up a smiller proportion of the total population than in the predominantly rural areas, This appears to we a general chapracteristic of Indian Cites . The difference , as we have been is about 3.5 per cent , and we will assume that this difference is likely to remain relatively stable in coming decade , ON The basis of these assumption , and using the projection by Coale and Howver as our guide , we arrive at the fellowing estimate of the prospective working force of I ndian and Delhi States , given in Table 12. The estimates at last for the earlier years , check quite closely with data for the labour force derived by extrapolation of past trends . The estimates of the working force of Delhi State have been calculated on the basis of a logarithmic projection from 1951 to 1956 , and are obtained on the basis of this and other projectionthe figures presented in Table 13. 4, Sec anley j. Cale and Edger M. Hoover population Growth and Economic Development inLow Income Countries Princetion , 1958 PP. 231 FF. Table-12 Working Force as percentage of Total population,India and Delhi,1951-1981
1951 1961 1971 1981All India projection,Coale and Hoovera.Low fertility 40.0 39.6 40.6 43.7b.Medium fertility 40.0 39.2 38.5 42.1c.High fertility 40.0 39.2 38.0 37.2Delhi StateMedium fertility 36.64 36.0 35.0 38.0
Source: Coale and Hoover, op.cit., and Town Planning Organization.

TABLE: 13
Working Force in Delhi State, Absolute Numbers, on the basis of Several Projections.
1951 1956 1961 1966 1971 1981(a) Projection by log. Strait line-
Population of Delhi State (1000’s)
1,740 2,051 2,402 2,812
Working force (1000’s) 639 736 853 992(b) Projection based on comparison with Coale and Hoover estimate-
Population of Delhi State (1000’s)
1,740 2,580 3,780 5,500
Working force (1000’s) 639 929 1,323 2,090(c) Projection based on proportional distribution of population in working ages Pop’n of
Urban Delhi (1000’s) 1,440 2,140 3,310 4,980Working force (1000’s) 524 789 1,250 1,917
Source; Coale and Hoover , op . cit; and Town Planning Organization Table 13 gives on a comparative basis , projection of the Delhi working force , derived by three independent methods . In the first pair of lines , we present the labour line projection . In the second paid of lines we present a projection [in ten-year intervals] based upon the conversion into absolyte figures of the proportion presented in Table 12 of the preceding chapter for urvan Delhi [as against Delhi State] based upon the assumption that in 1961 ,1971 and 1981 , 70/ of all peraons in the working age group [15-64] will be in the working force . The figure of 70 per cent was chosen because it was istimate by the National and unemployment in Calcutta , that approximately that projection of the working age population is in the working force. The general result of these projection is that the working force of Delhi States by 1966 will be around one million . and by 1981 over two million persen . The major growth of the working force will occur in the last decade under consideration , I,e. Between 1971 and 1981 . In that decade , it may be expected that tha working . In that decade , it may be expection that the working bforce of Delhi State will increase by an in amount larger than the entire working force employed in Delhi State in1951 .But by 1971 the working force will already be some what more than double of what it was in 1951.
In addition to projecting the entire working force it become necessary also to indicate its probable future structure as between major sectors of economic activity , This projection can be undertaken by such methods as the application of a logaritimic curve based upon data derived from earlier census years than 1951 , and one attempt to project the structure of the lavour force to the year 1966 is presented in Appendix c to this chapter.This project is,however, of limited vvalue for several reasons. (1) The expansion or contraction of the working/force in any one sector of the economy is not necessarily subject to the normal laws of growth or decline, as is a naturally growing population. Which sectors expand and at what rate they expand depands in large part upon public policy decision, e.g.,91) the implementation of the present and future Five year plan. (2) An extrapolation by a standard statistical
method, such as the application of a logarithmic curve, loses its value if the date on which it is based are defective. As has been argued in section 6 of this chapter, the date for various census years are not fully comparable. There are changes in concepts and definitions, and these influence the date on which the projection is based. (3) Although a logarithmic projection of Delhi working force by sectors, if carried forward for five or even ten years, may not result in very distorted data, the likely distortions tend to grow as the forecast goes farther awzay into the future. Hence a logaritimic projection for a date twenty –five years from the present it likely to land be serious distortions and it has been considered preferable if an alternative mthough mathematically leas precise. Method of projection was chosen .
For these reason , estimates of the prospective structure of the working force in 1971 and 1981 have been prepared on the basis of different assumption and judgment . They are based on a number of individual studies of manufactureing in Delhi , on survey of business and commerce , and on projection of the central and local government as employers . In addition , some use has been made of estimated on probable trends of Delhi ‘s economy derived from the Delhi Bureas of Ecenomics and Labour Survey of the Delhi School of Ecenomics. Finanly, account has been taken of paraill developments in otherIndian cities and in cities in some of the economically more advanced countries.
Moreover , since the future structure of DELHI,S WORKING FORCE IS , WITHIN RATHER WIDE LIMITS , Suvject to measures of public pollecy , an attempt has been made from the view point of planning to suggest for Delhi a balanced economic structure in which various components contribult their share in the well-being and prosperity of the national capital . The projection of the prospective working force by economic sectors are presented in Table 14.
It is necessary to explain the underlying assumptions and reasoning employed in arriving at the estimated presented in this table . in agricultrial the declining traned ovserved in the years before 1951 has been extrapolated and continued to future years , simply because agriculture would not be able to absorb more person than a maximum of 100,000 in Delhi States . Contruction activity is likely to remain at or near the level reached in 1951 , since the impolynmention of the present and successive Five years plans , as well as the emplentation of the plan for the national capital presential in this report ,will require relatively large allocation of capital and lavour in this field . Moreover , construction is a relatively lavour –intensive activity , and whatever labour- saving technology shold be developed and applid in this field will probably be countracted by the increased construction activity in future years.
TABLE: 14
Projections of Working Force of Delhi State by sectors 1951 – 1981.
Economic Sector 1951 1961 1971 1981No. in 1000’s
% No. in 1000’s
% No. in 1000’s
% No. in 1000’s
%
Agriculture 65 10.2 75 8.1 80 6.1 100 4.8Manufacturing and mining
117 18.4 186 20.0 290 22.0 525 25.0

Construction 62 9.8 85 9.1 120 9.0 210 10.1Transport and Communication
36 5.7 55 5.9 90 6.9 150 7.2
Commerce and Finance
125 19.6 190 20.4 265 20.1 420 20.1
Professions and liberal arts
33 5.1 55 5.9 90 6.8 170 8.1
Public service 107 16.9 160 17.2 210 15.9 310 14.9Public Utilities 8 1.3 10 1.1 15 1.1 20 1.0Other services 82 13.0 114 12.2 160 12.1 185 9.0Total 635 100.0 930 100.0 1,320 100.0 2,090 100.0SOURCE ; Town Planning Organization.
Industry and mining are expected to increase up to a point where they will employ approximately 25 per- cent of the total working force , Minning is of inferior significance in Delhi State , Since there are no mines at MEhpajpur . THE main addition in this sector , therefore, will be in manufacturing . In view of the already high average income in Delhi , as compared with other Indian State , and in view of the likelihood that, as explained in the preceding section of this chapter , the coming years will see not only a rise in average productivity per workers , but also a general increase in the State income owing to shift in the working force from less production to more productive activities. The future average incomes in Delhi will remain high and is likely to rise . This will creat a sustain and indeed , an increasing demand for consumers good , the production of which can optimally be met by the establishment of the pertinent industrwes in Delhi.
During the decade 1941-51 the establishment of medium- size and small engineering plant has made important progress in Delhi . Buch small and medium size enterprises are relatively lavour-intensive and will offer employment to a comparatively large number of workers . Moreover , when intermediate industrial product such as steel and other metals are supplied in large quantities from Indian sources growth of abrication industry will also be significant . Yet since most of the industries which could economically be established in Delhi will be of a light type, a proportion of 25 per-cent of the working force in manufacturing will be no means give Delhi an industrial character.The table 2,(given earlier in this chapter)has shown that approximately 25 per cent of the population of Madras and poona derive their libelihood from manufacturing, and in that relation, a proportion of 25% of working force in industry in Delhi may not be excessive. Surely no one thinks today of Madras or poona as industrial ities in the sence in which are regards Ahmadbad,Kanpur, or Jamshedpur in which the manufacturing sector comprises more than 40 per cent of the working force.
Together with manufacturing,transport and communication will probably show a rising trend, simplybecause the expansion of manbufacturing will require a simultaneous expansion oftransport facilities.
Commerce and finance are likely to level off at employing approximately 20 per cent of the working force . The growth of Delhi population will,of course, requires the establishment of new retail outlets,
and hence employment in thi sgrooup would rise sharply. But it is doubtful whether the expansion of retail shops will proced at a faster rate than the expansion of h egainfully employed population altogether. Moreover, it should be borne in mind that, as we have shown in Table8, commerce, and especially retailing, is an occupation which is carried on n Delhi on a relatively primitive and unorganized basis. With the improvvment of general economic conditions, it is likely that commerce will become somewhat more highly rationalized, and these counteracting forces, one making towards expansion and the other towards contraction, are likely to hold one another in balance, so that the share of the wprking force in commerce is likely to remain a constant percentage of the total.
The proportion of gainfully employed persons public services and in profession and liberal arts has shown the fastes increase in the last few decades. As can be seen from Table5(and as has already been stated in an earlier section of this chapter0, the number of gainfully employed persons in professions and liberal arts has increased five-fold between 1921 and 1951. And the number of persons in the public service almost ten-fold in the same period. The greatest increase in the number of gainfully employed in public service,however, has come in the decade 1941 to 1951, when there occurd a leap from slightly more than 30,000 to over 107,000. It cannot be expected that this rate of increase will flatten out in the decades after 1961. To be sure, the absolute number of persons in government service is likely to increase as the economy of India becomes more complex and as the role of the central Government in economic planning and planning general takes on increasingly prominent forms. But there is a limit to the total effective size of government operations expand, some decentralization must occur. Moreoevr, there is a genuine question of whether parts of governmental offices cannot be moved to other centres, and as government functions increase, a tendency for decentralization and relocationof government offices in other cities will become stronger. Hence, it has been assumed that in Delhi the proportion of persons in the service of the Central State and local governments will gradually decline after 1961.
It will also be seen from Table 14 that the anticipated employment in public services in Delhi State in 1981 is estimated to be in the neighbourd of 310,000 persons. The bulk of this working force will be employed by the Central Government. It is clear that it would be impossible to find working space for a working force some 275,000 persons in the area around Janpath and Rajpath. Even if e add a number of other government offices centres,e.g., ythe Indraprastha region, we would not be able to reserve enough space and make available enough transport arteries to allow access for such a large number of orkers. The anticipated increase in the working force employed by the Central Government requires, therefore, the planning of work centres in new locations. It would,above all, be desirable if entire blocks of government departments could be transferred either away from the Delhi region. In the United States some decentralization of this kind has been attempted. For example, the defence services, which requireda vast amount of space, were moved to a location across the Potomac River in Washington to thepentagon Building. Similarly, the social security Administration, which also required large space allocations, was movdentierly away from Washington to Philadelphia. There is a strong tendency at work to remove uch separable branches of the government as the post office administration, the Government pinting office, and many cultural, health and research institutions , which form part of the government establishment, to outlying locations and in some-cases entirely away from the national capital. If a similar policy were followed in Delhi, a sizable proportion of the 275,000 Central
Government workers in 1981 would work in work centres away from the present central locations in the neighbourhood of the Secretariat.
Most of the other economic sectors, whose working force development are presented in Table 14, of minor importance compared with commerce, industry and mining, and public services. It should be noted however, that the proportion of persons in the professions is likely to increase greatly and that, in contrast, the proportion of personsin other services is likely to fall sharply. The former development is a continuation of past trands, and so, in a way, in the latter development . TH e classification other services embraces mainly personal services, such as domestic servants, laundry and washing establishment, and the like, and unclassified workers, 1.e. persons who will do all sorts of odd jobs. It is easy to understand that these miscellaneous service workers will decrease in number as the economy of Delhi become increasingly modernized and as a premium is placed upon professional of occupational specialization. It is the general tendency of a developing economy, to cause unspecified unskilled services to decline in significance; and although some general services workers are likely to remain, their overall number and importance will be much smaller in 1981 than at present, Hencce, the class other services will be made up mainly of persons engaged in various forms of personal services both within and outside their employer house.
It remains to comment briefly on the prospective change in the distribution of Delhi working force between the organized or modernized and non-organized or small scale, quasi- traditional sectors. Any forecast of these relations is frught with great uncertainty, since here again the influence of future policy decisions is likely to be predominant, and it is almost impossible to forecast future economic policy ith any degree of certainty. However, it is assumed that we will continue to hhave a system of mixed economy, and that the sectors which are now left to private industry and which are designed as remaining in the domain of private initiative in the Industrial policy Resolution of the Government of India of 13 April 1956 will actually,in future years, be confined to the private sector. In addition, we have derived some information from Japan, which is the only country with a long history of industriallzation and with similarly high population pressure as India, to serve as potential model for forecasting the prospective distribution of Delhi labour force of 1981 as between the organized, modernized, and the non- organized , quassi-traditional sectors.
TABLE: 15
Proportion of Non-Organized Workers in Delhi in 1951 and 1981 and comparison with Japan, 1954.
Economic Sector 1951 1981 Total No. non-organized.
% of workers in non-inc-corporated establishments in Japan in 1954
Total No. of Workers
% non-organized
Total No. of Workers
% non-organized
Agriculture 65,000 100 100,000 100 100,000 NA
Manufacturing and mining
117,000 54 525,000 30 157,500 25.7*
Construction 62,000 75 210,000 40 84,000 37.1Trade Wholesale 15,000 40 50,000 25 12,500 22.2Trade retail 100,000 92 340,000 75 255,000 74.6Finance and insurance
9,000 33 30,000 10 3,000 5.8
Transport by road 22,500 71 100,000 40 40,000 20.6Transport other than by road
10,000 0 30,000 5 1,500 6.8
Communications 3,500 0 20,000 0 0 2.0Public service 107,000 1 310,000 0 0 NAPublic Utilities 8,500 70 20,000 25 4,000 2.1Professions 40,000 34 170,000 30 51,000 28.8Other services 82,000 95 185,000 80 148,000 74.1Totals 635,500 61 2,090,000 41 856,500 37.0*This percentage pertains to manufacturing only except production of primary metals.
Sources of Japanese data: Japan, Bureau of Statistics, Japan Statistical Year – book, 1958, pp. 56 – 59.
In the first to colums are presented the numbers of workers and the percentage of workers in non- organized establishment in 1951. These data are taken from Table 8 in this chapter, though the classes have been somewhat re-arranged . In the next three columns are presented the total projected labour force by economic sectors in 1981, the expected percentage in the non- organized sector in 1981. The data for the total labour force for 1981 were taken from the projection presented in Table 14 of this chapter, although some additional breakdowns, not contained in Table 14,are shown here. The percentage of workers in the non- organized sector has been estimated on the basis f corresponding figures for Japan for 1954.
It was assumed that Japanese figures might be used for comparative purpose, since japan is now at a stage of industrialization which india is likely to reach by 1981. There is, moreover, in the general picture of Delhi economy, some similarly with Japan. Like Japan, Delhi has fe heavy industries and is likely to develop few heavy industries. It would have been wrong to compare Delhi State even in 1981 with present-day Tokyo or Osaka, since these cities are more clearly endowed with characteristics of modernization than may be true of Delhi in the next 25years. Hence the general assumption was made that the approximate proportion of the working force in incorporated and non- incorporated establishments in Japan in 1954 would be a fairely good model for the distribution of the Delhi working force in 1981 as between the organized and the non-organized sectors.
As ccan be seen from Table 15, the proportion which have been assumed for the distribution of Delhi working force between the organized and the non-organized sectors correspond very closely to Japanese figures, except in two fields : transport by road and public utilities.
The difference in the case of public utilities is due to the fact that sweepers are included in this sector, why the proportion of persons in road transport is assumed to bbe hogher in Delhi than in Japan is due to the expectation that in Delhi there will be less of a tendency for consolidation of taxi companies and enterprises running other forms of intra- city personsl and goos transport than in Japan.
In general, it is found that, on the basis of these assumptions, there will yet remain a rather large sector of unorganized establishments in Delhi in 981. It should be noted, that of the roughly 850,000 workers in sector, some 100,000 will be in agricultural, and another150,000in personal service,e.g., domestic service, washerman, barbers, etc. Moreover, more than 250,000 workers in this sector will be I retail tarde, a form of economic activity which even in highly advanced countries, e.g. France, or Germany, shows a rrelatively large proportion of small and even minute shops. Finally, over 50,000 persons will be in the professions, 1.e. writers, lawyers, doctors, and other the professional persons who have small one or to persons establishment and hence do not make part of large establishments, such as hospitals, schools, or newspaper and publishing firme.
Perhaps the most significant projection is that of industry, where it is estimated that more than 150,000 persons will be in the non- organized sector. This number may sound high, but it is , if anything, rather an understatement. Various studies in countries with high population densities,such as India, have shown that small industy and even handicrafts shops tend to exist for a long time side by side with more highly mechanized large- scale factories. Moreovver, it should be considered that at present in all India there are only a little more than 3 million workers in large-scale industrial establishments. It will be a great achievement if by 1981,70 per cent of Delhi working force can fined employment in organized industry, for this would mean that by than one- tenth of the number of all industrial workers in India tiday. Moreover, if we consider that in 1981 in all Delhi State there were not more than 44,000 workers in factory industry and about 10,000 in brick- works on the out skirts of the city and the rural parts of Delhi State, and that it is assumed that in 25 years this number will rise to almost 375,000 we see that this would imply a quintupling of the present working force in organized industry in Delhi State, and with a substantial speeding up of investment in industry, this is a very ambitious achievement. Hence, if anything , it is likely that the number of persons in the unorganized sector of manufacturing will be more than 157,500, and this figure should therefore be taken as a minimum.
It would also be interesting to show the prospective growth of the State income of Delhi between the year 1955, data for which are presented in Table 14, and the year 1981. This projection is based, however, on so many uncertainties that it would be likely to mislead if it were presented in the body of this chapter. Hoever, in order to provide a general idea f what the State income of Delhi might be like in 1981, we present such a computation in Appendix Dto this chapter, but wish to stress the point again that the data presented there are highly speculative and may be subject to a large margin of error.
9.THE PROBLEM OF REDISTRIBUTION OF INDUSTRY within the DELHI METROPOLITAN AREA
The data on the present and prospective working force and on State income presented in the preceding sections of this chapter are all related to Delhi Stae in its present boundaries. However, as was pointed out in chapter 2,part I, the effective region for urban planning is a zone which, in a number of place, goes beyond the boundaries of Delhi State, and it is important to ask whether certain activities which for various reason might have obnoxious effects in relatively central locations within the national capital could not be moved into the more outlying towns, either within Delhi State or even beyong its borders. Among the economic activities which have might some obnoxious effects in manufacturing,the problem must be explored how some manufacturing activities could be relocated from Delhi to proper to some of the towns the cities which are prospectively growing up around Deli in Uttar Pradesh and Punjab.
As was shown earlier in this chapter, the prospective labour force in manufacturing in Delhi state will amount to 525,000 persons by 1981, if the goal of having about onequarter of the total working force in manufacturing is achieved. It may be desirable to find ways and means of making available opportunities for industrial employment of some 115,000 to 140,000 persons in towns and cities around Delhi State- in addition to those who are expected to settle there anyway- and to reduce in this way the pressure of industrial employment, as well as a certain pressure of population , from the ccentre of the metropolitan nucleation at Delhi towards the outlying parts of the region. A potential redistribution of industrial workers among a series of outlying towns is presented in column 3 of Table 16.
The towns situated inDelhi Metropolitan are A could accommodate 114,000 workers shifted there from Delhi with their families,in addition to their normal population increase fromnatural increase and immigration. Another 31,000orkers with their families could be shofted to Sonpat and Raghpat, which are situated outside of metropolitan area but rather close to its boundaries. Sonpat is already on the way to becoming a progressive industrial community. Bagpat has good potentialities for developing into an industrial town, especially after the proposed bridge across the Yamuna or wazirabad is built. In addition, the improvement of the Delhi- shahdara- Saharanpur highway ill make the town much more easily accessible.
As can be seen from Table 16 the bulk of the working force in manufacturing is proposed to be shifted to Ghaziabad and Faridabad. Although Gurgaon and Bahadurgarh are located close to Delhi, the available source of water supply in these towns are
TABLE: 16
Working Force and Population Estimates for Town around Delhi State, 1981.
Town 1951 popn. In 1000’s
% of working force in mfg.
No. of workers in mfg. in 1000’s
% of working force in mfg.
Total working force in 1000’s
Total Popn. In 1000’s
Ghaziabad 44 20.0 50 40 125 357Faridabad 31 NA 40 40 100 285
Gurgaon 19 6.7 5 30 16.7 48Bahadurgarh 11 10.6 4 40 10 29Ballabghar 6 NA 3 30 10 29Loni 4 NA 2 25 8 23Narela 10 13.6 10 40 25 71TOTAL TOWNS IN METROPOTAN AREA
125 .. 114 39 294.7 842
Sonepat 30 13.1 28 40 70 200Bhagpat 6 12.6 3 25 12 34Total, Nine Towns
161 .. 145 39 376.7 1,076
Source : Census of India, 1951, District Census Handbooks, and T.P.O.
Limited, and hence they could not easily stand a high degree of industrial expansion, except at prohibitive cost. In Bahadurgarh three exists a planed industrial estate which might have been a prosperous suburb of Deli, but the scarcity of good water has prevented this development. It is unnecessary to say much about the proposed shift of workers to the other towns, Loni and Ballabgarh, since the numbers involved are small . The town of Narela lies within Delhi State, , and to the extent to which its industrialization is furthered, the industrial workin force within the State would not be affected. It has been listed here separately to show the possibility of defecting urban core in the centre of Delhi ( consisting mainly of old and New Delhi) to a place fifteen milesaway from the centre.
If this redistribution of manufacturing were carried out, the overall size of the total working force and total population in these towns would devlop to magnitudes presented in columns 5 and 6 of Table 16.
As will can seen from table 17, the percentage of the working force in manufacturing ranges from a minimum of 25 in Loni and Bagpat, both towns which have yet to devlop the basis rudiments of industry, to 40 in towns like Ghaziabad, Faridabad, and Narela. These last three places already had fairly sizeable beginnings of indfustriallization in 1951.. Given the different shares of the industrial working force, and assuming that the working force will constitute 38% of the total population, we have then computed the total prospective population of these towns. It will be noted that the combind population of the towns in zone A is exceted to amount by 1981 to 842,000 persons, and if Sonpat and Bagpat are included, to 1,076,000, persons. These developments will have an undoubted effect upon the growth of total population ( and hence also total working force ) of Delhi States, and in particular, of Urban Delhi. Instead of 525,000, persons in manufacturing and mining, Delhi State will have a substantially smaller numbers of persons engaged in these fields, and hence, the total population of urban Delhi and of Delhi and of Deli State will remain less than that projected in Table 7 of the preceding chapter. The estimated result ich may ensue if a redistribution of employ,ent opportunities for industrial workers into the outlying towns within metropolitan area is carried outare presented in Table 17.
TABLE: 17
Distribution of Working Force in Manufacturing and Population in Delhi Metropolitan Area, 1981.
City or Area No. of workers in mfg. in 1000’s
% of working force in mfg.
Est. total working force.
Est. total popn.
Delhi State 443 23.3 1,905 5,014Urban(excluding Narela)
418 24.0 1,740 4,593
Rural 15 10.7 140 350Narela 10 40.0 25 71Rest of Metropolitan area
112 32.6 344 906
Six towns* 104 38.5 270 771Villages 8 10.8 74 135Total metropolitan area
555 24.7 2,249 5,920
Ghaziabad ,Faridabad,Gurgaon, Bahadurgarh,Ballabgarh, and Loni. Source ; Tables 14 and 16 of this Chapter, and Town planning Organization.
This table was construted in the following way: it was assumed that in both Delhi State and the remainder of Delhi Metropolitan Area, the working force would form 38 per cent of total population (assuming medium fertility as exhibited in Table of 12 this chapter). The data for te total estimated working force in Delhi and the remainder of Delhi Metropolitan Area was derived from the estimates presented in Tables 14 and 16. As can be seen from Table 17, the proportion of the working force inmanufacturing in Delhi Metopolitan Area is expected tto be almost 25 per cent of the total working force;m in urban Delhi (othet thanNarela) it will be only 24 per cent, but in the towns around the margin of Delhi Metropolitn Area it will rise to an average of 38.5 per cent, and in Narela it will go as high as 40 per cent.
The comprehensive plan for Greater Delhi and iys metropolitan area will thus embrace in 1981 a total population of close to 6 million people; it will have to count upon a working force of alost two- and- a quarter million, of whom a little less than one- fourth or 555,000 will be in manufacturing. Within themetropolitan area;it will be somewhat more dense in the centre of the urban area of Delhi proper; and it will be highest in a number of outlying towns, located towards the edges of metropolitan area, where it will reach in some places a proportion of about 40 per cent, a density of manufacturing characteristic today, of such cities as Kanput or Ahmeabad ( see Table 12 of this chapter).
CHAPTER FIVE
LAND USE SURVEY AND ANALYSIS
Delhi is situated on latitude 28digree.38’ north and longitude 77digree.13’ east with a mean elevation of 700 ft. above the sea level. In the national physiography, Delhi Region is surrounded by the Himalayan ranges in the far north and the extensive desert lands of Rajasthan in the south and south-east. Both these physical features have given Delhi a temperate climate that is generally suitable for large urban
concentrations. The high Himalayas in the north not only protect the city from the icy winds from Central Asia and Siberia but also help to hold back the water laden summer monsoons that blow northwards from the sea. The desert of Rajasthan, on the other hand, tends to make Delhi’s climate hot and dry. The Himalayas are the fountain-head of all the rivers that flow in the Indo-Gangetic plains. These rivers in turn provide a perennial source of water supply to a number of cities and towns in the plains. Delhi gets her water supply from the river Yamuna.
Physical Features:
The most important physical features of the Delhi Metropolitan area are the rivers Yamuna and Hindon and the tail end of the Aravali Range that terminates near Wazirabad on the right bank of the Yamuna. This north-south range forms a triangular plain with the river Yamuna in the east and the Badarpur- Mehrauli .
Down towards south-east of Tughlakabad, the terrain gradually opens into a fertile plain. The range of the Aravalis south of Tughlakabad continues up to Mehpalpur but in the north it is intersected by the railways and Highways entering Delhi from north-west, west and south-west. This break occurs between Sadar Bazar and Subzimandi areas where the railway lines are laid at a much lower level than the lands adjoining them on both sides.
The triangle formed by the river and the two ranges of the Aravalis contain the present and the past cities of Delhi. Shahjahanabad and New Delhi lie in this triangle. Though the urban development has gone across the river in the east and across the ridge in the west, the triangle holds about 70% of the present population of Delhi. Whereas the river Yamuna flows touching the eastern part of the city, the river Hindon flows north-south but about 7 to 8 miles east of river Yamuna and ultimately joins it south-east of Tughlakabad, just east of the old abadi of Faridabad town.
Delhi Metropolitan Area extends from Narela village in the north to Ballabgarh and Gurgaon in the south and from Ghaziabad in the east to Bahadurgarh in the west. It measures 40 miles north-south and 38 miles east-west with an area of about 800 sq. miles.
Delhi Urban area, however, extends from Coronation Pillar in the north to Mehrauli in the south and from the Hindon river in the east to Nangloi drain in the west, measuring 15 miles north-south and 26 miles east-west.
Delhi Metropolitan Area: Physical Features Map No.6 shows the existing developed areas within the Metropolitan area, the rocky lands, the low lying, the Swamps and floodable areas and the good agricultural lands. Table No.1 gives the breakdown of the land classification in the Union Territory of Delhi as well as in the Delhi Metropolitan area.
TABLE NO: 1
LAND CLASSIFICATION – PHYSICAL FEATURES
LAND CLASSIFICATION
UNION TERRITORY OF DELHI DELHI METROPOLITAN AREAACRES % ACRES %
Existing Developed Land
42,700 11.6 49,000 9.6
Agricultural Land 248,300 67.6 366,400 71.6Rocky Land 26,700 7.3 38,600 7.5Low Lying Land 33,800 9.2 39,800 7.8Swamps and Floodable Land
8,000 2.2 8,500 1.6
Rivers 7,800 2.1 9,700 1.9Total: 367,300 100.0 512,000 100.0
574 sq. miles 800 sq. miles
Geology:
The major part of the urban area of Delhi lies on the alluvium. It is, however, intersected by the Mehrauli-Badarpur and Mehrauli-Wazirabad ranges of the Aravalis, which almost wholly consist of Alwar quartzite containing mica in small quantities. Quartzite is a good building material and a large portion of the ridge has been quarried and stone dug out of it for construction purposes, particularly for roads.
Fine clay is also found in extensive quantities towards the west of the ridge along Rohtak Road and Najafgarh Road and also in the south Tughlakabad Fort. That is extensively used for the manufacture of bricks.
West of Mehrauli near Mehpalpur and Masudpur villages, large deposits of good quality chalk and clay are also found, which support a large pottery industry in Delhi.
Chalk and salt petrel are also found in small quantities towards the south-west, and the presence of the latter has made this area practically unsuitable for urban development. There is an abundant supply of sand from the river Yamuna.
The north west and north east portions of Delhi State contain some of the best agricultural lands of Delhi. These areas are irrigated by the two distributaries of the Eastern Yamuna and the Western Yamuna canals.
The climate of Delhi is hot and dry and cold and dry according to the season. The months of December, January and February and fairly cold and dry. In the months of March and April it is warm and pleasant. May and June are the hottest months and are very dry. From July to September this area receives most of its rainfall. The period from September to November is mild and clear.
The average annual rainfall of Delhi is 26” most of which falls during the monsoon months of July and August.
Existing Land Use Pattern:
The river Yamuna flows through the Delhi Metropolitan Area, north to south-east. The normal flow channel is not very wide but to keep the city safe from flooding during the monsoon within its urbanizable areas both the banks of the river have been controlled by constructing regular bunds and embanking keeping enough space between them for holding the flood waters.
The river Hindon flows through the eastern portion of the Metropolitan area and joins the Yamuna, south of Surajpur village. This river has been dammed just south of the Delhi-Ghaziabad railway line and a diversion canal feeds the Yamuna above the Okhla weir. The Agra Canal takes off from this point. The Hindon river is very winding, has no defined banks and therefore covers large areas. The land on both sides is subject to flooding during the monsoons. These two rivers, the Yamuna and the Hindon, with the floodable land, cover 17,000 acres. The Hindon cut, the Agra Canal and Western Yamuna Canal take up 600 additional acres. The total land under the rivers and canals with the floodable land therefore, amounts to 18,200 acres or 3.5% of the total Metropolitan area of about 5,12,000 acres.
Area under agriculture is 3,66,400 acres or 71.6% of the total. The northern parts of the area, north of Rohtak Road and G.T. Ghaziabad Road, are irrigated by the two distributaries of the Eastern Yamuna and

Western Yamuna Canals and, therefore, are very fertile. The yield per acre in these areas is much higher than in the west and south-west around Nangloi and Najafgarh areas, or in the south around Mehrauli and Chattarpur Villages.
Besides the city of Delhi, the Metropolitan Area has three other urban concentrations, namely, Ghaziabad within the state of Uttar Pradesh, and Faridabad and Gurgaon in the Punjab. Bahadurgarh in the Punjab is nothing more than a large village and so also Narela to the north which is within the Union Territory. The existing urban area of Delhi covers about 42,700 acres. This includes 10,700 acres occupied by the Defense Department in Delhi Cantonment. It includes, besides the central urban areas, the far-flung residential areas like Dilshad Gardens Extensions and Jhilmila Tahirpur in Shahdara; Friends Colony, Kalkaji, Malviya Nagar, Hauz Khas Enclave, Green Park etc. in the west; Tri Nagar in the north-west, and Majlis Park, Inder Nagar in the north. It, however, excludes the northern ridge near the University and the central ridge near Rashtrapati Bhavan, the Okhla Treatment plant and the sewage farm area, the Siri ruins and the part of Qutab. It includes all the urbanized areas of Civil Lines, Old Delhi, New Delhi, Shahdara and the new development to the south and west. It also includes Delhi Cantonment situated in the south-west. Urban Ghaziabad covers 2,200 acres. Faridabad and Gurgaon are spread over about 2,850 acres and 550 acres respectively. The table below shows the acreages of the various urban area in the Delhi Metropolitan area:
TABLE NO: 2
URBAN CONCENTRATIONS IN DELHI METROPOLITAN AREA 1958-59.
URBANIZED AREA
DELHI URBAN 42,700 ACRESGhaziabad 2,200Faridabad (old & new) 2,850Ballabgarh 100Gurgaon 550Bahadurgarh 250Narela, Najafgarh & Loni 350Total 49,000 ACRES
The total area covered by these urban concentrations is about 49,000 acres. This constitutes only 9.6% of the total Delhi Metropolitan Area.
The main contiguous urban area of Delhi is the largest urban concentration in Delhi Metropolitan Area. This presently urbanized area covers about 42,700 acres. For many centuries Delhi has been the east of
political power and an important center of trade and commerce for the entire northern region. It has also now become a manufacturing and industrial center for small scale and medium sized establishments. Thus the city of Delhi is no more either a purely government center or a commercial town, or an industrial city. It has the characteristics of all the three and different sections of the city reflect these characteristics.
The five main railway lines meeting at Delhi Main railway station and the Aravali range divide the city into distinctly separate communities or districts. Delhi Cantonment which forms part of the Delhi Urban Area is located in the south west between the Aravalis and the meter Gauge Delhi-Jaipur Railway line. The north west sector between the Delhi-Ambala and Delhi-Rohtak railway lines is almost wholly agricultural in character and has most of the fruit gardens and orchards of Delhi.
New Delhi is almost wholly composed of Union Government offices and housing for its employees. There is, however, a large fashionable shopping and commercial center known as Connaught Place. Old Delhi with its Chandni Chowk, Khari Baoli and Sadar Bazar reflects the characteristics of a wholesale, commercial and distribution center. West Delhi, with its manufacturing establishments along Najafgarh road and Rohtak road give it the feeling of an industrial city. In Shahdara also industry has developed along the G.T. Road north end east of the Railway Station.
The University of Delhi is located in the Old Vicarage Lodge at the northern end of the city. Most of the educational institutions for college education and for higher studies are located here. The northern ridge near the University and the central ridge west of Rashtrapati Bhawan form the principal lungs of the city and provide ample land for general recreation and fresh air. Other major recreation areas are the parks at Okhla Hauz Khas, Qutab, and around several other monument. There are some local parks within the city but these are not adequate for the population. The water works are located in the north near Wazirabad on the right bank of the Yamuna and the main sewage treatment plants and the sewage farm are located in the south east near Okhla. These are very favorably located considering the prevailing wind direction.
The city of Ghaziabad, 12 miles to the east with about 75,000 population is a trade center which has a sizeable industrial component also. Industry is indiscriminately spread in all directions of the city. The old walled city is located on the north side of the G.T. Road but it has now grown beyond it in all directions. Industry has sprung up between G.T. Road and the Railway line on the south side, between Meerut road and Patel road on west side, and adjoining the fortification on the north. Within the old city of Ghaziabad, however, there has not been as yet any significant infiltration of industrial activity. It is predominantly residential with the exceptions of the two main cross roads, connecting the four gates,
which have commercial frontages. The city is thus divided into four blocks interconnected by a system of paved streets which have real residential character on a pedestrian scale. Hemmed in between the Railway line and the G.T. Road in the south easterly direction is one of the newly developed residential areas. On either side of this residential development are the industrial plants creating smoke and nuisance. The industrial activity and the net-work of main railway lines has given great impetus to the growth of this city, particularly influx of displaced persons. The city has thus grown during the last decade in a most haphazard fashion in practically all directions along the existing highways. The location of Ghaziabad in the Delhi Metropolitan Area is shown in map No. 6.
Loni in U.P. north of Shahadara has about 5,000 population.
The old town of Faridabad with a population of about 12,000 is situated about 17 miles south of Delhi on the east side of Mathura Road. Away from it on the west side across the railway the new township of Faridabad of about 35,000 was established after the partition of the country in 1947 as an entirely new town to house the displaced persona primarily from the North-West Frontier Province. This is purely an industrial town. The total area of this township is about 2,500 acres. Having been developed following a pre-conceived plan, the land use pattern is compatible and presents no major planning problems. The industrial area was planned towards the south which is now almost fully developed. There is now more demand for industrial land in this city. The four residential sectors are in the north. The northern most sector is still undeveloped. Housing is mostly single storied and semi-detached. Open spaces are plenty but are not maintained properly.
All the sectors are connected by a good and adequate net-work of roads and streets. The peripheral road which circumscribes the residential sectors has ample right-of-way. The railway station is situated at the north eastern corner of the town.
The strip of land between the Railway line and the Mathura Road is also under municipal control. In the Plan it was kept reserved for future needs and no specific use was indicated then. Thus no ribbon development has yet taken place but the strip along Mathura Road outside the township towards Delhi is being developed in an unplanned. To the north west corner of this township lies the Badkhel reservoir formed by a catchment area of about 5 sq. miles from the surrounding hills. It is a beautiful recreation and picnic spot and people from Delhi also Delhi also go there on week-ends.
It is learnt that the northern most sector of the town which was originally planned for residential development is being considered for developing into the second industrial sector of the city. At the
same time, a narrow strip of land immediately south of the existing industrial sector is being developed for residential purpose. If both these proposals are carried out, the city will create for itself a very major planning problem which will have its impact on the future land use pattern for the community. It is, therefore, very essential that at this very stage any piece-meal extension of this planned community be
avoided, and all Development should confirm to a well conceived and long range plan for the city, taking fully into account its relationship with Delhi and the increase in population in the surrounding rural areas during the next 20 or 25 years and its impact on this urban industrial centre
.Just south of Faridabad and east of the Mathura Road is Ballabhgarh with a population of about 7,000. This has no protected water supply and is rural in character.
The city of Gurgaon is the seat of the district head-quarters. It has developed around the intersection of the three roads, two from Delhi and third from the Jaipur. The entire city covers an area of about 550 acres with a population of about 20,000. New residential areas have been planned and developed by Punjab Government after the partition of the country to accommodate some of the displaced persons. Gurgaon is not an industrial community it is more of an administrative town.Since Palam Airport is not too far from here, many of the employees working in Delhi Cantonment live in Gurgaon and daily commute to work. Gurgaon has a problem of water supply and because of this the city has not grown at the same rate as other towns of this size around Delhi have during the past decade.
Bahadurgarh is by and large rural in character, rural in economic base, and rural in living pattern. There is no water supply arrangement and nor any sewage system. It has, however, good rail and road facilities, being located on the Railway line and a national highway. Its potentialities for development into a large urban community are relatively little because of poor and inadequate local sources of water supply.The area is about 250 acres with a population of about 12,000.
Narela is also another large village but has great potentialities. Like Bahadurgarh it is also located on the main railway line though slightly off the main highway.It has possibilities of abundant supply of potable water. There is adequate land resource of development for development into an urban community.It is relatively close to Delhi and because it is within the territorial jurisdiction of the Delhi
Administration, it involves no complicated system of interstate working relationship in regard to its development.The Ministry of Rehabilitation has developed a number of quarters for accommodating displaced persons. There is also a very small industrial area along the railway line to the south-west of the present village, near the railway station. The population is about 11,000. For Greater Delhi or Urban Delhi Area, detailed surveys, physical, socio-economic and land use have been undertaken as part of the General Comprehensive Plan studies.
Whereas moist of the city of Delhi has developed along the right bank of the river Yamuna, there is also the portion of the population living across the river in Shahdara.This area, however, has not developed as much as it would have, because of certain limiting factors, like low-lying land, flooding, absence of public water and sewage facilities, limited electric supply and inadequate physical connection with the main city. Similarly, the main city did not develop towards the north west direction between Delhi-Ambala and Delhi-Rohtak Railway lines because the areas was not easily accessible.Until recently there was no connecting roads with the only exception of the narrow Lawrence road. Most of the land is covered by fruit gardens and orchards and is very intensively cultivated because of the water supply from the western Yamuna canal distributary. The northern sector is low – lying land and subject to floods. Expansion towards the south east was limited mainly because the city’s sewage treatment plan, and the farms are located south – west of Okhla.
Therefore, the only directions in which the city could expand, and has expanded are towards the south and the west. In the southern direction the development has reached upto about two miles of the Qutab Minar. In the westerly direction the development has gone beyond Tihar village where the ministry of Rehabilitation has developed Tilak Nagar and the Tihar Colony. Development along Rohtak Road has been restricted because of limited water supply and absence of any employment centres in that direction but land speculation has all the same been going on.
The city has, thus, developed as far as 9 miles from Connaught Place towards the south and west, whereas areas lying within 5 to 6 miles in the north-west have remained undeveloped and un-urbanized.
In the following paragraphs the different existing land uses and their general pattern of distribution within the Delhi Urban Area are discussed.
DELHI : EMPLYMENT CENTRES
Government :
The nucleus of the Union Government offices is formed by the existing North and South Blocks of the Central Secretariat. To this nucleus have recently been added Udyog Bhawan and Krishi Bhawan, two permanent office buildings (each 6 floor high) on both sides of the Central Vista. Besides these four permanent buildings, there ara a large number of temporary hutments that were built all around the Secretariat during the World War II. All these hutments and barracks now house the various offices of the Central Government. These barracks are,however, being gradually demolished as the new permanent buildings are built. Two more buildings, n and K Blocks, are also under construction to replace the temporary barracks that exists on the same sites. (These are now called Rail Bhawan and Akash Bhawan) Part of Parliament Street has also been developed for Central Government offices which forms the northern extension of the Central Secretariat Complex.
The second largest concentration of the Union Government offices is on Shahjahan Road south west of the Hexagon at the eastern end of the central vista.
The Old Secretariat in Civil lines provides accommodation primarily for the offices of the Delhi Administration. Some of the Central Government offices, however, are also located there in the hutments built behind the main building of the Old Secretariat. Offices of the Chief Commissioner of Delhi are located a little further south of the Old Secretariat.
Indraprastha Estate, almost a mile south of Delhi Gate near Hardinge Bridge, has recently been developed as another centre for Government offices. Offices of the Comptroller and Auditor General, Accountant General, Central Revenues, Income Tax Commissioner etc. are located here. A new building for the Supreme Court of India has recently been built just south of this Estate. The District Courts, formerly located in the Kashmere Gate area, have now been shifted to the recently
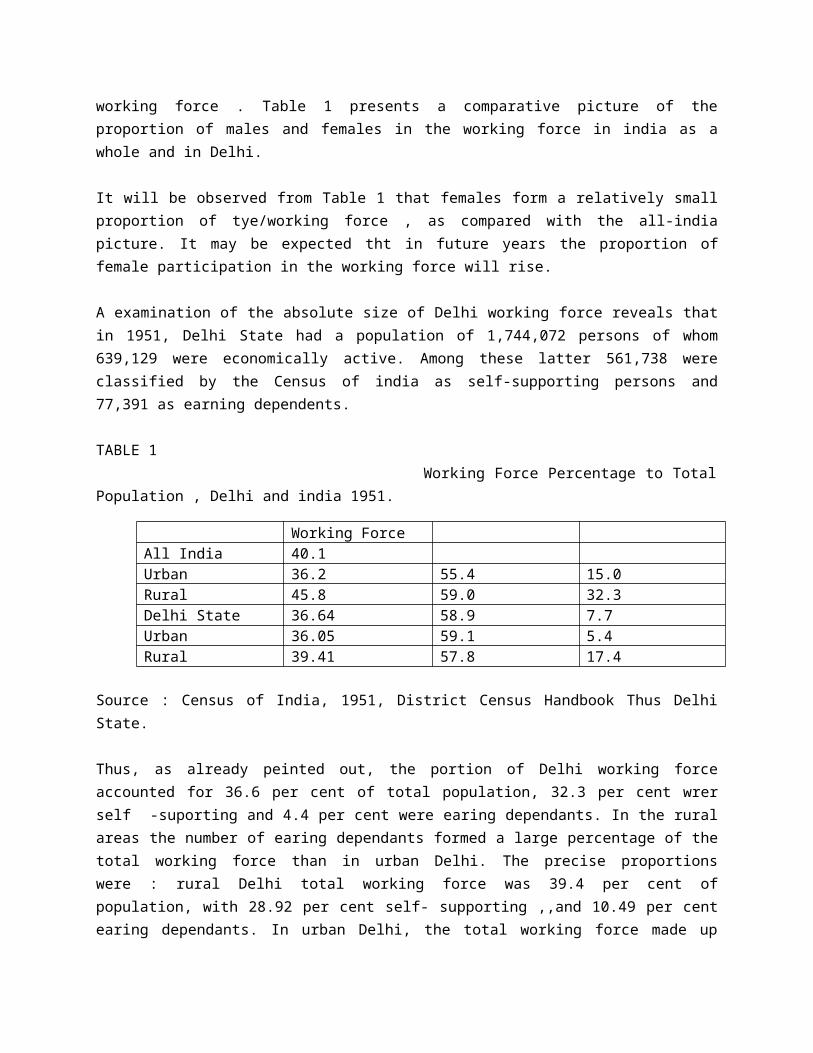
developed Court Complex in the Tis Hazari Parade Ground west of Mori Gate in the north.
The offices of the Foreign Missions now spread over the different parts of New Delhi in private bunglows, are gradually shifting to the newly developed Diplomatic Enclave where Indonesia,U.K., U.S.A.,West Germany,U.S.S.R, Thailand have already built their own buildings and moved to the new premises.
Besides the above major concentrated locations, Government offices are also located in various residential areas of New Delhi for lack of regular office accommodation. Quite a number of private buildings have been requisitioned for accommodating these offices.
Industry :
The largest planned industrial district in Delhi today is along Najafgarh road between Rohtak road and Patel road crossings. This industrial area was planned and developed by the erstwhile Delhi Improvement Trust in 1941. The intention of the authorities was to move some of the major industrial units operating in the heart of the city to this then outlying area, but hardly any plant moved out from the central city, and a new industrial area developed on this site.
The second largest planned industrial district was developed by the Small Scale Industries Corporation only two years ago on Kalkaji road west of Delhi-Mathura railway line.Today it is only a small scale operation compared to the one of Najafgarh road.
There are some depots along Rohtak Road belonging to the various oil companies who have located here main storage tanks there.A few more manufacturing concerns have also located their plants along this road and it is beginning to take shape as another light industrial-cum-storage and warehousing area.
Except for the Ayudhya Textile Mills which are located near Azadpur village all other large industrial units in Delhi Cloth Mills,Birla Cotton and Weaving Mills, Ganesh Flour Mills etc. are located in the thickly population residential areas. In the absence of any planned program for industrial location and development, manufacturing establishments have penetrated into almost every part of the Old City.
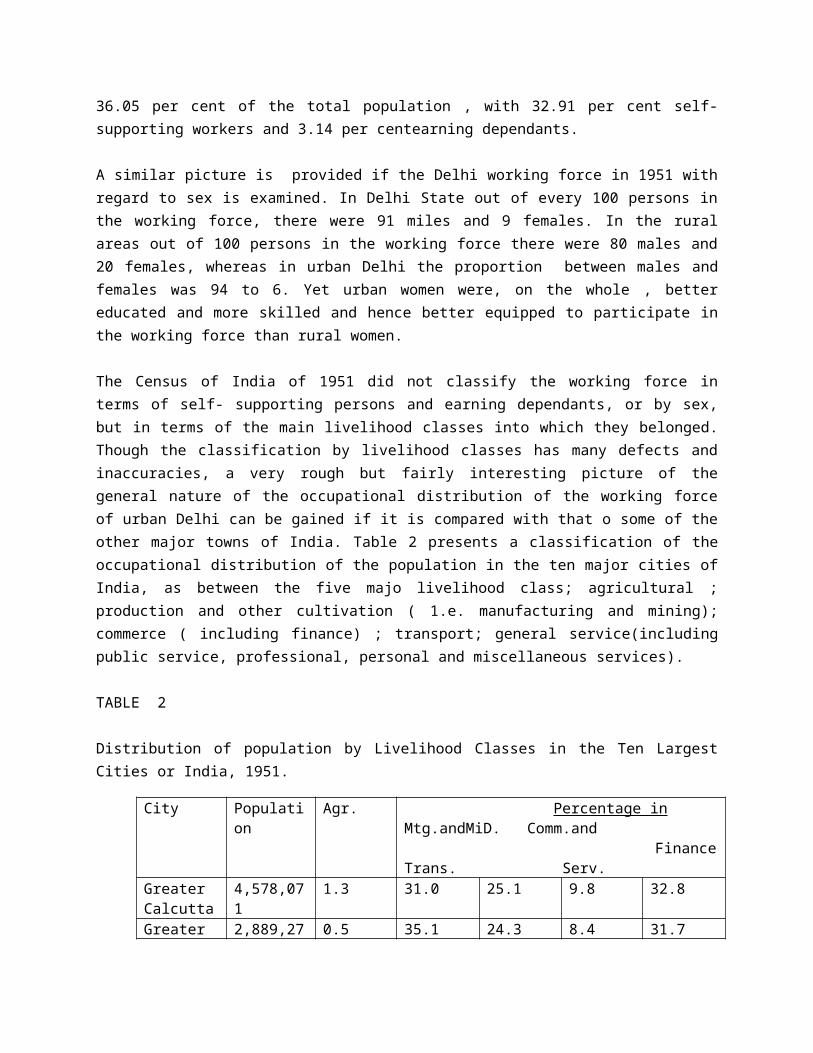
Industries have also developed in Shahdhara along the Grand Trunk Road on both sides east of the railway station. There are a number of industries located in the quadrangle between Loni Road, Shahdara-Saharanpur Light Railway and Grand Trunk Road, but these are smaller than the ones along the main road.
There are some pottery factories on Ring Road and on Mehpalpur Road in South Delhi.
Within the walled city of Shahjahanabad, a large number of small industries like metal shops, general engineering, welding, foundries etc., have developed. These are generally small in size, but create a nuisance all the time. Foundries are concentrated behind Hauz Qazi Police Station within the thickly population residential area.Light engineering, metal works, welding etc. are found practically all over the old city. A large number of auto repair shops and service garageshave developed in the service road between Connaught Place and Connaught Circus. This is perhaps because of its immediate vicinity to the business and commercial centre.
Light manufacturing, scrap metal, and auto parts and body building type of establishments have developed in Motia Khan area which is now considered to be the only place where both used and new spare parts can be bought and old junk sold out. The lower part of Jhandewalan has been developed by the erstwhile Delhi Improvement Trust as a commercial-cum-Light industrial and warehousing centre.
Commercial :
Delhi central BusinessDistrict and commercial and Financial centre is of a unique character. It is not consolidated within a few blocks as is common in most of the western cities. It has instead form spreading over a distance of more than two miles extending from Red Fort to Bara Tooti in Sadar Bazaar chowk with spurs towards north and south at various intervails. The wholesale cloth markets are located in katras in the interior of Chandni Chowk accessible by small alleys from the main Bazaar. A large wholesale cloth market ( called Krishna Market0 is located in the Phatak Habash khan area west of Chuch Mission road. The financial district of Delhi is located near the Fathepuri Mosque and in the Delhi Exchange Building.
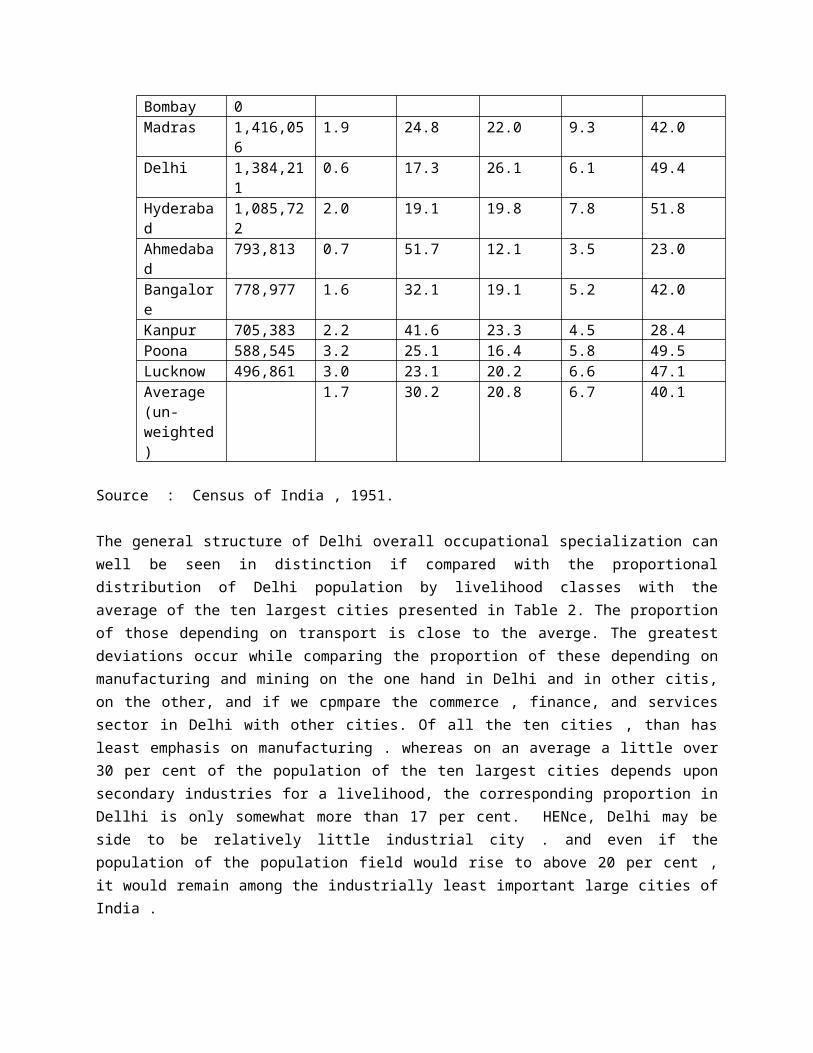
At the western end of Chandni chowk, in Khari Baoli is located the general provision market for household consumption. Dry and Fresh Fruit, pules, Chilies,dry and fresh vegetables and other such articles are available in thi part of the central business district. At the end of Khari Baoli, towards north on Naya Bazaar and towards south on G.B. Road is located the city grain market . The wholesale trade in food grain is carried on in this area under extermily congested conditions.
Across the railway tracks in Sadar Bazaararea is locatedthe city central market for hosiery,cosmetics and general merchandise. The retail trade is carried on in theinterior accessible by narrow lanes from it. Most of these markets are located towards the north of the Bazaar.
Wholesale trade in hardware goods like utensils etc. is carried on in Chawari Bazaar which runs almost paraller to and 1 mile south ofChandni Chowk. The paper and card boar market is also located in this area. Besides this rather linear central business discrit, Ajmal khan, road area in Karol Bagh is gradually taking shapes as a subcentral business district. Among the entire frontage on Ajmal Khan raod has been converted into retail shops, both large and small, specially between Rohtak Road and Arya Samaj Road.
Connaught place, the more fashionable and palnned shopping centre, though the central commercial area of New Delhi, still has not got the same value and importance as the Chandni Chowk, Khari Baoli,Sadar Bazaar areas have. There are several reason for this besides the historical facts. Connaught palce is essentially the general commercial centres for New Delhi area and its extensions. Business companies and professional offices occupy the first of Connught place and the outer circus. The commercial offices have extended southwards on paliment Street and Janpath.
An entirely new commercial and business centre has recently been developed between Delhi Gate and Ajmeri Gate by the elsewhere Delhi Improvement Trust, more popularly known as Asaf Ali Road Development or the D.A.G Scheme, This has been developed on the site where Shahjahan city well existed.
The city timber trade is located on Desh Bandhu Gupta Road, just north of Paharganj area. Originally it was located on Qutab Road north of Sadar Bazaar and in Teliwala.
The wholesale fruit and vegitable market is located in Subzimandi area ta the Junction of Boulevard Road and G.T.Road. This is one of the most congested portions of the city and has thus created unpleasant and unhygienic conditions.
Besides these major business and commercial centre retail trade is carried on in almost every street in the city. In the old city especially, almost all the street frontages have commercial establishments. Retail trade is increasing fat along the streets inKarol Bagh and its western extension area.Only New Delhi is saved
DELHI RESIDENTIAL AND RECREATION PLACES :
The pattern of residential development is of a varied character in Delhi. Right in the heart of the city there are two extremes of residential densities- from acute over-crowding to the spacious plantation type of living. Certain parts in the walled city like Jama Masjid, Dariba Kalan, Bazaar Sita Ram etc. have not densities of over 1,000 persons per acre, whereas just south of central Vista in the York Road – Akbar Road areas the net density is in the neighbourhood of 20 persons per acre. These sharp diversities were created when New Delhi was planned as the Imperial capital and the old city was to left to its own device. No relationship, physical or social. Was established between the old city and the new capital. Similar diversity is found to the north of the old city in the Civil Lines area of Alipur Road and Rajpur Road.This triangular area was also developed by the British prior to the development of New Delhi.
The highest density areas are Bazaar Sita Ram, Lal Kuan, Old Darya Ganj, Nai Sarak, Jama Masjid, Dariba Kalan Phatak Habash Khan. Areas outwise the walled city, viz., Subzimandi, Sadar Bazaar,Motia Khan, Qadam Sharif and pahar Ganj, have densities of 300 to 400 persons/gross residential acre. The old town of shahdara is also as thickly populated as those areas are.
Immediately south of paharganj and Ajmeri Gate, the densities drop to 60 persons/gross residential acre in the Irwin Hospital, Bara Khamba Road ,Curzon Road, Gole Market and Ashoka Road areas. South of the central Vista the densities are in the lowest in the city ranging from 5 to 10 person/gross residential acre. This covers Akbar Road and Tughlak Road areas. Lodi Estate, Golf Links, Kaka Nagar and Sundar Nagar Areas are in the range of 45 to 50 persons/gross residential acre.* The density pattern changes again south of the Lodi Road and in the areas north and south of the Vinay Nagar railway line. In these areas the average is about 75 to100 persons/gross residential acre. This includes Vinay Nagar - East, west and Main, Kidwai Nagar, Lodi colony, Jorbagh, Nizamuddin East and West, Lajpat Nagar, Defence colony, etc. Sewa Nagar and Jangpura areas have higher densities. Hauz Khas Enclave, Green park, Kalkaji, Malviya Nagar, medical Enclave are all developed to the density of 75 to 100 persons/gross residential acre. In the south east direction again there is a low density development comprising of friends colony etc.
* Gross residential density as the number of persons per gross acre which includes lot area, local streets, and community facilities and half the area of the major peripheral streets.
The older parts of Karol Bagh have higher densities than its later extension of Dev Nagar, Western Extension and Northern Extension. Densities in the newer areas range between 100 to 150 persons /gross residential acre. Patel Nagar, Rajinder Nagar, and New Rajinder Nagar are also in the same density range. Most of the newly developed residential areas in the western part along Najafgarh Road have 100 to 175 persons/gross residential acres. Moti Nagar has a density of 150 persons and Kirti Nagar 115 persons/gross residential acre. Rajouri Garden was developed at 155 persons/acre whereas its
extension was developed at 110 persons per acre. Tilak Nagar and Tihar have densities of 75 and 140 persons/acre respectively. The industrial housing colony near Moti Nagar has a density of 165 persons/acre.
In the north adjoining the older areas of Subzimandi, Jawahar Nagar, Kamla Nagar, Roop Nagar and Shakti Nagar have been developed at 150 to 175 persons/acre respectively. The industrial housing colony near Moti Nagar has a density of 165 persons/acre.
In the north adjoining the older areas of Subzimandi, Jawahar Nagar, Kamala Nagar, Roop Nagar and Shakti Nagar have been developed at 150 to 175 persons / acre. Rana Pratap Bagh, Vijay Nagar, Model Town have relatively lower densities. They range between 110 to 130 persons / acre.
In the east the Rehabilitation Ministry has developed Gita Colony, Gandhi Nagar, Jila Kuranja at about 125 to 150 persons / gross residential acre. The private developed Krishna Nagar has 150 to 175 persons / gross residential acre.
Delhi took a linear shape in post partition development along the existing arteries of the city expanding sporadically on both sides of the arteries, leaving large areas of agricultural lands in between these radials.
Most of the development has, therefore, been unplanned and uncoordinated. Low density areas are generally near work centers and workers have to travel long distances in large numbers from higher density areas to work places. There is no proper distribution of work centers in relation to residential developments. Naturally, therefore, numerous Inconveniences and planning problems have been created, such as transportation, inadequacy of roads, traffic hazards and delays.
Recreation and Open Space:
The largest developed and maintained public open space in Delhi is the Central Vista Park of about 300 acres extending from the Central Secretariat, the largest consolidated work center in Delhi, eastwards up to the National Stadium, the biggest sport center of the capital. Further east of it and across the Mathura Road is the special kind of recreational area of about 300 acres, the exhibition grounds and the zoological garden extending from Hardinge Bridge up to Humayun’s Tomb near Nizamuddin.
The second largest open space is outside Kashmere Gate area of about 115 acres extending from Mori Gate up to national highway bypass near the river. Visually this park area looks much smaller than it actually is because it is cut up into several smaller parks by Circular Road, Boulevard Road, Nicholson Road, Qudsia Road, and Alipur Road, of these, Circular Road and Alipur Road carry volumes of traffic, thus reducing the effective use of the park areas that adjoin these roads.
Towards the eastern end of Chandni Chowk, is the walled city’s largest public open space of about 90n acres facing the historic Red Fort and extending across the Elgin Road up to Jama Masjid. North-south it extends from the Military Recruting Office near Lothian Bridge to Darya Ganj.
Immediately south of and adjoining the walled city is another large horizontal strip of open space about 280 to 540 ft. in width. Beginning from Kamla Market near Ajmeri Gate, it extends eastwards by Turkman Gate and Delhi Gate and joins into Rajghat, the Samadhi of Mahatma Gandhi, on the banks of the river Yamuna. This open park of about 60 acres is more popularly known as Ram Lila Grounds. It may be added that the Ram Lila Grounds and the Qudsia Gardens were deliberately left as open spaces by British as the buffer areas between the walled city and the Civil Lines in the north and New Delhi in the south.
In addition to three large open areas there are five major developed public parks in Delhi for intensive recreation. Fortunately they are evenly distributed in different parts of the city. Roshanara Garden located amidst the very densely populated area of Subzimandi is about 75 acres. On the west it adjoins the Delhi Ambala Railway line. Its northern boundary joins the more recent residential development of Shakti Nagar and Roshanara Extension Scheme. Roshanara Club is also located in the northern corner of this garden. It is said that when the British build the temporary secretariat on Alipur Road and developed Civil Lines for their residences this garden was one of the most beautiful spots in Delhi.
Queen’s Garden originally known as Jahanara Garden, faces the Delhi main railway station and extends towards Chandni Chowk adjoining the municipal offices of the Delhi Corporation. Horizontally it extends from Church Mission road to Kauria Pul Road, and is about 50 acres. Since this is the only garden within the walled city area it is very intensively used by the residents of the old city. It is said that the Roshanra Garden and the Queen’s Garden owe their origin to the Mughal emperors.
Ajmal Khan Park is the only developed park in the entire Karol Bagh area. This 24 acre park is smaller in area than both the Queen’s Garden and the Roshanara Garden but it is more intensively used than both of them. In fact, this is the most intensively used park in the capital.
Talkatora Garden is wedged between the ridge and the Presidential Estate. As part of Lutyen’s plan for New Delhi, it was planned to serve the clerical population of the Gole Market and Irwin road area. Talkatora club is also located in this garden. Recently the Ministry of Education have developed an open air-theatre in the northern part of this garden and annual inter-University Youth Festival and other such
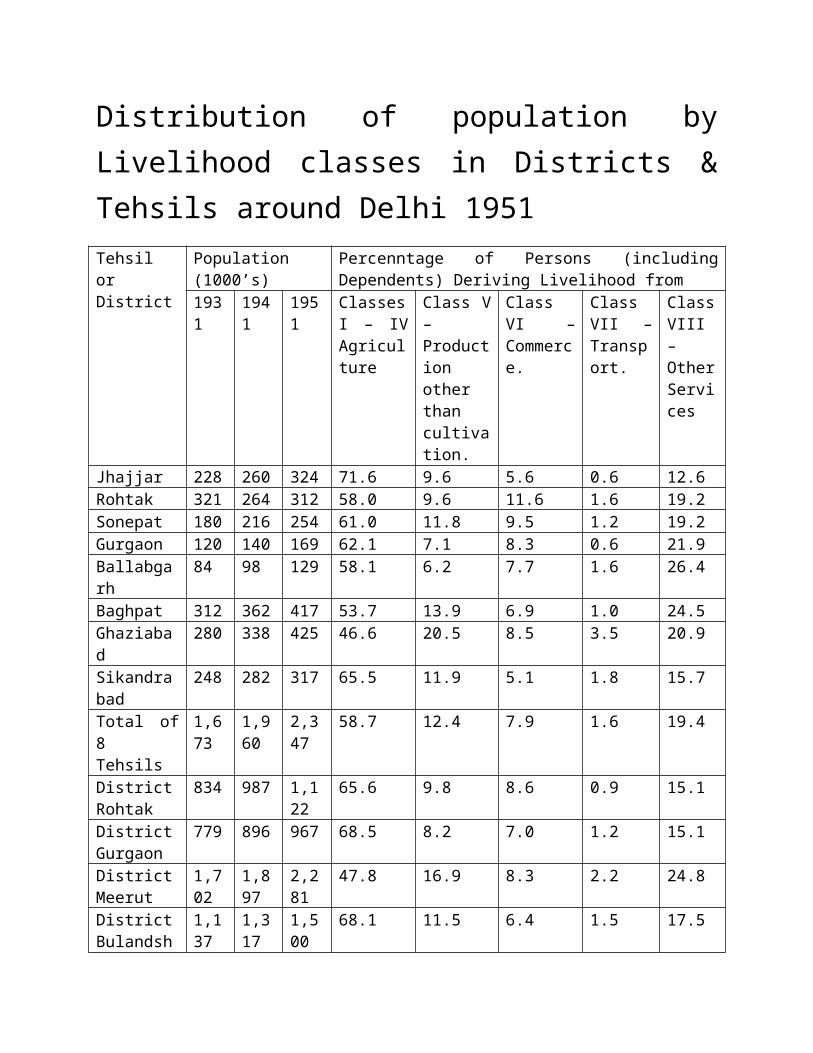
functions are held here. These functions have given added attraction to this park. It is over 100 acres in area.
Lodi Gardens of about 30 acres is the second park in New Delhi, and located south of the Central Vista and is accessible from Lodi Road and Ratendone Road. When New Delhi was planned it was located at its most southern limit but now it is surrounded by residential development on all sides.
Delhi also has an 18 hole golf course and a race course. The golf course of about 170 acres is located between Kaka Nagar and the Golf Links residential colony, and the race course of about 160 acres is just north of Safdarjang airport near Safdarjang tomb. Besides the National Stadium near India Gate, Delhi has another smaller stadium called the Cricket Pavillion outside Delhi Gate near Kotla Feroze Shah. There are a few additional parks that form part of the historical monuments. They are maintained by the Archaeological Department of the Union Government. These are Red Fort, Humanyun’s Tomb, Coronation Pillar, Safdarjang tomb etc. Connaught Place, the central business and commercial area of New Delhi also has a well developed park in its center. It is circular in shape, following the design of the shopping center.
For week-end recreation and picnics etc., Delhi has three major district parks, all in the south. Hauz Jhas is the nearest of all, located on Mehrauli road. It was the old university or Madarsa of the Tughlak Kings. It derived its name from the historic tank that was the principal feature of this place. The second recreational area is the park at Qutab. This park has rather attractive surroundings. The third park is at Okhla where the Agra Canal has been taken out from the river Yanuma. Because of the water front this park attracts large crowd of people during the hot weather. It is, however, not visited by many people during the winter months.
Besides the above developed parks and open spaces, Delhi has a large potential recreational area formed by the northern spur of the Aravalis that runs north-eastward through the city dividing it into two parts, the northern portion adjoining the University Enclave in Civil Lines and the second and the large area adjoining New Rajinder Nagar and Pusa Institute in the west and Presidential Estate and Gole Market area in the east. North-south it runs from Panchkuin road to Ring Road. This second part of the ridge alone is about 2,950 acres in area and thushas great potenialitiesfor a well- designed and systema-tically pallned recreational centre for the capital. The northern part near the University has already been undertaken for development into an organiged park area.
Delhi : Educational .Medical and other facilities .
There are four major academic and research institution in Delhi located in four different sectors of the city.The University of Delhi, the centre of academic education and research, is located in the northern
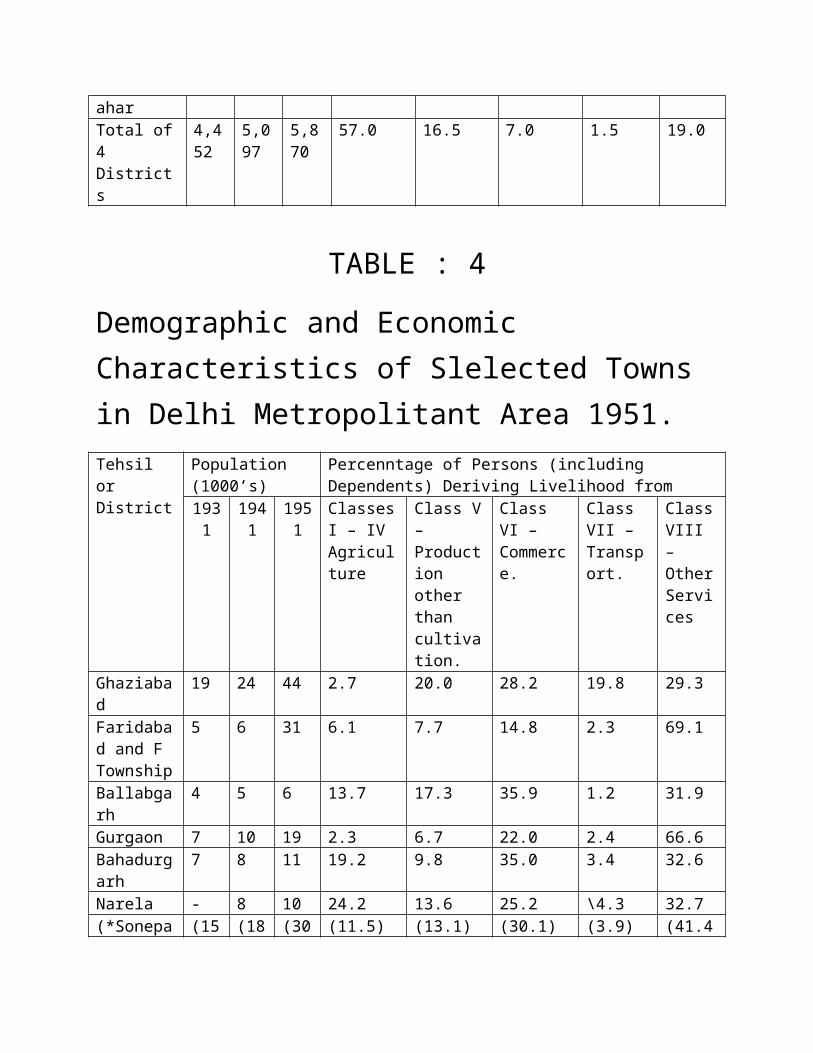
part of the capital on the site of the old viceregal Lodge and estate. It is about 380 acres in area. It has the most beautiful setting against the western slopes of the northern spur of the Aravails. The view from of the top of the flagstaff building looking towards the campus is magnificent.Most of the constituent collages that impart acadmic education in liberal arts and sciences are also located on the campus. Only a few, like Delhi collage , Lady Irwin Collage, Maulana Azad & Lady Hardinge Medical Collage, Khalsa Collage, Deshbandhu Gupta Collage, Lady Sri Ram Collage,etc., either of because of historical facts of lack of availabilitiy of land on the campus, are located in different parts of the city. There is, however, no collage in the western part of the city or in the Shahdara area in the east.
The second centre is the pusa institute area located south of PatelRoad Between the centeral ridge and the Delhi Jaipur railway line. It provides facilities for research in agricultural sciences. The National physical Laboratory, one of the 26 research laboratories set up by the Government of India in different parts of the country, is also located here. The total area is about 1,300 acres.
The All India Institute of Medical sciences is located of the junction or mehrauli Road and Ring Road and south of it. This is also a research institution complete with its housing for the staff coverning an area of 150 acres. A large general hospital is also attached to it. The institute conducts research in the field of medicine.
The fourth centre is the Jamia Milla situated on the way Okhla in the south eastern corner of the city. This is a specialized type of institution.The research is mostly directed towards rural development and rural life in India. The total area is about 120 acres.
Acadmic education at the primary and higher secondary stages in Delhi is rather unorganized because the distribution of schools in the city is not based on any rational or lanned basis. Schools have been and are being opened wherever a piece of land is available.There is an acute shortage of both Government recognized primay and higher secondary schools. Only a few selected schools have adequate land to provede the desirable minimum facilities required for the children. There few Schools are Modern school, Delhi public school, Convent of J esus and Mary, St, Columbus,St Thomas and presentation Convent school. With the exception of the presentation convent, all these schools are located in New Delhi. Among the Government run schools, the only school that has adequate buildings and open space for playground and recreation is Government Model School in Civil Lines. There are about 620 Governnment run or recognized school in Delhi;both primary and higher secondary.
Because of the shortage of recognized schools in Delhi and high percentage of school going children, a llarge number or private and unrecognized schools are being run by individuals and groups. These shop schools or teaching hops are very few in the New Delhi area because of stricter enforcement of land use controls.The number of such teaching shops is about the same as the Government run or recognized schools in Delhi. According to a survey, there are about 500 teaching shops inDelhi.
Hospitals :
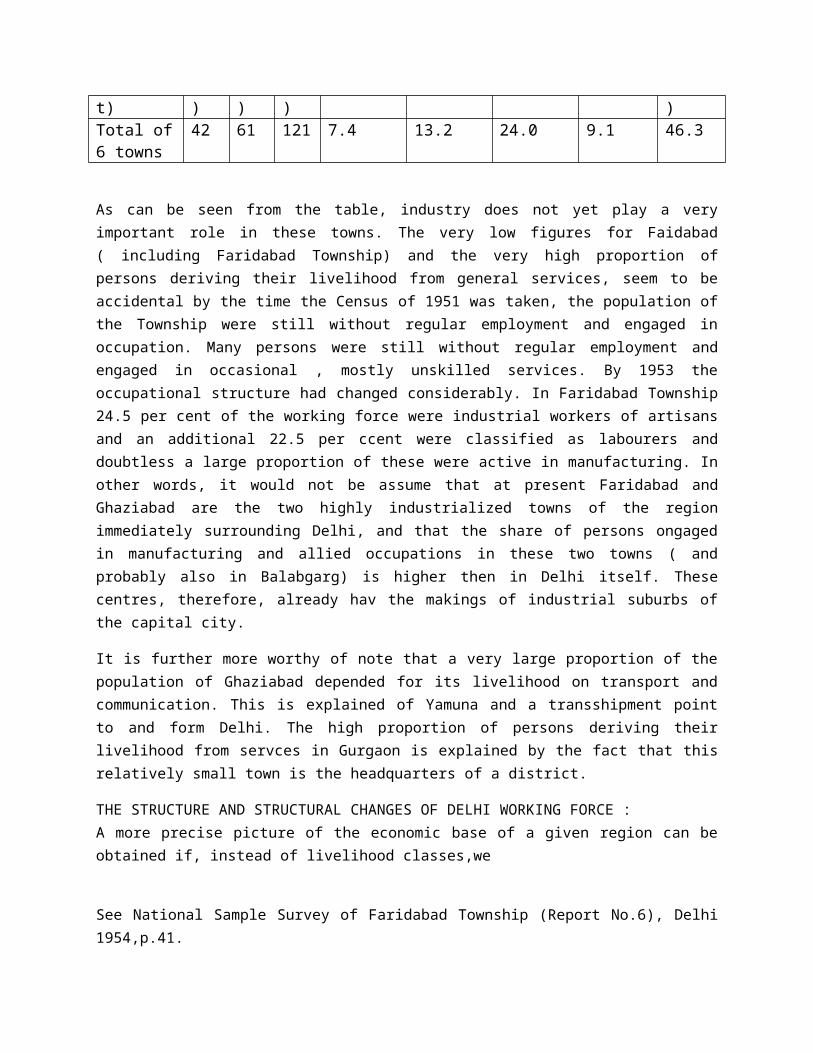
Delhi has only five large general hospitals-Irwin Hospiatl on Circular road near Delhi Gate, willingdon Hospital or Irwin road near willingdon Crescent, Lady Harding Hospital on panchkuin road, Safdarjang Hospital on Ring road in the south, and Hindu Rao Hospital on the Nortern ridge in Civil Lines area.
Besides these public hospitals thereare special hospitals like a T.B.Hospitl in Kingway Camp in Civil Lines,one T.B. hospital on Queen road at the corner of Naya Bazaar in the Phatak Habash Khan area.
In addition, there are several privaterun hospitals, clinics anr nurshing homes in different parts of the city mostely housed in residential buildings with the exception of a few, like Dr.Sen a nurshing home near Hardings Bridge which has designed as a nurshing home. The entire western part of the city has no public hospital. The result is that all the wards in Irwin and Safdarjang hospitals are always full.There is, however a private hospital known as the Gang Ram Hospital in Rajinder Nagar.
OTHER LAND USES :
Radio transmitting and wireless station have occupin quite large acerages in different parts of the city. A high power radio transmitting station is located in the north in Kingsway beyond the I.D.Hospital. A large wireless Station is also located on Lodi road near its junction with Link Road.The other coverning compartatively small areas are west of the All India Institute near Todapur village. An overseas Communication service Transmitting Center has recently been established on Kalkaji road just south of Greater Kailash residential area. A new wireless station has been developed off Mehrauli road beyond the village of Chhattarpur in the rural areas. The police wireless station is located on Anand parbat, west of Karol Bagh. The military wireless station is, however, located on the western slopes of the central ridge.
Besides the radio transmitting and wireless stations, water works, sewage treatment plants and farms have taken up a quitelargearea of the urban land in Delhi. Water and works purification plants are located at wazirabad and Chandrawal in the northern part of the city on the right bank of the river Yamuna. The storage tanks for filtered water are located on the northern ridge near the University and the central ridge behind Rashtrapati Bhavan.
The three pumping stations and treatment plants are located in the north- west of the Coronationn pillar, in the west near Keshopur village north of Tilak Nagar and the central Road Research Institute east of Mathura Road. The pumping station for this plant is located near the Hindustan Housing Factory east of Lajpat Nagar.
Besides the land used by the public utility system, Defence authorities have occupied a large area just north of the University. A large portion is also occupied north of East patel Nagar at the foot of Anand parbat, and part of it is on the hill itself.For their practice grounds they have also occupied about 100 acres of agricultural land south of Badarpur road about 2 miles west of Qutab Minar. These are in
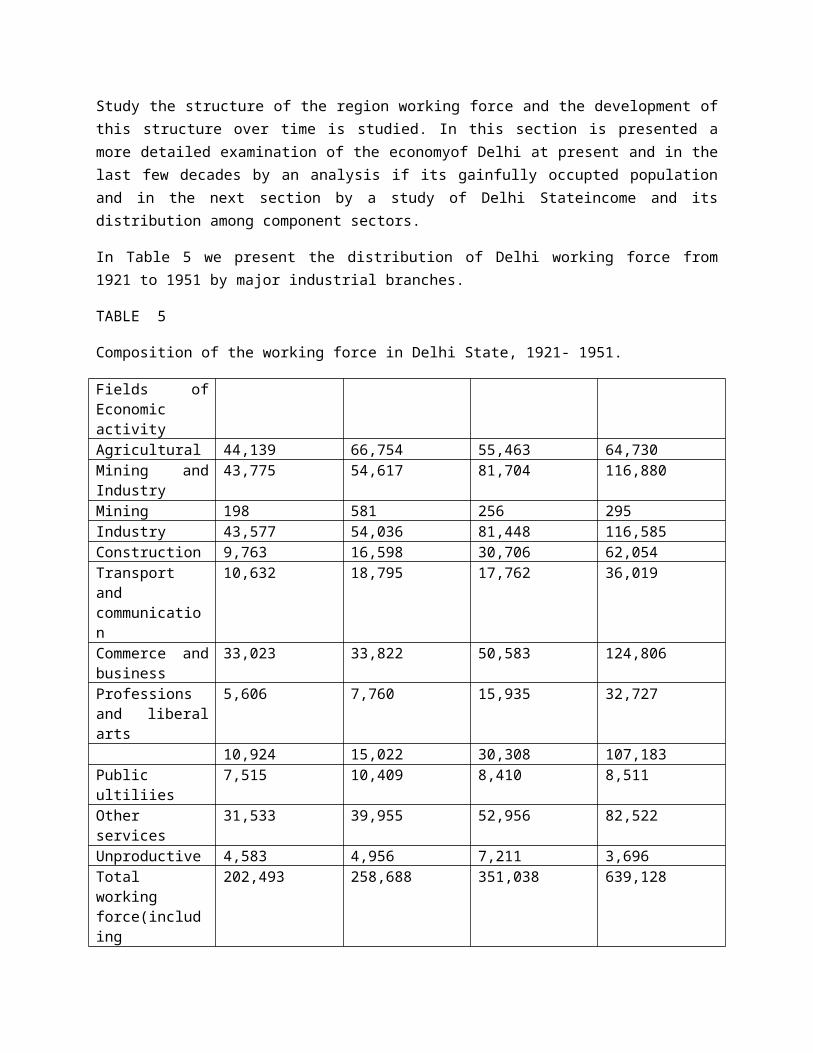
addition to the compact 10,700 acres under the Delhi Cantonment Board in the south western section of the city.
Planning Problem :Housing :
Since the attainment of Independence, urban expansion of this Metropolis has been rather unprecedented and hapzard. Large chunks of agricultural land lie undeveloped to the rear of the properties that about major arteries and have been only sparsely developed. The result is that the housing colonies have extanded up to the 8 th and 9th milestones along the Mehrauli road, Najafgarh road and G.T. Road towards Ghaziabad. The land along kitchner Road and Gurgaon road has been saved from this sprawl as it is owned by the Government and the Defence authorities up to palam airport. Because of the linear sprawl along the radials, it has been rather impossible to design or provided any efficient estates. Even electric lines were extended several years after the development had taken place.
No programme for provision of schools, parks and play grounds and other essential community facilities could be worked out because the ultimate development pattern was not known. This resulted in acute shortage of primary and secondary schools sites in the newly developed areas. Since the authorities did not formulate any policy towards the provision of these facilities, shop schools or teaching shops started opening in the residential buildings and along with these regular retail shops also opened in the buildings meant for residential use. Because of the acute of housing shortage, land was developed for residential purposes, and expect for shop plots, no work centres or industrial areas were developed. In the absence of any developed industrial land where people could establish manufacturing units, this economic activity also started in the residential premises and in a period of a few almost every newly developed colony get infested with teaching shops, email scale industries. Welding and general engineering and manufacturing. These were developed most haphazardly almost everywhere. House garages become repair shops and manufacturing establishments, and living rooms wee converted into teaching schools and retail shops.
The change in use has brought a complete change in the character of the area. Trucks have started playing on streets that were meantfor light residential traffic only. Change and increase in the mode and kind of traffic have resulted in more accidents. Industry is causing smoke and other nuisance.All these conflicting land uses and their undesirable mixture have created numerous planning problems that must be dealtwith now and solutions found for them.
Government has done a great deal to meet this acute housing shortage. The Ministries of Railways Health, Education and Defence have developed various areas to meet the demands of their respective offices. The problem was, however, too large to be solved singly by governmental action. Therefore, in addition to building houses for the employess, both the Delhi Administration and the Central Government developed several areas in different parts of the city, built dwellings for displaced persons and others. Government also developed residential plots and sold them to displaced persons as well as
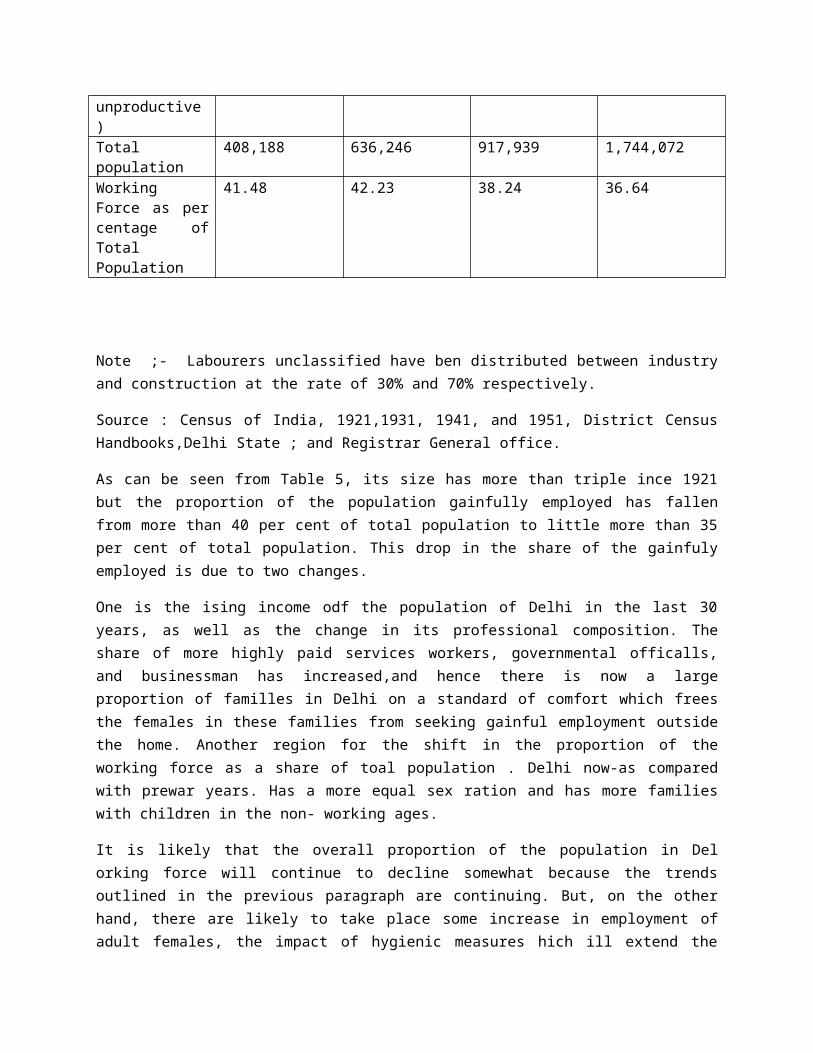
to the general public. Government also gave away large sums of money on loans to encourage private construction and building activity. This accelerated the house building industry and provided employment to vast numbers of people.
The private developer of his part, has aso done a great deal in helping to sole this problem of housing. However, this has not had any major effect on the problem because there are still too few houses and too many people to be housed.
In spite of all these efforts both by the Governemnt and the private developer, housing shortage still exists and many continue to exist for years to come in the absence of any well organized house building programme and perhaps until the national economy will permit large scale investment in housing scheme. It is estimated that in 1957 there were about 100,000 families in Delhi that needed to be provided suitable living accommodation. This, however, excludes all the Jhuggi dwellens that are squatting mostly on government lands in different parts of the city.
This shortage has resulted in extreme over-crowding and congestion in dwellings that were meant for single families only. In areas like pahargaj.Karol Bagh, Moti Nagar, Than singh Nagar , Malviya Nagar, Gandhi Nagar,Krishan Nagar, and most part of the old city families are living in single rooms only. This has increased the rate of occupancy which has over-strained the existing public utilities and the municipal services. Schools have started operating on double shifts andsome on three shifts in an effort to meet the shortage. Parks, playgrounds and open spaces have become too few for the large number of people using them. The cost of maintenance of the dwellings has increased whereas the municipal revenue remans the same. The water mains are totally inadequate for the overcrowded dwellings and the sewers are getting blocked because of the excessive discharge they have to carry for which they were never meant and designed.Roads and streets cannot carry the additional volume of traffic. All this ultimately results in a deteri-oration of the neighbourhood and its environments an dthe community ceases to function as a healthy neighbourhood.
The map Delhi Urban Area : Existing Land Use 1958-59 shows the general land use, the major components of which are discussed here.
Government Offices :
The Union Government has been the major single source of employment in Delhi besides the general business, commerce and trade sectors. The need for office accommodation in Delhi has been increasing consistently ever since the attainment of Indepence.
In spite of these efforts there are still almost as many offices in the Temporary barracks as in permanentbuildings. Governemnt activity willexpand further in the years to come. Government must adopt a policy towards developing several government office centres, in different parts of the city, to
accommodate at leats those offices that must be located in Delhi. For, others Government should plan a phased programme for their ultimate shifting to other places outside the central urban area.
The central Secretariat Complex can accommodate about 20 percent more then the persent number accommodated in permanent as well as temporary buildings. According to a special study that was conducted in 1958 by the Town planning Organization, this complex can accommodate a total of about 69,600 persons over a total land area of about 175 acres. This includes the parks and open spaces that form par of the total project. Other location of at least 50 to 60 acres each ill have to be found to devlop adequate sized government office centres. The sites chosen should be such that there will ample goverenmnet housing in the vicinity to fed the new centreso as to minimize the travel time.
Industry :
A s already stated above, in the absence of any planed work centers and industrial districts, industry has develoedin the residential areas. Some small scale but obnoxious trades and manufacturing units ate also located in the heart of the city. In th old city it is not uncommon to find a retail shop in the frony from facing the road, living quarters in the centeral remand manufacturing units in the rear of the same building. The slaughter hous, hich as formerly located in Turkman Gateare, was removed to its present site in Kasabpura area to take it away from the residential area. Now it is surrounded by one of the most thckly populated areas of the city. Because of its location in this place, other allied trades have also developed in the vicinity creating indsanitary conditions and intolerable nuiscane In the entire Qadam Sharif area.
All such industries now operating in different parts off the ceity create nuiscane, noise, smoke and traffic bottlenecks and are the absis cause for the steady deterioration of the neighbourhood. Such land uses must be separated from residential areas and located away from the core of the city in well lanned industrial districts meant for accommodating such establishment. The shifting of the slaughter house and all its ancillary trades to a new site on Rohtak Road beyond the oil store depot has been recommended. Similarly, large establishments like Delhicloth Mills, Birla Cloth and weaving Mills, etc. must plan a phased programme for ultimately moving out of their present sites to extensive land in industrial discrits well outside the city.
Hence, adequate sites for planned industrial districts both for intensive and extensive manufacturing should be found and so earmarked in different sectors to the city as not onlyto accommodate the establishments that will be moved from the centeral city but also to provided accommodation to the new ones.
Trade and Commerce :
The present mixed centre for wholesale and retail trade located along Chandni Chowk,Khari Baoli, Naya Bazaarand Sadar Bazaar Is most inadequate to meet the needs of today and the result is storage of food
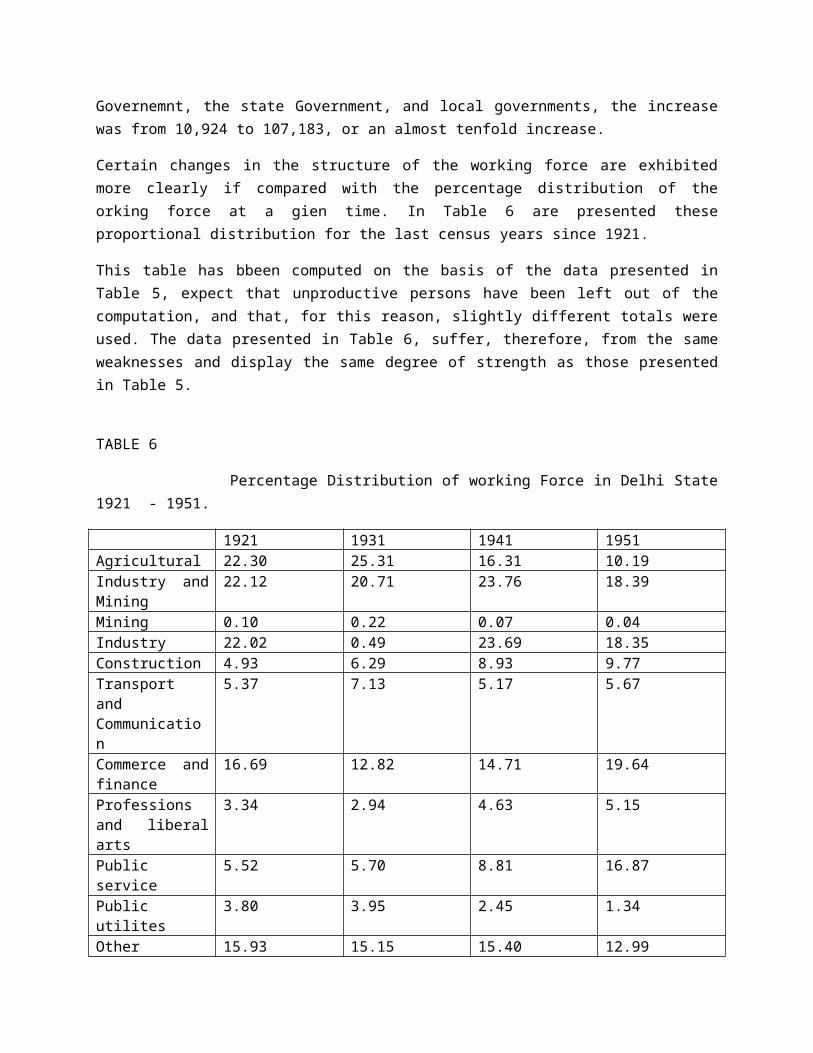
grains along the road side, loading and unloading on the street pavement itself, parking of trucks and animal drawn vehicles along the curb, hawkers selling their goods on the pavment etc. ithas created traffic bottlenecks and the most chaotic conditions. The G.B.Road grain market was never deigned to provide storage space for grain for two million people. Strects are utterly inadequate to cope with the four-fold increase in traffic.
Wholesale and retail operations must be separated. Markets must be so constructed that they function efficiently and avoid traffic bottlenecks. These should be adequate to meet both the present and the future needs of the caplital. While connaught place is the central shopping and business centre, it will have to be expanded to meet the growing needs of the city. There is, however, need for some more of this typeof compoite shopping centres, perhaps somewhat smaller in size and function, in other outlying parts of the city.These composite shopping centres or district centres, that will have facilities for retail shopping, business and professions, offices and entertainment, will not be expected to replace Connaught place but will supplement it and relieve some load of traffic and parking in the central area.
Parks and Open Space :
Delhi has to few parks in proportion to its population. Fortunately the exusting ones are very evenly distributed in the northern and southern pats of the city. The shahdara area in the east and almost the entire sector in the west haver no large public parks where people could go for recreation and fresh air. There are, however, good potential parks areas like the Anand Parbt, the small hillock between east and west patel Nagar etc. Some of the orchards in the north west could be utilized and covereted into public parks and horticultural gardens.
Other potential extensive recreational areas are the northern ridge the University and the central ridge near new Rajinder Nagar and Poorvi Marg, th entire river front from Wazirabad to Okhla and Tughlakbad Fort. These ares when properly developed will add tremendously to te recreational and outdoor life of Delhi.
With so much development having taken place during the past decade, the local authorities have not developed a single public park of the city. A well organized and planned network of large public park system must be evolved to cater for the existing and the future population. This can be done by preparing a comprehensive programme for public receation, both for intensive and extansive and regional use, based on proposed residential densities for existing and new areas of the city.
Schools and Collages ;
Delhi has been too far behind in providing educational facilities both at the schools and collage level. The majority of the collages are concentrated in the northe in the University campus and only a few have recently been opned in the south. There is bno collage in the eastern and western parts of the city. Only recently the Khalsa Collage has been opened in Karol Bagh.. it is particularly dffcult for the girls
liviln in these sectors as they have to travel all the way to the University in the north or to the Lady Sri Ram collage in the south. At present there are only 21 arts and science collsges whereas there ought to be at least 25 to serve the population of over two million.Recently a large site of about 150 acres has been acquired in the south for
The Buddha Jayanti park is being developed now on the ridge.A new collage of Engineering and Technolgy . For the projected population of over 5 million in 1981, the Delhi Union Territory of need several more collage. A comprehensive programme for distribution and location of these new inctitutions, according to the proposed pattern of population concentration, will need to be worked out.
The situation regarding , both primary and secondary,is even worse.Delhi adds about a lakh of persons every year to her existing population but the corresponding number of schools is not opend to meet the new demand. To add to this shortage there is already a back log. The result is that a large number fo teaching shops have opend and al are making handsome income in the name of education. If a city cannot a provide an adequate system of schools education, it cannot claim to be a comprehensive scheme and eradicate this evil of teaching shops which has become almost essential in the absence of a satisfactory public programme.
Other Community Facilities :
Like collage and schools, Delhi 1961 population of about 2.3 million has only five general hospitals and three of them are concentrated in the centeral part of the city. The entire westeren part of the city has no general public hospital. Shahdara has no public hospital either. Until recently Civil Lines had no public hospital. The maximum load therefore, falls or Irwin Hospital since it is the nearest to the very thickely populated walled city.
In preparing the land use plan adequate provision must be made for location of general public hospitals in the different sectors of the city based on the standars established by the Derectorate General of Health Services.
Similarly provision for other community facilities, like police and Fire Stations, Post and Telegraph Offices, Telephone exchanges shall have to be made according to the proposed pattern of population distribution. Fire protection is at present generally inadequate.The present net-work of police station and post offices is not so inadequate : therefore; it will be relatively easy to provide for these facilities.
LAND USE ANALYSIS :
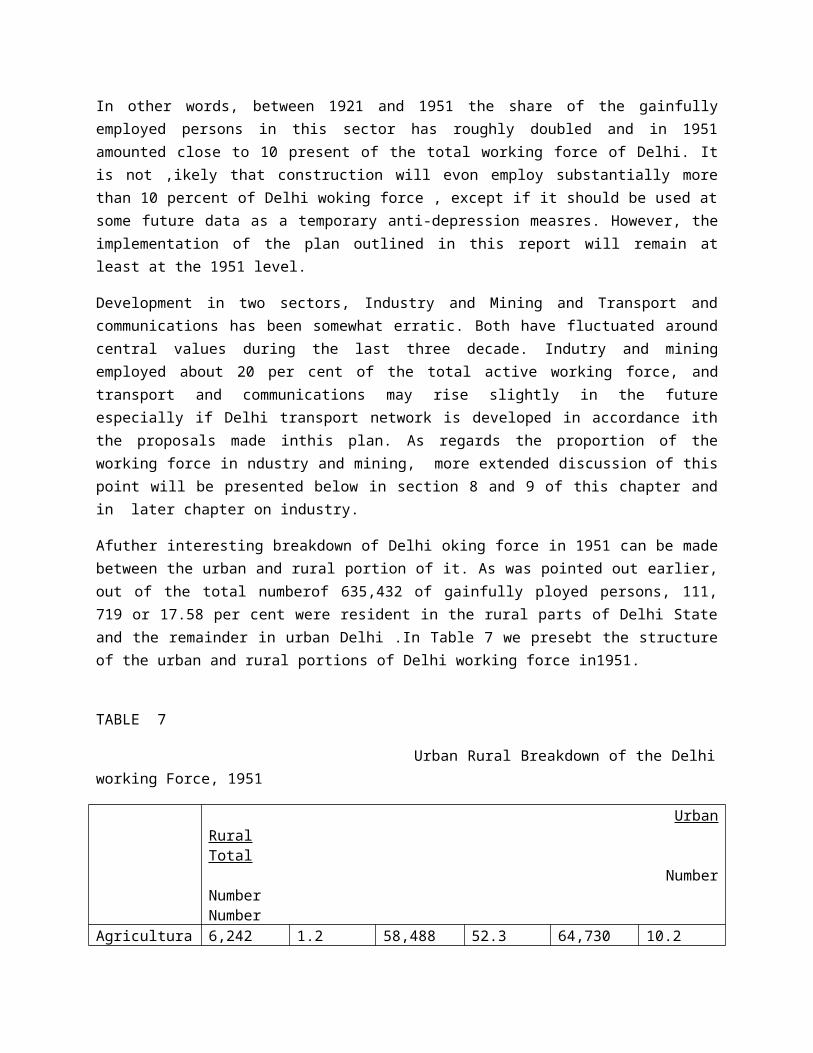
The existing developed urban area of Delhi is about 42,700 acres. Detailed surveys were carried out for about 38,000 acres of this area and analysis is given later on in tis chapter. With a view to accommodating the estimated population of about 46 lakhs in 1981, detailed investigation and careful analysis of the undeveloped land that adjoins the existing urban area wee carried out.
Study of Urbanizable Lands ;
A study of the physical Features, map No.6 will reveal that the area in the north is low lying and subject to floods. There are rockyoutcrops in the south beyond Badarpur Road. Towards the southwest also the area is low-lying and subject to flooding. The presence of salt petre in the soil is another drawback in this area. In the west, beyond shhdara,is U.P. territory and the Hindon river. These are some of the physical limitations on expansion.However,urban ex[pansion is possible towards the North-west and west. This area is rich agricultural land and care must be exercised to see that only the optimum of land is taken up for development.
Natural Forces of Growth :
The historical evolution of the growth of Delhi has been traced in the chapter Origin and Growth of Delhi. At present the pressure of development is towards the south. Many rehabilitation colonies have been developed in the west along Najafgarh Road, but only now the utilities are reching these colonies and hence there was a disinclination to devlop areas on this side. The north-west , which of rich agricultural land, the existence of orchards and the absence of any existing road pattern, has remained completely undeveloped so far. This has given rise to the anamoly that while urban expansion has gone up o 7 to 8 miles from the urban core in the west, south nd north, areas 3 to4 miles distant in the north-west have still remained under agricultural. Again, expect for 3 or 4 colonies, the shahdara area has remained largely undeveloped because of the transport bottleneck at the Yamuna drainage scheme.
Criteria in Selecting Urban Units ;
Considering the physical features and the present trends of urbanization, in earmarking large areas for future urbanization the following criteria evolved.- Physical limitations, such as topography, soil characteristics natural features etc.- Cost of improvement of lots. This includes cost of raw3 land, cost of site improvement, including the provision of community facilities and public utilities. This will include grading, road construction , filtered water supply, sanitary sewerage and strom water drainage.- Cost of transportation.- Based on there criteria a tentive line was drawn around the existing urban area to indicate to additional area required to accommodate the new population. This line was later refined on the basis of making the different units, that go to make up the city, more or less self-contained and in relating work
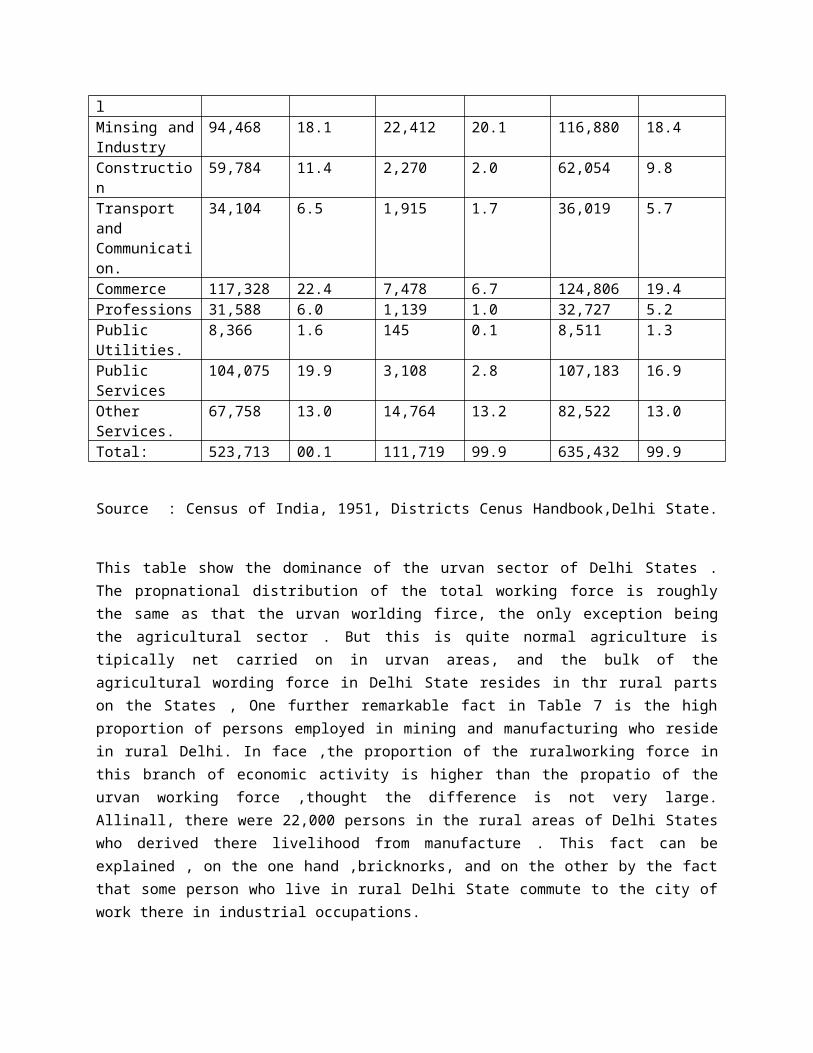
places, residences etc., so that there is balanced growth and no undue stretching of the lines of communication and services.
The land Use plan shows the limits of Urabn devlopemnt upto 1981. The physical features map shows the existiongg develop areas. The rocky areas which cannot be devloed at average development costs should be kept as open spaces and used as extensive, recreational areas because of their physical features. Low lying and floodable lands are also indicated which cannot be urbanized without undertaking very extensive earth-filling operations and flood control programmes. The northern low lying areas beyond the bund should not be urbanized as the River Yamuna must have enough land for spreading its flood waters during the monsoons.The total land available for urvanization in 1981,woyld be about 1,10.000 acres in Delhi. Beyond this is the Agricultural Green Belt which should be preserved in agricultural use. The uestion wheather to expand or not beyond the limits shown in tis map should be taken up 10 or 15 years hence.
Planning Division :
After having found the additional land available for future urbanization , the next step was to divide the entire existing and proposed urban area into suitable sectors or planning divisions for Locating very broadly the major government and work centres, the general business and commercial areas, the district and extensive park areas and areas for housing. The boundaries of each planning division were so selected that each one of such divisions reflects its own character of development, pattern of land uses, physical characteristics , and other social and cultural values. Major physical barriers, like main transportation lines, strems. Hills etc. were also taken into account in defining each boundaries.
The following criteria, therefore, were developed and used to boundaries of thevarios planning Divisions :-
-Historical Growth
- Character of Development
-Intensity of Land Uses
- Major Circulation pattern
-Principal physical Features
By applying these criteria, eight planning Division were evolved. Each ahs its own special characteristics and pattern of development.These eight divisions overlap the boundaries of the Delhi Corporation, the NDMC & Cantonment:
Division A-Old city-------------3,057
Division B- City Extension----5,574
Division C- Civil Lines--------8,500
Division D- New Delhi---------17,410
Division-E Shahdara---------13,329
Division F-South Delhi-------27,267
Division G-West Delhi------23,554
Division H-West Yamuna CANAL
Area -------11,787
Total 1,10487
Map No.8 shoes the boundaries of these eight planning Divisions:
Division A :
The old city Division covers an area of about 3,054 acres. The 16 th centuary city of shahjahanabad forms the mahor part of tis division. This part of Delhi though full of the dust and fragrance of the part and pulsatingwith life is a planner nightmare wuth its multiplicity of conflicting uses and its million problems created by acute congestion, insanitary conditions, dilapidated structures, narrw lanes and high land prices.
Division B:
The city Extension Division lies to the west of Division A and covers an area of about 5,574 acres. Most of it was developed after partition. It is congested in many parts. Slum conditions have developed in older areas like Sarai Rohilla, kishan Ganj and Rehgar pura. The newly developed areas are deficient in community facilities. These also need protection and adequate measures to prevent the spread of undesirable land uses form adjoining older areas.Anand parbat and pusa Institute with its huge farm also lie in this Division.
Division c ;
The Civil Lines Division forms the northern part of Delhi and covers an area of 8509 acres. It has parks and open areas with informal planning and pleasing characteristics.The University is located in this planning division, to the west of which are some of the old
These Division are for the Union Territory of Delhi only. The contiguous urban area in U.P. territory is about 7240 acres.
Fruit gardens and crchards of Delhi.This Division also includes some of the old heavily populated areas of Subzi mandi and Kashmere Gate.
Division D;The New Delhi Division encompasses a gross area of 17,410 acres and was planned and built by Sir Edwin Lutyens in 1912 as the Imperial Capital. The central are of this division has a plantation pattern of development. The central Secretariat,Rashtrapati Bhawan and Parliamnet House and located in the heart of this division. A lmost the entire is developed on low density, with single storyed structures except war time and the post partition development in the southern part of this division which is mostely on two storeyed apartment pattern. This division is geographically centerally located in the present urban pattern of Delhi.
Division E;Shahdara Division located across the river covers an area of 13329 acres. It covers practically the entire land east of the Yamuna within the jurisdiction of the Union Territory except for a small portion north of the Gokalpur escape and on either side of the Hindon cut. Most of the land is agricultural in character except some of the concertrated residential areas of Gandhi Nagar, Gita colony, Krishan Nagar,Rohtas Nagar etc.
Division F :South Delhi Division forms the southern part of the Delhi urban Area and covers about 27267 acres. Itb is, by and large, agricultural. After partition, most of the residential development has taken place in tis division.
Division G :West Delhi Division situateedd west of the Aravail, covers an area of 23554 acres. It includes a large portion of the Delhi Cantonment and extends upto Delhi Rohtak Railay lines.
Division H:The western Yamuna canal Division cover an area of 11787 acres and forms the wedge in the north western section of the city. It is almost wholly agricultural in character. It lies between Delhi-Ambala and Delhi- Rohtak Railways. The west Yamuna Canal flows through the middle of this planning division.
Planning Division and Districts Centres :One of the major objectives for establishing these planning divisions is to make these self-contained in employment and community facilities. These divisions will have population ranging from 3 to 7 lakhs. Hence each division has 2 to 3 district centres which are composite retail shopping centres with commercial and service uses. In most cases they will also have a small area for Government offices and an industrial work centre to provide employment.Each district centre will seve a population ranging from 1.5 lakhs to 2.5 lakhs and will be ell connected by a system of roads and highways so that they are easily accessible. Most of these district centres will have an academic collage and a general hospital in
their immediate vicinity. There will also be a district park near by, which can be used for various recreational purposes.
Planning Areas and planning Units : In newly developing areas the pattern of self- contained planning divisions ahs been conceived from the bottom upwards. This is dealt with in the chapter on Housing and Neighbourhood. They are : Housing Cluster ( with the nursery school as its focus) : Residential Unit ( primary school) ; residential planning area(Higher secondary school) ; community ( community centres); District (district centre).
In built up areas each planning division is divided into a number of planning areas ( communities) these are further sub- divided into planning units9equivalent to residential planning areas).
The following criteria were applied to select the boundaries of the various planning areas in built up areas.
Area :The area must be sufficiently large so that the land used and socio-economic data can be analysed as a whole. It may range from 200 to 1,200 acres, and may be more in specialcases. A standard neighbourhood according to the western definition was considered to be too small a working unit for Indian condition.
Population : A planning area may have a population of 25,000 to 100,000 persons. In special cases, it may be even larger than 100,000 but there must be valid reasons to support that.
Function :
An area must have a predominant function of land use that can be easily described and delimited.Change in predominant land use characteristics should give a clue to the possible boundary for the next planning area, since this would indicate a major shift in the activities of this area.
Linkages:
The linkages in terms of function are considered another factor to help demarcate the boundaries. Depening upon the abutting land uses and functions, a road can be a Joiner or a divider of two planning areas. For example, Chndani chowk and Khari Baoli are joiners whereas Faiz Bazaar Road and Link Roa are dividers.
Physical Features :
Existing physical features like railway lines, nullas, major traffic arteries etc. act as significaent barriers or linkages between different part of the city. For example, QUTAB road and the railway line along it act as a major barrier for any connection between G.B.Road area and Ran Nagar Sadar Bazaar area. This was considered another important factor in selecting the boundaries of the varios planning areas.
Checks on household selected : The selected boundaries were checked with the origin and Destination Traffic Survey limits. The larger boundaries were studied to see if these qualified for planning area boundaries.
Other considerations:Uniform distribution of population by planning area has come merits of its own, but for a city like Delhi which has a population density of two extremes, the land area was considered a more important factor.
Boundaries were also selected for planning area in the undeveloped and outlying sectors of Delhi that are now rural in character. These were, by and large, based on existing physical features and size.
By the application of the above criteria , 96 planning areas are delineated. Each planning area has some special features of its own, and is named according to the most popular area it includes. Map No8. Shows the names of eachof these planning areas. They are listed planning division wise. A planning area will be a unit for detailed site planning except for shahjahanabad where the planning unit will be the smallest unit for planning. Planning areas are also suggested to be the future census tracts or census wards for collecting all data on physical, social and economic conditions of the city.
The land use analysis has been done planning unit wise and figures obtained for planning areas and planning divisions.
LAND USE ANALYSIS OF DEVELOPMENT AREA : The preceding pages gave a broad general picture of the various existing land uses in urban Delhi. But to realy known the problems of a city and to plan for its future growth, it is essential to study the intricate pattern of the land uses, the degree of multiplicity of uses, the amount of retail shopping , the deficiencies in schools, open spaces and other vfacilities, the type, scale and nuisance factor of the industrial uses, the physical condition of buildings etc.Balanced land requirements can only be projected from the existing known quantites and estimates of future intensities. There was no other way of collecting this data except by a plot survey for the entire community,1.e. by a detailed inventory of all land uses and structures. These have been collected and anlysed for small units, and figures have been added up for larger units and for the city as a whole. Survey maps and Hollerith 80- punch card system had been used for the purpose of colleting data and analysis.
The survey included almost the whole of urban Delhi, except a few unauthorisedcolonoies in the outskirts of the present urban area and Shahdara town since plans were not available for these. Cantonmnet area has been tabulated as land under defence and no detailed survey has been done
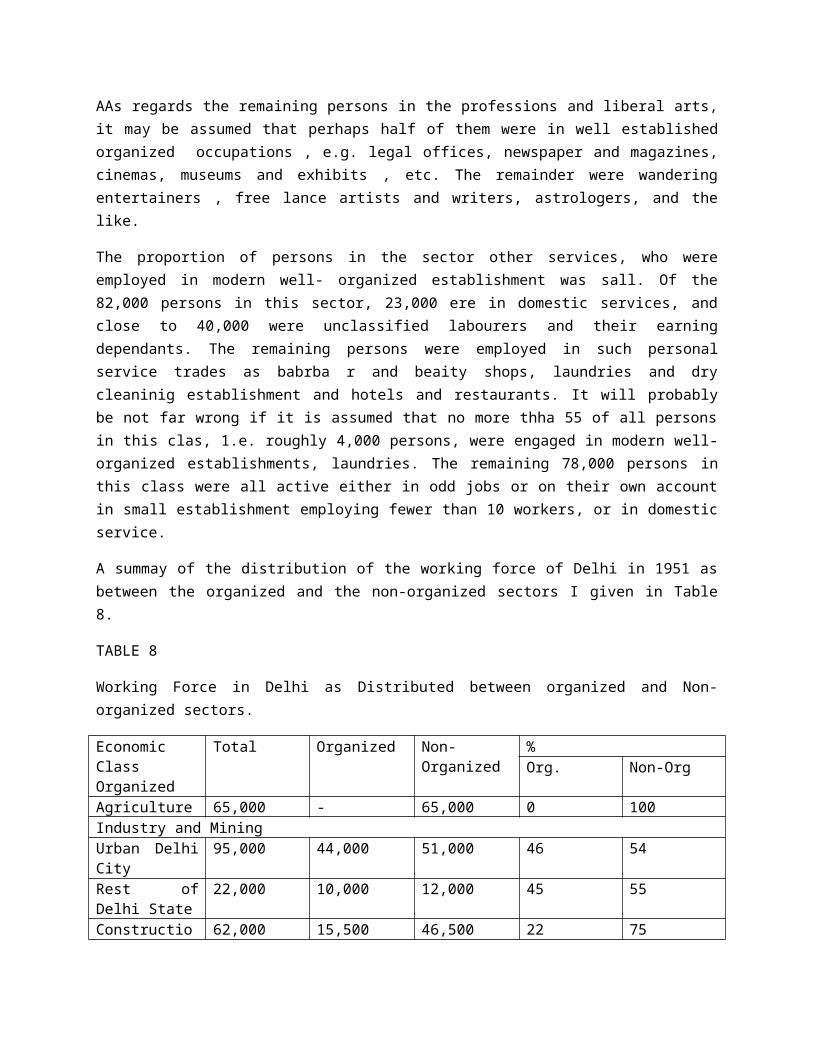
though a large portion of it is in residential use. The survey was started by the end of 1957 and completed by 1959. The old city areas had only maps showing main streets and a few alleys. The plots had to be marked during the Survey. For the other areas maps were availabl3e but there were plentyof changes to be done by the survey party on the field. 87,665 plots (group housing were taken as one plot) and 3,85,800 dwelling units ere counted I n the survey with an estimated 17,74,600 people.
Condition of Structure :In the survey on structures, the number of storys, type of material and the condition of structure had been noted which would be useful in a intensive study of particular areas. For a city wide study, only the condition of structre is presented here. In arriving at the percentages , the bustis have not been taken into account. The location of bustis hich contain about 50,000 dwelling units is shown in the existing Land Use Map, The percentage of structures in poor condition varies from an overall of 55.7% in old Delhi to only 10.1% in New Delhi. The survey shows that in Delhi
Table No.5 gives the number of retail shops per acre populations in the various divisions..Separate figures have been collected for the population excluding the familiesliving in busties as well as for the total population . it in evident that the number of retail shops is higher for the population excluding busties as there are no regular shops in the busties.The highest number of shops per 1000 population is in the old city which has 24 per 1000 as against 10 in New Delhi Division. This number is only 4 to 6 in the colonies in south and ewest Delhi since shops and other community facilities were not provided for in these colonies at the time of building the houses. There might have been a slight improvement in these figures since the survey was done is 1958-59. The figures for Karol Bagh Deivision and Civil Lines Division is within 14 to 16 shops/ 1000 population which is more or less the same as theaverage figure for urban Delhi as a whole.
Thus the figures that at present there is one retail shop for about 60 persons on an average, whereas the figure is one for 40 in the old city. Most of the shops are very small and the amount and variety of their goods is limited. They carry on a bare existence and are the result of the low economic level of the population and want of other job opportunities. When these improve, there are bound to be more and larger shops catering to a large number of people and with greater amount of goods. In planning for the future, estimate has been made on the basis of one retail shop for every person, through in the earlier stages there may have to be more smaller shops which can be later converted to bigger shops.with the creation of a proper hierarchy of shopping areas like corner shops, planning area shopping centre, community shopping centre, district shopping centre and central business district, the tendency to have khoka shops anywhere and everywherewill have been countered and, with proper control ,prevented.
INDUSTRIAL USE ;Size 7 Nature of Industry ;

Urban Delhi has about 637 acres of industrialplot area, of which about 183 acres or 29% is in small scale industries employing 1 to 9 workers with power, 109 acres or 175 in medimum scale industries with 10 to 49 employess with power and 345 acres or 54% in large scale industries employingover 50 workers. (Double the number of workers were considered on each count in case of industries not using power). The 637 acre were occupied by 3609 industries which were considered major uses on the plot. This works to an average of 0.176 acres or 85 sq.yds. per use. There were another 2198 industries which were secondary uses on the plot and hence the area occupied by them has not been taken into consideration but they may not constitute more than 10% of the area under major industrial uses.Table No.6 A shows the Nature and size if industry in the various Divisions.
Of the 183 acres of land under small scale industries, as much as 83 acres are in the old city of which 31 acres or 37% are nuiscane industries. Karol Bagh Division comes next with 38 acres in small scale industries, of which 25 acres or 665 are nuiscane industries. Of the total land under small scale industries, 74 acres or about 405 has a nuiscane value.
There are 109 acres in medimum scale industries, of which 57 cres 1.e. about 525 are nuiscane producing. About 30 acres in New Delhi Division and 28 acres in south Delhi Division are the major locations of medimum scale industries.
Large scale industries occupy 345 acres of which 218 acres or 63%produce nuisance. About 166 acres of large scale industries are in west Delhi Division, 62 acres in New Delhi Division and 36 acres in South Delhi Division and 24 acres in Karol Bagh Division.
O the total 637 acres in industries, 335 acres or 535 had nuisance characterstics of which at least 150 acreswere in approved industrial estates, and area such as Najafgarh Industrial area. A set of performance standard will have to be prepared so that the nuisance generating industries will ultimately disappear through improved process or they must be shifted to outlying zones. The rest of the 185 acres of nuisance industrial uses will have to be shifted to industrial areas . The non- nuisance industries located in non- industrial areas will also have to be shifted to industrial areas and flatted factories but their total area also maynot exceed more than 150 acres. Hence, a total of about 300 acres ofplot area of about 500 acres of land allowing for future expansion etc. may be necessary to relocate all the non- conforming industrial uses in regular industrial estate.
Type o Industry:
Of the 6637 acres of industrial plots, 77 acres or about 12% are engaged in manufacturing food products. 128 acres or 205 are engaged in manufacturing textiles, wood and wooden products, paper and paper producst or in printingand publishing. 267 acres or 425 are in manufacturing , leather and leather products; rubber and chemicals; stone, clay and glass products. 165 acres or about 26% are in metal and miscellaneous manufacturins viz. metal and metal products machinery and electrical
equipment, transport equipment and miscellaneous manufacturing. Table No.6B shows the breakdown in the various divisions according to type of industry.
Wood and wood products ( 11.75 acres), paper and paper products (0.88 acres) ; printers and publishers (17.71 acres); leather and leather products( 8.29 acres); have the largest areas in the old city division compared to any other division. Many of these are small scale industries and excepting the noxious ones like tanning and nuisance ones like metal smelting, the others can be relocated in faltted factories. Food products have the largest area in New Delhi Division ( 28.44 acres); textile products in Civil Lines Division ( 40.69 acres); rubber, and chemicals in west Delhi Division ( 140.60 acres). Stone, clay and glass products have the largest area in New Delhi Division( Hindustan Housing Factory and Gwalior potteries 37.61 acres) but south Delhi Division also ahs 29.26 acres in this category. Transport equipment has the largest area in waest Delhi Division 9 11.32 acres).
Of all types of industries in all division, those occupying a total of more than 50 acres are the following rubber, and chemicals ( 160.34 acres0; stone, clay and glass products ( 94.48 acres) ; meta and meatl products ( 90.34 acres0; food products ( 76.58 acres0 and textile products ( 73.56 aces).
Table No.7 gives the distribution of community facilities in Urban Delhi.
OTHER LAND USES :Schools :
The defiency in school facilities is discussed in the Chapter on Education . Here the deficiency in land rea for schools in the virous divisions of urban Delhi is revealed in table no 7, showing the existing school area per thousand population. It varies from 0.08 acre/1000 in Old City Division to 0.51 acres / 1000 in New Delhi Division and 0.85 acres/1000 in South Delhi Division. The average for urban Delhi is 0.27 acres/1000. This is pitifully low. In such conditions no educational system can succeed. The desirable area requirements for pre- primary, primary and higher secondary schools for different densities are discussed in the Chapter on Education. Suffice it to mention here as an example, that for a residential colony of 75 density, the prescribed school area is about 1.5 acres/1000 as aginst 0.27 acres/ 1000 available at present.
Parks and Playgrounds ;
The deficiency in this respect is equally bad but the postion in New Delhi Division 3.32 acres/1000 and south Delhi Division 2.74 acres/1000 is satisfactory compared to Old Delhi Division 0.20 acres/1000. In Shahdara there are no play grounds or developed parks worth name but only a few open spaces. While it may not be possible to rectify the postion immediately since these areas in the old city are thickly built up, only by stages ccan some open spaces and playgrounds be obtained.However, the plan proposes to bring up the level of the open spaces and play grounds for drvan Delhi . Keeping in view the economic condition of the country . the dry weather in Delhi and the present want of open spaces , an everage
figure of 4.66 acres/1000 has been arrived at for the proposed developments of Urvan Delhi as against the existing figure of 1.19/ 1000 . This is fully discussed in the Chapter on Recreation . The large Regional Parks like Buddha Jayanti park on the ridge and Qutab Minar park near Mehrauli , which will cater for a larger number of people and will be a tourist attraction are in addition to the figure proposed aveobes.
Other Public and Semi-Public Facitities. These facilities also show a pattern of disparity of distribution with 0.49es/1000 in old city Division , 0.28 acres/1000 in Shahdara ,1,81 acres/1000 in west Delhi division whereas it is above 3 acres/1000 in the other . It is 15.23 acres in south Delhi Division because of the sewage treatment plant. Water works and wireless transmitting station ect. The existing average figure for Urvan Delhi is 2.56 acres /1000 which is rather flattering but be largely due to historical monuments , research Institution , public utilities ets, But land presently under community Center, health centres , post office etc. is low. It is proposed that on an average 0.2 acres/1000 will be shown in the zanol plans for these purpose . In the 1981 urvan area the land allocated in the Master plan for colleges , Hospitial , institutional uses , utilities ,ets, is 2.0 acres/1000 Thus land requirements ,for all community facilities in 1981 will be 1.5 acres/1000 for schools 4.66 acres/1000 for parks 2.0 acres/1000 for other community facilities mentioned above . This is a total of 10.56acres/1000 an aganest 4.97 acres/1000 now available.
Overall Land Use Distribution
Table no,8 showe the distribution of major land use [1958-1959] in various division and the population living therein. This show the disparity in the intensity of land used in the old City Division an against New Delhi or South Delhi Division . About 580 acres of plot area contains over 6 lakh690 persons per acre in the Old Delhi Division , as against 110 P.P.A in new Delhi Division and 140 p.p.a in South Delhi Division . The net residential densities in Karol Bagh Division and Civil lines Division are 397 p.p.a. and 249 p.p.a respectively .The Master Plan has proposals to rationalize this disparity of residential density by increasing the density in certain acres in New Delhi and lessening congestion in the Old City Division by relocating the busti squatters and removing undesirable trades and industry. The average gross residential density in the Master plan is about 97 persons per acre as shown in table N0.10.
In the old city Division, there are only 0.33 acres/1000 pop. Of commercial land but the ratio of commercial to residential area is 1 : 4.3. The figure for New Delhi is 0.87 acres/1000 pop. And the ratio of commercial area to residential areas is 1;10.5. Between these two extremes, we have the figures of Karol Bagh Division 0.29/1000 pop. And a ratio of 1 : 8.8 and for Civil Lines Division 0.65 acres/1000 pop. And a ratio of 1 : 6.20. The average for urban Delhi is 0.59 acres/1000 and a ratio of 1 ; 7.4. the percentage of commercial plot area to total developed land in each of the Divisio is as follows. Old Delhi(7.7%);Karol Bagh (2.1%); Civil Lines ( 3.5%), and New Delhi is 2.3% whereas the average for urban Delhi at present is 2.5%in the Master plan, it is proposed to have 1.45 of the total developed area in major commercial uses( excluding warehousing and mineral siding0, and another about 15 of the residential area or 0.55 of the total area in local shopping.This means that the land under all commercial
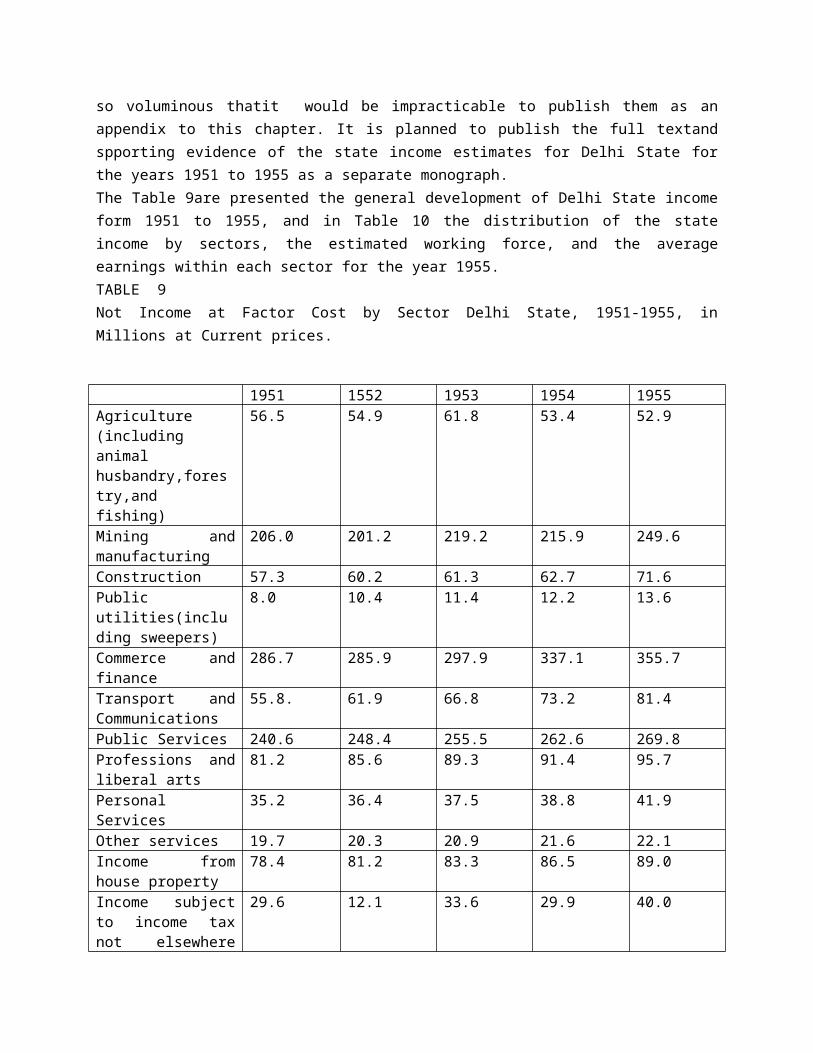
uses would be less than 2% at present. Such economic in land use are possible only if shops are made available in planned shopping centre at different tiers of the resddential units, viz. Convanent shopping, local shopping, community shopping, District shopping and central business district. The commercial area in the Master plan works out to 0.48 acres/1000 population and ratio of commercial to residential area will work out to 1: 8 as aginst 0.59 acres/1000 and a ratio of 1 ; 7.4 existing at present in a rather disorganized manner.
While it is noticed that aboput 205 of the developed area is in streets in most of the divisions, in the OldCity Division there is only 0.88 acres/1000 pop. In roads, as aginst 2.72 acres/1000 in Karol Bagh Division. 3.77 acres/1000 pop. In Civil Lines Division and 7.80 acres/1000 in New Delhi Division. The average for urban Delhi at present is 4.3 acres/1000. With the rationalization of residential density there would be a more equitable distribution of loads on the roads. The Master plan proposalas provide for about 3 acres/1000 population of streets on an average for Urban Delhi, which again is an economy on land and is made possible by careful planning of arterial roads, major roads, neighbourhodd roads and service lades.
Table No.8 showing the distribution of land uses in 1958-59 Urban Delhi shows that only 18.4% of the developed area is under residential use. To this may be added the Rashtrapati Bhawan, the forgien mission residence and the residence in the Cantonment( shown separately which amount to another 9.3%) . These are in afct very low residential areas. This brings up the figure under residential use to 27.7% of the total. Commercial is 2,.5%, industry 1.6% Governemnt office 1.3% and parks, playgrounds and open spaces 5.35. In addition there is about 4.2% in undeveloped area. Public and semi- public usesincluding utilities occupy 12.7%. Transport facilities counted as a separate item including air fields, railway stations, take 6.5% .Agricultural uses including dairies within developed area account for 3.2% , vacant plots and vacant land constitute 13.0%, roads, streets etc. 18.6% and railway tracks occupy 1.7% of the developed area.
For the purpose of comparison of land use data of Delhi with certain other cities, the data for Delhi has been retabulated to include all residential areas like the Rashtrapati Bhawan, 505 of foreign embassies, residential portion of cantonment etc.Similarly Government and embasy offices, transporation facilities ( except Railway facilities ) are brought under public and semi- public use. Railway land and facilities are included under a separate head.
Table No.9 is a comparison of the distribution of land uses in Delhi (1958-59) with the Americasn cities of Detroit, Los Angles and Chicago for which figures are available. This shows that when te vacant land and agricultural area are fully utilized, the percentage of area under residential use in urban Delhi will also reach the 40% mark.
The Master plan in fact visualizes this figure which is an average for cities with a certain degree of planning as compared to cities that have simply grown up.
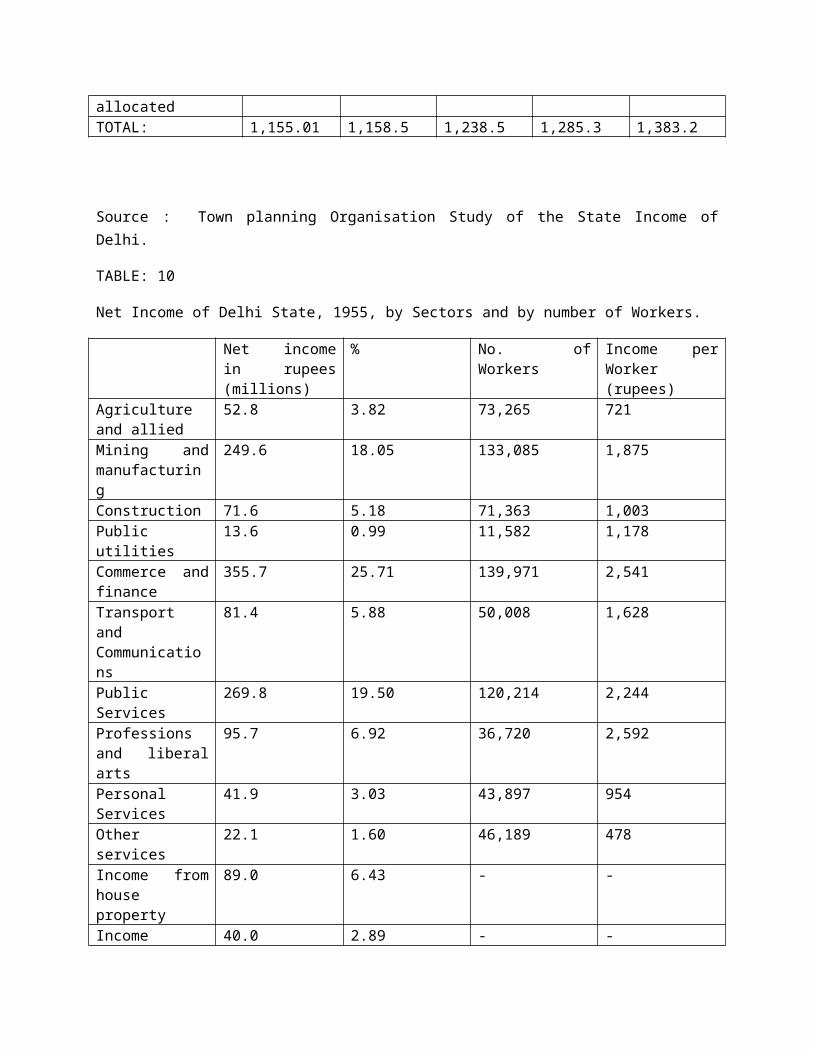
The percentage of areaunder commercial use in Delhi is 2.55 compared to 4 to 6% in the other cities. This is because American cities require a large amount of parking space. In fact, the Master plan visualizes only 1.95 under all commercial uses for Delhi. ( excluding warehousing and mineral sidings) since most of the central business district of Chandhi Chok, Khari Baoli and Sadar Bazaar areas will continue to be used ona pedestrian level. Also, the proposed district shopping centres will have pedestrian precincts with parking on the periphery.
For any city with a balanced economy, the 1.6% of area in industrial usea s in urban Delhi at prevent is too low.The master plan has tired to remdy this position and the area assigned for industrial use is about 5.1% ( excluding mining) which will compare favourably with the American cities under reference here. Delhi has enougharea under parks, playgrounds ,open space and recreationl reservation though of the most of this undeveloped open space at present .Special efforts will haveto be made to preserve these from unauthorized encroachment and to develop more parks as the economy of the city rises and the population grows.The figure under public and semi-public use for Delhi is not of the facilities available . A large portion of this is taken up by land under wireless and radio transmitting stations, publiic utilities etc. Some of the land under utilities is sufficient to serve the population for this next 20 years. The true picture of deficiency in schools,collages,hospitals, other facilities has been given earlier in this chapter.
Table No.10 g ives distribution of population,area under residential use (this include roads upto. 100 wide) and residential densities in the Master plan upto 1981.The residential area of 47,360 acresConstitutes 42.9% of the compact urban limits. This can house a population of about 46 lakhs at an average gross residential density of about 97 persons per acre. It is estimated that an additional 50, 000 persons will have live in commercial areas and about 100,000 in the cantonment areas.
Table No.11 gives the distribution of the land uses for 1981 and the major breakdown is as follows :-
LAND USE TOTAL AREA ACRES % OF TOTAL1. Residetial 47,360 42.9 2. Major Commercial (including
Warehousing and mineral siding) 2,563 2.3
3. Inustrial(including mining) 6,016 5.4 4. Government 8,163 7.4
Recreation 26,152 23.75. Public and semi-public 8,857 8.0 6. Agricultural(nurseries) 294 0.37. Treansportion facilities (excluding 2,604 2.4
Railway facilities)8. Raods 150 widea nd moreand nallas 5,960 5.3 9. Railway Land (including stations
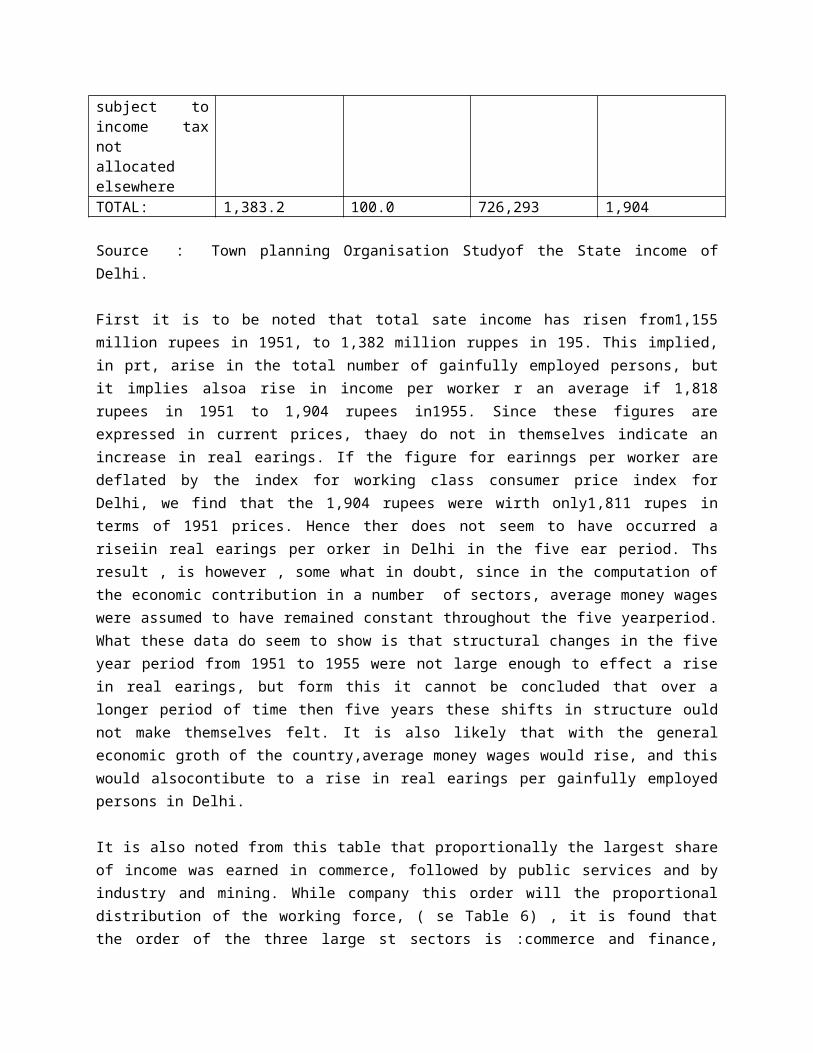
Yards and tracks), 2,518 2.3 Total 1,10487 100.0 LAND USE SURVEY Structural Cndition Count (1958-59) urban Delhi.
Planing division
GoodNumber
% FairNumber
% PoorNumber
% TotalNumber
%
A 1955 60. 12379 38.3 18042 55.7 32376 100.0B 3781 20.5 10059 54.7 4560 24.8 18400 100.0C 2534 23.8 5240 49.2 2880 27.0 10654 100.0D 5266 41.2 6218 48.7 1285 10.1 12769 100.0E 451 17.5 1452 56.5 669 26.0 2572 100.0F 505 44.8 440 39.2 180 16.0 1123 100.0G 1072 35.0 1658 54.1 335 10.9 3065 100.0H 3 13.6 12 54.6 7 31.8 22 100.0TOTAL 15565 19.2 37458 46.3 27958 34.5 80981 100.0