wbcsd mobility for development
TRANSCRIPT

Mobility for Development
Introduction of the WBCSD Sustainable Mobility context Mobility for Development (M4D) project
– Dialogues and case studies
– Lessons learned and barriers to progress
– Key messages
– Advocacy and outreach
Contents
2

Introduction of the WBCSD Sustainable Mobility context Mobility for Development (M4D) project
– Dialogues and case studies
– Lessons learned and barriers to progress
– Key messages
– Advocacy and outreach
Contents
3

What is the WBCSD?
A CEO-led coalition of some 200 companies with a shared commitment to Sustainable Development via the three pillars of
economic growth, ecological balance and social progress.

WBCSD Regional Network
5

WBCSD areas of work
6
Eco Patent Commons
Urban Infrastructure
Eco Patent Commons
Urban Infrastructure
Water
Energy Efficiency in Buildings
Cement
Chemicals
Electricity Utilities
Forest Products
Maritime
Mining
Mobility
Tires

Mobility journey at the WBCSD
7
M4D Final Report
Sustainable Mobility 2030
Report
M4D Facts & Trends
2000-2004 2007 2007-2009 2009
Dialogues & Case Studies
Bangalore
Dar-es Salaam
Shanghai
São Paulo
Mobility for Development Project

Introduction of the WBCSD Sustainable Mobility context Mobility for Development (M4D) project
– Dialogues and case studies
– Lessons learned and barriers to progress
– Key messages
– Advocacy and outreach
Contents
8
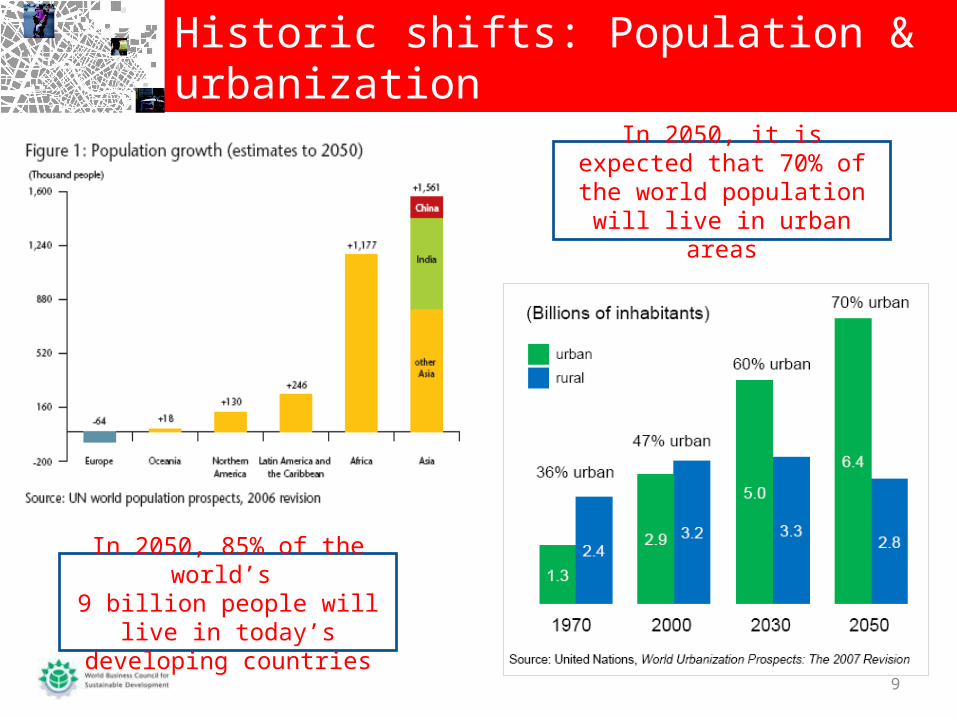
Historic shifts: Population & urbanization
9
In 2050, 85% of the world’s 9 billion people will live in
today’s developing countries
In 2050, it is expected that 70% of the world population
will live in urban areas

State of mobility: Transport activity
10
Per capita transport activity
North Americans • travel: average of 40 miles/day (car and plane)• emit: 6 tonnes of transport-related CO2 a year
Brazilians • travel: average of 7 miles/day (car and bus) • emit: 0.7 tonnes of transport-related CO2 a year
Tanzanians • travel: average of 3 miles/day (foot, bus and bicycle)• emit: 0. 1 tonnes of transport-related CO2 a year
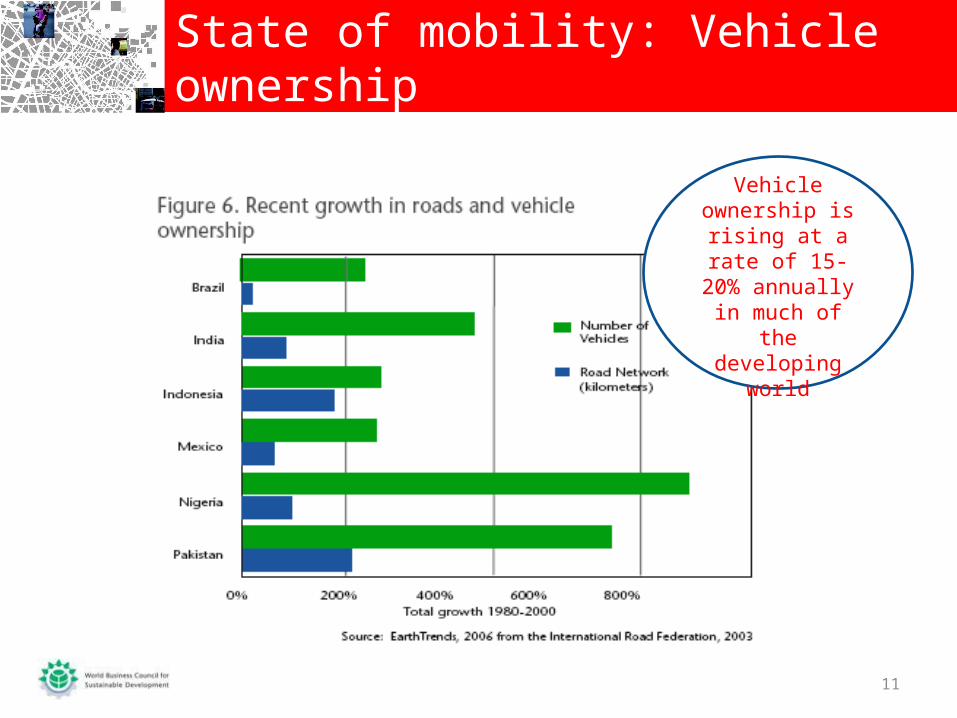
State of mobility: Vehicle ownership
11
Vehicle ownership is
rising at a rate of 15-20% annually
in much of the developing world
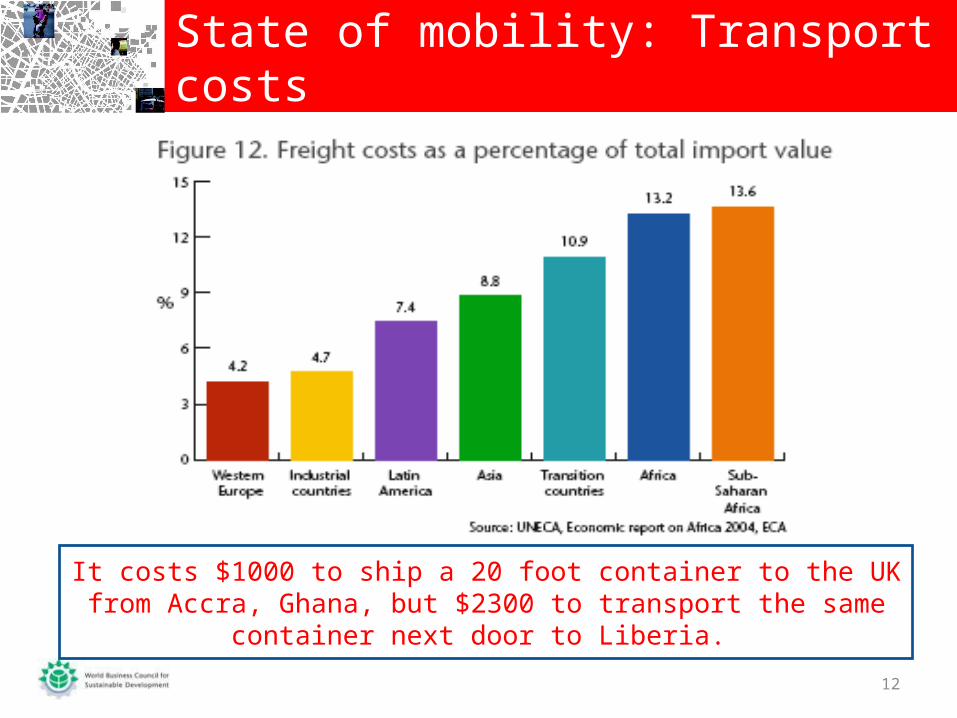
State of mobility: Transport costs
12
It costs $1000 to ship a 20 foot container to the UK from Accra, Ghana, but $2300 to transport the same container next door to Liberia.

State of mobility: Road safety
13
Around 1.2 million people are killed and 50 million injured in
road accidents, most of them in developing
countries
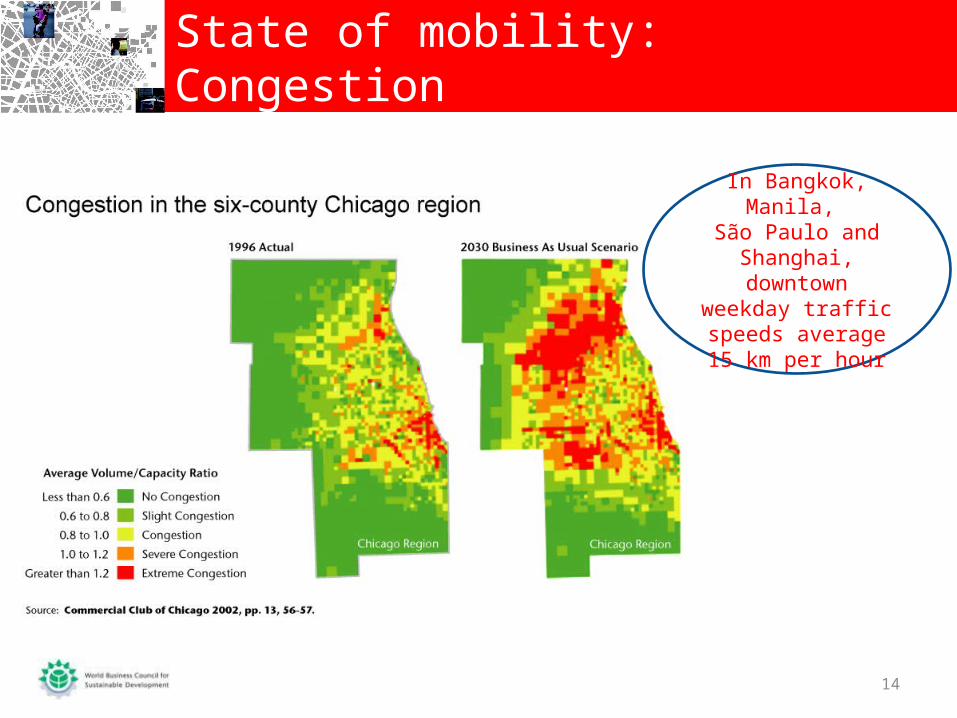
State of mobility: Congestion
14
In Bangkok, Manila, São Paulo and
Shanghai, downtown weekday traffic
speeds average 15 km per hour

State of mobility: Energy consumption
15
Transportation uses ½ of the world’s petroleum production and produces 20% of GHG emissions
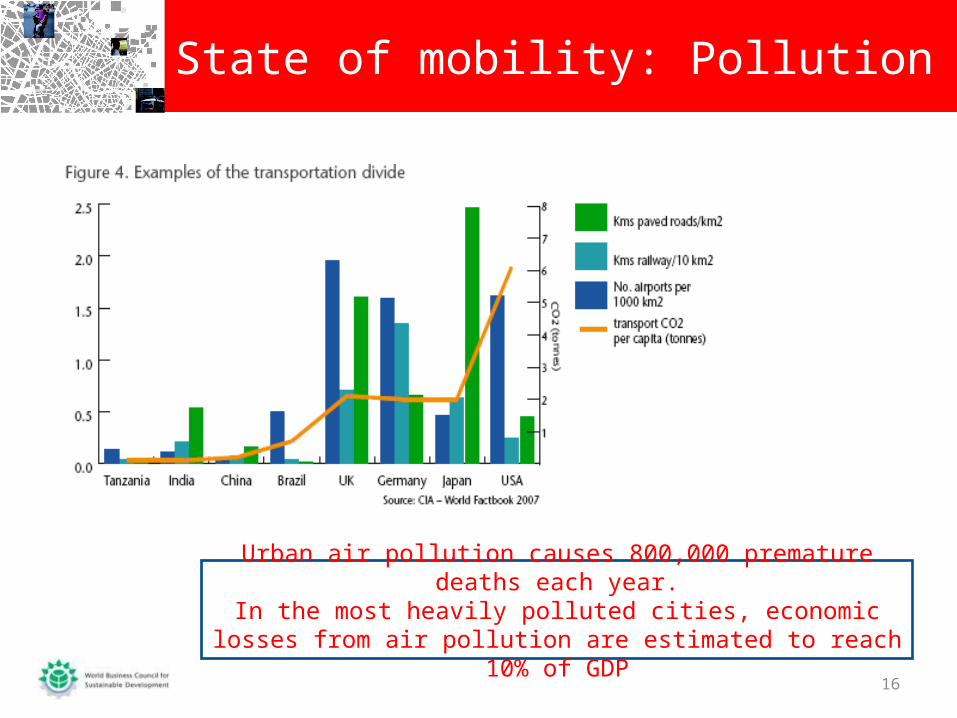
State of mobility: Pollution
16
Urban air pollution causes 800,000 premature deaths each year.In the most heavily polluted cities, economic losses from air
pollution are estimated to reach 10% of GDP

Sustainability Mobility 2030 concluded:
“Today’s system of mobility is not sustainable. Nor is it likely to become so if present trends
continue.”
Outlook
17
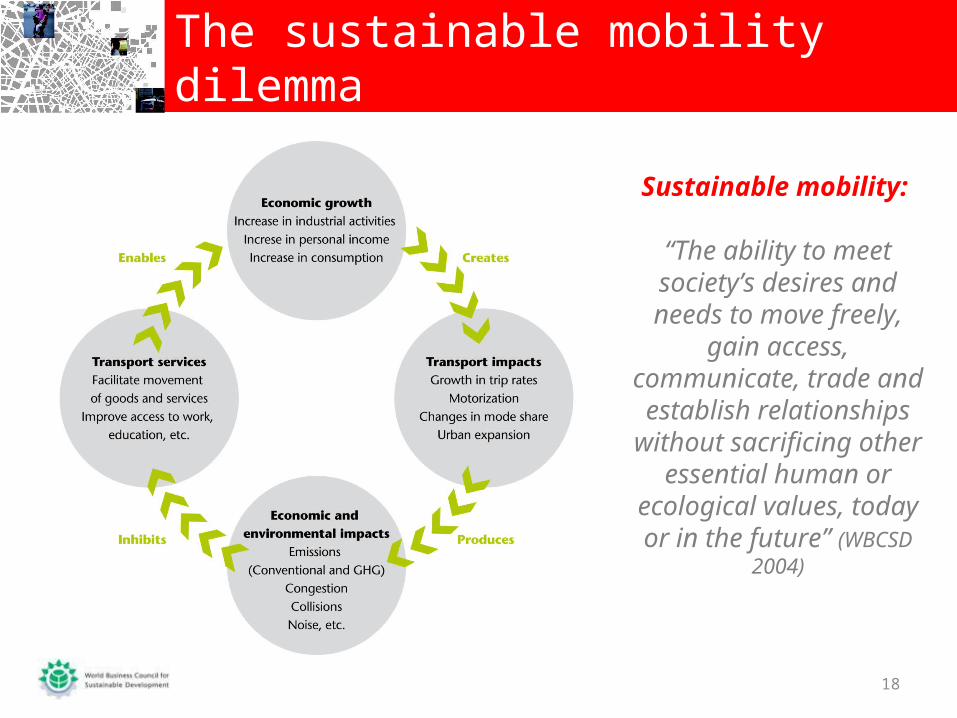
The sustainable mobility dilemma
18
Sustainable mobility:
“The ability to meet society’s desires and needs to move freely,
gain access, communicate, trade and establish relationships
without sacrificing other essential human or
ecological values, today or in the future” (WBCSD
2004)
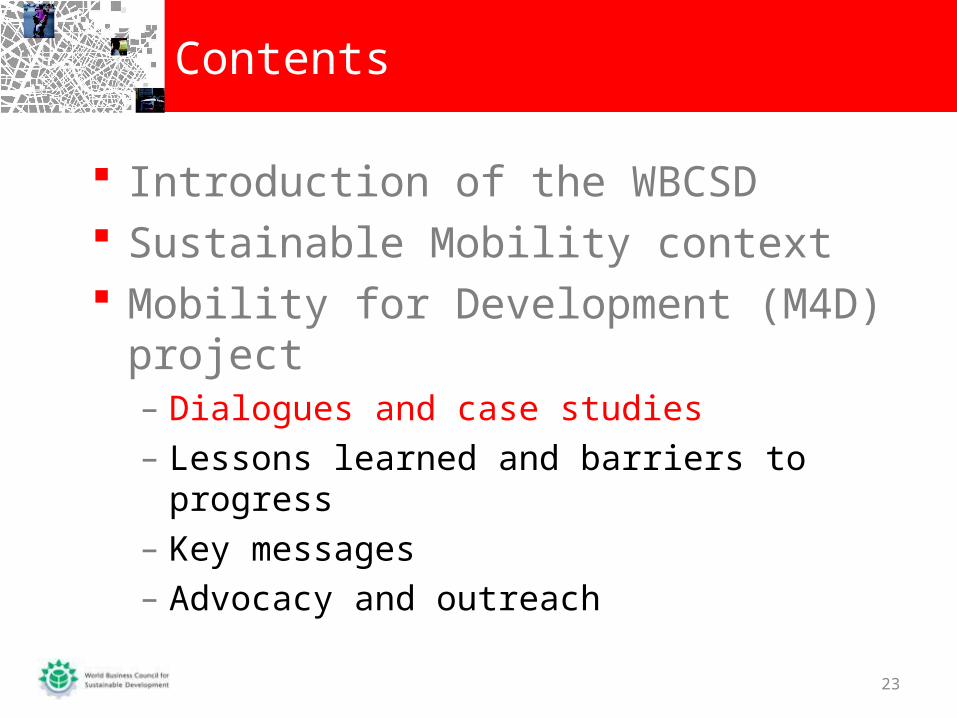
Introduction of the WBCSD Sustainable Mobility context Mobility for Development (M4D) project
– Dialogues and case studies
– Lessons learned and barriers to progress
– Key messages
– Advocacy and outreach
Contents
19

Mobility is an enabler for economic development
Lack of access to transportation and information are symptoms of poverty
The Mobility Divide is widening in and between countries
There are business opportunities in helping narrow the divide: new products and services to enable access to sustainable transport systems and means of communication
The “Mobility Divide”
20
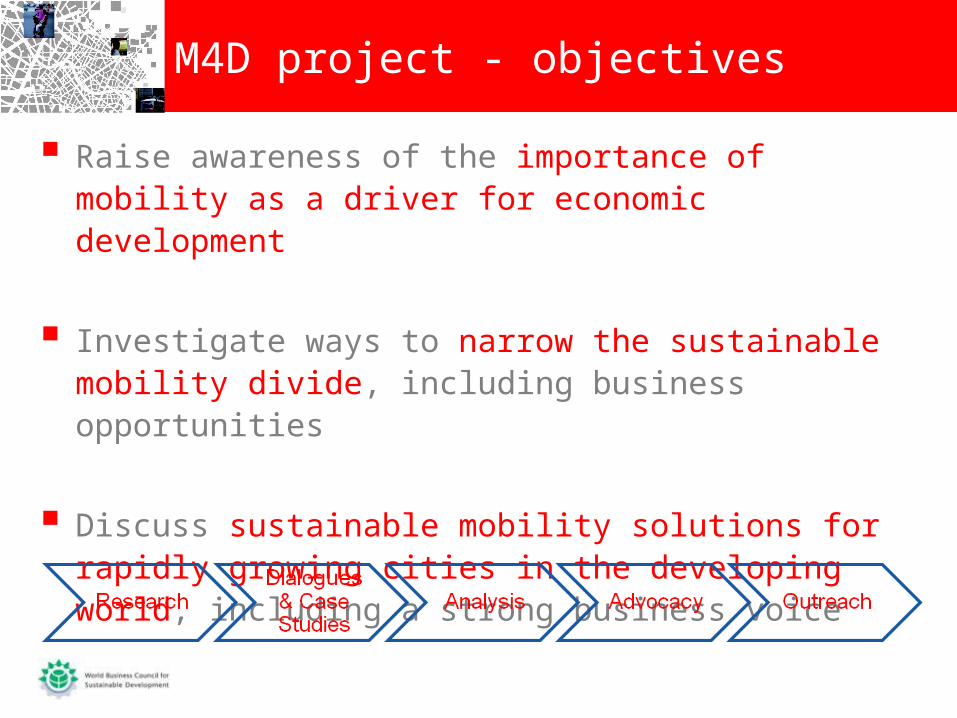
M4D project - objectives
Raise awareness of the importance of mobility as a driver for economic development
Investigate ways to narrow the sustainable mobility divide, including business opportunities
Discuss sustainable mobility solutions for rapidly growing cities in the developing world, including a strong business voice

Global context Mobility challenges in four cities:
Bangalore Dar es Salaam São Paulo Shanghai
Lessons and barriers to progress Key messages to stakeholders
Mobility for Development final report
22
Introduction of the WBCSD Sustainable Mobility context Mobility for Development (M4D) project
– Dialogues and case studies
– Lessons learned and barriers to progress
– Key messages
– Advocacy and outreach
Contents
23
Dialogues and case studies
24
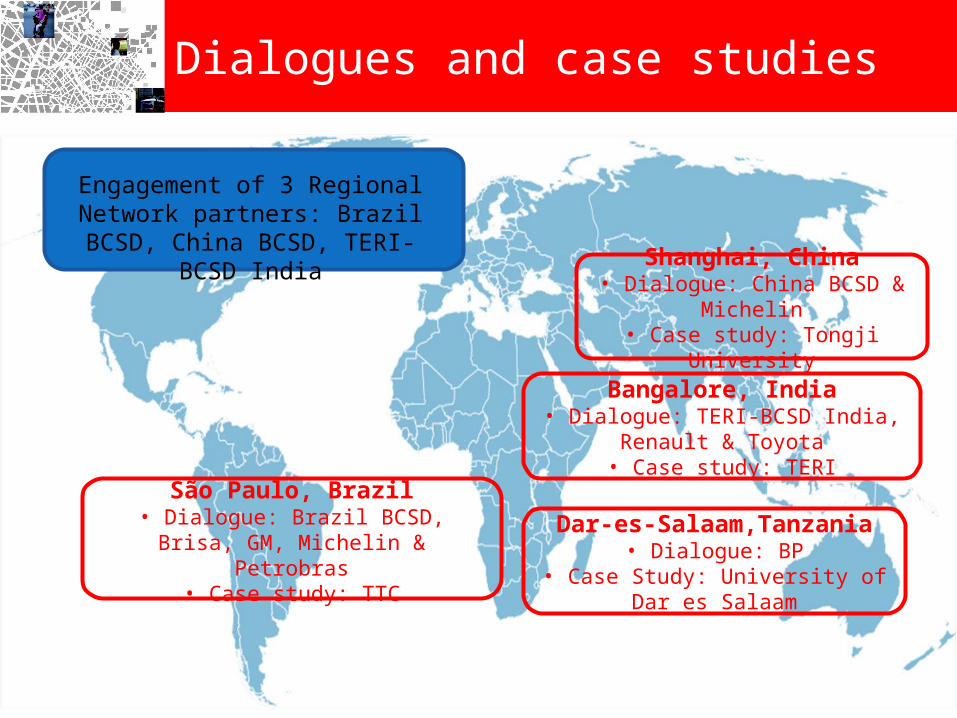
Dar-es-Salaam,Tanzania• Dialogue: BP
• Case Study: University of Dar es Salaam
Bangalore, India• Dialogue: TERI-BCSD India, Renault
& Toyota• Case study: TERI
Shanghai, China• Dialogue: China BCSD &
Michelin• Case study: Tongji University
São Paulo, Brazil• Dialogue: Brazil BCSD, Brisa, GM,
Michelin & Petrobras• Case study: TTC
Engagement of 3 Regional Network partners: Brazil BCSD, China BCSD, TERI-BCSD India

Snapshot of the four cities
25
Bangalore• Increasingly dispersed city; strong IT industry• Majority of travel by bus (41%)
Challenges• Aging infrastructure – cannot meet demands• Long travel and wait times
Solutions• Introducing bus rapid transport and intelligent transport systems to reduce congestion and accidents
Dar es Salaam• Growth of unplanned settlements; high unemployment• Most of public transport provided by privately operated minibuses (dala dalas)
Challenges• Lack of paved and all weather roads• Road accidents; vulnerable travelers
Solutions• Plans for high capacity modern bus system• Driver education and regulatory enforcement
São Paulo• Dense city; most growth on periphery• High income inequality
Challenges• Congestion due to increase in vehicle ownership• Personal safety and security• Affordability of public transport for poor residents
Solutions• Ban 20% of fleet from circulating each day of the week• Emission limits and fast lane bus system
Shanghai• Rapid economic growth; urban migration• Majority of travel by bus (41%)
Challenges• Major increase in car ownership• Lack of high speed rail options for short distances• Stretch on energy resources
Solutions• Metro system; emission limits and parking charges

Bangalore – mobility snapshot
26
Public and paratransit transport:
Bus travel makes up 41% of all travel
Vehicle ownership:
Automobiles: 40 per 1,000 people
Motorcycles: 204 per 1,000 people
Expenditure on transport:
The poor spend15-25% of income on travel per month
Public transport basic fares:
Bus: US$ 0.004 - 0.4
non-motorized = 18%
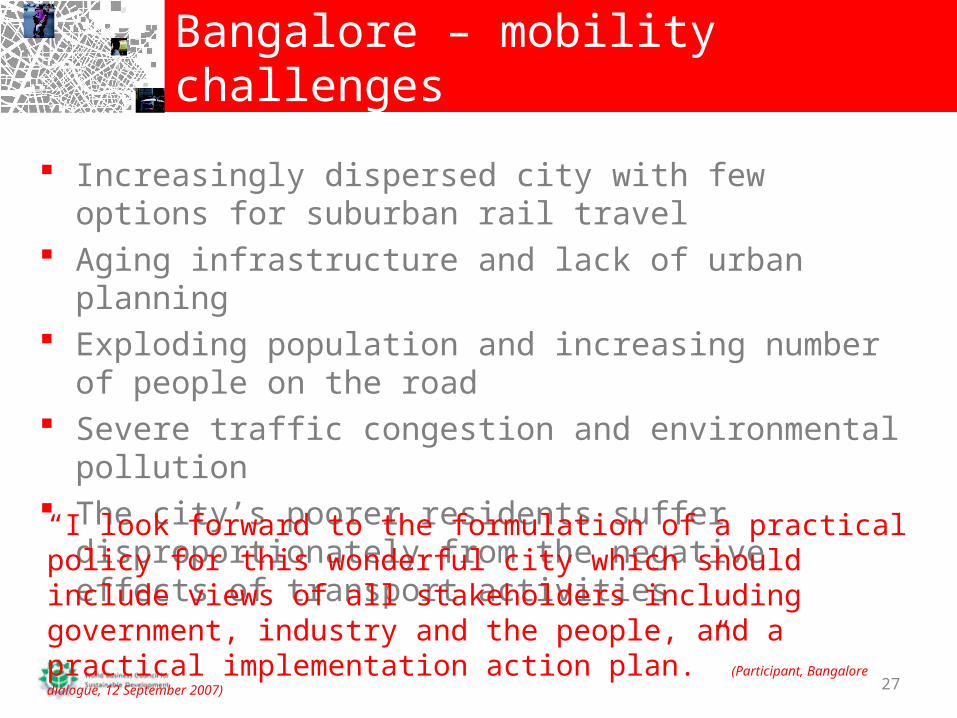
Increasingly dispersed city with few options for suburban rail travel
Aging infrastructure and lack of urban planning Exploding population and increasing number of people on
the road Severe traffic congestion and environmental pollution The city’s poorer residents suffer disproportionately from
the negative effects of transport activities
Bangalore – mobility challenges
27
“I look forward to the formulation of a practical policy for this wonderful city which should include views of all stakeholders including government, industry and the people, and a practical implementation action plan.” (Participant, Bangalore dialogue, 12 September 2007)

Bangalore – towards solutions
28
Infrastructure development: Public transport
improvement Intelligent transportation
system Pollution control
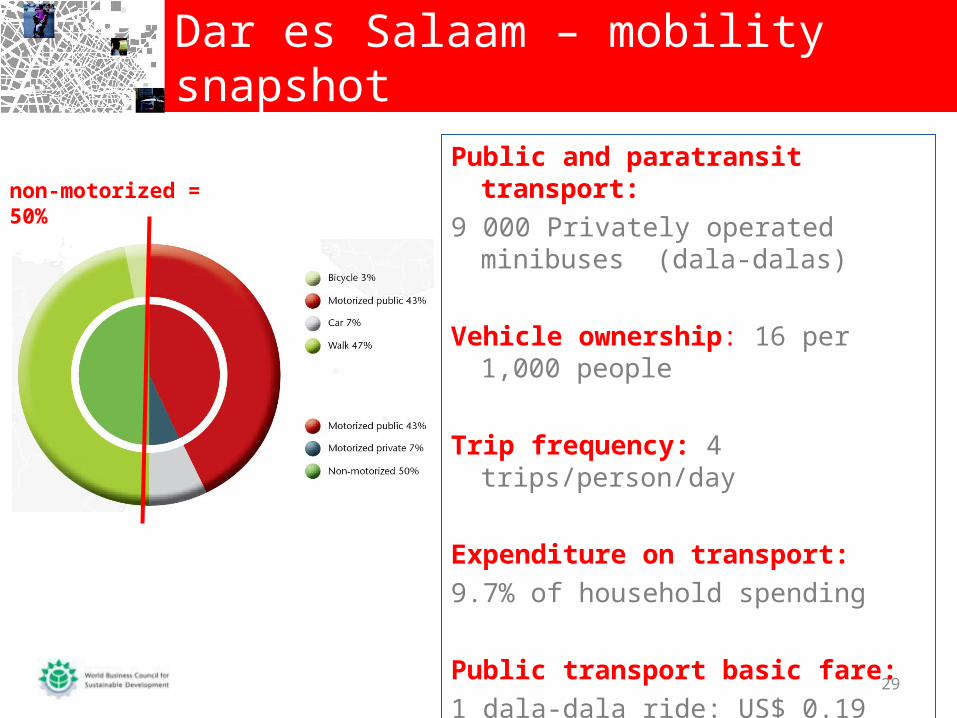
Dar es Salaam – mobility snapshot
29
Public and paratransit transport:
9 000 Privately operated minibuses (dala-dalas)
Vehicle ownership: 16 per 1,000 people
Trip frequency: 4 trips/person/day
Expenditure on transport:
9.7% of household spending
Public transport basic fare:
1 dala-dala ride: US$ 0.19
non-motorized = 50%
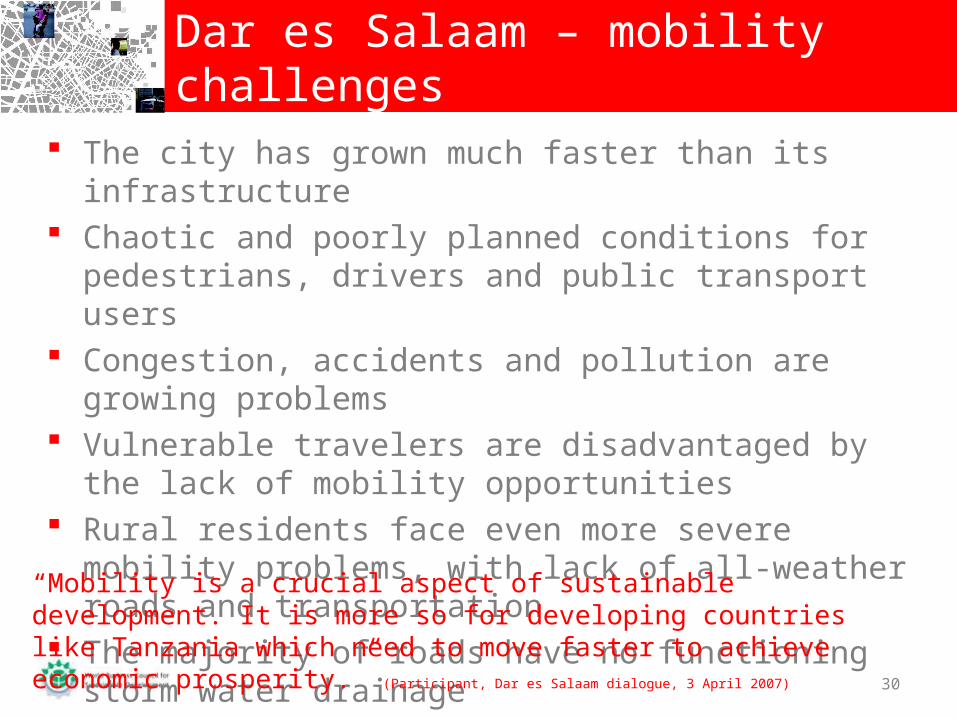
Dar es Salaam – mobility challenges
30
The city has grown much faster than its infrastructure Chaotic and poorly planned conditions for pedestrians,
drivers and public transport users Congestion, accidents and pollution are growing problems Vulnerable travelers are disadvantaged by the lack of
mobility opportunities Rural residents face even more severe mobility problems,
with lack of all-weather roads and transportation The majority of roads have no functioning storm water
drainage“Mobility is a crucial aspect of sustainable development. It is more so for developing countries like Tanzania which need to move faster to achieve economic prosperity.” (Participant, Dar es Salaam dialogue, 3 April 2007)

National infrastructure improvements
City planning Public transport
improvements Education & regulatory
enforcement Greater coordination
among institutions towards an integrated approach
Dar es Salaam – towards solutions
31

São Paulo – mobility snapshot
32
Public and paratransit transport: 32% of travel is by motorized private transport means and 37% of travel is by foot
Vehicle ownership:Automobile: 314 per 1 000 people
Trip frequency: 2.1 trips/days/person
Public transport basic fare: Metro or Bus: US$ 1.3
non-
mot
oriz
ed =
38%
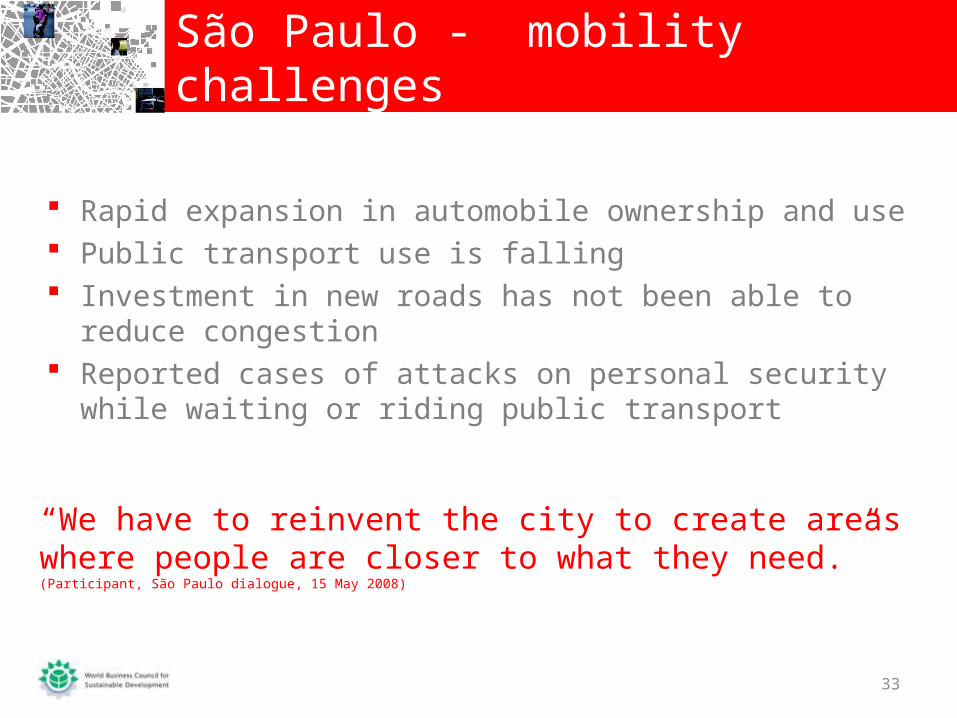
Rapid expansion in automobile ownership and use Public transport use is falling Investment in new roads has not been able to reduce
congestion Reported cases of attacks on personal security while
waiting or riding public transport
São Paulo - mobility challenges
33
“We have to reinvent the city to create areas where people are closer to what they need.” (Participant, São Paulo dialogue, 15 May 2008)
São Paulo – towards solutions
34
Cleaner fuels and vehicles Cutting congestion Private investment in
infrastructure through private-public partnerships
Improving public-transport Growth Acceleration Plan

Shanghai – mobility snapshot
35
Public and paratransit transport:5 metro lines with plans for 6 more lines by 2010. 25% of travel is by bike
Vehicle ownership:Automobile: 39 per 1 000 people
Expenditure on transport: 15.8% of total expenditure compared with 3% in 1990
Public transport basic fares: Bus: US$ 0.3; Metro: US$ 0.4
non-motorized = 56%

Poorest sectors pay the greatest price and receive the least benefit from Shanghai’s urban development
The city is in danger of having the world’s biggest traffic jams, worst air pollution and most dangerous roads
Limited rail capacity Stretch on transport governance capacity Stretch on fuel resources
Shanghai – mobility challenges
36
“Many of the issues related to land use and transport integration in Shanghai are similar to the rest of China. There is a feeling that if this can be solved in Shanghai, the outlook for sustainable mobility in other urban cities in China may also improve.”(Participant, Shanghai dialogue, 14 November 2007)

Shanghai – towards solutions
37
Infrastructure development and planning
Governing for mobility Transport demand
management Environmental controls
Introduction of the WBCSD Sustainable Mobility context Mobility for Development (M4D) project
– Dialogues and case studies
– Lessons learned and barriers to progress
– Key messages
– Advocacy and outreach
Contents
38
Improvement in the range of mobility opportunities available to the general public
Widening mobility divide between rich and poor
Major problems with traffic congestion
Growing transport-related health and safety risks
Cities promote public transport yet they struggle to adapt and meet the needs and lifestyles of residents
Lessons learned from the four cities
39
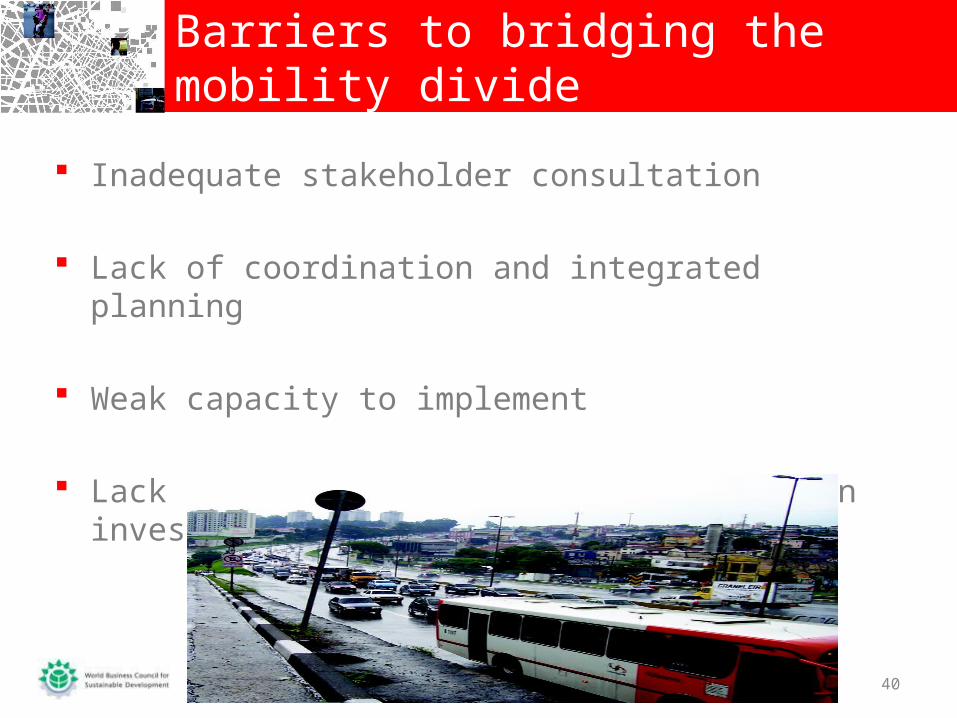
Inadequate stakeholder consultation
Lack of coordination and integrated planning
Weak capacity to implement
Lack of capacity to finance and maintain investments
Barriers to bridging the mobility divide
40

Introduction of the WBCSD Sustainable Mobility context Mobility for Development (M4D) project
– Dialogues and case studies
– Lessons learned and barriers to progress
– Key messages
– Advocacy and outreach
Contents
41

Provide innovative products and services that create value for an expanding number of customers
Reduce the mobility related impacts of own operations
Engage with other stakeholders from the earliest stage of mass-motorization
Educate, empower and incentivize
Key messages for business
42

Key messages for government
43
Take an integrated and inclusive approach to urban land use and transport planning
Ensure mechanisms for stakeholder education and collaboration
Align incentives with goals for sustainability and encourage individuals to make safer, more efficient and less environmentally damaging transport and travel choices
Build effective capacity to implement national and regional policies, regulations and urban plans
Learn from other cities

Introduction of the WBCSD Sustainable Mobility context Mobility for Development (M4D) project
– Dialogues and case studies
– Lessons learned and barriers to progress
– Key messages
– Advocacy and outreach
Contents
44
Reports and case studies available on the website
http://www.wbcsd.org/web/m4d.htm
Montly Sustainable Mobility e-newsletter
Executive summary translated into Japanese, Chinese and Portuguese
Launch events 2009-2010: Brazil, Portugal, Washington D.C., India, China and Tanzania
WBCSD initiative on Urban Infrastructure
Advocacy and outreach
45

www.wbcsd.org/web/m4dev.htm