water-surface elevations and … fili grima gloin gimli eowyn istari ioreth gorbag gollum gaffer...
TRANSCRIPT
forn
fili
grima
gloin
gimli
eowyn
istari
ioreth
gorbag
gollum
gaffer
larwain
imrahil
hobbits
hamfast
gwaihir
gothmoggilbert
gandalf
faramir
estelle
harfoots
haradrim
greyhame
evanstar
halflings
grishnakh
ferneybill
fallohides
frodo
gildor
goldberry
galadriel
glorfindel
E 56
V 445
U 445
T 445
K 507
2815 = 2812
L 507
40
41
42
43
44
45
46
47
48
49
49.5
50
53
54
55
56
59
58
57
60
61
62
63
65
64
66
67
68
69
70
71
72
73
74
75
76
77
78
79
80
81
82
51
52
MAP SEGMENT 2
N
B
B'
A
A'
93
93
200
93
93
Red bridge
12388000
RavalliJocko
River
Valle
y
Cre
ek
Spring
CreekJocko
River
Southbridge
200
200
200
Looking upstream at railroad bridge at cross section 42 fromcross section 41 (Highway 200).
Looking downstream at South bridge at cross section 78.
Figure 4. Cross section 63, which is typical of narrowchannel and flood-plain conditions in Reach 6 alongthe Jocko River, western Montana.
(existing and hypothetical conditions)
(existing and hypothetical conditions)
0 200 400100 3002,743
2,757
ELEV
ATIO
N,I
NFE
ET(N
AVD
88)
Ground surface
DISTANCE FROM LEFT EDGE, IN FEET
Mai
nch
anne
l
2,745
2,749
2,747
2,751
2,753
2,755
CALCULATED WATER SURFACE FOR 500-YEARFLOOD DISCHARGE
CALCULATED WATER SURFACE FOR 100-YEARFLOOD DISCHARGE
EXPLANATION
1,200 1,400 1,600 1,800 2,000 2,200 2,4001,000
Figure 5. Cross section 77, which is typical of wide flood-plain conditions and multiple channels in Reach 6 along the Jocko River, western Montana.
2,830
2,836
2,840
ELEV
ATIO
N,I
NFE
ET(N
AVD
88)
1,100 1,300 1,500 1,700 1,900 2,100 2,300
Ground surface
DISTANCE FROM LEFT EDGE, IN FEET
Mea
nder
chan
nel
Mai
nch
anne
l
(existing and hypothetical conditions)
(existing and hypothetical conditions)CALCULATED WATER SURFACE FOR 500-YEARFLOOD DISCHARGE
CALCULATED WATER SURFACE FOR 100-YEARFLOOD DISCHARGE
2,838
2,834
2,832
450 550 650 750 850 950 1,050 1,150 1,250 1,350 1,450 1,550 1,650 1,750 1,8502,832
2,834
2,836
2,838
2,840
2,842
2,844
1,950
DISTANCE FROM LEFT EDGE, IN FEET
ELEV
ATIO
N,I
NFE
ET(N
AVD
88)
Ground surface
Figure 6. Cross section 78US (not shown on Map segment 2), which shows the upstream side of South bridge in Reach 6 along the Jocko River, western Montana.The 100-year and 500-year flood discharges can overtop the road on both the left and right banks.
Southbridge
Mai
nch
anne
l
(existing and hypothetical conditions)
(existing and hypothetical conditions)CALCULATED WATER SURFACE FOR 500-YEARFLOOD DISCHARGE
CALCULATED WATER SURFACE FOR 100-YEARFLOOD DISCHARGE
RoadRoad
20
27
R.21W.T.18N.
T.17N.T.16N.
1 6
36
6
36 31
DIAGRAM SHOWING RELATIVEPOSITION OF MAP SEGMENTS
AND MATCHLINES ALONGTHE JOCKO RIVER
A
A'
B
B'
EXPLANATION
JOCKO RIVER STUDY AREA
A A' MATCHLINE--Line separatingMap segments 1-3
1 MAP SEGMENT NUMBER--Redsegment number representssegments shown on this sheet
R.20W.
T.17N.T.18N.
R.20W.
R.20W. R.19W.
7 8 9
18 16
22 23
29 28 25 30 29
34 35 32 33
45
97
18 17 16 15
20 22
28 26
34
3
11 12 7
2
1
3
11'
47 15'
114 15'o 14'
13' 12' 11'
114 10'o
16'17'18'
09'
08'
07'
06'
05' 04'
19'
18'
17'
16'
o
14'
13'
12'
21
17
26
8
21
27
35
2
WATER-SURFACE ELEVATIONS AND BOUNDARIES OF THE 100-YEAR AND 500-YEAR FLOODS AND FLOODWAY FOR THE JOCKO RIVER, WESTERN MONTANA
SCIENTIFIC INVESTIGATIONS MAP 2912(Sheet 2 of 3)
Chase and Parrett, 2006, Water-surface elevations and boundaries of the100-year and 500-year floods and floodway for the Jocko River, western Montana
U.S. DEPARTMENT OF THE INTERIORU.S. GEOLOGICAL SURVEY
ByKatherine J. Chase and Charles Parrett
Aerial-photographic base (scanned) from Water Consulting, Inc.,for the Confederated Salish and Kootenai Tribes of the FlatheadNation, 1:3,600, 2002. Imagery flown by MAP, Inc. Lambert ConformalConic Projection State Plane Coordinate System (SPCS) Standard parallels45 00' and 49 00'; central meridian -109 30'. North American Datum of 1983(NAD 83)
00 0
Streambed
1
ELEV
ATIO
N,I
NFE
ET(N
AVD
88)
17.01
23
27
93
112
DISTANCE, IN FEET
2,500
2,600
2,700
2,800
2,900
3,000
3,100
0 5,000 10,000 15,000 20,000 25,000 30,000 35,000 40,000 45,000 50,000 55,000 60,000 65,000 70,000 75,000 80,000 85,000 90,000 95,000 100,000 105,000
Reach 1 Reach 2, 3 Reach 4 Reach 5 Reach 6 Reach 7 Reach 8
DISTANCE, IN FEET
Streambed
2,600
2,620
2,640
2,660
2,680
ELEV
ATIO
N,I
NFE
ET(N
AVD
88)
29
Reach 5 (Map segment 1)
30,000
28
30 3132
33
34
Streambed
2,920
2,940
2,960
2,980
3,000
ELEV
ATIO
N,I
NFE
ET(N
AVD
88)
DISTANCE, IN FEET
Reach 7 (Map segment 3)
90,000
93
9292.01
Reach 1
Reach 6 (selected subreach)
Reach 2, 3
Reach 8
Reach 7
Reach 5
Reach 4
65
74
OldHighway 93bridge
Streambed3,000
3,020
3,040
3,060
3,080
ELEV
ATIO
N,I
NFE
ET(N
AVD
88)
DISTANCE, IN FEET
Reach 8 (Map segment 3)
95,000
103US103DS
100,0002,940
2,960
2,980
94 9596
9798
99100
101
112
111
110
109
108
107
106
105DS
105US
105
103104
102.02
102.01
102
Highway 93bridge
Streambed
2,720
2,740
2,760
2,780
2,800
ELEV
ATIO
N,I
NFE
ET(N
AVD
88)
DISTANCE, IN FEET
Reach 6 (selected subreach, Map segment 2)
55,000
68
66
68.0167
66DS66US
65
7170.02
70.01
68.0269 70
60,000
71.0271.01
72
73
74
Redbridge
Railroad bridge
South bridge
100-year estimated flood discharge
500-year estimated flood discharge
EXPLANATION
112 LOCATION OF CROSS SECTION AND NUMBER--Red cross section symbol represents cross section insplit-flow reach. Blue cross section symbol representsbridge or interpolated cross section not shown on mapsegments
MAIN CHANNEL FLOOD PROFILE FOR EXISTINGCONDITION (1999-2001)
Railroadbridge BRIDGE AND NAME
Streambed
2,500
2,520
2,540
2,560
2,580
0 5,000 10,000
ELEV
ATIO
N,I
NFE
ET(N
AVD
88)
DISTANCE, IN FEET
1 34 52DS 2US
2
10
6
11
978
9DS9US
17.01
1715
1413
1216
16DS16US
6DS6US
Reach 1 (Map segment 1) Railroad bridge
Railroadbridge
HighwaybridgeRailroad
bridge
GRAPHS SHOWING FLOOD PROFILES, STREAMBED ELEVATIONS, AND LOCATIONS OF REACHES, CROSS SECTIONS, AND BRIDGES ALONG THE JOCKO RIVER
17.02
24
Streambed
2,540
2,560
2,580
2,600
2,620
15,000
ELEV
ATIO
N,I
NFE
ET(N
AVD
88)
DISTANCE, IN FEET
17.02 17.03 17.0418
1920
2122
23
Reach 2, 3 (Map segment 1)
Streambed
2,560
2,580
2,600
2,620
2,640
20,000
ELEV
ATIO
N,I
NFE
ET(N
AVD
88)
DISTANCE, IN FEET
24
Reach 4 (Map segment 1)
25,000
25
2627
28
34
9294
93
Finley Creek confluence
Valley Creek confluence
Valley Creek confluence
Finley Creek confluence
70.02
20,000
0 1 MILE0.25 0.50 0.75
SCALE 1:12,000
0 1 KILOMETER0.25 0.50 0.75
0 1,000 METERS250 500 750
0 5,000 FEET1,000 2,000 3,000 4,000
Printed on recycled paper
40 38.62 2,673.2 2,679.8 2,679.5 2,680.6 2,680.141 39.89 2,675.7 2,685.6 2,685.6 2,687.3 2,687.342 39.99 2,676.2 2,685.9 2,686.1 2,687.7 2,688.042 DS 2 39.99 2,676.2 2,685.9 2,686.1 2,687.6 2,687.942 US 2 40.01 2,676.2 2,686.5 2,686.3 2,688.4 2,688.043 40.18 2,680.1 2,687.0 2,687.1 2,689.1 2,689.244 41.01 2,684.5 2,693.0 2,693.0 2,693.7 2,693.745 42.39 2,691.6 2,699.5 2,699.5 2,700.7 2,700.646 43.41 2,697.4 2,705.2 2,705.4 2,706.6 2,706.447 44.51 2,703.7 2,711.2 2,710.9 2,712.4 2,712.248 45.80 2,709.5 2,716.5 2,715.9 2,717.6 2,717.049 46.75 2,712.9 2,719.6 2,719.5 2,721.0 2,720.549.5 47.26 2,716.9 2,723.7 2,722.8 2,725.0 2,724.350 47.86 2,717.9 2,727.2 2,726.4 2,728.7 2,728.051 48.18 2,719.7 2,728.3 2,727.1 2,729.9 2,728.852 48.52 2,720.3 2,730.6 2,730.6 2,733.0 2,733.253 48.82 2,723.7 2,731.6 2,731.6 2,734.0 2,734.154 49.25 2,727.2 2,734.0 2,734.0 2,736.0 2,736.055 49.88 2,727.2 2,738.7 2,738.7 2,741.1 2,741.156 50.47 2,732.1 2,740.3 2,740.3 2,742.3 2,742.357 50.74 2,732.2 2,741.0 2,741.0 2,742.8 2,742.858 51.06 2,734.5 2,742.0 2,742.0 2,743.8 2,743.859 51.46 2,736.5 2,742.7 2,743.1 2,744.2 2,744.760 51.94 2,738.1 2,745.7 2,745.9 2,746.9 2,747.261 52.63 2,741.0 2,748.1 2,748.1 2,749.3 2,749.462 53.21 2,742.1 2,749.8 2,749.8 2,751.2 2,751.263 53.49 2,743.5 2,750.6 2,750.6 2,752.0 2,752.064 53.89 2,744.5 2,752.1 2,752.0 2,753.5 2,753.465 54.38 2,744.2 2,753.2 2,753.4 2,754.5 2,754.966 54.90 2,746.4 2,755.1 2,755.0 2,756.7 2,756.666 DS 2 54.90 2,746.4 2,755.1 2,755.0 2,756.7 2,756.666 US 2 54.92 2,746.4 2,755.2 2,755.1 2,756.9 2,756.967 55.28 2,747.4 2,757.1 2,757.1 2,759.7 2,759.768 56.04 2,752.1 2,758.0 2,758.0 2,760.3 2,760.369 57.16 2,754.3 2,762.7 2,762.7 2,763.9 2,763.970 58.06 2,758.0 2,763.7 2,763.7 2,764.6 2,764.671 59.66 2,769.5 2,773.6 2,773.6 2,773.9 2,773.972 61.29 2,777.9 2,782.9 2,782.9 2,783.7 2,783.773 63.32 2,784.0 2,788.8 2,788.8 2,789.6 2,789.674 64.97 2,793.4 2,797.5 2,797.5 2,797.8 2,797.875 67.72 2,808.8 2,814.6 2,814.6 2,815.3 2,815.276 69.94 2,818.1 2,823.7 2,823.6 2,825.0 2,825.077 72.13 2,832.4 2,837.5 2,837.4 2,8 37.8 2,837.778 72.49 2,832.8 2,839.5 2,839.4 2,840.9 2,840.778 DS 2 72.49 2,832.8 2,839.6 2,839.4 2,840.9 2,840.978 US 2 72.51 2,832.8 2,840.3 2,840.3 2,840.9 2,840.979 72.75 2,832.1 2,841.4 2,841.5 2,842.4 2,842.480 73.73 2,836.9 2,843.9 2,843.8 2,844.6 2,844.681 74.82 2,844.5 2,850.9 2,850.8 2,851.5 2,851.582 75.89 2,854.2 2,858.6 2,858.1 2,859.3 2,858.7
Reach 6 (Map segment 2) Continued—
Table 4. Streambed- and calculated water-surface elevation data for the main channel of the Jocko River,western Montana.
1Cross
section
Distanceupstream
from crosssection 1,
inthousands
of feet
Minimumstreambedelevation,
in feet
100-year flood discharge 500-year flood discharge
Existingcondition
(with levee)
Hypotheticalcondition(no levee)
Existingcondition
(with levee)
Hypotheticalcondition(no levee)
Calculated water-surface elevation, in feet, forindicated flood discharge and condition
Continued—
[Distance upstream from cross section 1 measured along channel centerline shown on U.S. Geological Survey 7.5-minute quadrangle maps. Vertical coordinateinformation referenced to North American Vertical Datum of 1988 (NAVD 88). Abbreviations: DS, downstream side of bridge; US, upstream side of bridge]
1 Data for some interpolated cross sections are omitted from the table.2 Cross section not shown on map segment.
40414242 DS 2
42 US 2
4344454647484949.55051525354555657585960616263646566
66 DS 2
66 US 2
676869707172737475767778
78 DS 2
78 US 2
79808182
1,050160130120120190610640500700710550400190
7011016070
270270250300310290300320280280160
80
80
80450
1,0501,0701,4501,5001,9002,1002,0001,310
950990980
980
980980520
1,300930
90010013012012019040033090
1003301301001007080
16070
15026016030024026030032024028013080
80
80320400
1,0701,4501,5001,9001,0801,300
440280990800
800
800660280300240
2,679.82,685.62,685.92,685.92,686.52,687.02,693.02,699.52,705.22,711.22,716.52,719.62,723.72,727 .22,728.32,730.62,731.62,734.02,738.72,740.32,741.02,742.02,742.72,745.72,748.12,749.82,750.62,752.12,753.22,755.1
2,755.1
2,755.22,757.12,758.12,762.72,763.72,773.62,782.92,788.82,797.52,814.62,823.72,837.52,839.6
2,839.6
2,840.32,841.42,843.92,850.92,858.6
2,679.92,685.62,685.92,685.92,686.52,687.02,693.02,699.72,705.22,711.42,716.82,719.62,723.82,727.22,728.32,730.62,731.82,734.02,738.82,740.62,741.12,742.32,742.72,745.82,748.12,749.82,750.62,752.12,753.22,755.1
2,755.1
2,755.22,757.12,758.02,762.72,763.72,773.62,782.92,788.82,797.52,814.92,823.72,837.52,839.6
2,839.6
2,840.42,841.42,843.92,851.42,858.6
.1
.0
.0
.0
.0
.0
.0
.2
.0
.2
.3
.0
.1
.0
.0
.0
.2
.0
.1
.3
.1
.3
.0
.1
.0
.0
.0
.0.0.0
.0
.0
.0
.0
.0
.0
.0
.0
.0
.0
.3
.0
.0
.0
.0
.1
.0
.0
.5
.0
Width ofthe 100-yearflood area,
in feet
Calculatedwater-surface
elevation for the100-year flood
discharge,in feet
Calculatedwater-surfaceelevation withencroachment,
in feet
Increase inwater-surface
elevation,in feet
Floodwaywidth,in feet 1
1
Table 6. Floodway data for the Jocko River, western Montana.
[Floodway determined for Reaches 1, 4, 5, 6, and 8 for existing (1999-2001) conditions. Floodway width was expanded to equal the width of the100-year flood area at all cross sections in split-flow Reaches 2, 3, and 7. Vertical coordinate information referenced to North American VerticalDatum of 1988 (NAVD 88). Abbreviations: DS, downstream side of bridge; US, upstream side of bridge]
Crosssection
(Mapsegments
1-3)
Continued
1 May include small areas that are not inundated by the 100-year flood discharge and may include some areas where water is pondedin meander channels (no effective conveyance of floodwater).2 Cross sections not shown on map segments.
Reach 6 (Map segment 2) Continued
Looking downstream from levee on right bank near cross section 69.
Reach 6
St. Ig
natiu
s5 mile
s
Prepared in cooperation withTHE CONFEDERATED SALISH AND KOOTENAI TRIBES
OF THE FLATHEAD NATION
because the elevations at the top of the levee are at or abovethe calculated water-surface elevations for the 100- and 500-year flooddischarges at most of the cross sections. As in Reaches 2 and 3, aninitial distribution of discharge between the two flow paths wasassumed, and water-surface elevations were calculated for each flowpath at each cross section. The distribution of discharge wasincrementally adjusted and simulations were repeated until calculatedwater-surface elevations in the two flow paths at the next cross sectionupstream from the split-flow reach (cross section 35) were the same.
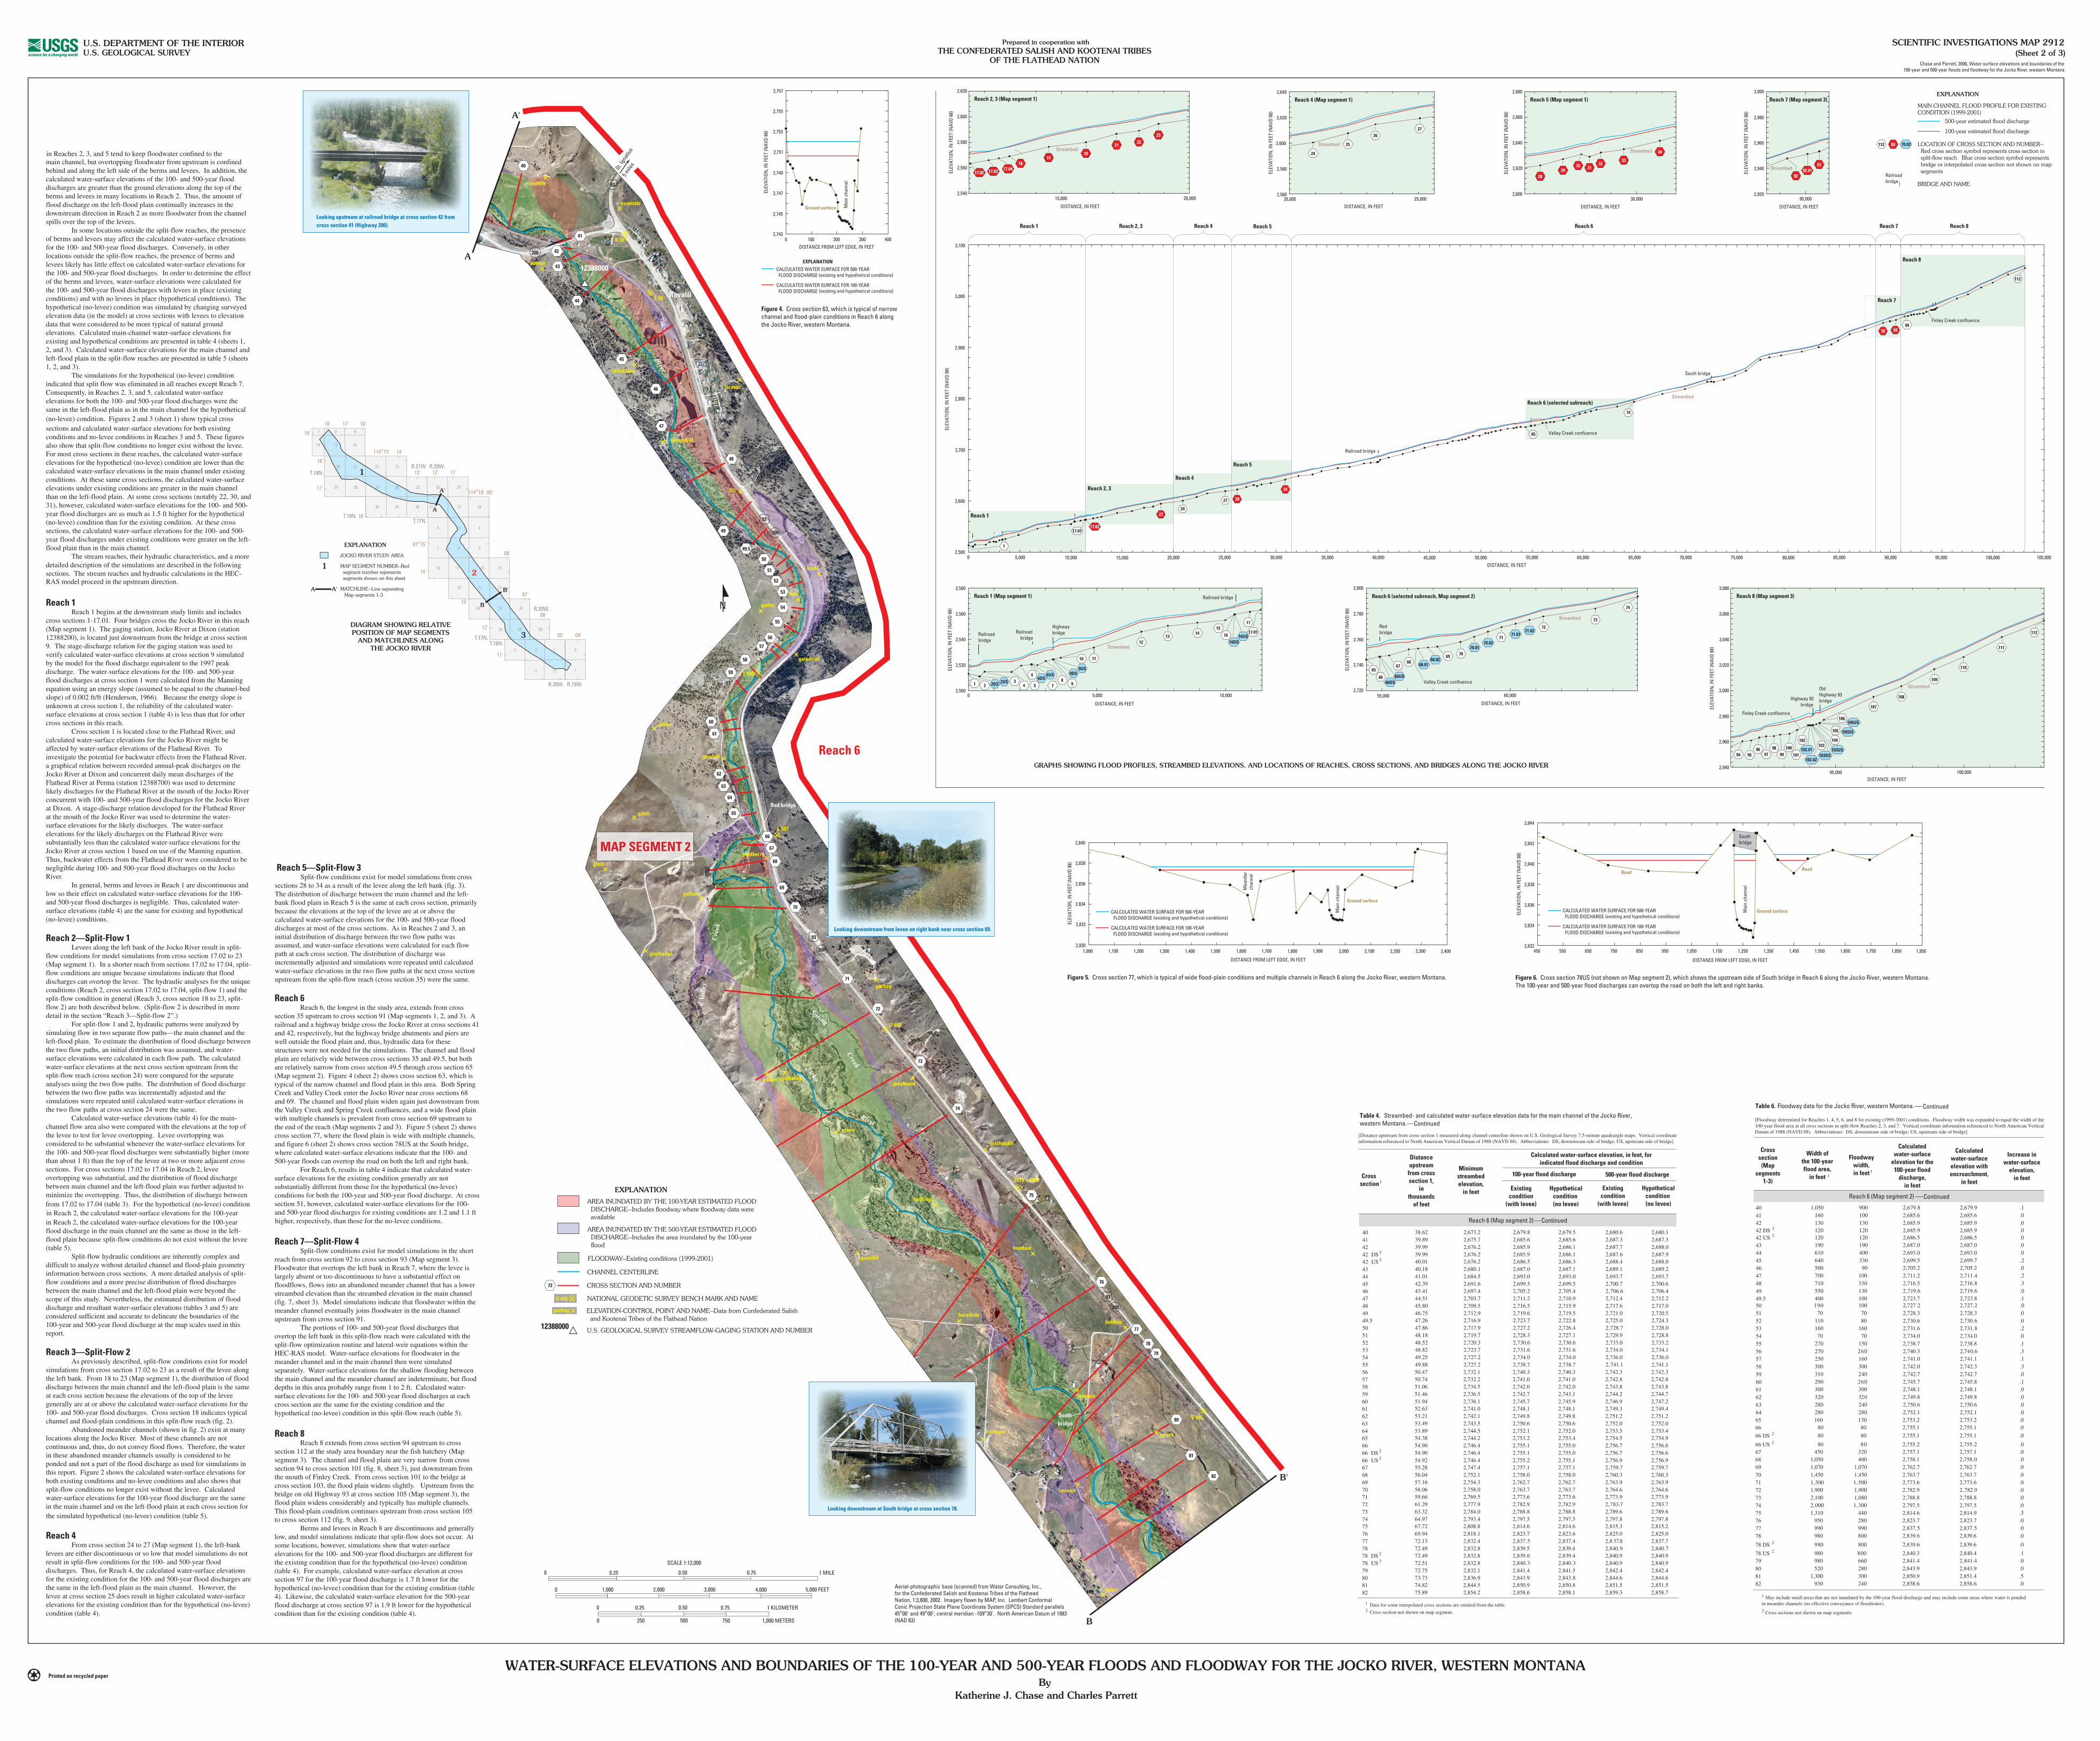
Reach 6Reach 6, the longest in the study area, extends from cross
section 35 upstream to cross section 91 (Map segments 1, 2, and 3). Arailroad and a highway bridge cross the Jocko River at cross sections 41and 42, respectively, but the highway bridge abutments and piers arewell outside the flood plain and, thus, hydraulic data for thesestructures were not needed for the simulations. The channel and floodplain are relatively wide between cross sections 35 and 49.5, but bothare relatively narrow from cross section 49.5 through cross section 65(Map segment 2). Figure 4 (sheet 2) shows cross section 63, which istypical of the narrow channel and flood plain in this area. Both SpringCreek and Valley Creek enter the Jocko River near cross sections 68and 69. The channel and flood plain widen again just downstream fromthe Valley Creek and Spring Creek confluences, and a wide flood plainwith multiple channels is prevalent from cross section 69 upstream tothe end of the reach (Map segments 2 and 3). Figure 5 (sheet 2) showscross section 77, where the flood plain is wide with multiple channels,and figure 6 (sheet 2) shows cross section 78US at the South bridge,where calculated water-surface elevations indicate that the 100- and500-year floods can overtop the road on both the left and right bank.
For Reach 6, results in table 4 indicate that calculated water-surface elevations for the existing condition generally are notsubstantially different from those for the hypothetical (no-levee)conditions for both the 100-year and 500-year flood discharge. At crosssection 51, however, calculated water-surface elevations for the 100-and 500-year flood discharges for existing conditions are 1.2 and 1.1 ft
higher, respectively, than those for the no-levee conditions.
Reach 7—Split-Flow 4Split-flow conditions exist for model simulations in the short
reach from cross section 92 to cross section 93 (Map segment 3).Floodwater that overtops the left bank in Reach 7, where the levee islargely absent or too discontinuous to have a substantial effect onfloodflows, flows into an abandoned meander channel that has a lowerstreambed elevation than the streambed elevation in the main channel(fig. 7, sheet 3). Model simulations indicate that floodwater within themeander channel eventually joins floodwater in the main channelupstream from cross section 91.
The portions of 100- and 500-year flood discharges thatovertop the left bank in this split-flow reach were calculated with thesplit-flow optimization routine and lateral-weir equations within theHEC-RAS model. Water-surface elevations for floodwater in themeander channel and in the main channel then were simulatedseparately. Water-surface elevations for the shallow flooding betweenthe main channel and the meander channel are indeterminate, but flooddepths in this area probably range from 1 to 2 ft. Calculated water-surface elevations for the 100- and 500-year flood discharges at eachcross section are the same for the existing condition and the
hypothetical (no-levee) condition in this split-flow reach (table 5).
Reach 8Reach 8 extends from cross section 94 upstream to cross
section 112 at the study area boundary near the fish hatchery (Mapsegment 3). The channel and flood plain are very narrow from crosssection 94 to cross section 101 (fig. 8, sheet 3), just downstream fromthe mouth of Finley Creek. From cross section 101 to the bridge atcross section 103, the flood plain widens slightly. Upstream from thebridge on old Highway 93 at cross section 105 (Map segment 3), theflood plain widens considerably and typically has multiple channels.This flood-plain condition continues upstream from cross section 105to cross section 112 (fig. 9, sheet 3).
Berms and levees in Reach 8 are discontinuous and generallylow, and model simulations indicate that split-flow does not occur. Atsome locations, however, simulations show that water-surfaceelevations for the 100- and 500-year flood discharges are different forthe existing condition than for the hypothetical (no-levee) condition(table 4). For example, calculated water-surface elevation at crosssection 97 for the 100-year flood discharge is 1.7 ft lower for thehypothetical (no-levee) condition than for the existing condition (table4). Likewise, the calculated water-surface elevation for the 500-yearflood discharge at cross section 97 is 1.9 ft lower for the hypotheticalcondition than for the existing condition (table 4).
higher, respectively, than those for the no-levee conditions.
hypothetical (no-levee) condition in this split-flow reach (table 5).
AREA INUNDATED BY THE 100-YEAR ESTIMATED FLOODDISCHARGE--Includes floodway where floodway data wereavailable
AREA INUNDATED BY THE 500-YEAR ESTIMATED FLOODDISCHARGE--Includes the area inundated by the 100-yearflood
FLOODWAY--Existing conditions (1999-2001)
CHANNEL CENTERLINE
CROSS SECTION AND NUMBER
NATIONAL GEODETIC SURVEY BENCH MARK AND NAME
ELEVATION-CONTROL POINT AND NAME--Data from Confederated Salishand Kootenai Tribes of the Flathead Nation
EXPLANATION
gerbag
U 445
72
Reach 5—Split-Flow 3Split-flow conditions exist for model simulations from cross
sections 28 to 34 as a result of the levee along the left bank (fig. 3).The distribution of discharge between the main channel and the left-bank flood plain in Reach 5 is the same at each cross section, primarilybecause the elevations at the top of the levee are at or above thecalculated water-surface elevations for the 100- and 500-year flooddischarges at most of the cross sections. As in Reaches 2 and 3, aninitial distribution of discharge between the two flow paths wasassumed, and water-surface elevations were calculated for each flowpath at each cross section. The distribution of discharge wasincrementally adjusted and simulations were repeated until calculatedwater-surface elevations in the two flow paths at the next cross sectionupstream from the split-flow reach (cross section 35) were the same.
reaches 2, 3, and 5 tend to keep floodwater confined to themain channel, but overtopping floodwater from upstream is confinedbehind and along the left side of the berms and levees. In addition, thecalculated water-surface elevations of the 100- and 500-year flooddischarges are greater than the ground elevations along the top of theberms and levees in many locations in Reach 2. Thus, the amount offlood discharge on the left-flood plain continually increases in thedownstream direction in Reach 2 as more floodwater from the channelspills over the top of the levees.
In some locations outside the split-flow reaches, the presenceof berms and levees may affect the calculated water-surface elevationsfor the 100- and 500-year flood discharges. Conversely, in otherlocations outside the split-flow reaches, the presence of berms andlevees likely has little effect on calculated water-surface elevations forthe 100- and 500-year flood discharges. In order to determine the effectof the berms and levees, water-surface elevations were calculated forthe 100- and 500-year flood discharges with levees in place (existingconditions) and with no levees in place (hypothetical conditions). Thehypothetical (no-levee) condition was simulated by changing surveyedelevation data (in the model) at cross sections with levees to elevationdata that were considered to be more typical of natural groundelevations. Calculated main-channel water-surface elevations forexisting and hypothetical conditions are presented in table 4 (sheets 1,2, and 3). Calculated water-surface elevations for the main channel andleft-flood plain in the split-flow reaches are presented in table 5 (sheets1, 2, and 3).
The simulations for the hypothetical (no-levee) conditionindicated that split flow was eliminated in all reaches except Reach 7.Consequently, in Reaches 2, 3, and 5, calculated water-surfaceelevations for both the 100- and 500-year flood discharges were thesame in the left-flood plain as in the main channel for the hypothetical
(no-levee) condition. Figures 2 and 3 (sheet 1) show typical crosssections and calculated water-surface elevations for both existingconditions and no-levee conditions in Reaches 3 and 5. These figuresalso show that split-flow conditions no longer exist without the levee.For most cross sections in these reaches, the calculated water-surfaceelevations for the hypothetical (no-levee) condition are lower than thecalculated water-surface elevations in the main channel under existingconditions. At these same cross sections, the calculated water-surfaceelevations under existing conditions are greater in the main channelthan on the left-flood plain. At some cross sections (notably 22, 30, and31), however, calculated water-surface elevations for the 100- and 500-year flood discharges are as much as 1.5 ft higher for the hypothetical(no-levee) condition than for the existing condition. At these crosssections, the calculated water-surface elevations for the 100- and 500-year flood discharges under existing conditions were greater on the left-flood plain than in the main channel.
The stream reaches, their hydraulic characteristics, and a moredetailed description of the simulations are described in the followingsections. The stream reaches and hydraulic calculations in the HEC-
RAS model proceed in the upstream direction.
Reach 1Reach 1 begins at the downstream study limits and includes
cross sections 1-17.01. Four bridges cross the Jocko River in this reach(Map segment 1). The gaging station, Jocko River at Dixon (station12388200), is located just downstream from the bridge at cross section9. The stage-discharge relation for the gaging station was used toverify calculated water-surface elevations at cross section 9 simulatedby the model for the flood discharge equivalent to the 1997 peakdischarge. The water-surface elevations for the 100- and 500-yearflood discharges at cross section 1 were calculated from the Manningequation using an energy slope (assumed to be equal to the channel-bedslope) of 0.002 ft/ft (Henderson, 1966). Because the energy slope isunknown at cross section 1, the reliability of the calculated water-surface elevations at cross section 1 (table 4) is less than that for othercross sections in this reach.
Cross section 1 is located close to the Flathead River, andcalculated water-surface elevations for the Jocko River might beaffected by water-surface elevations of the Flathead River. Toinvestigate the potential for backwater effects from the Flathead River,a graphical relation between recorded annual-peak discharges on theJocko River at Dixon and concurrent daily mean discharges of theFlathead River at Perma (station 12388700) was used to determinelikely discharges for the Flathead River at the mouth of the Jocko Riverconcurrent with 100- and 500-year flood discharges for the Jocko Riverat Dixon. A stage-discharge relation developed for the Flathead Riverat the mouth of the Jocko River was used to determine the water-surface elevations for the likely discharges. The water-surfaceelevations for the likely discharges on the Flathead River weresubstantially less than the calculated water-surface elevations for theJocko River at cross section 1 based on use of the Manning equation.Thus, backwater effects from the Flathead River were considered to benegligible during 100- and 500-year flood discharges on the JockoRiver.
In general, berms and levees in Reach 1 are discontinuous andlow so their effect on calculated water-surface elevations for the 100-and 500-year flood discharges is negligible. Thus, calculated water-surface elevations (table 4) are the same for existing and hypothetical(no-levee) conditions.
Reach 2—Split-Flow 1Levees along the left bank of the Jocko River result in split-
flow conditions for model simulations from cross section 17.02 to 23(Map segment 1). In a shorter reach from sections 17.02 to 17.04, split-flow conditions are unique because simulations indicate that flooddischarges can overtop the levee. The hydraulic analyses for the uniqueconditions (Reach 2, cross section 17.02 to 17.04, split-flow 1) and thesplit-flow condition in general (Reach 3, cross section 18 to 23, split-flow 2) are both described below. (Split-flow 2 is described in moredetail in the section “Reach 3—Split-flow 2”.)
For split-flow 1 and 2, hydraulic patterns were analyzed bysimulating flow in two separate flow paths—the main channel and theleft-flood plain. To estimate the distribution of flood discharge betweenthe two flow paths, an initial distribution was assumed, and water-surface elevations were calculated in each flow path. The calculatedwater-surface elevations at the next cross section upstream from thesplit-flow reach (cross section 24) were compared for the separateanalyses using the two flow paths. The distribution of flood dischargebetween the two flow paths was incrementally adjusted and thesimulations were repeated until calculated water-surface elevations inthe two flow paths at cross section 24 were the same.
Calculated water-surface elevations (table 4) for the main-channel flow area also were compared with the elevations at the top ofthe levee to test for levee overtopping. Levee overtopping wasconsidered to be substantial whenever the water-surface elevations forthe 100- and 500-year flood discharges were substantially higher (morethan about 1 ft) than the top of the levee at two or more adjacent crosssections. For cross sections 17.02 to 17.04 in Reach 2, leveeovertopping was substantial, and the distribution of flood dischargebetween main channel and the left-flood plain was further adjusted tominimize the overtopping. Thus, the distribution of discharge betweenthe main channel and the left-flood plain varies at each cross sectionfrom 17.02 to 17.04 (table 3). For the hypothetical (no-levee) condition
in Reach 2, the calculated water-surface elevations for the 100-yearflood discharge in the main channel are the same as those in the left-flood plain because split-flow conditions do not exist without the levee(table 5).
Split-flow hydraulic conditions are inherently complex anddifficult to analyze without detailed channel and flood-plain geometryinformation between cross sections. A more detailed analysis of split-flow conditions and a more precise distribution of flood dischargesbetween the main channel and the left-flood plain were beyond thescope of this study. Nevertheless, the estimated distribution of flooddischarge and resultant water-surface elevations (tables 3 and 5) areconsidered sufficient and accurate to delineate the boundaries of the100-year and 500-year flood discharge at the map scales used in thisreport.
Reach 3—Split-Flow 2As previously described, split-flow conditions exist for model
simulations from cross section 17.02 to 23 as a result of the levee alongthe left bank. From 18 to 23 (Map segment 1), the distribution of flooddischarge between the main channel and the left-flood plain is the sameat each cross section because the elevations of the top of the leveegenerally are at or above the calculated water-surface elevations for the100- and 500-year flood discharges. Cross section 18 indicates typicalchannel and flood-plain conditions in this split-flow reach (fig. 2).
Abandoned meander channels (shown in fig. 2) exist at manylocations along the Jocko River. Most of these channels are notcontinuous and, thus, do not convey flood flows. Therefore, the waterin these abandoned meander channels usually is considered to beponded and not a part of the flood discharge as used for simulations inthis report. Figure 2 shows the calculated water-surface elevations forboth existing conditions and no-levee conditions and also shows thatsplit-flow conditions no longer exist without the levee. Calculatedwater-surface elevations for the 100-year flood discharge are the samein the main channel and on the left-flood plain at each cross section for
the simulated hypothetical (no-levee) condition (table 5).
Reach 4From cross section 24 to 27 (Map segment 1), the left-bank
levees are either discontinuous or so low that model simulations do notresult in split-flow conditions for the 100- and 500-year flooddischarges. Thus, for Reach 4, the calculated water-surface elevationsfor the existing condition for the 100- and 500-year flood discharges arethe same in the left-flood plain as the main channel. However, thelevee at cross section 25 does result in higher calculated water-surfaceelevations for the existing condition than for the hypothetical (no-levee)
in Reaches 2, 3, and 5 tend to keep floodwater confined to the
(no-levee) condition. Figures 2 and 3 (sheet 1) show typical cross
RAS model proceed in the upstream direction.
from 17.02 to 17.04 (table 3). For the hypothetical (no-levee) conditionin Reach 2, the calculated water-surface elevations for the 100-year
the simulated hypothetical (no-levee) condition (table 5).
condition (table 4).
U.S. GEOLOGICAL SURVEY STREAMFLOW-GAGING STATION AND NUMBER12388000