water quality problems, issues and responses - narbo · the laguna de bay and its tributaries water...
TRANSCRIPT

The Laguna de Bay and Its TributariesThe Laguna de Bay and Its Tributaries
Water QualityProblems, Issues and Responses
ByDolora N. Nepomuceno
Laguna Lake Development Authority
Presented at
The Second General MeetingOf the
Network of Asian River Basin Organizations15 February 2005

Outline• Revisiting Laguna de Bay Basin• Water Quality Situationer• Addressing key issues/challenges
- Regulatory tools and market-based instruments- Public Disclosure - LISCOP Project- Laguna de Bay Community Carbon Finance Project
• Key Messages

QUICK FACTS
Lake Surface Area: * 900 km2
Lake Average Depth: ~ 2.5 m
Lake Maximum Depth: ~ 20m (Diablo Pass)
Lake Average Volume: 2,250,000,000 m3
Retention Time: ~ 8 months
Watershed Area: * 2,920 km2
Shoreline: * 285 km
Watershed Population: ~ 12 M (NSO 2000)
Biological Resources: fish, mollusks, plankton macrophytes
(* At 10.5m Lake Elevation)

Laguna de Bay is a strategic political, economic and ecological resource that has to be managed well as a Living Lake, capable of sustaining life, livelihood and economic progress in the region and its environs.

•The lake is life support system
to about 12 million people
•3.05 million of these live along the lakeshore

It is the major source of freshwater fish in the surrounding provinces, municipalities, and cities.

Fisheries
Power Generation
Transport Route
Reservoir for flood
water
Existing Lake Uses
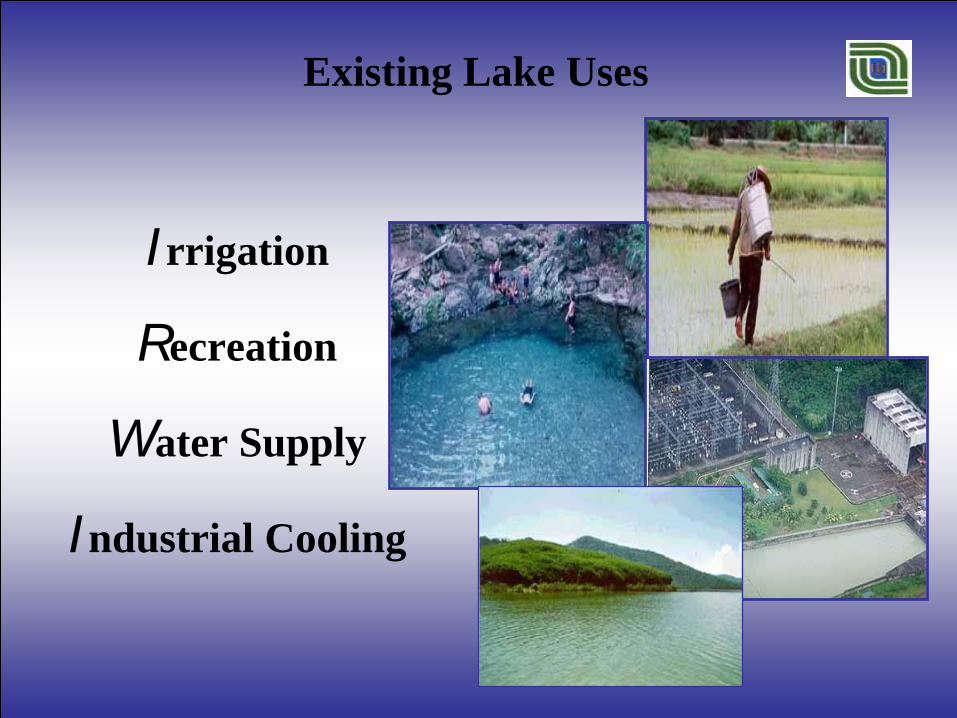
Irrigation
Recreation
Water Supply
Industrial Cooling
Existing Lake Uses

It is being eyed as the next major source of potable water for Metro Manila
More than 400,000 people in Metro Manila are already suffering from water shortage
A full blown water crisis is seen to hit Metro Manila in the near future
A private water company already draws approx. 300,000 m3 of water per month

Economic Economic development development
impacts impacts threaten the threaten the Living LakeLiving Lake

Unprecedented economic growth over last 30 years -Rapidly expanding industrialization and urbanization in the region
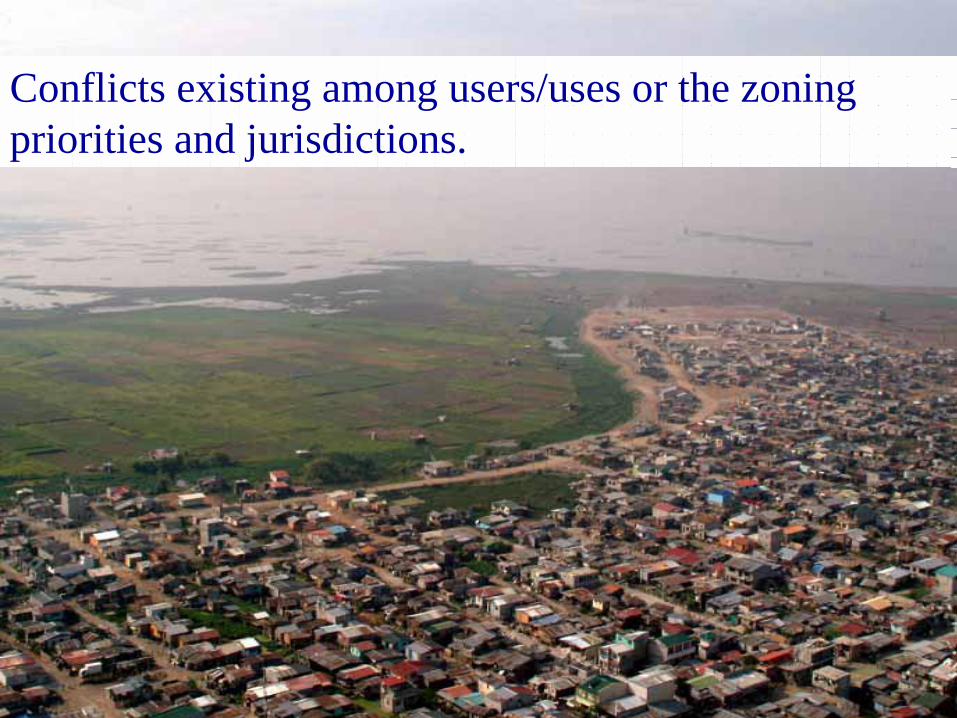
Conflicts existing among users/uses or the zoning priorities and jurisdictions.

Excessive discharge of pollutants from industries ...

... from communities

A THREATENED A THREATENED LAKE LAKE ECOSYSTEMECOSYSTEM

Human Waste68%
Industrial19%
Others13%
Organic Waste Profile in the Lake
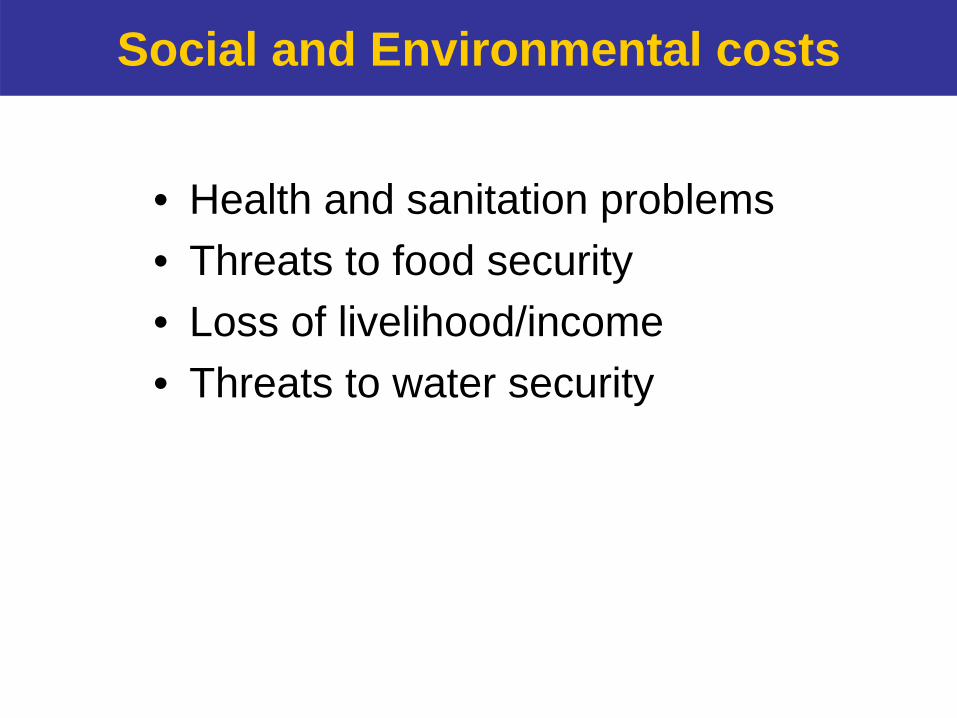
Social and Environmental costs
• Health and sanitation problems• Threats to food security• Loss of livelihood/income• Threats to water security

Evolution ofLLDA
RA 4850 (1966) mandates LLDA .to promote and accelerate the development and balanced growth….with due regard for environmental management….)
PD 813 (1975)Expands the mandate of LLDA to address environmental protection including the power to issue permit for the use of surface waters
EO 927 (1983)Classified LLDA as Class A CorporationAuthorized to modify its organizationGranted water rights over Laguna de Bay and other water bodies within the regionGranted power to control and abate pollution within the regionAuthorized to collect fees for the use of lake water
DAO 2004-61 transfers authority to issue ECC/CNC to LLDA LIDO / IMOA (2003) provides
longer-term policy & institutional framework for management of LDB Region & implementing arrangement for LISCOP
BR 33 (1996)Approval of EUFS& adoption of IRR implementation started 1997
EIA
Participatory /Co-Mgt. approach in Info. sharing
Environmental & resource useRegulation &Enforcement
ResourceDevelopment
EconomicInstruments for pollution control/ abatement

Philippine Clean Water ActR.A. 9275
Establishment of WQMAsLGUs with similar geographical, meteorological conditions, etc., orLGUs which share common interest or face similar dev’t. prog./problemsGoverned by a governing board:- composed of reps. of mayors, governors, relevant natl. govt. agencies, civil society, water utility & business sector

LLDA’s Administrative Jurisdiction
Total no. of cities = 14Lakeshore municipalities = 25Non-lakeshore municipalities = 22Total no. of barangays = 2,656


Biological Oxygen Demand Levels
BOD concentration in the 15 rivers, 2000-2004
DENR Class C Criterion = 10 mg/L
0102030
405060708090
100110120130
2000 2001 2002 2003 2004Year
BO
D, m
g/L
Marikina R.Mangangate R.Tunasan R.San Pedro R.Cabuyao R.San Cristobal R. San Juan R. Bay R. Sta. Cruz R. Pagsanjan R. Pangil R.Tanay R. Morong R. Siniloan R. Sapang Baho R.

Dissolved Oxygen LevelsPercent DO saturation in the 15 rivers, 2000-2004
DENR Class C Standard = 5 mg/L (minimum)
0.00
1.00
2.00
3.00
4.00
5.00
6.00
7.00
8.00
9.00
10.00
11.00
2000 2001 2002 2003 2004
Year
Diss
olve
d O
xyge
n,m
g/L
Marikina R.
Mangangate R.Tunasan R.
San Pedro R.Cabuyao R.
San Cristobal R. San Juan R.
Bay R. Sta. Cruz R.
Pagsanjan R. Pangil R.
Tanay R. Morong R.
Siniloan R. Sapang Baho R.

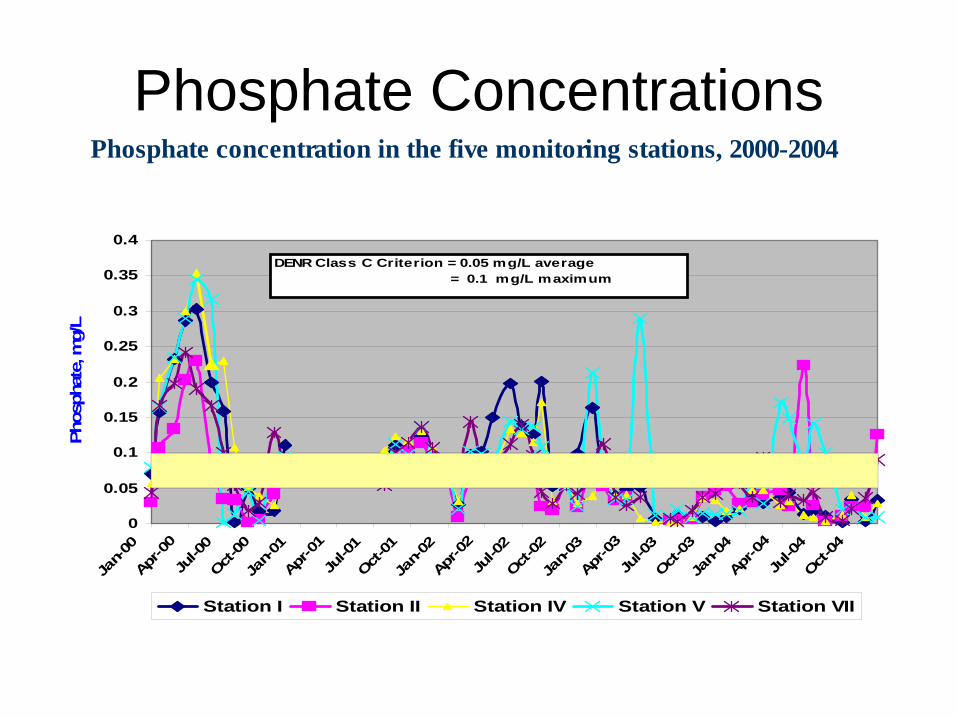
Phosphate Concentrations
DENR Class C Criterion = 0.40 mg/L
0
0.4
0.8
1.2
1.6
2
2.4
2.8
3.2
2000 2001 2002 2003 2004Year
Inor
gani
c ph
osph
ate,
mg/
L
Marikina R.Mangangate R.Tunasan R.San Pedro R.Cabuyao R.San Cristobal R. San Juan R. Bay R. Sta. Cruz R. Pagsanjan R. Pangil R.Tanay R. Morong R. Siniloan R. Sapang Baho R.
Phosphate concentration in the 15 rivers, 2000-2004

Nitrate ConcentrationsNitrate concentration in the 15 rivers, 2000-2004
0
1
2
3
4
5
6
7
8
9
10
2000 2001 2002 2003 2004Year
Nitr
ate,
mg/
L
Marikina R.
Mangangate R.
Tunasan R.
San Pedro R.
Cabuyao R.
San Cristobal R.
San Juan R.
Bay R.
Sta. Cruz R.
Pagsanjan R.
Pangil R.
Tanay R.
Morong R.
Siniloan R.
Sapang Baho R.
DENR Class C Criterion = 10 mg/L

Total ColiformsGeometric mean of total coliform counts in the 15 rivers, 2000-2004
DENR Class C Criterion = 5000 MPN/100mL
0.00E+00
5.00E+10
1.00E+11
1.50E+11
2.00E+11
2.50E+11
2000 2001 2002 2003 2004Year
T. c
olifo
rm, M
PN/1
00m
L
Marikina R.Mangangate R.Tunasan R.San Pedro R.Cabuyao R.San Cristobal R. San Juan R. Bay R. Sta. Cruz R. Pagsanjan R. Pangil R.Tanay R. Morong R. Siniloan R. Sapang Baho R.

SummaryTotal
Coliform
Marikina River
Mangangate River
Tunasan River
Sn Pedro River
Cabuyao River
Sn Cristobal River
San Juan River
BaY River
Sta. Cruz River
Pagsajan River
Pangil River
Tanay River
Morong River
Siniloan River
Sapang Baho River
NitrateBOD DO Phosphate

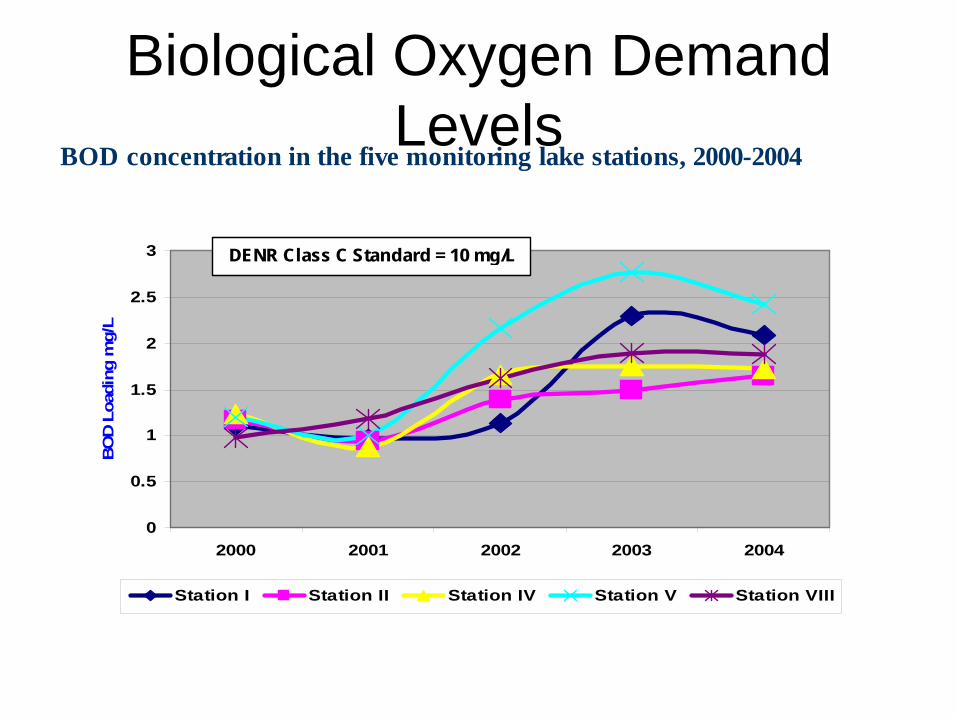
Biological Oxygen Demand Levels
0
0.5
1
1.5
2
2.5
3
2000 2001 2002 2003 2004
BOD
Load
ing
mg/
L
Station I Station II Station IV Station V Station VIII
DENR Class C Standard = 10 mg/L
BOD concentration in the five monitoring lake stations, 2000-2004

Dissolved Oxygen Levels
6
6.5
7
7.5
8
8.5
9
2000 2001 2002 2003 2004
Year
Dis
solv
ed O
xyge
n, m
g/L
Station I Station II Station IV Station V Station VIII
DENR Class C Criterion = 5 mg/L
DO level in the five monitoring stations, 2000-2004

Algal bloom
Oxygen depletion due to algal bloom
The algae or “liya” produce dissolved oxygen through photosynthesis, but they utilize the dissolved oxygen when they respire and decompose, which can be more than what they have produced. A deficit is created, and fish grasp for whatever oxygen is left eventually leading to fishkill.
R. I. P.
Phosphate Concentrations
0
0.05
0.1
0.15
0.2
0.25
0.3
0.35
0.4
Jan-
00Apr
-00
Jul-0
0Oct
-00Ja
n-01
Apr-0
1Ju
l-01
Oct-01
Jan-
02Apr
-02
Jul-0
2Oct
-02Ja
n-03
Apr-0
3Ju
l-03
Oct-03
Jan-
04Apr
-04
Jul-0
4Oct
-04
Phos
phat
e, m
g/L
Station I Station II Station IV Station V Station VII
DENR Class C Criterion = 0.05 mg/L average = 0.1 mg/L maximum
Phosphate concentration in the five monitoring stations, 2000-2004

Nitrate ConcentrationNitrate concentration in the five monitoring stations, 2000-2004
0
0.1
0.2
0.3
0.4
0.5
0.6
Jan-
00
Jul-0
0
Jan-
01
Jul-0
1
Jan-
02
Jul-0
2
Jan-
03
Jul-0
3
Jan-
04
Jul-0
4
Year
Nitr
ate,
mg/
L

Chloride ConcentrationChloride concentration in the five monitoring stations, 2000-2004
0
200
400
600
800
1000
1200
1400
1600
1800
2000 2001 2002 2003 2004
Chl
orid
e co
ncen
trat
ions
, mg/
L
Station I Station II Station IV Station V Station VII
DENR Class C Criterion = 350 mg/L
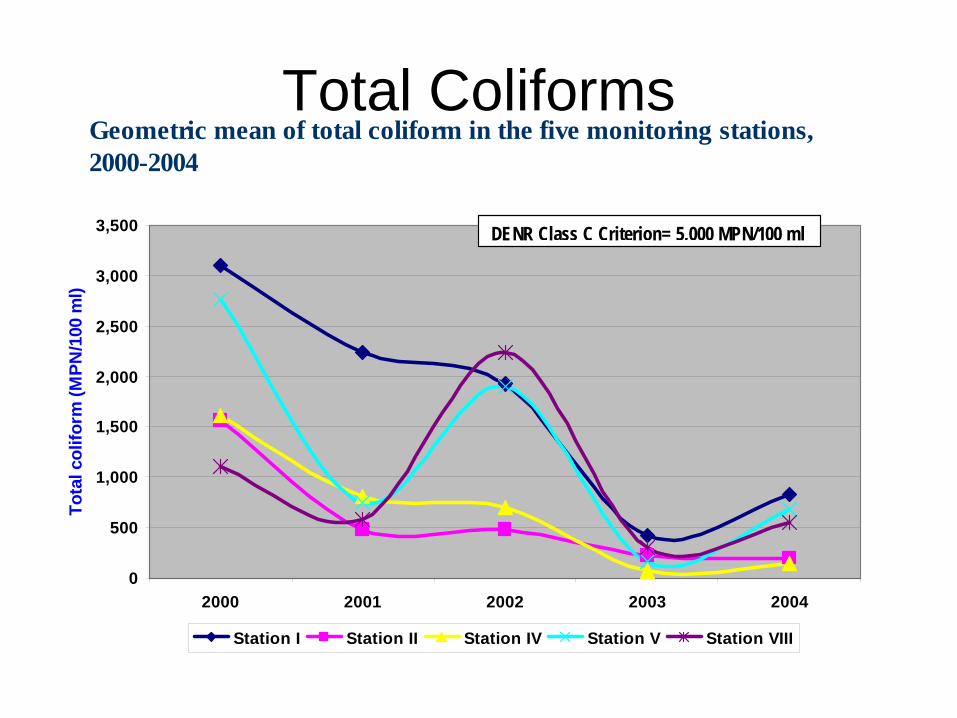
Total Coliforms
0
500
1,000
1,500
2,000
2,500
3,000
3,500
2000 2001 2002 2003 2004
Tota
l col
iform
(MPN
/100
ml)
Station I Station II Station IV Station V Station VIII
DENR Class C Criterion= 5,000 MPN/100 ml
Geometric mean of total coliform in the five monitoring stations, 2000-2004

Heavy Metals
20.01-0.45Zinc
-0.01Nickel
-0.01-13.8Iron
0.050.01-0.1Copper
0.050.04-0.1Lead
0.010.004Cadmium
0.050.0002-0.003Chromium, hexivalent
Water Quality Criteria For Class C waters, mg/L
Range of Concentrations, mg/L
Heavy Metals

The Water Mondriaan


Present Situation of the Lake

Critical Areas that need Intervention

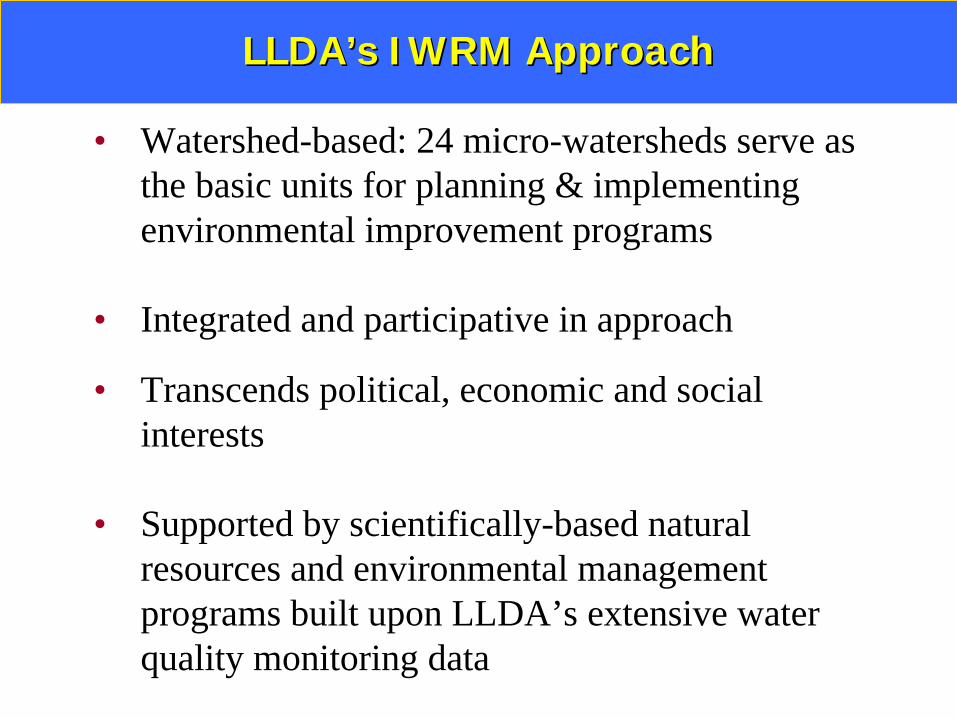
• Watershed-based: 24 micro-watersheds serve as the basic units for planning & implementing environmental improvement programs
• Integrated and participative in approach
• Transcends political, economic and social interests
• Supported by scientifically-based natural resources and environmental management programs built upon LLDA’s extensive water quality monitoring data
LLDALLDA’’ss IWRM ApproachIWRM Approach
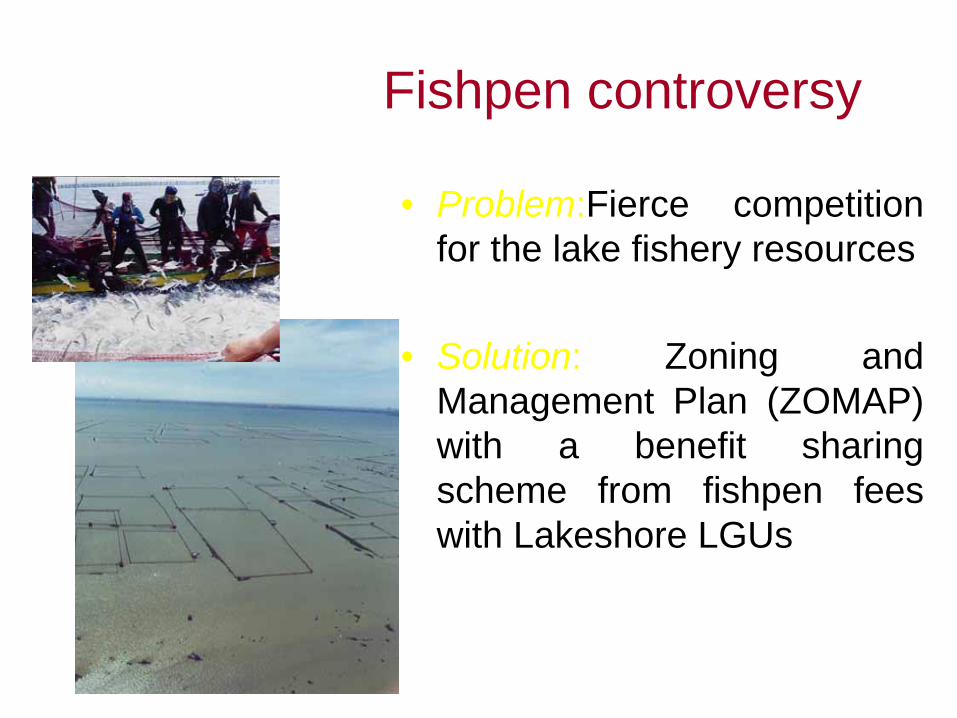
Fishpen controversy
• Problem:Fierce competition for the lake fishery resources
• Solution: Zoning and Management Plan (ZOMAP) with a benefit sharing scheme from fishpen fees with Lakeshore LGUs

Fishery Zoning and Management Program
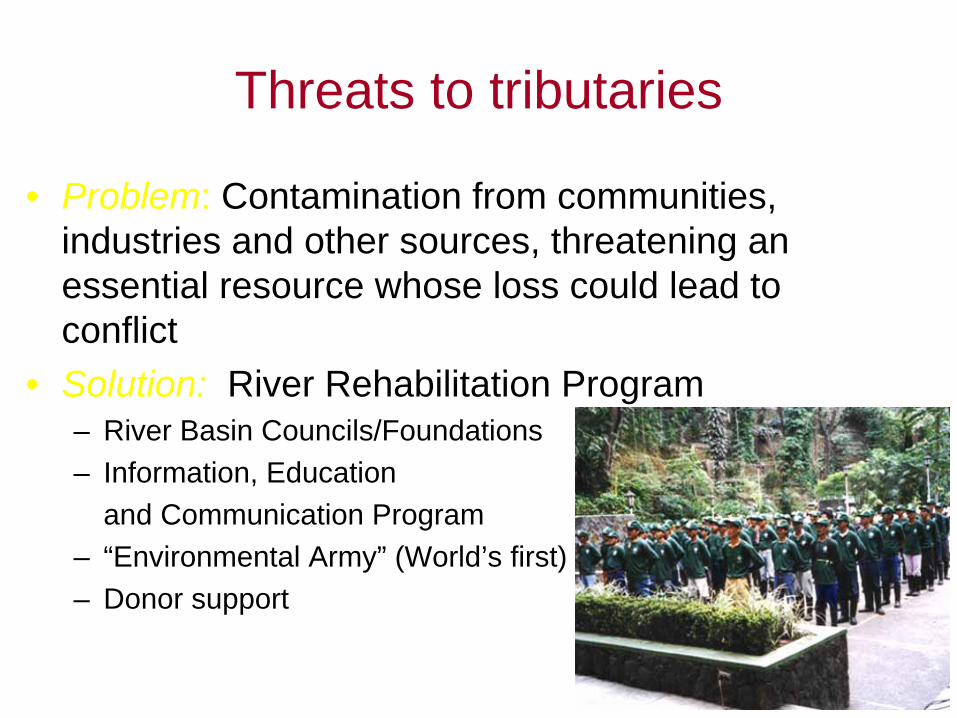
Threats to tributaries
• Problem: Contamination from communities, industries and other sources, threatening an essential resource whose loss could lead to conflict
• Solution: River Rehabilitation Program– River Basin Councils/Foundations– Information, Education
and Communication Program– “Environmental Army” (World’s first)– Donor support

Environmental User Fee System
Reduction of pollution => water quality
improvementProvide incentives for
dischargers
Raise revenue for investment in water quality improvement

Laguna de Bay Institutional Strengthening and Community
Participation Project
Meeting the Challenges to the Sustainable Development of
Laguna de Bay

Goal : Environmental Quality Improvement
Objectives:
• Deepen watershed co-management• Strengthen institutions and instruments
Laguna de Bay Institutional Strengthening and Laguna de Bay Institutional Strengthening and Community Participation (LISCOP) ProjectCommunity Participation (LISCOP) Project
COMPONENT I:Co-Managed Investments for
Watershed Development
COMPONENT 2:Strengthening Institutions
and Instruments

The LEAP ProcessThe LEAP Process

Improving Regulatory and Economic Instruments
Expansion of the EUFSImprovement of the water trading systemDevelopment of the Public Disclosure ProgramUpgrading of the permitting, monitoring and enforcement proceduresCapacity building and institutional learning

Strengthening Policy & Planning Support
Water and Sediment Quality Monitoring and Reporting
Application of the DSS and Development of Shoreland/Watershed Information System
Strengthening of the Information, Education and Communication Program


Public Disclosure Programfor the Laguna de Bay Region
Features• Employs “carrot-and-stick”
approach• Participatory and multi-sectoral.• Combines “hard” and “soft” criteria.• Includes public performance
accounting of the regulating agency (i.e., LLDA)


Laguna de Bay Community Carbon Finance Project
Meeting the Challenges of Sustainable Development
• So unique is the Laguna de Bay ecosystem – a lifeline for over 10 million Filipinos
• Its sustainability and usefulness should be ensured for many generations
• Build on the experience and lessons learned towards integrated water resources management

“ Healthy interaction between the lake and its people is largely built on mutual trust and common
understanding among communities, institutions, organizations.How the seeds of understanding will
grow is strongly linked to creating enabling environment where stakeholders are empowered to
take the driver’s seat in planning, developing implementing and maintaining environmental
and watershed improvement measures.. Contributing to long-term peace, sustaining
partnership built upon a common vision of the lake
as a life-support ecosystem”
Amending the LLDA LawThank You & Good Day.
Laguna Lake Development Authority2/3F Asia-Pro Bldg, Bo. Kapitolyo
Pasig City, PhilippinesContact Nos.
(632) 637-9037, (632) 637-9038, (632) 637-97-48Email Address:
www.llda.gov.ph