water-in-fuel emulsion as marine engine fuel for reduced nox and
TRANSCRIPT

Water-in-fuel emulsion as marine engine fuel for reduced NOx and particulate emissions Anders Andreasen MAN Diesel & Turbo Kirsten Braüner Nyggard Danisco
Environmental Project No. 1380 2011 Miljøprojekt

The Danish Environmental Protection Agency will, when opportunity
offers, publish reports and contributions relating to environmental
research and development projects financed via the Danish EPA.
Please note that publication does not signify that the contents of the
reports necessarily reflect the views of the Danish EPA.
The reports are, however, published because the Danish EPA finds that
the studies represent a valuable contribution to the debate on
environmental policy in Denmark.

3
Content
PREFACE 5
SAMMENFATNING OG KONKLUSIONER 7
BAGGRUND OG FORMÅL 7 UNDERSØGELSEN 8 RESULTATER OG HOVEDKONKLUSIONER 8
Laboratorietests og emulgatorudvikling 8 Motortests på 4T50ME-X 10 Emulgatorforfining 11 Emissionsreduktionspotentiale 11
SUMMARY AND CONCLUSIONS 13
BACKGROUND AND OBJECTIVES 13 THE STUDY 13 RESULTS AND MAIN CONCLUSIONS 14
Laboratory tests and development 14 Engine tests 16 Emulsifier refinement 17 Emission reduction potential 17
1 INTRODUCTION 19
1.1 EMISSIONS FROM INTERNATIONAL SHIPPING 19 1.2 LEGISLATION 20 1.3 EMISSION REDUCTION TECHNIQUES 21 1.4 PREVIOUS EXPERIENCE WITH WIF AND FUTURE CHALLENGES 22 1.5 STRUCTURE OF THE REPORT 25
2 EMULSIFIER SELECTION 27
2.1 INTRODUCTION 27 2.1.1 Background 27 2.1.2 Emulsifier chemistry 27 2.1.3 Emulsions 28 2.1.4 Objective 29
2.2 EXPERIMENTAL 29 2.2.1 Laboratory test conditions 29 2.2.2 Materials 30 2.2.3 Methods 30 2.2.4 Test program 33
2.3 RESULTS 34 2.3.1 General results 34 2.3.2 Emulsifier #8 36 2.3.3 Emulsifier #2 39
2.4 CONCLUSION 42
3 EMULSIFIER TESTS ON 4T50ME-X 43
3.1 EXPERIMENTAL 43 3.1.1 Engine and measurement setup 43 3.1.2 Optical measurement setup 43 3.1.3 Description of the emulsifier system 45

4
3.1.4 Convention for expressing the water content 45 3.1.5 Test plan 48 3.1.6 Stability metrics and criteria 49
3.2 RESULTS 51 3.2.1 General results 51 3.2.2 Emulsifier #8: Short summary 51 3.2.3 Emulsifier #2: Engine stability at varying water content 52 3.2.4 Emulsifier #2: Engine stability at varying emulsifier addition 53 3.2.5 Emulsifier #2: Shut-down and black-out tests 55 3.2.6 Optical investigations 56
3.3 SUMMARY 58
4 EMISSION REDUCTION POTENTIAL 61
4.1 EXPERIMENTAL 61 4.1.1 Engine setup 61 4.1.2 Emission measurements 61 4.1.3 Test plan 62
4.2 RESULTS 62 4.2.1 Specific fuel oil consumption (SFOC) 62 4.2.2 NOx emission 63 4.2.3 CO and HC emissions 65 4.2.4 Particulate emissions 66 4.2.5 Combining exhaust gas emission reduction methods 67
4.3 SUMMARY 70
5 CONCLUSIONS 71
6 BIBLIOGRAPHY 73

5
Preface
This report serves as documentation of the work conducted within the project “Development and tests of water-in-fuel emulsions as marine engine fuel for reduced NOx and particulate emissions“ (Udvikling og tests af vand/olieemulsioner som brændstof til skibsmotorer med henblik på reduktion af NOx og partikler), a collaborative project between Danisco and MAN Diesel & Turbo, with partial funding from the Danish Environmental Protection Agency (Miljøstyrelsen).
The Danish Environmental Protection Agency has formed a partnership with the Danish Ship-owners' Association (Danmarks Rederiforening), aimed at cleaner shipping (Partnerskab for renere skibsfart). The current project has status as one of the elements in this partnership.
The steering committee for the project consists of the following individuals: Mariane T. Hounum, Flemming Bak and Jesper Stubkjær from the Environmental Protection Agency, Arne Mikkelsen from Danish Ship-owners’ Association, Anders Andreasen and Stefan Mayer from MAN Diesel & Turbo and Kirsten Braüner Nygaard and Ulrik Aunskjær from Danisco.
The primary objective of this project is to enable emulsification of water into distillate fuels, also referred to as marine gas oil and marine diesel oil. These fuel types are believed to be quite common in present and future designated emission control areas (ECA). By emulsification of water into fuel it is possible to drastically reduce the NOx emission. The emulsification of water with distillate fuels is not possible without using an emulsifying agent.
The project was formally initiated on October 1st 2009 after an initial phase where contact between the two organisations were established in order to investigate the possibility of applying off-the-shelf emulsifiers used in the food industry for water-in-fuel emulsions. It was soon realised that the present knowledge of producing stable water-fuel-emulsions by aid of emulsifiers was insufficient, at least for large scale applications, and it was decided to join forces in order to find better emulsifier candidates. As such the project is interesting since the two companies have very little in common when it comes to their respective product portfolios. However the business of both companies relies heavily on research and development. This, in particular, has served as a common ground for this joint project. MAN Diesel & Turbo and Danisco are both worldwide distributors of their respective products and both are in the best position to disseminate the technology and know-how and distribute a future commercial product. MAN Diesel & Turbo is a company of the Power Engineering business area of MAN SE. MAN Diesel & Turbo SE, based in Augsburg, Germany, is the world’s leading provider of large-bore diesel engines and turbo machinery for marine and stationary applications. It designs two-stroke and four-stroke engines that are manufactured both by the company and by its licensees. The engines have power

6
outputs ranging from 47kW to 87MW. MAN Diesel & Turbo also designs and manufactures gas turbines of up to 50MW, steam turbines of up to 150MW and compressors with volume flows of up to 1.5 million m3/h and pressures of up to 1000 bar. The product range is rounded off by turbochargers, CP propellers, gas engines, engines for locomotives and chemical reactors. MAN Diesel & Turbo’s range of products includes complete marine propulsion systems, turbo machinery units for the oil & gas as well as the process industries and turnkey power plants. All activity of MAN Diesel & Turbo SE in the present project will be located in Denmark. MAN Diesel, filial af MAN Diesel & Turbo SE, Tyskland is a Danish registered branch of MAN Diesel & Turbo SE, which is a European company created according to Regulation (EC) No 2157/2001 and which has its main office in Augsburg, Germany. Danisco is a world leader in food ingredients, enzymes and bio-based solutions. Using natural raw materials, science and the knowledge of skilled R&D staff, bio-based ingredients are designed and delivered for healthier and safer products. Enablers is a division in Danisco and its business is focused on ingredients for food, like bakery and dairy products, ice cream, drinks and confectionery. In addition, the division is strongly represented in the non-food area like the plastics industry, supplying plastic additives with anti-static and anti-fog effect, and a plasticizer for PVC, as an alternative to hormone-disrupting phthalates. All products are made from natural vegetable oils. This project has been administered from the Enablers division, Non-food and Plastics department and all tests have been performed in the laboratories of Danisco in Brabrand, Denmark. Regarding a future commercialisation of a WIF emulsifier Danisco is in possession of the needed capability and capacity to produce and distribute a future commercial WIF product worldwide. Today Danisco emulsifiers are produced at five production sites located around the world in Denmark, USA, Brazil, Malaysia and China, and logistics and distribution are managed from here, which will facilitate a worldwide distribution of a future commercial WIF product.

7
Sammenfatning og konklusioner
Baggrund og formål
Det menes at 90% af al gods i verden transporteres af skibe, hvoraf flertallet af disse drives frem af store dieselmotorer. Selvom det er den mest miljøvenlige og mindst CO2-udledende metode til godstransport tilgængelig, så tegner søfarten sig for ca. 2,7 % af den antropogene CO2-emission. I moderne højeffektive dieselmotorer sker forbrændingen under højt tryk og under udviklingen af høje temperaturer, hvilket medfører dannelsen af relativt store mængder kvælstofoxider (NOx). Dette, sammenholdt med det faktum at der sjældent anvendes nogen rensning af udstødsgassen f.eks via Selektiv Katalytisk Reduktion (SCR), betyder at søfartens bidrag til den samlede globale emission af NOx er betragtelig. Et resultat heraf er at stadigt strengere krav bliver besluttet gennem arbejdet i den International Maritime Organisation (IMO) under FN. Både grænserne for NOx-udledningen, men ikke mindst grænserne for indholdet af svovl (og derved SOx- og partikeludledningen) i den anvendte brændselsolie, skærpes drastisk. Desuden udnævnes særlige områder, såkaldte ”emission control areas” (ECAs), med yderligere skærpede udledningskrav. Udover IMO-reglerne, kan der være national, regional eller lokal lovgivning og afgifts- og tilskyndelsesordninger, som kræver yderligere reduktion i udledningen forurenende stoffer. Efterspørgslen fra kunder og søfartens målsætning om at være et miljømæssigt forsvarligt foretagende har også initieret en øget interesse i emissionsreducerende teknikker, som kan gå ud over gældende lovgivningskrav. Ved tilsætning af vand til brændselsolien under dannelse af en vand-i-olie (WIF) emulsion, kan NOx-emissionen reduceres markant. Virkemåden er at vandet pga. den krævede fordampningsvarme sænker temperaturen i dieselflammen og herved reducerer dannelsen af NOx (som fortrinsvist dannes ved høje temperaturer). WIF har tidligere været undersøgt på store to-takt diesel motorer i stor udstrækning, men mange af erfaringerne har været baseret på brugen af residual brændselsolier, som pga. deres fysiske egenskaber nemmere danner emulsioner med vand. På den anden side forventes brugen af destillat brændselsolier at udbredes mere i fremtiden bl.a. i ECAs med begrænsning på SOx-udledningen (SECA), hvor tilgængeligheden af residualolier med et tilpas lavt svovlindhold typisk vil være svært tilgængeligt. For at danne en stabil vand-i-olie emulsion med destillat brændselsolie er det nødvendigt at anvende en passende emulgator. Dette har været den primære motivation for dette projekt. Hovedformålet er at finde en økonomisk konkurrencedygtig og fysisk/kemisk egnet emulgator, som muliggør dannelsen af vand-i-olie emulsioner med et højt vandindhold i destillat brændselsolier, og som samtidigt bevarer motorens høje pålidelighed. Derudover er det formålet at kortlægge emissionsreduktionspotentialet for WIF og at undersøge mulige synergieffekter ved at kombinere med udstødsgasrecirkulering (EGR), en anden effektiv emissionsreducerende teknik.

8
Undersøgelsen
Arbejdet i dette projekt har været opdelt i to dele. Den ene del har haft til formål at udvikle og screene et udvalg af mulige emulgatorer. Dette arbejde er udført i Danisco’s laboratorier i Brabrand. Målet har været at finde et lille antal emulgatorer, som, baseret på laboratorieundersøgelserne, menes at være bedst egnet til at opfylde hovedformålet med projektet. Den anden del er dedikeret til egentlige motortests, hvor emulgatorkandidaterne testes på MAN B&W Diesel 4T50ME-X testmotoren som står hos MAN Diesel & Turbo i København. Igennem disse tests ekstrapoleres laboratorieresultaterne til opskalerede forhold, som er repræsentative for forholdene i produktionsmotorer, som bruges til skibsfremdrift. Formålet med motortestene er at demonstrere stabiliteten og pålideligheden af motordrift på WIF.
Resultater og hovedkonklusioner
Laboratorietests og emulgatorudvikling
Adskillelige test er udført på et stort antal emulgatorer med henblik på at udvælge de bedste emulgatorkandidater for en fremtidig WIF applikation til store to-takt dieselmotorer. Laboratorietestene er udført med henblik på at belyse forskellige egenskaber for emulsionerne, hvoraf de vigtigste er stabilitet over tid, herunder iagttagelse af eventuel faseseparation, samt viskositet. I figur 1 ses antal undersøgte emulgatorer og det antal testemulsioner, der er fremstillet med den enkelte emulgator. På hver testemulsion er der udført et stort antal analyser, såsom statisk og dynamisk grænsefladespænding, vanddråbestørrelsesdistribution, Confocal Laser Scannings Mikroskopi (CLSM) til iagttagelse af vanddråbefordelingen i emulsionen, monitorering af visuel stabilitet, samt rheologiske studier. Figuren giver også et billede af selektionsprocessen, set som det antal emulsioner og tests, der er udført på den enkelte emulgator. Er emulgatoren beskrevet ud fra et lille antal emulsioner og analyser, er det et udtryk for, at den har fejlet i løbende tests og derfor er sorteret fra.
Figur 1 Histogram over de forskellige emulgatorer med det antal emulsioner, der er lavet på hver enkelt emulgator Ét af de vigtigste selektionskriterier for emulgatorerne er deres evne til at stabilisere emulsionen over tid. Emulsionen må ikke faseseparere, med adskilte vand- og dieseloliefaser. Desuden er det ønskeligt at minimere

9
sedimentationen af de dispergerede vanddråber i dieselolien. I figur 2 ses eksempler på en stabil emulsion (til venstre) med homogent dispergerede vanddråber, resulterende i homogen hvid emulsion, en emulsion med sedimentering (i midten), samt en emulsion, der er fasesepareret og indeholder frit vand i bunden af flasken (til højre).
Figur 2 Emulsioner; (venstre) Stabil emulsion, (midten) Emulsion med sedimentation, (højre) Emulsion med fase separation. En emulsion bliver også karakteriseret ved mikroskopi (CLSM), som vist i figur 3. Her vises eksempler på en CLSM-mikroskopiering af en stabil emulsion til venstre, med homogent dispergerede vanddråber og en ustabil emulsion til højre, med meget store vanddråber, hvilket er en indikator for senere coalescence og faseseparation.
Figur 3 Confocal Laser Scanning Mikroskopi (CLSM) af Emul 2 (venstre) og Emul 1 (højre). Brændselsoliefasen er tilsat et rødt farvestof og vandfasen er tilsat et grønt farvestof. Emul 2 udviser gode emulgeringsegenskaber, hvorimod Emul 1 udviser dårlige emulgeringsegenskaber Viskositet er ligeledes en meget væsentlig parameter i selektionen af emulgatorer. I figur 4 ses eksempel på viskositetsmålinger som funktion af emulgatortype og – koncentration, samt vandmængde og temperatur. Det ses at vandindholdet har større indflydelse på viskositeten end temperaturen. Screening og testning af adskillelige WIF emulgatorkandidater med henblik på emulsionsstabilitet og –viskositet under foruddefinerede betingelser med 33-50% vand og ved temperaturer på 40°C og 55°C resulterede i en prioriteret række af emulgatorer, der havde potentiale som kandidater til WIF teknologien; Emul 8, Emul 2, Emul 4 og Emul 10.

10
Emul 8 og Emul 2 var meget jævnbyrdige kandidater på alle selektionskriterier. Blot krævedes der en marginalt højere dosis for at opnå en stabil emulsion med minimal sedimentation med Emul 2, derudover var dens viskositet ved stuetemperatur markant højere end Emul 8’s viskositet. Emulgatorens viskositet har indflydelse på pumpbarheden og dermed håndteringen på skibet.
Baseret på laboratorietestene blev Emul 8 anbefalet som førstevalg til videre forsøg på 4T50ME-X testmotoren.
Figur 4 Data for viskositet grupperet i hht. temperature og vandindhold. Motortests på 4T50ME-X
På grund af problemer med kraftig korrosion af nøglekomponenter i brændstofsystemet ved brug af Emul 8, og da den ydermere viste en høj tilbøjelighed for faseinvertering ved høje vandindhold, blev det besluttet at fravælge denne emulgator. I stedet blev Emul 2 testet mere grundigt. Emul 2 var i stand til at danne emulsioner med store mængder vand (tæt på 50%) uden nogen synlig negativ indflydelse på motorens stabilitet, udtrykt ved både uændret cylinder-til-cylinder variation og uændret cyklus-til-cyklus variation, Figur 5. Et studie med henblik på minimering af emulgatortilsætningen demonstrerede at dosering helt ned til 0,2% emulgator (på basis af brændselsolie) ikke havde nogen synlig negativ indflydelse på motorperformance og stabilitet.

11
8.4E+06
8.6E+06
8.8E+06
9.0E+06
9.2E+06
9.4E+06
9.6E+06
9.8E+06
0 47 63 91
Maxim
um cylinder pressure (Pa)
Water vol. ratio (%)
Cyl 1 Cyl 2 Cyl 3 Cyl 4
Figur 5 Målt maksimalt cylindertryk (middel) for hver cylinder, som funktion af vandindhold. Cyklus-til-cyklus variationen er udtrykt som 95% konfidensintervaller (error bars). Dedikerede shut-down tests viste at testmotoren kunne stoppes og startes igen, når der blev anvendt en vand-i-olie emulsion med et vand-brændselsolie forhold på 0,70 (41% vand totalt) og en emulgatortilsætning på 0,2%, både med og uden recirkulering i brændstofsystemet under motorstop. Emulgatorforfining
På baggrund af fravalget af Emul 8, og de succesfulde resultater med Emul 2, blev der gennemført yderligere laboratorieudvikling med henblik på at gøre Emul 2 nemmere håndterbar. Viskositeten af Emul 2 blev reduceret for at kunne pumpe den under normale temperaturforhold. Den forfinede version af Emul 2, #072, blev også succesfuldt testet på 4T50ME-X. Emissionsreduktionspotentiale
Motortests med det formål at kortlægge emissionsreduktionspotentialet for WIF er også gennemført. Forsøgene viser at både NOx-, CO- og sod-udledningen reduceres markant, når der tilføres vand til brændselsolien. Den specifikke udledning af NOx reduceres op til 60% ved anvendelse af de højeste tilsatte vandmængder, Figur 6.

12
Figur 6 Målt specifik udledning af NOx som funktion af vandindhold. Resultaterne er fra tests på 4T50ME-X. Tidligere forsøg med udstødsgasrecirkulering viste, udover en meget markant reduktion af NOx, at CO og sodudledningen stiger markant, specielt ved høje recirkulationsgrader, hvorimod udledningen af uforbrændte kulbrinter falder moderat. For WIF ses det modsatte billede: CO og sodemissionen falder, hvorimod uforbrændte kulbrinter stiger marginalt. Ved at kombinere de to metoder har test demonstreret at det er muligt at opnå en ekstremt lav NOx-udledning (mere end 98% reduktion ned til 0.2 g/kWh), men samtidigt med mere eller mindre uændret udledning af både CO og uforbrændte kulbrinter.

13
Summary and conclusions
Background and objectives
It is estimated that the marine industry is responsible for the transport of approx. 90% of all goods in the world. Although being the most carbon and energy friendly transportation method available today international shipping contributes to approx. 2.7% of the world carbon emission (from human sources). Further, due to the very high combustion temperature and pressure inside modern marine engines as well as the general lack-of-use of exhaust gas after-treatment methods such as catalytic methods known from the car and truck industry e.g. three-way catalytic converter and selective catalytic reduction (SCR), the contribution to global emissions of nitrogen oxides (NOx) from shipping is relatively large. As a result more and more tightened regulations are entering into force worldwide through the International Maritime Organisation (IMO), both with reduced limits for NOx emissions, but also with the allowed content of sulfur in the fuel being progressively lowered in order to reduce SOx and particulate emissions. Further emission control areas (ECAs) with even tightened legislation have been designated by IMO. Apart from the IMO regulation, other national, regional and local regulation, taxation and incentive schemes drives the request for emission reduction. Also, demands from costumers and shipping’s aim in being an environmentally responsible industry are sparking an interest in emission reduction beyond regulatory requirements. The method of adding water to the fuel, from now on termed water-in-fuel emulsion or WIF, prior to injection into the combustion chamber of direct injection diesel engines, is an effective way of reducing the flame temperature, thereby suppressing the formation of NOx. WIF has been tested in the past on large two-stroke diesel engines but most experience is limited to the usage of residual fuel oils which inherently emulsifies, at least, moderate amounts of water, due to their distinct physical properties. On the other hand distillate fuel oils will become more widely used, especially in the IMO designated SECAs, due to limited availability of residual fuel oils meeting the strict sulfur regulation inside these areas. In order to create stable water-in-fuel emulsions with distillate fuels a suitable emulsifier is required. This has served as the main motivation for conducting the work described in the present report. Thus the main objective is to find an emulsifier which enables the emulsification of large quantities of water (up to 50%) into distillate fuels, while still allowing safe and reliable operation of the engine and without any significant deterioration of the engine stability. Further objectives are a mapping of emission reduction potential of WIF utilising distillate fuels as well as investigating the potential synergy effects by combining WIF with exhaust gas recirculation (EGR), another effective NOx reduction method.
The study
The work conducted within the framework of the present project has been divided into two parts. The first part is devoted to the screening and

14
development of suitable emulsifiers. This work is conducted by Danisco in their laboratories. The objective of this part is to find a few emulsifiers candidates, which, based on the lab results appear to have the potential of fulfilling the main objective of the project. The second part of the study is the actual testing of the emulsifier candidates, as found by Danisco, on the MAN B&W Diesel 4T50ME-X test engine located at MAN Diesel & Turbo in Copenhagen. Within these tests the lab results are extrapolated in a scaled-up scenario which closely resembles the conditions met on real production engines used for marine propulsion. The objective of the engine tests is to demonstrate the stability and the reliability of the engine when operated on WIF.
Results and main conclusions
Laboratory tests and development
Numerous tests have been performed on a number of emulsifiers, including both commercial available products and products synthesized specifically for the purpose, to select the best emulsifier candidates for future a WIF application for large two stroke diesel engines. Laboratory tests have been conducted to elucidate the different properties of the emulsions, of which stability over time, including observations of tendency of phase separation and viscosity are the most important. In Figure 1 the numbers of WIF-emulsions made on each of the tested emulsifier are visualized. On each emulsion numerous analyses, such as static and dynamic interfacial tension, water droplet size distribution, Confocal Laser Scannings Microscopy (CLSM) for investigation of water droplet dispersion in the emulsion, monitoring of visual stability and rheological studies were performed. Figure 1 also gives a picture of the selection process, through the number of emulsions and tests conducted on each emulsifier. A small numbers of emulsions and analyses indicate poor emulsion properties and an early rejection.
Figure 1 Histogram of different emulsifiers and the corresponding numbers of emulsions made with the specific emulsifier. One of the most important selection criteria for the emulsifiers is their property to stabilize the emulsion over time. The emulsion is not supposed to phase separate with distinct and separated water and diesel oil phases. Besides it is desirable to minimize the sedimentation of the dispersed water droplets in the diesel oil. In figure 2 examples of a stable emulsion, with homogeneously dispersed water droplets, resulting in a homogeneously white emulsion, an

15
emulsion with sedimentation, and a phase separated emulsion, with free water in the bottom of the bottle, are shown. The emulsion can also be characterized by microscopy (CLSM) as shown in Figure 3, where examples of CLSM microscopy of a stable emulsion (left) with homogeneously dispersed water droplets and an unstable emulsion (right), with very big water droplets indicating future coalescence and phase separation.
Figure 2 Emulsions; (left) Stable emulsion, (middle) Emulsion with sedimentation, (right) Emulsion with phase separation.
Figure 3 Confocal Laser Scanning Mikroskopi (CLSM) of Emul 2 (left) and Emul 1 (right). The diesel oil is stained with a red dye and the water is stained with a green dye. Emul 2 is an example of an emulsifier with excellent emulsifier properties and Emul 1 is an example of an emulsifier with poor emulsifier properties. Viscosity is also a very important parameter in the selection of emulsifiers. In Figure 4 an example of viscosity as a function of emulsifier type and concentration, but most importantly water amount and temperature, is shown. Note that the water content has bigger impact on the viscosity than the temperature. Within predefined conditions of 33-50% water and temperatures at 40°C and 55°C the screening and testing of the numerous WIF emulsifier candidates were done, with specific focus on emulsion stability and viscosity. These tests resulted in a prioritized list of emulsifiers that were selected as candidates for the WIF technology; Emul 8, Emul 2, Emul 4 and Emul 10. On all selection criteria Emul 8 and Emul 2 were very equal candidates. The only discrepancies were dosage/response and the fact that Emul 2 had a

16
higher viscosity and was not pumpable at room temperature. The viscosity of the emulsifier will influence the manageability of the emulsifier on the ship. Based on the laboratory test results Emul 8 was recommended as a first choice for further trials at 4T50ME-X test engine.
Figure 4 Pooled data for viscosity grouped according to temperature and water content. Engine tests
Due to severe corrosion problems when using Emul 8 and additional problems with phase inversion at higher water contents this particular emulsifier was disregarded, and emulsifier no. 2 was tested more thoroughly instead. Emulsifier no. 2 proved to accommodate large quantities of water into the fuel phase (up to a water-to-fuel ratio of 0.91) with no significant deterioration of neither the cylinder-to-cylinder variation nor the cycle-to-cycle variation cf. Figure 5. It was also demonstrated that the amount of emulsifier could be reduced to approx. 0.2 % (on the basis of fuel) also without any negative impact on the performance and stability of the engine.

17
8.4E+06
8.6E+06
8.8E+06
9.0E+06
9.2E+06
9.4E+06
9.6E+06
9.8E+06
0 47 63 91
Maxim
um cylinder pressure (Pa)
Water vol. ratio (%)
Cyl 1 Cyl 2 Cyl 3 Cyl 4
Figure 5 Measured cylinder pressure for each cylinder as a function of water content. Error bars indicate 95% confidence intervals. Shut-down tests demonstrated that the engine could be restarted when operated on a water-to-fuel ratio of 0.70 and with an emulsifier dosage of 0.2% of the fuel both with and without the fuel system recirculation pumps. Emulsifier refinement
As a consequence of the outcome of the trials at MAN Diesel and subsequent rejection of Emul 8, an optimization programme was scheduled for Emul 2. The viscosity of Emul 2 was decreased in order to make it pumpable at a lower temperature. The optimized version of Emul 2, #072, has also been tested successfully on the 4T50ME-X test engine. Emission reduction potential
Engine tests devoted to the mapping of the emission reduction potential of the WIF method effectively demonstrate that both NOx, CO and soot emissions are reduced when water is added to the injected fuel. The reduction in NOx emission (in g/kWh) is approaching 60% at the highest water content applied at 50% load cf. Figure 6.
Figure 6 Measured specific NOx emission as a function of applied water content in the fuel. Results are from engine tests on the 4T50ME-X test engine.

18
From recent EGR results it is observed that generally the CO and soot emissions increase while the emission of HC decreases slightly. For WIF the opposite is experienced i.e. increased emissions of HC but significantly reduced CO emissions. By combining the two methods extremely low NOx emissions (down to 0.2 g/kWh) have been achieved while the emissions of CO and HC remained at the low levels usually observed from large two-stroke diesel engines. The NOx reduction achieved during these tests are well above 90% reduction, in some cases above 98%.

19
1 Introduction
1.1 Emissions from international shipping
It is estimated that the marine industry is responsible for the transport of approx. 90% of all goods in the world. Although being the most carbon and energy friendly transportation method available today (see Figure 7) international shipping contributes to approx. 2.7% of the world carbon emission (from human sources), see Figure 8. However due to the very high combustion temperature and pressure inside modern marine engines as well as the general lack of applied exhaust gas after-treatment methods such as catalytic methods known from the car and truck industry e.g. three-way catalytic converter and selective catalytic reduction (SCR), the contribution to global emissions of nitrogen oxides (NOx) from shipping is relatively large, actually comparable in magnitude to that of road traffic (Eyring, Corbett, Lee, & Winebrake, 2007).
Figure 7 CO2 emission per unit load by transportation method. Adapted from (MAN Diesel & Turbo, 2008) with data from (Buhaug, et al., 2009)
Figure 8 Global carbon emissions by source. Figure adapted from (MAN Diesel & Turbo, 2010) with data from (Buhaug, et al., 2009).

20
1.2 Legislation
As a natural consequence the exhaust gas emissions from shipping have been subject to legislation from the International Maritime Organisation, the designated UN body for regulation of international shipping, through MARPOL Annex VI. MARPOL Annex VI contains regulation on NOx, SOx and Particulate Matter (PM) emissions. On July 1st 2010 the revised MARPOL Annex VI entered in to force. The revised Annex contains new limits on NOx emissions for both new and existing ships and on SOx and PM emissions for all ships. NOx emissions from new engines installed on ships are regulated by the Tier I, II and III limits, respectively. Date of ship construction determines which limit is applicable for an engine. Figure 9 summarises the NOx emission limits for marine engines. Large two-stroke diesel engines usually have an engine speed below 130 rpm. Tier I is for ships constructed between January 1st 2000 and December 31st 2010. Tier II is for ships constructed after January 1st 2011.
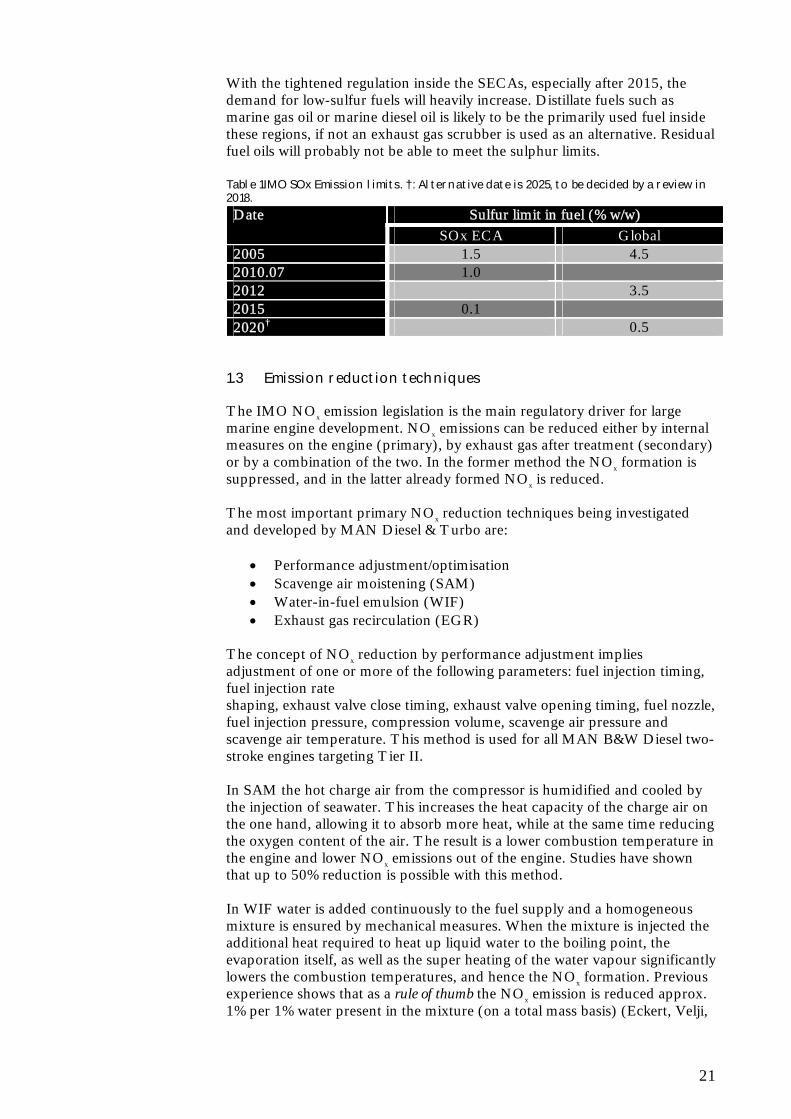
Figure 9 IMO NOx limits. Figure adapted from (MAN Diesel & Turbo, 2008). Tier III NOx regulation, entering into force 2016, for new build ship is applicable in Emission Control Areas (ECA) only. An Emission Control Area is any sea area designated as such by IMO based on certain criteria and procedures. Apart from the IMO regulation, other national, regional and local regulation, taxation and incentive schemes drives the request for emission reduction. Also, demands from costumers and shipping’s aim in being an environmentally responsible industry are sparking an interest in emission reduction beyond regulatory requirements. The revised MARPOL Annex VI also includes significantly tightened limits on SOx and PM emissions. The emissions are regulated through a limit on fuel sulfur content. However, as it is allowed to fulfil the sulfur regulation by alternative means, the designer of an engine still needs to consider the safe operation of the engine when operating on fuels with sulfur content above the limit values. An alternative mean of reducing SOx and PM emission could be an exhaust gas after treatment scrubber (Andreasen & Mayer, 2007). Table 1 summarises the SOx and PM emission limits for marine engines, regulated through the fuel sulfur content.
21
With the tightened regulation inside the SECAs, especially after 2015, the demand for low-sulfur fuels will heavily increase. Distillate fuels such as marine gas oil or marine diesel oil is likely to be the primarily used fuel inside these regions, if not an exhaust gas scrubber is used as an alternative. Residual fuel oils will probably not be able to meet the sulphur limits. Table 1IMO SOx Emission limits. †: Alternative date is 2025, to be decided by a review in 2018.
Sulfur limit in fuel (% w/w) Date SOx ECA Global
2005 1.5 4.5 2010.07 1.0 2012 3.5 2015 0.1 2020† 0.5
1.3 Emission reduction techniques
The IMO NOx emission legislation is the main regulatory driver for large marine engine development. NOx emissions can be reduced either by internal measures on the engine (primary), by exhaust gas after treatment (secondary) or by a combination of the two. In the former method the NOx formation is suppressed, and in the latter already formed NOx is reduced. The most important primary NOx reduction techniques being investigated and developed by MAN Diesel & Turbo are:
Performance adjustment/optimisation Scavenge air moistening (SAM) Water-in-fuel emulsion (WIF) Exhaust gas recirculation (EGR)
The concept of NOx reduction by performance adjustment implies adjustment of one or more of the following parameters: fuel injection timing, fuel injection rate shaping, exhaust valve close timing, exhaust valve opening timing, fuel nozzle, fuel injection pressure, compression volume, scavenge air pressure and scavenge air temperature. This method is used for all MAN B&W Diesel two-stroke engines targeting Tier II. In SAM the hot charge air from the compressor is humidified and cooled by the injection of seawater. This increases the heat capacity of the charge air on the one hand, allowing it to absorb more heat, while at the same time reducing the oxygen content of the air. The result is a lower combustion temperature in the engine and lower NOx emissions out of the engine. Studies have shown that up to 50% reduction is possible with this method. In WIF water is added continuously to the fuel supply and a homogeneous mixture is ensured by mechanical measures. When the mixture is injected the additional heat required to heat up liquid water to the boiling point, the evaporation itself, as well as the super heating of the water vapour significantly lowers the combustion temperatures, and hence the NOx formation. Previous experience shows that as a rule of thumb the NOx emission is reduced approx. 1% per 1% water present in the mixture (on a total mass basis) (Eckert, Velji,

22
& Spicher, 2007). In the extreme case with a 50/50 mixture of fuel and water the expected NOx reduction is 50%. Some deviation from this rule of thumb has been observed (Henningsen, 1994; Pedersen, Andreasen, & Mayer, 2010) thus it should not be taken too literally and applicable to any condition. In EGR a part of the exhaust gas is re-circulated. After appropriate reduction of particulates and sulphur oxides it is mixed with the fresh intake air before entering the engine again. The presence of increased amounts of both CO2 and H2O adds heat capacity to the charge mixture. Further, the oxygen concentration is effectively decreased, which means that a larger amount of fresh charge must be entrained by the fuel spray for complete combustion to occur. Since both the specific heat capacity as well as the entrained mass increases, the result is lower combustion temperatures (the heat of combustion is dissipated into a larger amount of gas with a lower net temperature increase), and thus lower NOx emissions. Of the above methods EGR is the main candidate for targeting Tier III compliance. The potential of EGR has already been demonstrated on the 4T50ME-X test engine in Copenhagen, where Tier III NOx emission levels have been achieved. As stand-alone methods neither SAM nor WIF have the potential to fulfil Tier III, although a great potential for targeting intermediate NOx reductions is evident e.g. situations where local incentive schemes favour emission levels, say, below Tier II. The various emission reduction methods presented above are described in more detail in (MAN Diesel & Turbo, 2008; Pedersen, Andreasen, & Mayer, 2010; MAN Diesel & Turbo, 2010; Kjemtrup, 2007).
1.4 Previous experience with WIF and future challenges
Of the three methods WIF, SAM and EGR, WIF is by far the method investigated most thoroughly in relation to NOx reduction on large two-stroke diesel engines. MAN Diesel & Turbo has a year long experience dating several decades back. Experience comes from numerous tests both on the 4T50ME-X test engine as well as on production engine on test-bed. Further, stationary engines for power generation have been operated on WIF for years, and recently sea trial tests with WIF were conducted on the APL ship Singapore Express. The method is described in the MAN Diesel & Turbo two-stroke engine project guides (MAN Diesel & Turbo, 2010) as well as complete installation diagrams are available (cf. Figure 10).

23
Figure 10 Fuel oil system diagram including WIF unit (water addition and homogeniser unit). Adapted from (MAN Diesel & Turbo, 2008) WIF is intended mainly for residual fuels also referred to as heavy fuel oil. The high viscosity (usually around 10-15 cSt at operating conditions) as well as the close match in density between water and fuel assists in stabilising the water droplets inside the fuel matrix (see Figure 11). Further, and maybe more important, heavy fuel oils may have a content of natural surfactants, e.g. asphaltenes, which stabilise the fuel/water interface and prevent coalescence (Abivin, Henaut, Chaudemanche, Argillier, Chinesta, & Moan, 2009; Quintero, Noïk, Dalmazzone, & Groissiord, 2009). WIF is not possible for distillate fuels e.g. marine gas oil (MGO) or marine diesel oil (MDO) without using an appropriate emulsifying agent. Fuel properties for marine distillate fuels are given in Table 2. Table 2 Properties of distillate marine fuels according to ISO 8217 fuel standard 2010 edition (http://www.dnv.com/industry/maritime/servicessolutions/fueltesting/-fuelqualitytesting/iso8217fuelstandard.asp).
Parameter Unit Limit DMX DMA DMZ DMB
Viscosity at 40°C mm²/s Max 5.500 6.000 6.000 11.00
Viscosity at 40°C mm²/s Min 1.400 2.000 3.000 2.000
Micro Carbon Residue at 10% Residue % m/m Max 0.30 0.30 0.30 -
Density at 15°C kg/m3 Max - 890.0 890.0 900.0
Micro Carbon Residue % m/m Max - - - 0.30
Sulphur a % m/m Max 1.00 1.50 1.50 2.00
Water % V/V Max - - - 0.30 b
Total sediment by hot filtration
% m/m Max - - - 0.10 b
Ash % m/m Max 0.010 0.010 0.010 0.010
Flash point 0°C Min 43.0 60.0 60.0 60.0
Pour point, Summer 0°C Max 0 0 0 6
Pour point, Winter °C Max -6 -6 -6 0
Cloud point °C Max -16 - - -
Calculated Cetane Index Min 45 40 40 35
Acid Number mgKOH/g Max 0.5 0.5 0.5 0.5

24
Oxidation stability g/m3 Max 25 25 25 25 c
Lubricity, corrected wear scar diameter (wsd 1.4 at 60°C) d
µm Max 520 520 520 520 c
Hydrogen sulphide e mg/kg Max 2.00 2.00 2.00 2.00
Appearance Clear & Bright f b, c
a A sulfur limit of 1.00% m/m applies in the Emission Control Areas designated by the International Maritime Organization. As there may be local variations, the purchaser shall define the maximum sulphur content according to the relevant statutory requirements, notwithstanding the limits given in this table. b If the sample is not clear and bright, total sediment by hot filtration and water test shall be required. c Oxidation stability and lubricity tests are not applicable if the sample is not clear and bright. d Applicable if sulphur is less than 0.050% m/m. e Effective only from 1 July 2012. f If the sample is dyed and not transparent, water test shall be required. The water content shall not exceed 200 mg/kg (0.02% m/m).
Distillate fuels have a lower density than water i.e. the water droplets will have a much higher tendency for sedimentation, as well as the lower viscosity of the distillate fuels fail to maintain the water droplets dispersed. This is effectively illustrated in Figure 12 which shows very rapid sedimentation of water in the case of light fuel oils. Increasing the viscosity (cooling or switching from MGO to MDO) seems to hamper the sedimentation somewhat, although not sufficient. This clearly emphasises the need for an appropriate emulsifying agent if the light/distillate fuel oil fractions should enable WIF for NOx reduction.
Figure 11 Light transmission micrograph of a heavy fuel oil sample with dispersed water droplets.

25
Figure 12 Tests of emulsion stability of MGO and MDO. The bottle with the brownish content is the DMB fuel with a temperature of 22oC with a viscosity of 5 cSt at 40oC, the bottle in the middle is the MGO at a temperature of 5oC, and the bottle to the left is MGO at a temperature of 22oC. The water content in all bottles is approx. 50 vol. % on a total basis. The left image is at t=0 and the right image is at t=2 min. With the designation of the main coastal waters of both USA and Canada as ECA expected to enter into force by 2012 the geographical coverage of present and future ECA are increased significantly. It is estimated that 20% of the world goods are transported on North American waters (Marine Environment Protection Commitee, 2009). A nomination of the Mediterranean Sea has also been proposed (Friedrich, Heinen, Kamakaté, & Kodjak, 2007). The North Sea, The Channel, Kattegat, and the Baltic Sea are amongst the most trafficked waters (Kaluza, Kölzch, Gastner, & Blasius, 2010). Due to the heavy tightening of the fuel sulphur limit in SECA the usage of distillate fuel in these regions are expected to increase. In the light of the large portion of the world shipping taking place in present and future SOx ECA, it is pivotal that suitable emulsifiers are developed in order for WIF to be an attractive method for NOx reduction both worldwide but certainly also in ECA. This serves as the main motivation for conducting the work presented in the present report.
1.5 Structure of the report
The structure of the present report is as follows. Chapter 2 presents the laboratory emulsifier experiments. A number of different emulsifiers, both commercially available as well as newly developed, are screened in relation to their ability to facilitate stable water emulsions in marine gas oil. A variety of different experimental techniques are invoked in order to qualify the ranking and selection of the most promising candidates for further tests. The experiments identify two different emulsifiers which show good potential for further realistic test on a research engine. Chapter 3 presents the testing of the emulsifier candidates identified in chapter 2. The emulsifiers are used to produce water-in-fuel on-the-fly and the emulsion is used as fuel on the 4T50ME-X four cylinder two-stroke diesel test engine. The setup of the test engine as well as the auxiliaries for emulsification are described. In order to judge the performance of the emulsifiers various criteria are defined for benchmarking the engine response (compared to a reference were the engine is run of pure fuel). Additional optical investigations using high-speed photography of the combustion process are included to elucidate the effect of water on the combustion characteristics.
26
In chapter 4 the emission reduction potential of WIF is mapped at various engine loads. The effect of water concentration on specific fuel oil consumption, emissions of NOx, unburned hydrocarbons, CO, smoke and particulate matter is shown. With water contents approaching 50/50 water and fuel the NOx reduction approaches 60%, with significant reduction of CO and smoke as well. The emission reduction comes at a cost of increased specific fuel oil consumption (SFOC), primarily originating from the energy required for evaporating the injected water. Results of tests combining WIF with EGR show huge reductions in NOx while the CO emission is kept at an acceptable level. At the highest water content and EGR rate the NOx emission is reduced to 0.2 g/kWh (Tier III: 3.4 g/kWh) which is >98% compared to the reference case with no EGR and no water. However, again the cost is a significant increase in the specific fuel oil consumption.

27
2 Emulsifier selection
2.1 Introduction
2.1.1 Background
A crucial success criterion to the WIF technology is the emulsifier, which must secure a stable emulsion of water and marine gas oil (MGO), from the very preparation of the emulsion to the combustion in the cylinder. The emulsion should also endure recirculation of the fuel, in case of engine stand by, and shut downs of the engine where no recirculation can be expected. These requirements make huge demands as to the properties of the emulsifier, securing a stable emulsion. Another important factor is the viscosity of the emulsion, influenced by the water content and the temperature but also by the water droplet sizes of the emulsion; the latter being determined by the emulsifier. Hence the selection of the optimal emulsifier is a crucial step for the success of the WIF technology. The overall objective for Danisco was to identify an emulsifier candidate for use in water-in-fuel emulsions for two stroke marine engines. The selected emulsifier should be able to stabilize a WIF emulsion under variable conditions of water content and temperature, reflecting the operating conditions of the engine. In this chapter the studies performed by Danisco A/S from November 2009 to December 2010 are reported. 2.1.2 Emulsifier chemistry
The crucial part of the WIF technology is selecting an appropriate emulsifier that creates a stable water-in-fuel emulsion; an emulsion where the two phases (water and fuel) are homogeneously mixed, with one phase being the dispersed phase (water) and the other phase being the continuous phase (fuel). Stability of an emulsion is highly dependent on the properties of the emulsifier. Emulsifiers are products consisting of a distinct polar (hydrophilic) and non polar (lipophilic) fraction and these chemical properties make them capable of facilitating the blend of polar and non polar molecules. Danisco is a leading global manufacturer of emulsifiers for food and non food applications. All products are bio based, made from vegetable oil from e.g. palm, soy, sunflower, castor or rape seed. Since the commercial produced emulsifiers of Danisco are all lipid based, they are highly lipophilic. The fuel, the marine gas oil consists of alkanes which are lipophilic molecules, hence lipophilic emulsifier are very appropriate for the purpose. A highly hydrophilic emulsifier, as most detergents, would not be suitable for a WIF emulsion. The polar part of the emulsifier origins from various functional groups, like alcohol groups. The properties of emulsifiers are characterized by this hydrophilic/lipophilic balance, called the HLB-value; emulsifiers with low HLB-values are highly lipophilic and are used for water in oil emulsions,

28
optimally HLB [4;6], whereas emulsifiers with high HLB-values are highly hydrophilic and used in oil in water emulsions, HLB [8;18]. The emulsifier operates in the interface of the two phases, the polar part has affinity towards the polar phase (water) and the non polar part has affinity towards the non polar phase (fuel). One phase will be covered by emulsifier molecules and is forced into droplets which are dispersed in the other phase. This dispersion of water droplets is a very important element in the stability of the emulsion over time; bigger droplets having a stronger tendency for sedimentation. A stable emulsion is to some degree characterized by the water droplet sizes; hence the measurement of the distribution of water droplet sizes is a valuable tool in assessing expected stability of the emulsion. 2.1.3 Emulsions
The most crucial property of an emulsifier is the ability to stabilize the emulsion. A stable WIF emulsion is illustrated in Figure 13.a. where the yellow phase represents the Marine Gas Oil (MGO); the blue water droplets are dispersed homogeneously in the MGO. In the case that the emulsifier is under dosed or if it is not appropriate for the purpose with a wrong HLB-value, the process of phase separation will start. This process is schematized in Figure 13. The blue water droplets in (a) is homogeneously dispersed in a WIF emulsion in a stable emulsion. If the water droplets start to flocculate as in (b) and eventually coalesce, illustrated in (e), the emulsion breakdown (f) is inevitable. The phenomenon illustrated in Figure 13 explains why water droplet size distribution is a valuable tool in characterizing the tendency of an emulsion to sediment and eventually phase separate. The water droplet size distribution measured by NMR is also a factor having an impact on the viscosity of the emulsion; smaller water droplets give a better distributed continuous network of water droplets in the emulsion, contributing to an increase in viscosity.
(a) Stable Emulsions (b) Flocculation (c) Beginning
sedimentation
(d) Partial Coalescence (e) Coalescence and
sedimentation (f) Emulsion breakdown – phase separation
Figure 13 Emulsion break down leading to phase separation. Yellow = MGO, blue = water droplets Another phenomenon that absolutely must be avoided is phase inversion. This happens if the two mixed phases swift their respective roles as continuous and dispersed phase; illustrated in Figure 14. Phase inversion will have an impact on the viscosity, which is strictly specified to max 20 cSt.

29
More severely the water itself could have a corrosive effect on the engine. Phase separation must in all instances be avoided.
Figure 14 Phase inversion; Blue = water, yellow = MGO droplets 2.1.4 Objective
The project objectives for Danisco were: • Identify one or more emulsifier candidates that ensure a stable WIF
emulsion within the given combined conditions of 33% / 50% water and temperatures of 40°C / 55°C. The stability of the WIF emulsion measured as minimum sedimentation and absence of phase separation.
• A WIF emulsion viscosity of maximum 20 cSt. • By use of appropriate laboratory tests document the properties and effect
of emulsifiers according to specifications. • Test the emulsifier on the MAN B&W Diesel 4T50ME-X four cylinder
test engine located in Copenhagen and obtain a stable emulsion complying with specifications.
Theoretically the HLB-value of an optimal emulsifier for a WIF emulsion, with MGO as the continuous phase, should be in the range of 4-6, but since the selection criteria also included fluidity of the emulsifier more emulsifiers and combinations of different emulsifiers outside this range were tested. We also had to take into consideration that if the HLB value was too low, and consequently the solubility of the emulsifier in the MGO was too good, it would diminish the surface tension activity of the emulsifier, leading to a less stable emulsion. In total 11 emulsifiers in the HLB range [3; 10] were tested. The material included both existing commercial products, modified commercial products and products engineered for the specific purpose. The selection of emulsifier should primarily be based on tests that characterize the emulsifier’s ability to make a stable emulsion, with minimal sedimentation and no phase separation and keep the viscosity of the emulsion according to specification.
2.2 Experimental
2.2.1 Laboratory test conditions
Test conditions and specifications were defined by MAN Diesel and reflected parameters and conditions in the fuel system of a two-stroke-engine. The specifications are listed inTable 3.

30
Table 3 Emulsion specifications
Parameter Specification limits Water content 33% and 50% based on the emulsion
Temperature 40°C and 55°C
Viscosity Max 20 cSt Stability* >one hour; internally at Danisco set
to three hours in the laboratory test program
* At first stability criteria included both avoidance of sedimentation and phase separation. Later it was specified that sedimentation was acceptable as long as it was reversible by agitation.
2.2.2 Materials
Emulsifiers Table 4 Emulsifiers
Emulsifier
Characteristics
1 Commercial product 2 Commercial product 3 Commercial product 4 Commercial product 5 Synthesized product 6 Commercial product 7 Synthesized product 8 Commercial product 9 Synthesized product 10 Combination of #1 and #3 in various mixing ratios
11 Optimization of #2 as to viscosity. Named 072 in trials. All emulsifiers were in the HLB range [3;10] Marine Gas Oils Table 5 Marine Gas Oils
Marine Gas Oil Characteristics
MGO I Marine Gas Oil – batch I
MGO II Marine Gas Oil – batch II
MGO III Diesel Oil MGO IV Diesel Oil Carb
MGO Shell Shell Thermo Heating Oil 2.2.3 Methods
To evaluate the performance of emulsifier no. 1-10, we had to select analytical methods that were indicative of the stability and the viscosity which are the most important characteristics of an emulsion. These parameters are very descriptive for the properties and usability of a specific emulsifier in a certain application. The following analytical methods were used to evaluate the emulsion stability and viscosity.

31
Visual monitoring for sedimentation and phase separation. Microscopic evaluation of homogeneity by confocal laser scanning
microscopy (CLSM) Water droplet size distribution by nuclear magnetic resonance (NMR) Viscosity measurements of the emulsion
However more methods give valuable information about the emulsifier properties, such as the measurement of interfacial tension, hence this method was also included in the analytical program. In the following the applied methods are described. 2.2.3.1 Interfacial tension A high interfacial tension between two immiscible phases impedes the formation of an emulsion. Higher energy input is required to form an emulsion with small droplet sizes and the high interfacial tension enhances the instability of the emulsions. It is therefore crucial that the interfacial tension between the two phases is reduced significantly by the emulsifiers. The static interfacial tension between MGO and demineralized water was measured using a Kruss KT 10 Tensiometer. The method is able to measure the interfacial tension between two different phases from 1-2 min after creation of a new interface. Tests were performed at 40°C with addition of 0.2% emulsifier to the MGO. The dynamic interfacial tension was measured by means of drop shape analysis using a DSA 100 Drop Shape Analyzer. The method is able to record and analyze the interfacial tension a few seconds after drop formation of one phase into the other and follow the change in the interfacial tension over time. Same sample set up was used as for static interfacial tension.
Figure 15 DSA 100 Drop Shape Analyzer 2.2.3.2 Emulsion stability The emulsions were stored at 40°C/55°C and monitored for 3 hours. Samples were evaluated macroscopically and photographed. Selected samples were evaluated again after an extended period of hours or days. Two phenomena are indicative of the stability: (1) water droplet sedimentation due to gravity force/difference in density between water and MGO and (2) water separation due to coalescence of the water droplets. The methodology of water droplet separation is described in section 2.2.3.4. Sedimentation was initially regarded as a problem but during the project and in agreement with MAN Diesel & Turbo, it was concluded that it was a less serious problem provided that no water separation took place. If

32
sedimentation was reversible by gentle agitation it would cause no problem for the engine, since the fuel present in the fuel system can be recirculated during engine shut-downs. Examples of stable and unstable emulsions are shown in Figure 16. The stable emulsion (A) is white due to the homogeneously dispersed water droplets that reflect the white light; a similar phenomenon is seen in milk. In (B) the white water droplets have sedimented. The unstable emulsion (C) is phase separated and at the top free MGO is visible and at the bottom is free water.
Figure 16 Emulsions; (left) Stable emulsion, (middle) Emulsion with sedimentation, (right) Emulsion with phase separation 2.2.3.3 Microscopy Microscopic evaluation of homogeneity was performed on a Confocal Laser Scanning Microscope (CLSM) using Nile Red for diesel staining and FITC for water droplets staining, hence diesel appear red and water droplets appear green. The microscopy (magnification x100) gave an insight into how homogeneously the water droplets were dispersed into the MGO. Microscopy was performed just after emulsification. 2.2.3.4 Water droplet size distribution The water droplet size distribution is measured by Nuclear Magnetic Resonance (NMR) and it is a valuable tool in getting an indication of the stability and viscosity of the emulsion. In this work the results are given the 50% quantile (D50 µm). Target was not included in specifications but internal target for D50 were set in the vicinity of ≈10-12µm. 2.2.3.5 Viscosity / Rheology As mentioned viscosity and stability are the most important parameters in assessing the applicability of the emulsifier. The viscosity specification of the emulsion was 20 cSt equivalent to 18-20 mPas, dependent on the amount of added water. The viscosity was measured on a Physica Rheoplus rheometer with a cylinder measuring system. A flow curve was measured for selected emulsions just after preparation in the shear rate range of 10-2000 1/s to assess the viscosity in the Newtonian part of the curve.

33
Figure 17 Physica Rheoplus Rheometer 2.2.4 Test program
The test program was build up of the steps described in Table 6. Table 6 Test program – trials and corresponding methods
Purpose Description Methods applied
Static interfacial tension
1 A first selection of Emulsifier no. 1-10
Dynamic interfacial tension
Visual stability 2 Effect of emulsifier dosage on water droplet size distribution
Water droplet size distribution
NMR
3 Effect of emulsifier dosage on viscosity
Viscosity measurement
Rheology
4 Effect of water content on viscosity
Viscosity measurement
Rheology
Visual stability
CLSM Microscopy
Water droplet size distribution
NMR
5 Emulsifier dosage response study
Viscosity measurement
Rheology
Visual stability
Viscosity measurement
Rheology
6 Decrease the viscosity of Emul 2
CLSM Microscopy
34
The screening and selection process was supported by trials described in Table 7. Table 7 Supportive test program
Purpose Description Methods applied
Test of three types of homogenizers - Ultra Turrax - Silverson mixer - MicroFluidizer
7 Assessment of the impact of shear rate and shear time in the homogenization process on emulsion quality and stability
Viscosity measurement
Water droplet size distribution (NMR)
CLSM microscopy
Rheology
Water droplet size
distribution (NMR)
8 Various Marine Gas Oils
Viscosity measurement
Rheology
Visual stability 9 Test for phase inversion Viscosity
measurement Rheology
2.3 Results
2.3.1 General results
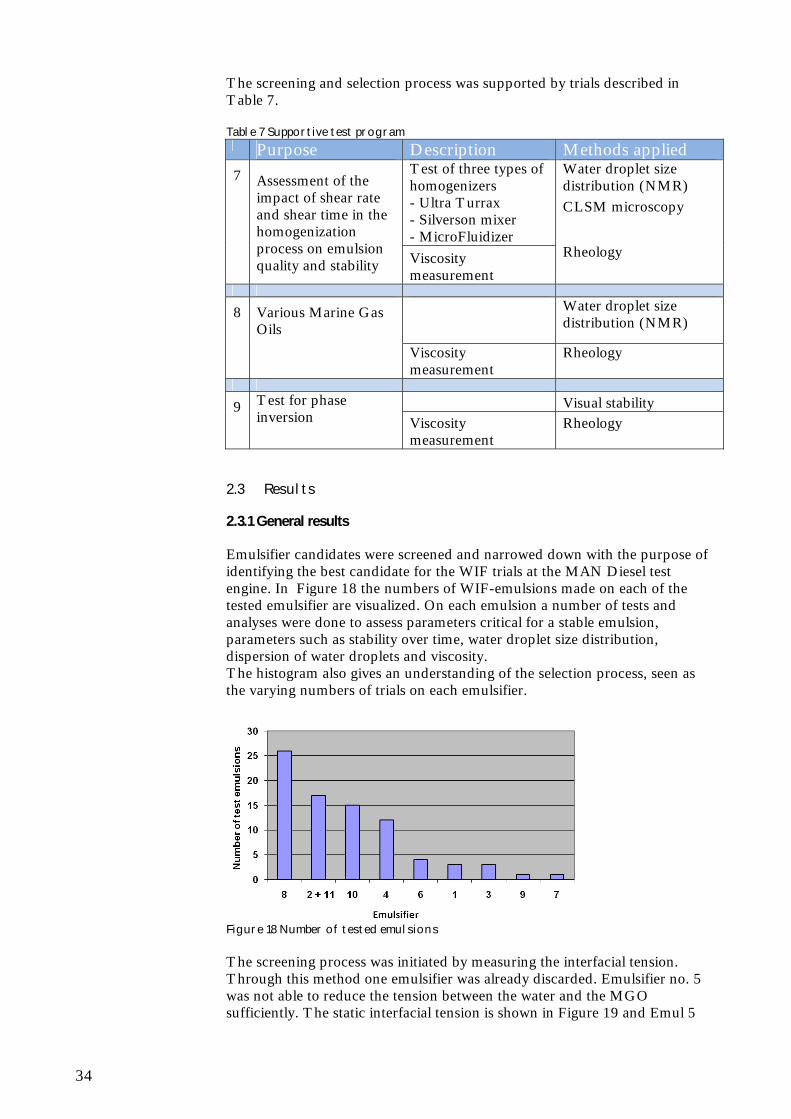
Emulsifier candidates were screened and narrowed down with the purpose of identifying the best candidate for the WIF trials at the MAN Diesel test engine. In Figure 18 the numbers of WIF-emulsions made on each of the tested emulsifier are visualized. On each emulsion a number of tests and analyses were done to assess parameters critical for a stable emulsion, parameters such as stability over time, water droplet size distribution, dispersion of water droplets and viscosity. The histogram also gives an understanding of the selection process, seen as the varying numbers of trials on each emulsifier.
Figure 18 Number of tested emulsions The screening process was initiated by measuring the interfacial tension. Through this method one emulsifier was already discarded. Emulsifier no. 5 was not able to reduce the tension between the water and the MGO sufficiently. The static interfacial tension is shown in Figure 19 and Emul 5

35
showed only a weak effect compared to the other emulsifiers that made a prompt response.
Figure 19 Static interfacial tension The first screening included a monitoring of the visual stability over days. Below is an example of a number of emulsions monitored for up to 4 days (emulsifier conc. 0.3%).
#1 #6 #2 #4 #3
(A) #1 #6 #2 #4 #3
(B) Figure 20 Degree of sedimentation and separation after 24 hours (A) and after 4 days (B) Emul 1 showed coalescence already after 24 hours, seen as free water at the bottom of the bottle. The same phenomenon was seen for Emul 3 after 4 days. These poor properties in preventing complete emulsion break down were confirmed in water droplet size distribution studies, as very large droplet sizes. Figure 19 also shows a good performance of Emul 2, and even though there is some sedimentation (white water droplets in the bottom) cf. Figure 20, it is less pronounced than for the other emulsions. This is seen in the MGO fraction (upper green fraction) that for Emul 2 still contains some white water droplets. Through the screening process described in Table 6 it became apparent that four emulsifiers performed the best as to stability, viscosity and dosage/response. These emulsifiers were in order of priority Emul 8, Emul 2, Emul 4 and Emul 10. Since Emul 8 was superior in all tested parameters it was recommended as first choice for tests at MAN Diesels test engine. However, through the engine tests it was concluded that there were discrepancies between the laboratory tests and large scale engine tests and Emul 8 had to be rejected. The second best performing emulsifier was Emul 2, which had stability and viscosity performance at comparable level to Emul 8, the only minor issues were a higher dosage/response level and a physical

36
form which was not optimal as to pumpability. The latter property was optimized (see 2.3.3.1) and Emul 2 was tested on the MAN Diesel test engine with good results (see 3.2.4). In the following section, results from the screening process of Emul 8 and Emul 2 are presented as extracts and examples of the most important of the numerous trials are given. 2.3.2 Emulsifier #8
All emulsifiers were tested in all combinations of the standard conditions of 33% and 50% water and 40°C and 55°C, with primary focus on stability and viscosity. We have several tools helping predict the stability; by assessing the water droplet size distribution in the NMR equipment, the expected tendency for sedimentation and eventually phase separation could be estimated, explained in the illustrations in Figure 21. And since the emulsifier is an interfacial active ingredient the water droplet sizes will to some degree be influenced by the emulsifier concentration. From trials designed to estimate the dependencies of water droplet size to emulsifier concentration in the four combinations of water content and temperatures, it was concluded that there is a general trend that smallest droplets were achieved with high water content. Small droplets are indicative of a stable emulsion. Above a certain emulsifier concentration (approx 0.5% based on the emulsion) a plateau of a minimum droplet size was achieved. See Figure 21where the droplet size distributions dependencies of water content, emulsifier concentration and temperature are shown. The practical consequence of decreasing emulsifier concentration and hence increase droplet size is accelerating sedimentation, but no water separation was seen for the samples during the test period. The water droplet size distribution data is indicative for expected stability and the data was supported by visual stability monitoring for min. 3 hours.
Figure 21 Water droplet size diameter as a function of water content, temperature and emulsifier concentration In Figure 22 the sedimentation tendency as a function of water content is illustrated; (A) Emul 8 in 0.8% dosage, 50% water at 55°C gives a stable

37
emulsion without any sedimentation for 3 hours, whereas (B) Emul 8 in 0.8% dosage, 33% water at 55°C gives sedimentation after 2 hours. All emulsions were examined in the Confocal Laser Scanning Microscope. In this case the small difference in droplet size (6µm and 8 µm) was not visible in the microscope. Both emulsions showed a very smooth dispersion of the water droplets.
(A) Emul 8, 0.8%, 50% water,
55°C (B) Emul 8, 0.8%, 33% water,
55°C Figure 22 Examples of sedimentation tendency as a function of water content. It is seen that higher water content gives less sedimentation. A summarized correlation of the parameters is shown in Figure 23, where 3 hour stability and dependency on the concentration of emulsifier, water content and temperature is shown. The figure shows data for Emul 8, Emul 2 and 4. A minus (÷) indicates that the sample suffered from sedimentation and a (√) indicates that the stability is optimal with no sedimentation. From Figure 23 it is seen that Emul 8 secured the best stability at the lowest dosage compared to Emul 2 and Emul 4. The best performing dosages for Emul 8 was 1.3% at 33% water content and 0.8% dosage at 50% water content in the temperature range 40-55°C. It was a fact that if a certain degree of sedimentation could be accepted (but not water separation) the dosage of Emul 8 could be reduced approximately to the half amount. This was demonstrated in the engine trials, where the dosage was reduced significantly compared to the lab trials, since the sedimentation was not considered a problem. No phase separation was seen with any dosage of Emul 8 even at extended storage for days at 55°C.

38
Figure 23 Emulsifier dosage, water content and temperature impact on stability The water content and temperature also have an impact on the viscosity of the emulsion. The specification for the viscosity was 20 cSt equals 18-20 mPas (0% water-100% water emulsions). The viscosity specification was kept for all emulsions. Dependencies are summarized in Figure 24, where results are grouped according to water content and test temperature. The graph shows pooled data for Emul 8, Emul 2 and Emul 4. Again we see that water content has actually more influence than the temperature on the viscosity; the viscosity is more than twice as sensitive to changes in water content as a change in temperature.
Figure 24 Pooled data for viscosity grouped according to temperature and water content Due to the superior performance as to dosage-response and stability Emul 8 was recommended in the first place for tests in the MAN Diesel test engine in a dosage of 1.3% at 33% water content and 0.8% dosage at 50% water content in the temperature range 40-55°C.

39
However, as described earlier, Emul 8 had inexpedient properties that were revealed when it was tested in the test engine. During lab trials we saw a tendency of phase inversion, when water was added too fast to the MGO, and this phenomenon was also seen in some of the experiments performed at MAN Diesel with water contents above 33% of the emulsion. More severely the emulsion had corrosive tendencies, further described in section 3.2.2 Based on these results Emul 8 was rejected as candidate for a commercial product for WIF emulsions in two-stroke-engines. In the emulsifier screening process Emul 2 came out as second priority candidate. Through an optimization of its viscosity Emul 2 became a just as worthy candidate as Emul 8. Results of Emul 2 and its optimized version Emul 2/072 is described in 2.3.3.1, corresponding engine tests results are described in 3.2.3. 2.3.3 Emulsifier #2
Through the screening process it became evident that the Emul 2 performance, as to stability and viscosity, was comparable with Emul 8. The only deviating parameters were dosage-response and the fact that Emul 2 was not pumpable at room temperature. Using the NMR, the water droplet distribution, as a tool for predicting stability, again, as for Emul 8, a clear dependency of water content was seen for Emul 2; the higher water content giving lower water droplet sizes. The temperature is of second influence. Stability trials for Emul 2 were also based on stability monitoring for minimum 3 hours and CLSM evaluation. For the condition 33% water, 40°C there was some sedimentation (marked as a ÷ in Figure 23), however it was minor and did not happen in the condition 50% water, 50°C. Since sedimentation was considered a minor issue, this dosage (1.3%) was recommended as test dosage for all conditions. No phase separation was seen for any of the tested concentrations even at extended storage for days at 55°C. However, as for Emul 8, a tendency of phase inversion was seen in the laboratory, when water was added too fast to the MGO. Examples of CLSM evaluation is shown in Figure 25. To the left the CLSM of an emulsion made with Emul 2 shows a very smooth and homogeneous emulsion. For comparison a CLSM of an emulsion made with Emul 1, giving water separation over time is shown. It is obvious that the latter emulsion is characterized with very big, green water droplets, which was confirmed in NMR studies.

40
Figure 25 CLSM of Emuls 2 (left) and Emul 1 (right) For all parameters it was shown that the performance of Emul 2 in slightly higher dosages was comparable with Emul 8, the only major challenge for Emul 2 was the consistency. In the following the process of decreasing the viscosity of Emul 2 is described. 2.3.3.1 Decrease of viscosity of Emul No. 2. The practical use of Emul 2 was complicated by the non-pumpable consistency. To optimize the physical form of Emul 2 two different fluid modifications were therefore prepared and tested in lab scale. The two modified emulsifiers have unique fatty acid profiles; profiles which differ from the fatty acid profile of the original Emul 2. The two modified emulsifiers were able to stabilize the WIF emulsions in lab tests and they were both fluid at a significantly lower temperature than Emul 2. One of the modified emulsifiers was tested by MAN Diesel in September 2010. The two fluid modifications of Emul 2 differ in fatty acid composition. They were tested as all other emulsifiers with 33% and 50% water at 40°C and 55°C and evaluated with respect to interfacial tension, 3 hours stability, water droplet size distribution, CLSM microscopy and emulsion viscosity. The dynamic interfacial tension for the two modified emulsifiers was compared to Emul 2 and a pure MGO/water blend. The tension was reduced even faster and to a lower level with both modifications than with Emul 2, and it could be concluded that the interfacial activity was even better for the two modified products. The impact of water content and temperature on the viscosity of emulsions made with the two modified emulsifiers, named 060 and 072, was assessed and results are illustrated in Figure 26. The viscosity of the emulsions is well below 20 mPas, which is the max allowable viscosity for WIF emulsions. No difference is seen between the two emulsifier samples. The viscosity is mainly dominated by the water content and secondly by the temperature, exactly in line with previous experience for other tested emulsifiers, but not by the type of emulsifier.

41
0
2
4
6
8
10
12
14
16
18
060 072 Emul 2 060 072 Emul 2
New
ton
ian
vis
cosi
ty m
Pa
s
40°C
55°C
33% water
50% water
Figure 26 Emulsion viscosity. Viscosity of the emulsions depending on water content and temperature The crucial parameter for these two modifications of Emul 2 is how the viscosity depends on temperature. To measure this, a flow curve was recorded during cooling from 60°C to 5°C with 1°C/min. Results are shown in Figure 27. The graph should be read from right to left, following the cooling of the pure emulsifier. The dramatic increase in viscosity is due to the partly setting of the emulsifiers.
0
5
10
15
20
25
30
35
40
0 10 20 30 40 50 60
Temperature °C
Vis
cosc
ity
Pa
s 060
072
Emul 2
Cooling
Onset of viscidification
Figure 27 The onset of viscidification. Viscidification meaning dramatic increase in viscosity The graph illustrates the onset of viscidification of 060, 072 and Emul 2. The viscidification of 072 was decreased to +8°C. This is 17°C lower than Emul 2 that has an onset of viscidification at 25°C. Emulsifier 060 showed onset of viscidification at 12°C. A distinguished feature of the two modified products was the lack of phase inversion in the event of very high speed of water addition. This was an improvement compared to both Emul 2 and Emul 8. Based on the laboratory tests emulsifier 072 was selected for trials at MAN Diesel & Turbo in September 2010, this modified Emul 2 still being named Emul 2.
42
2.4 Conclusion
Numerous tests have been performed to document the performance and to select the best emulsifier candidate for a future WIF emulsion for two stroke marine diesel engines. In the present chapter a selection of these results has been presented. The screening and testing of several emulsifier candidates with respect to WIF emulsion stability and viscosity in predefined conditions of 33%-50% water and at temperatures of 40°C and 55°C resulted in four emulsifiers that could fulfill the objective and be candidates for a future WIF technology; these emulsifiers were, in order of priority, Emul 8, Emul 2, Emul 4 and Emul 10. Based on best performance in the laboratory Emul 8 was recommended as first choice for test in the test engine at MAN Diesel & Turbo. However, during large scale trials, inexpedient properties of this emulsifier in this specific application was revealed and Emul 8 had to be rejected for further testing and also as a candidate as a future commercial product. In the lab Emul 2 performed equally to Emul 8 as to stability and viscosity, however, on two parameters; dosage/response and pumpability it was inferior to Emul 8. A higher emulsifier concentration was needed with Emul 2 to get a stable emulsion without any sedimentation and it was not pumpable below 25°C. As a consequence of the outcome of the trials at MAN Diesel & Turbo and subsequent rejection of Emul 8, an optimization programme was scheduled for Emul 2 and two new modified Emul 2 were synthesized with deviating fatty acid profiles compared to the original Emul 2. In this way the viscosity of Emul 2 was decreased giving a optimized pumpability. Both Emul 2 and one of the optimized versions of Emul 2, # 072, have been tested successfully at the test engine of MAN Diesel & Turbo.

43
3 Emulsifier tests on 4T50ME-X
3.1 Experimental
3.1.1 Engine and measurement setup
All tests described in the present report have been conducted on the MAN B&W Diesel 4T50ME-X four cylinder test engine located in Copenhagen. Selected engine specifications are listed in Table 8. A picture of the test engine is shown in Figure 28. Table 8 Test engine specifications
Manufacturer MAN B&W Diesel Type 4T50ME-X Number of cylinders 4 Bore 500 mm Stroke 2200 mm Connecting rod length 2885 mm MCR speed 123 RPM MCR power 7050 kW
Turbocharger MAN TCA55-VTA
3.1.2 Optical measurement setup
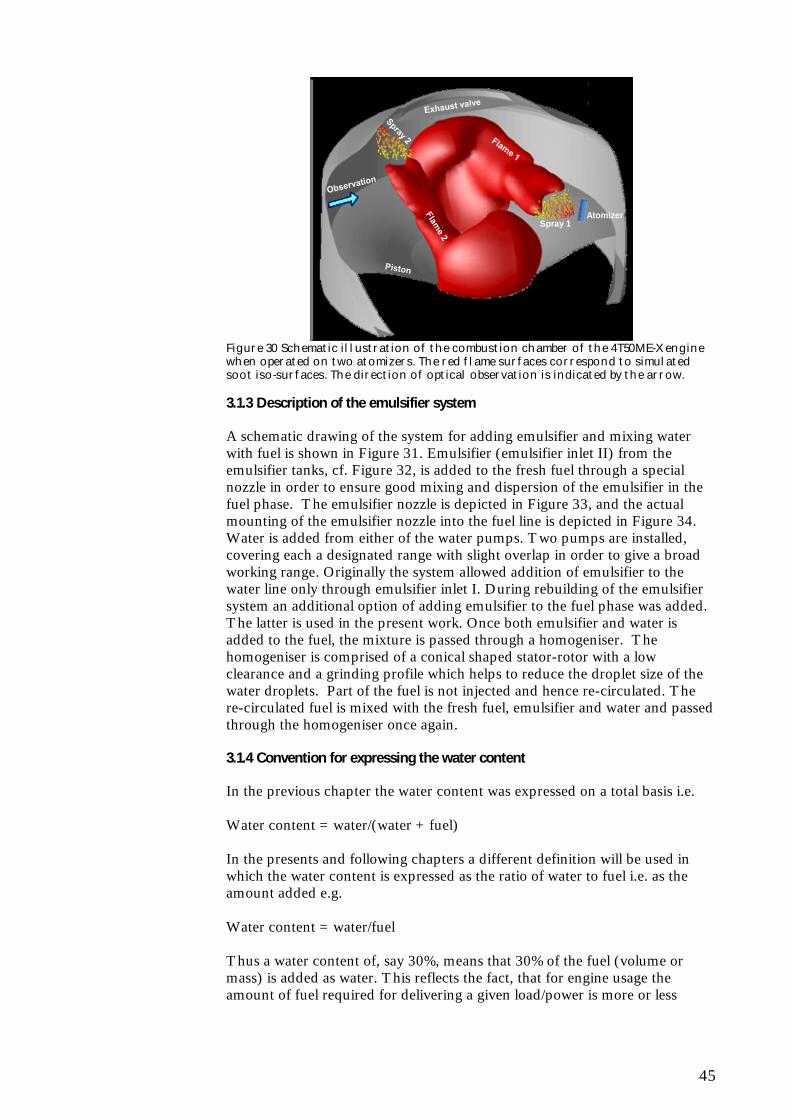
During the tests of the emulsifiers on the 4T50ME-X test engine additional dedicated optical measurements are conducted as well. The purpose of these tests is to elucidate the effect of the presence of water on the combustion process. This is realized by imaging of the combustion process by using a high-speed camera mounted on a borescope with an optical access through the cylinder cover into the combustion chamber. The actual setup is described in more detail in (Mayer, Hult, & Hostrup Poulsen, 2010), although for the service of the reader the basics of the system is summarised below. For the high-speed flame emission imaging experiments presented here the experimental arrangement shown in Figure 29 was employed. The direction of view is 70 off axis, and thus allows a view across the cylinder towards one of the atomizers on the opposite side of the cylinder, see Figure 30. In order to avoid the flame from the injection nozzle near the optical insert blocking the field of view, this particular fuel valve is blocked during operation when the optical insert and the high speed camera is mounted.

44
Figure 28 Top view of the MAN B&W 4T50ME-X test engine at the research laboratory in Copenhagen. Visible in the picture is the exhaust receiver, cylinder covers and upper part of the cylinders as well as exhaust valve housing, injection equipment etc.
Figure 29 Experimental set-up for high-speed imaging and two-colour pyrometry. The cold mirror is used only for the pyrometry experiment, it reflects wavelengths shorter than 665 nm and transmits longer wavelengths.
45
AtomizerSpray 1
Figure 30 Schematic illustration of the combustion chamber of the 4T50ME-X engine when operated on two atomizers. The red flame surfaces correspond to simulated soot iso-surfaces. The direction of optical observation is indicated by the arrow. 3.1.3 Description of the emulsifier system
A schematic drawing of the system for adding emulsifier and mixing water with fuel is shown in Figure 31. Emulsifier (emulsifier inlet II) from the emulsifier tanks, cf. Figure 32, is added to the fresh fuel through a special nozzle in order to ensure good mixing and dispersion of the emulsifier in the fuel phase. The emulsifier nozzle is depicted in Figure 33, and the actual mounting of the emulsifier nozzle into the fuel line is depicted in Figure 34. Water is added from either of the water pumps. Two pumps are installed, covering each a designated range with slight overlap in order to give a broad working range. Originally the system allowed addition of emulsifier to the water line only through emulsifier inlet I. During rebuilding of the emulsifier system an additional option of adding emulsifier to the fuel phase was added. The latter is used in the present work. Once both emulsifier and water is added to the fuel, the mixture is passed through a homogeniser. The homogeniser is comprised of a conical shaped stator-rotor with a low clearance and a grinding profile which helps to reduce the droplet size of the water droplets. Part of the fuel is not injected and hence re-circulated. The re-circulated fuel is mixed with the fresh fuel, emulsifier and water and passed through the homogeniser once again. 3.1.4 Convention for expressing the water content
In the previous chapter the water content was expressed on a total basis i.e. Water content = water/(water + fuel) In the presents and following chapters a different definition will be used in which the water content is expressed as the ratio of water to fuel i.e. as the amount added e.g. Water content = water/fuel Thus a water content of, say 30%, means that 30% of the fuel (volume or mass) is added as water. This reflects the fact, that for engine usage the amount of fuel required for delivering a given load/power is more or less

46
invariant, thus any water contained in the fuel is in addition to the fuel amount itself.
Figure 31 Schematic drawing of the part of the fuel oil system on 4T50ME-X where emulsifier is added to the fuel and the subsequent addition of water.
Figure 32 Emulsifier tanks with emulsifier dosage pumps on top. Shown are also the water pumps as well as the three-way valve controlling the addition of emulsifier to either fuel or water.
Figure 33 Emulsifier nozzle

47
Figure 34 Emulsifier nozzle with non-return valve with injection of emulsifier into the bend on the fuel pipe.

48
3.1.5 Test plan
Table 9 Test programme for emulsifier tests on 4T50ME-X
The test programme includes two regular tests (T10077 and T10078) where the engine is operated on pure gas oil (no water or emulsifier added). The purpose of these reference tests is to act as references when benchmarking the engine stability when water and emulsifier is added to the fuel in subsequent

49
tests. In addition two tests have been carried out with high-speed photography (c78_1 and c78_2) of the combustion process inside cylinder 1. Four tests are carried out with emulsifier #8 and seven regular tests are carried out with emulsifier #2. In addition with emulsifier #2 shut-down and black-out tests are carried out with high-speed photography conducted in between. 3.1.6 Stability metrics and criteria
In order to judge the stability of the engine when operated on water-in-fuel emulsion, different parameters are used which will be defined in the following. Various instability phenomena can be imagined, and in general they can be grouped into two classes
Cylinder-to-cylinder. This kind of instability will appear as different performance e.g. different maximum pressure, different power output from one cylinder to the other.
Cycle-to-cycle. This kind of instability will appear as different performance from one revolution to the other for a given cylinder.
Usually for a large two-stroke diesel engine, even when operated on pure fuel, some cycle-to-cycle and cylinder-to-cylinder variation is experienced. The minimum criterion to be passed is that, when operated on water-in-fuel emulsion, these metrics should not be significantly worse, than when operated on pure fuel.
Figure 35 Measured pressure at 25% engine load for cylinder 1 (300 consecutive revolutions). A crank angle of 0o corresponds to the top dead center (TDC) i.e. when the piston is at its top position and the cylinder volume is at its minimum. The colour of each pressure trace is grey. For illustrational purposes the measured cylinder pressure for 300 consecutive cycles is shown in Figure 35 at 25% engine load with pure fuel. As seen from the figure some variation from cycle-to-cycle is experienced even for normal operation without any water added, which is signalled by the fact that some

50
spread around the average cylinder pressure appears. In order to judge the stability from cycle-to-cycle the 95% confidence intervals at the position of the maximum measured (average) cylinder pressure are calculated for each cylinder for each tests and benchmarked against the reference measurement with pure fuel. In addition the maximum pressure on average from each cylinder is used to detect any difference from cylinder to cylinder.
Figure 36 Measured fuel pump pressure for all 4 cylinders on 4T50ME-X with pure fuel and with water added. The power output of the 4 cylinders is equal. Furthermore, the estimated injection length for each cylinder is also used to judge deterioration of engine stability. Assuming that the power output of each cylinder is the same, which can be obtained by proper adjustment, the injection length must be the same, assuming identical injection equipment and the same fuel for each cylinder. However, from past experience with improper choice of fuel oil/water amount/emulsifier it has been experienced that significantly different injection length from cylinder to cylinder may be experienced when the emulsion becomes unstable. This is visualised in Figure 36. The figure displays the measured fuel pump pressure for all cylinders. The injection length is estimated as the period between the opening (when the fuel pump pressure exceeds 350 bar, which is the approximate opening pressure of the fuel valve) and the corresponding closing of the fuel valve. As seen from the figure the fuel pump pressure measured for the different cylinders, when no water is added, closely resemble each other. When water is added two things happen in the shown case. First the injection length increases as visualised by the earlier build up of fuel pump pressure as well as the downward flank is extended significant. The reason for this, is the lower effective heating value per injected mass due to the presence of water i.e. for the same total heat value injected a longer injection is needed. More important is the fact that one cylinder (number 4, blue line) is significantly shorter than the others. Further, the difference in injection length from the 3 other cylinders is also larger than the zero water case. These phenomena are caused by difference in water content in the injected emulsion. For cylinder 4 the water content is significantly less, since for a given power output, a shorter injection is required. In order to monitor emulsion instabilities the estimated injection length for each cylinder as well as the corresponding confidence intervals are estimated.

51
3.2 Results
3.2.1 General results
As seen from Figure 37 significant changes occur to the measured cylinder pressure when water in large quantities as added to the fuel. It is observed that the pressure rise rate at the beginning of the combustion process (the increase in pressure just after top dead center (TDC)) is higher and the pressure rise occurs more violently. Previous tests have revealed increasing ignition delays with increasing water content. The longer ignition delay allows the formation of a larger premixed portion i.e. when ignition occurs a larger amount fuel is combusted in a short time.
(A) (B) Figure 37 Measured cylinder pressure on cylinder 1 at 25% load at zero water (A) and 90% water added
It is also noted that there are clearly some harmonic oscillations in the cylinder pressure signal with water added which is an acoustic phenomenon and is initiated by the abrupt ignition. The observed oscillations are less pronounced at higher engine load. At higher engine load the ignition delay is generally shorter due to the higher density of the compressed gas and hence a smaller premixed mixture is formed before ignition. 3.2.2 Emulsifier #8: Short summary
Based on the emulsifier screening tests emulsifier #8 appeared to be the best candidate in terms of emulsion stability. Tests with up to 90 vol. % water added were conducted with a tendency for phase inversion i.e. a transformation from water–in-oil to oil-in-water at water contents above 50 vol. % added. Further, and more severe is the fact that corrosion was detected several places in the fuel system/fuel injection equipment. Most pronounced on the fuel plunger, where an increased leakage was observed (by a factor of 2). Disassembly of the fuel pump confirmed corrosion cf. Figure 38. Additional ex-situ corrosion tests were performed where different dummies made of the same material as the fuel plunger were placed in different environments. Tests were made with pure water, pure emulsifier, stable emulsion, and inverted emulsion. As expected the most pronounced corrosion was observed for the pure water case, interestingly the pure emulsifier did not result in any noticeable corrosion. The second most corroded sample was the one with stable emulsion.

52
Before After Figure 38 Photographs of the fuel plunger on cylinder 4 taken before tests with water-in-fuel emulsion and emulsifier #8 and after. 3.2.3 Emulsifier #2: Engine stability at varying water content
Results from tests with variation in water content are shown in Figure 39 and Figure 40. In Figure 39 the average maximum cylinder pressure for each cylinder is given for water contents increasing from zero (reference) to approx. 90 vol. % added. Variation in maximum cylinder pressure from cycle-to-cycle is indicated by the error bars which represent 95% confidence intervals in accordance with the metrics laid out in Section 3.1.6. As seen from the figure for the reference case some cylinder-to-cylinder variation is inevitable even for the experienced engineer adjusting the engine. It is clearly seen that the addition of water does not cause any significant increase in the cylinder-to-cylinder variation. Furthermore, the cycle-to-cycle variation also seems to be unaffected by the presence of water.
8.4E+06
8.6E+06
8.8E+06
9.0E+06
9.2E+06
9.4E+06
9.6E+06
9.8E+06
0 47 63 91
Maxim
um cylinder pressure (Pa)
Water vol. ratio (%)
Cyl 1 Cyl 2 Cyl 3 Cyl 4
Figure 39 Measured cylinder pressure for each cylinder as a function of water content. Error bars indicate 95% confidence intervals. In Figure 40 similar indicators are plotted for the estimated injection duration. Again it is noticed that neither the cylinder-to-cylinder nor the cycle-to-cycle stability is hampered in any way by the presence of water. From previous experience it is known that any significant long-term instability in the emulsion would be revealed by increased cylinder-to-cylinder variation in the injection duration, in order to maintain the work output from each cylinder, signalling uneven heating value along the cylinders. Clearly, this is not the case.

53
0.0
2.0
4.0
6.0
8.0
10.0
12.0
14.0
16.0
0 47 63 91
Estimated
injection duration (CAD)
Water vol. ratio (%)
Cyl 1 Cyl 2 Cyl 3 Cyl 4
Figure 40 Estimated injection duration for each cylinder as a function of water content. Error bars indicate 95% confidence intervals. Fuel samples were taken from the fuel oil system during tests and the stability of the samples is visualised in Figure 41. As seen from the figure the appearance of a more fuel rich phase above an emulsion phase develops due to sedimentation of water droplets as the age of the sample increases. Agitation/shaking of the samples recreates the initial emulsion.
Figure 41 Fuel samples from the fuel oil system of the 4T50ME-X test engine during tests with emulsifier #2 applying approx. 0.9 vol % emulsifier (relative to fuel) and different water contents. The age of the samples are indicated in parenthesis. 3.2.4 Emulsifier #2: Engine stability at varying emulsifier addition
In Figure 42 and Figure 43 results from tests with gradually decreasing emulsifier content are shown. As seen from the figures the engine stability in terms of cylinder-to-cylinder and cycle-to-cycle seems to be unaffected even in the case of the lowest emulsifier addition.

54
8.6E+06
8.8E+06
9.0E+06
9.2E+06
9.4E+06
9.6E+06
9.8E+06
0.82 0.85 0.61 0.39 0.22
Maxim
um cylinder pressure (Pa)
Emulsifier/Fuel vol. ratio (%)
Cyl 1 Cyl 2 Cyl 3 Cyl 4
Figure 42 Measured cylinder pressure for each cylinder as a function of water content. Error bars indicate 95% confidence intervals.
0
2
4
6
8
10
12
14
16
0.82 0.85 0.61 0.39 0.22 Ref
Estimated
injection duration (CAD)
Emulsifier/Fuel vol. ratio (%)
Cyl 1 Cyl 2 Cyl 3 Cyl 4
Figure 43 Estimated injection duration for each cylinder as a function of water content. Error bars indicate 95% confidence intervals. In Figure 44 photographs of fuel samples taken during the emulsifier minimisation tests are shown. It is noticed that the tendency for sedimentation is increasing as the amount of emulsifier is decreased. This indicates that the water droplets are larger for lower emulsifier amounts and hence sediment more quickly in accordance with Stoke’s law. Subsequent droplet size measurements confirmed this hypothesis.
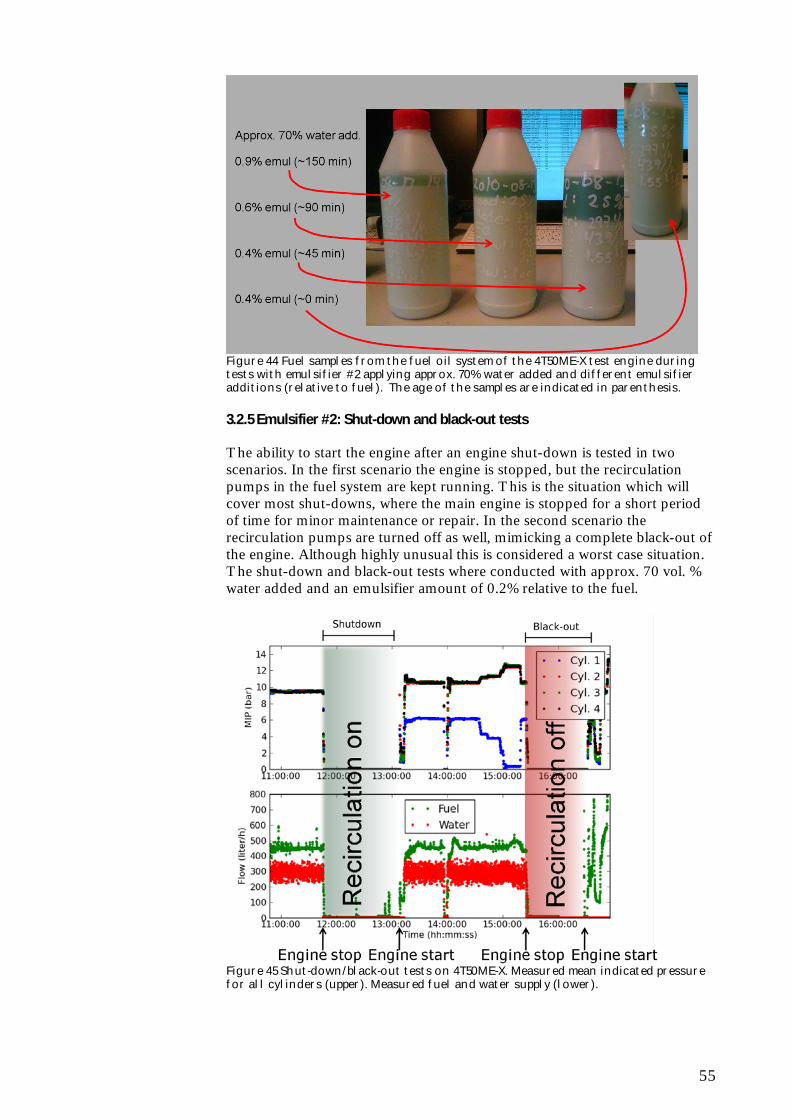
55
Figure 44 Fuel samples from the fuel oil system of the 4T50ME-X test engine during tests with emulsifier #2 applying approx. 70% water added and different emulsifier additions (relative to fuel). The age of the samples are indicated in parenthesis. 3.2.5 Emulsifier #2: Shut-down and black-out tests
The ability to start the engine after an engine shut-down is tested in two scenarios. In the first scenario the engine is stopped, but the recirculation pumps in the fuel system are kept running. This is the situation which will cover most shut-downs, where the main engine is stopped for a short period of time for minor maintenance or repair. In the second scenario the recirculation pumps are turned off as well, mimicking a complete black-out of the engine. Although highly unusual this is considered a worst case situation. The shut-down and black-out tests where conducted with approx. 70 vol. % water added and an emulsifier amount of 0.2% relative to the fuel.
Figure 45 Shut-down/black-out tests on 4T50ME-X. Measured mean indicated pressure for all cylinders (upper). Measured fuel and water supply (lower).

56
Results from the two test scenarios are shown in Figure 45. The first scenario (shut-down) is initiated at a time of 11:45. As seen from the mean indicated pressure (MIP) this drops to zero i.e. no net power out from the cylinders. The display of MIP is simply to signal when the engine is running and when its not. It is also seen that the fuel and water supplies are cut off. At around 13:10 the engine is started again and running until approx. 15:25. As seen from the figure, the MIP of cylinder 1 deviates from the other 3 after the restart, but this is due to the blocking of one of the injectors for another independent experiment. After approx. 1 hour at 16:30 the engine is started again. As seen from the figure the engine successfully starts, although some fluctuations in the fuel input are seen. A gentle ramping up of the load was chosen, due to detection of significant engine knock during restart. It appears that when relatively high water content is applied on a cooled-down engine, and separation in the emulsion may have taken place engine knock may occur. Engine knock is undesired since it may shorten the lifetime of e.g. the piston rings. One of the reasons that engine knock occurs is the fact the ignition delay increases when water is added. The more water, the longer ignition delay. Further, on a cold engine the heat transfer is higher, i.e. compression temperature is lower, contributing to an even longer ignition delay. In the shown case it was actually found that all the fuel was injected before ignition. This problem is less (and likely insignificant) when lower water content is applied, and it may be further minimised by applying a different injection strategy in which the length of injection is prolonged, or even by applying a split-injection strategy. 3.2.6 Optical investigations
Figure 46 shows an example of a raw image recorded during test C78_1 (cf. Table 9). Two images representing the two different spectral regions are seen on the detector. The upper part is the image with wavelength below 695 nm. The approximate location of the injection nozzle is indicated on the image. An insert displays the upper image with false colour added, representing the pixel intensity. As seen from the figure the recording clearly shows the development of the characteristic diesel spray combustion. Figure 47 shows the flame development throughout the luminescent part of a single combustion cycle, captured using the high-speed camera. The camera was operated at a frame rate of 18000 frames per second, however, only a selection of those frames are shown here. For the recording shown here a single fuel injector, located on the opposite side of the combustion chamber, was employed. Two cases are shown in the figure. The upper part shows the flame development for pure fuel injected with a nominal injection length equal to that of the other three cylinders. The lower part is the case where water has been added to the fuel. The injection length has been adjusted in order to match that of the pure fuel case. Each image is tagged with the time elapsed after the beginning of the injection expressed in crank angle degree (CAD).

57
Figure 46 Example raw image from high-speed photography. The upper image (wavelength < 695 nm) is shown also with false colours representing the pixel intensity. For the pure fuel case the ignition appears to take place at around 0.8-1.1 CAD after the start of injection. With an engine speed of 77 rpm this roughly corresponds to an ignition delay of 2 ms. The magnitude of the ignition delay is comparable to that found by using an optical fibre insert in previous studies. At this point the first small ignited region is seen just downstream from the atomizer. In the visible spectral region flame emission is predominant due to black body radiation from soot . The surface of the flame is erratic and has clear turbulent features. For the first approx. 3 CAD after injection, the flame develops freely within the field of view covered in the combustion chamber. Beyond 3 CAD, the flame begins to turn due to the swirling motion and impact on the cylinder wall. It then moves in front of the optical access, and thus starts to cover the view across the cylinder. During the remaining part of the fuel injection period (ends at approx. 8 CAD after injection start), the images give a close-up view of the surface of the flame with the characteristic turbulent features. However, the flame also blocks information from the
Injection nozzle

58
remaining part of the field of view. At the end of the sequence (from 10 to 15 CAD after start of injection) the burn out of the last pockets of fuel are seen, well after the end of fuel injection. When water is added the combustion apparently changes in several ways. First of all it appears as though the ignition delay is extended to approx. 2.5 CAD corresponding to 5 ms. Furthermore the blocking of the field of view by the flame (curtain) from 4 to 8 CAD is much less pronounced as well as the burn period from 10 CAD on onward seems to be shortened. All in all much “less” flame is observed in the case with water added. This is probably due to the fact that either less soot is present or that the flame temperature is effectively lowered by the heat dissipation due to the evaporation and superheating of water.
3.3 Summary
In this chapter the results from the engine tests with emulsifiers no. 8 and no. 2 has been presented. Due to corrosion problems and problems with phase inversion at higher water contents emulsifier no. 8 was disregarded, and emulsifier no. 2 was tested more thoroughly. Emulsifier no. 2 proved to accommodate large quantities of water into the fuel phase (up to a water-to-fuel ratio of 0.91) with no significant deterioration of neither the cylinder-to-cylinder variation nor the cycle-to-cycle variation. It was also demonstrated that the amount of emulsifier could be reduced to approx. 0.2 % (on the basis of fuel) also without any negative impact on the performance and stability of the engine. Shut-down tests demonstrated that the engine could be restarted when operated on a water-to-fuel ratio of 0.70 and with an emulsifier dosage of 0.2% of the fuel both with and without the fuel system recirculation pumps.

59
Reference no water added
Approx. 70 vol. % water added
Figure 47 High-speed photography of the combustion with (lower) and with-out water (upper)

60

61
4 Emission reduction potential
4.1 Experimental
4.1.1 Engine setup
The performance settings of the engine during tests with WIF are summarised in Table 10. Table 10 Summary of applied performance adjustment of the reference tests
Engine load (% of MCR) Parameter Unit 25 50 75 100
Pmax bar 89.3 121 154.8 169.7 Pcomp bar 66.7 92.3 127.0 155.3 Pscav bar 1.54 2.02 2.90 3.78
Pcomp/Pscav 44.0 44.2 44.1 41.4 Tscav
oC 33.2 25.3 30.6 36.6 4.1.2 Emission measurements
During all tests exhaust emissions were measured according to ISO8178/IMO Standards (ISO, 2006);(IMO, 1998). Along with gaseous emission the filter smoke number (FSN) was measured using an AVL S415 smoke meter. For selected tests particle concentrations were measured using the ISO8178 dilution tunnel method.
Figure 48 Schematic setup of MAN Diesel emission measurement equipment in accordance with both IMO and ISO 8178 standards. A schematic emission measurement setup is shown in Figure 48, a specification of the emission analysers is shown in Table 11. Exhaust gas is continuously sampled from the exhaust pipe, through a heated pre-filter in order to remove excessive dust/particulate matter and subsequently through heated PTFE tubing. A sampling/pump module supplies the analysers either with hot i.e. wet exhaust (HCLD and FID) or cooled exhaust gas i.e. dry (PMD, NDIR). The electrical
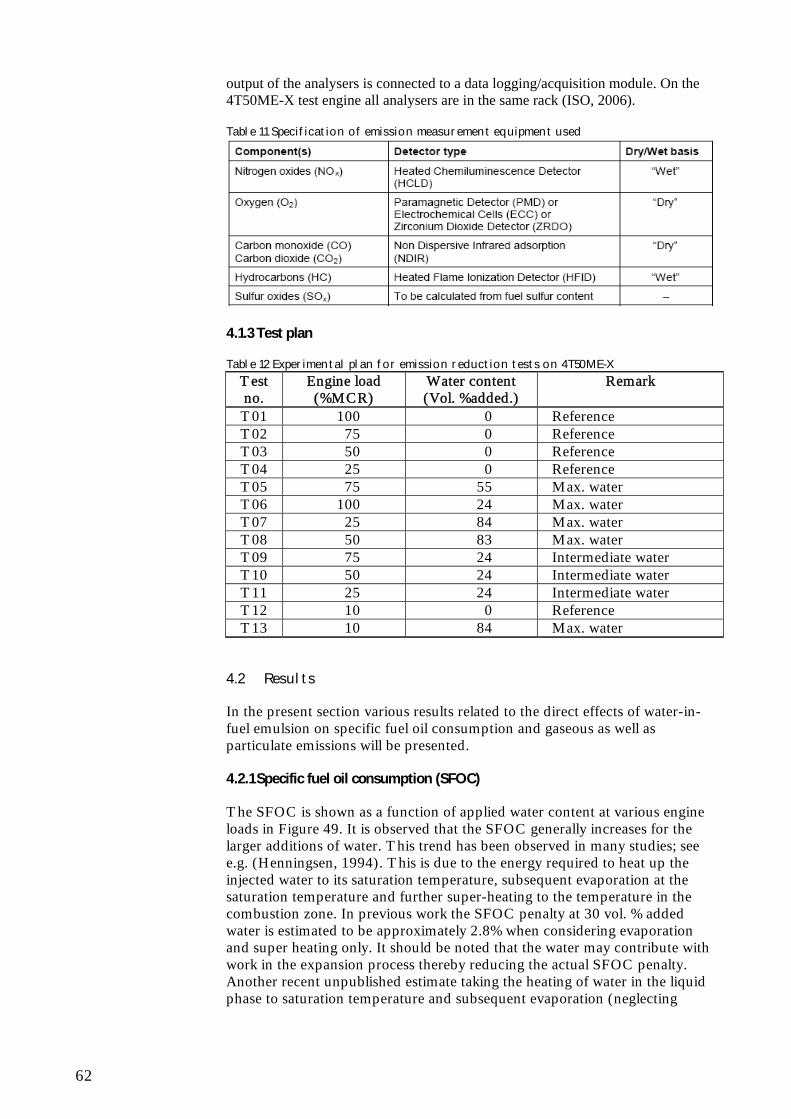
62
output of the analysers is connected to a data logging/acquisition module. On the 4T50ME-X test engine all analysers are in the same rack (ISO, 2006). Table 11 Specification of emission measurement equipment used
4.1.3 Test plan
Table 12 Experimental plan for emission reduction tests on 4T50ME-X
Test no.
Engine load (%MCR)
Water content (Vol. %added.)
Remark
T01 100 0 Reference T02 75 0 Reference T03 50 0 Reference T04 25 0 Reference T05 75 55 Max. water T06 100 24 Max. water T07 25 84 Max. water T08 50 83 Max. water T09 75 24 Intermediate water T10 50 24 Intermediate water T11 25 24 Intermediate water T12 10 0 Reference T13 10 84 Max. water
4.2 Results
In the present section various results related to the direct effects of water-in-fuel emulsion on specific fuel oil consumption and gaseous as well as particulate emissions will be presented. 4.2.1 Specific fuel oil consumption (SFOC)
The SFOC is shown as a function of applied water content at various engine loads in Figure 49. It is observed that the SFOC generally increases for the larger additions of water. This trend has been observed in many studies; see e.g. (Henningsen, 1994). This is due to the energy required to heat up the injected water to its saturation temperature, subsequent evaporation at the saturation temperature and further super-heating to the temperature in the combustion zone. In previous work the SFOC penalty at 30 vol. % added water is estimated to be approximately 2.8% when considering evaporation and super heating only. It should be noted that the water may contribute with work in the expansion process thereby reducing the actual SFOC penalty. Another recent unpublished estimate taking the heating of water in the liquid phase to saturation temperature and subsequent evaporation (neglecting

63
super-heating) and taking the expansion work into account leads to a SFOC penalty of approx. 1.8 % at 30 vol. % water added.
Figure 49 Specific fuel oil consumption. Within each engine load values are relative to the SFOC with no water added. From Figure 49 it is also observed that at 25% and 50% load a slight SFOC improvement is observed at moderate water contents. This phenomenon has also been observed previously (Henningsen, 1994). Various effects may be responsible for this behaviour. Addition of water to the fuel increases the injected mass and momentum thereby increasing the amount of entrained air per mass of fuel thus improving the conditions for optimal combustion. Further, the fuel nozzle hole diameter and thus injection duration is optimised for high load, and the addition of water effectively corresponds to a reduction in hole size (longer injection). Thus the SFOC improvement at part load may be rationalised in terms of fuel nozzle optimisation. The results clearly illustrate the competing forces controlling SFOC when water is added to the fuel. 4.2.2 NOx emission
The effect of water content on exhaust gas NOx emissions is shown in Figure 50. As seen from the Figure there is a general trend of decreasing NOx emissions as a function of increasing water content, as one would expect. For the lower loads (25% and 50%) it is observed that the rate of NOx reduction is low for the lower amounts of water added and after a certain point the reduction rate is very close to that of the other load points. The reason for the lower NOx reduction at moderate water contents may be rationalized in the same way as the SFOC improvements noticed for the same cases. In the beginning the air entrainment is increased thereby improving combustion and also increasing the oxygen availability effectively leading to increased NOx although balanced by the lowering of the flame temperature due to water evaporation. At a certain point the effect of lower flame temperatures starts to dominate and the reduction rate increases. Although increasing NOx has been observed to often accompany decreasing SFOC (Henningsen, 1994), this is not the case for the present study. According to previous experimental and theoretical experience a general rule of thumb has been formulated in which the NOx reduction is approx. 1% per 1% water on a total basis in the emulsion (Eckert, Velji, & Spicher, 2007). The results from the present study are in line with these findings cf. Figure 51 for high water contents.

64
Figure 50 Measured specific exhaust gas emissions of NOx
Figure 51 NOx reduction rate expressed as % NOx reduction from reference per % water content on mass basis of the total emulsion mass. In order to evaluate the effectiveness in terms of NOx reduction per change in SFOC the NOx/SFOC trade-off expressed as the change in NOx emission (g/kWh) divided by the corresponding change in SFOC (g/kWh) is shown in Figure 52. The changes are relative to the reference case i.e. no water added. As seen from Figure 52 for the high water contents addition of water generally results in a NOx reduction (g/kWh) which is twice as high as the SFOC penalty (g/kWh). For the intermediate water contents we also find trade-offs with a positive sign due to the fact that both NOx and SFOC is reduced. For the 25% load case we find a SFOC improvement accompanied by a small change in NOx and for 50% load we find a relatively high NOx reduction accompanied by a small change in SFOC. Generally the Figure illustrates that moderate water contents are more effective in terms of the NOx/SFOC trade-off than high water contents.

65
Figure 52 NOx/SFOC trade-off 4.2.3 CO and HC emissions
The HC emission (Figure 53) generally increases with a maximum at moderate water contents and from then decreasing at higher water contents, ending at a value somewhat higher than the reference. This seems to be in agreement with previous studies (Kubel, Test of water/fuel emulsifies on 4T50ME-X, 2003).
Figure 53 Measured specific exhaust gas emissions of HC The CO emission (Figure 54) decreases rapidly when water is added to the fuel. This may be explained by an increased air entrainment into the fuel spray as well as lower combustion temperatures. In a previous study the CO emissions were shown to increase slightly for moderate water contents at high loads (Kubel, Test of water/fuel emulsifies on 4T50ME-X, 2003), although starting to decrease at higher water contents.

66
Figure 54 Measured specific exhaust gas emissions of CO 4.2.4 Particulate emissions
Particulate emissions for selected tests measured both by the ISO8178 dilution tunnel method as well as a filter smoke number (FSN) are shown in Figure 55 and Figure 56, respectively.
Figure 55 Particulate emissions measured by the ISO8178 dilution tunnel method
Figure 56 Measured filter smoke number (FSN) The results show that while the particulate emissions measured by the ISO8178 method increases with added water the filter smoke number decreases. The FSN results are in agreement with many studies claiming that added water generally reduces exhaust smoke (Kegl & Pehan, 2001; Bertola,

67
Li, & Boulouchos, 2003; Tzirakis, et al., 2006), although studies showing the opposite have also been published (Henningsen, 1994; Eckert, Velji, & Spicher, 2007; Nazha, Rajakaruna, & Wagstaff, 2001). It is interesting to note the opposite effect on particulate emissions with the ISO8178 method. However, due to the water added to the fuel the injection length is also extended. Increased injection length is known to cause higher particulate emissions (Henningsen, 1994). The results from particulate measurements are qualitatively in agreement with previous studies on a large mechanically controlled two stroke engine (Henningsen, 1994). However, in (Henningsen, 1994) an increase in FSN was also observed. A previous study on the T50ME-X test engine also showed an increase in particulates. Due to a concurrent increase in HC emissions, as in the present tests, the increase in particulates was assigned to a higher content of soluble organic fraction (Kubel, Water-in-fuel emulsion. Test of different emulsifiers, 2001). Recent tests have shown that elemental carbon (soot) constitutes only a tiny fraction (<1%) of the total particulate matter. Thus it may seem reasonable that the total particulates increases even with decreasing FSN. Further, the FSN has been shown to correlate well with CO emissions (Sarvi, Fogelholm, & Zevenhoven, 2007), supporting the fact that the decrease in FSN is real and not an experimental artefact, since CO emissions decreases with water content in the present study. 4.2.5 Combining exhaust gas emission reduction methods
The EGR system used in tests with combined WIF and EGR is schematically illustrated in Figure 57. The system comprises a single-step, high-pressure blower, an exhaust gas wet scrubber, a control valve, a water-treatment system and a control unit for controlling the water-treatment system and EGR blower speed.
Figure 57 EGR system. The colour of the gas indicates the temperature. Scrubber water drain and water treatment process diagram has been omitted for clarity. The EGR rate was determined by simultaneously measuring the CO2 concentration after the air cooler and in the exhaust gas after the turbine. The EGR rates reported in this paper are based on measured dry CO2


69
Figure 59 Tests results for combined WIF and EGR tests at 75% load. WIF water contents are reported as added water in vol. %. The EGR reference case is without any water. Test results at 75% load from combined WIF and EGR tests are summarized in Figure 59. As seen from the figure using WIF in combination with EGR is a very effective way of reducing CO emissions in agreement with small engine results (Nazha, Rajakaruna, & Wagstaff, 2001). At the highest applied water content using EGR (WIF 50 % and EGR 37%) the CO emission is reduced by a factor of almost 9 compared to the tests using only EGR and the CO emission is even lower than the reference case (0% WIF 0% EGR). Even with more moderate amounts of water (WIF 28% and EGR 37%) the CO emission is equal to that of the reference case. It is also observed that the HC emission of tests with WIF only is effectively reduced when applying EGR. Thus, indeed it is possible to combine WIF and EGR in order to reduce their individual drawbacks. In order to reduce the SFOC penalty performance optimisation could be utilised.
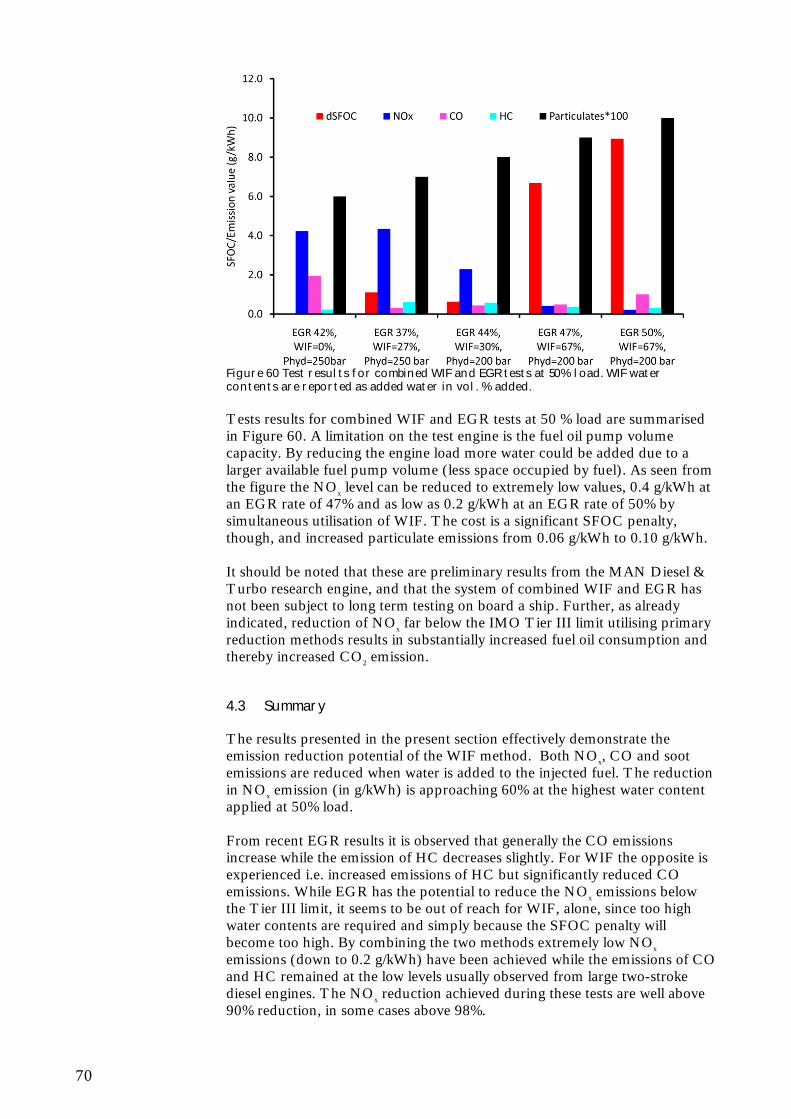
70
Figure 60 Test results for combined WIF and EGR tests at 50% load. WIF water contents are reported as added water in vol. % added. Tests results for combined WIF and EGR tests at 50 % load are summarised in Figure 60. A limitation on the test engine is the fuel oil pump volume capacity. By reducing the engine load more water could be added due to a larger available fuel pump volume (less space occupied by fuel). As seen from the figure the NOx level can be reduced to extremely low values, 0.4 g/kWh at an EGR rate of 47% and as low as 0.2 g/kWh at an EGR rate of 50% by simultaneous utilisation of WIF. The cost is a significant SFOC penalty, though, and increased particulate emissions from 0.06 g/kWh to 0.10 g/kWh. It should be noted that these are preliminary results from the MAN Diesel & Turbo research engine, and that the system of combined WIF and EGR has not been subject to long term testing on board a ship. Further, as already indicated, reduction of NOx far below the IMO Tier III limit utilising primary reduction methods results in substantially increased fuel oil consumption and thereby increased CO2 emission.
4.3 Summary
The results presented in the present section effectively demonstrate the emission reduction potential of the WIF method. Both NOx, CO and soot emissions are reduced when water is added to the injected fuel. The reduction in NOx emission (in g/kWh) is approaching 60% at the highest water content applied at 50% load. From recent EGR results it is observed that generally the CO emissions increase while the emission of HC decreases slightly. For WIF the opposite is experienced i.e. increased emissions of HC but significantly reduced CO emissions. While EGR has the potential to reduce the NOx emissions below the Tier III limit, it seems to be out of reach for WIF, alone, since too high water contents are required and simply because the SFOC penalty will become too high. By combining the two methods extremely low NOx emissions (down to 0.2 g/kWh) have been achieved while the emissions of CO and HC remained at the low levels usually observed from large two-stroke diesel engines. The NOx reduction achieved during these tests are well above 90% reduction, in some cases above 98%.

71
5 Conclusions
Conclusions are summarised in the chapter Summary and conclusions in front of the report.

72

73
6 Bibliography
Abivin, P., Henaut, I., Chaudemanche, C., Argillier, J., Chinesta, F., & Moan, M. (2009). Dispersed Systems in Heavy Crude Oils. Oil & Gas Science and Technology - Rev. IFP , 64, 557-570. Andreasen, A., & Mayer, S. (2007). Use of seawater scrubbing for SO2 removal from marine engine exhaust gas. Energy & Fuels , 21, 3274–3279. Bertola, A., Li, R., & Boulouchos, K. (2003). Influence of water-diesel fuel emulsions and EGR on combustion and exhaust emissions of heavy duty diesel engines equipped with common-rail injection system. SAE Technical Paper Series , 2003-01-3146. Buhaug, Ø., Corbett, J.J., Endresen, Ø., Eyring, V., Faber, J., Hanayama, S., Lee, D.S., Lee, D., Lindstad, H., Markowska, A.Z., Mjelde, A., Nelissen, D., Nilsen, J., Pålsson, C., Winebrake, J.J., Wu, W., Yoshida, K. (2009). Second IMO GHG Study 2009, International Maritime Organization (IMO) London, UK. Dürnholz, M., Eifler, G., & Endres, H. (1992). Exhaust-Gas Recirculation - A Measure to Reduce Exhaust Emissions of DI Diesel Engines. SAE Technical Paper Series , 920725. Eckert, P., Velji, A., & Spicher, U. (2007). Numerical investigations of fuel-water emulsions combustion in a DI-Diesel engine. Proceedings of the 25th CIMAC World Congress on Combustion Engine Technology for Ship propulsion Power generation Rail traction. Vienna: CIMAC. Eyring, V., Corbett, J. J., Lee, D. S., & Winebrake, J. J. (2007, November 6). Brief summary of the impact of ship emissions on atmospheric composition,. submitted to the Health and Environment sub-group of the International Maritime Organization . Friedrich, A., Heinen, F., Kamakaté, F., & Kodjak, D. (2007). Air Pollution and Greenhouse Gas Emissions from Ocean-going Ships: Impacts, Mitigation Options and Opportunities for Managing Growth. Washington DC: The International Council on Clean Transportation. Henningsen, S. (1994). Influence of the fuel injection equipment on NOx emissions and particulates on a large heavy-duty two-stroke diesel engine operating on water-in-fuel emulsion. SAE paper 941783 . IMO. (1998). Annex VI of MARPOL 73/78 Regulations for the prevention of Air polution from ships and NOx technical code. London: International Maritime Organization. ISO. (2006). Reciprocating internal combustion engines – Exhaust emission measurement – Part 1. International Organization for Standardization.

74
Kaluza, P., Kölzch, A., Gastner, M., & Blasius, B. (2010). The complex network of global cargo ship movements. J. R. Soc. Interface , 7, 1093-1103. Kegl, P., & Pehan, S. (2001). Reduction of diesel engine emissions by water injection. SAE Technical Paper Series , 2001-01-3259. Kjemtrup, N. (2007). Developments on Exhaust Emission Modelling for Large Two-stroke Diesel Engines – Some Comparisons with Measured Data and an Update on the Latest Emission Reduction Techniques. 25th CIMAC World Congress on Combustion Engine Technology for Ship propulsion Power generation Rail traction. Vienna: CIMAC. Kubel, D. (2003). Test of water/fuel emulsifies on 4T50ME-X. Basic Research & Emission. Copenhagen: MAN B&W Diesel. Kubel, D. (2001). Water-in-fuel emulsion. Test of different emulsifiers. Copenhagen: MAN B&W Diesel. MAN Diesel & Turbo. (2008, August 19). Exhaust Gas Emission Control Today and Tomorrow. Retrieved December 3, 2010, from www.mandieselturbo.com: http://www.mandieselturbo.com/files/news/filesof9187/5510-0060-00ppr.pdf MAN Diesel & Turbo. (2010, August 25). How to influence CO2 emissions. Retrieved December 3, 2010, from www.mandieselturbo.com: http://www.mandieselturbo.com/files/news/filesof15013/5510-0083-00ppr_low.pdf MAN Diesel & Turbo. (2010). Project guides. Retrieved December 6, 2010, from www.mandieselturbo.com: http://www.mandieselturbo.com/0000861/Products/Marine-Engines-and-Systems/Low-Speed/Project-Guides.html MAN Diesel & Turbo. (2010, August 25). Tier III compliance low speed engines. Retrieved December 6, 2010, from www.,mandieselturbo.com: http://www.mandieselturbo.com/1015014/Press/Publications/Technical-Papers/Marine-Power/Low-Speed/Tier-III-Compliance-%E2%80%93-Low-Speed-Engines.html Marine Environment Protection Commitee. (2009, April 2). Proposal to Designate an Emission Control Area for Nitrogen Oxides, Sulphur Oxides and Particulate Matter . Retrieved December 7, 2010, from www.epa.org: http://www.epa.gov/nonroad/marine/ci/mepc-59-eca-proposal-es.pdf Mayer, S., Hult, J., & Hostrup Poulsen, H. (2010). In-situ optical combustion diagnostics on a large two-stroke marine diesel engine. Proceedings of the 26th CIMAC World Congress on Combustion Engine Technology for Ship propulsion Power generation Rail traction. Bergen: CIMAC. Nazha, M. A., Rajakaruna, H., & Wagstaff, S. A. (2001). The use of emulsion, water induction and EGR for controlling diesel engine emissions. SAE Technical Paper Series , 2001-01-1941. Pedersen, M., Andreasen, A., & Mayer, S. (2010). Two-stroke engine emission reduction technology: State-of-the-art. Proceedings of the 26th

75
CIMAC World Congress on Combustion Engine Technology for Ship propulsion Power generation Rail traction. Bergen: CIMAC. Quintero, C., Noïk, C., Dalmazzone, C., & Groissiord, J. (2009). Formation kinetics and viscoelastic properties of water/crude oil interfacial. Oil & Gas Science and Technology - Rev. IFP , 64, 607-616. Sarvi, A., Fogelholm, C.-J., & Zevenhoven, R. (2007). Emissions from large scale medium-speed diesel engines: 2. influence of fuel type and operating mode. Fuel Processing Technology , 89, 520-527. Tzirakis, E., Karavalakisa, G., Schinas, P., Korres, D., Karonis, D., Stournas, S., et al. (2006). Diesel-water emulsion emissions and performance evaluation in public buses in attica basin. SAE Technical Papaer Series , 2006-01-3398. Wagner, R. M., Green Jr., J. B., Storey, J. M., & Daw, R. S. (2000). Extending Exhaust Gas Recirculation Limits in Diesel Engines (Paper 643). Annual Conference and Exposition of the Air & Waste Management Association. Utah. Zhao, H., & Ladommatos, N. (1998). Optical diagnostics for soot and temperature measurement in Diesel engines. Prog. Combust. Sci , 24, 221-255.