waste vegetable oil properties with usage and its impact
TRANSCRIPT
Brigham Young University Brigham Young University
BYU ScholarsArchive BYU ScholarsArchive
Undergraduate Honors Theses
2018-04-23
Waste Vegetable Oil Properties with Usage and Its Impact on Waste Vegetable Oil Properties with Usage and Its Impact on
Artisan Soap Making Artisan Soap Making
Jenalyn Thorpe
Follow this and additional works at: https://scholarsarchive.byu.edu/studentpub_uht
Part of the Chemical Engineering Commons
BYU ScholarsArchive Citation BYU ScholarsArchive Citation Thorpe, Jenalyn, "Waste Vegetable Oil Properties with Usage and Its Impact on Artisan Soap Making" (2018). Undergraduate Honors Theses. 30. https://scholarsarchive.byu.edu/studentpub_uht/30
This Honors Thesis is brought to you for free and open access by BYU ScholarsArchive. It has been accepted for inclusion in Undergraduate Honors Theses by an authorized administrator of BYU ScholarsArchive. For more information, please contact [email protected], [email protected].
Honors Thesis TITLE
WASTE VEGETABLE OIL PROPERTIES WITH USAGE
AND ITS IMPACT ON ARTISAN SOAP MAKING
by Jenalyn Thorpe
Submitted to Brigham Young University in partial fulfillment of graduation requirements for University Honors
Chemical Engineering Department Brigham Young University
June 2018
Advisor: Randy Lewis
Honors Coordinator: Dean Wheeler

ii
iii
ABSTRACT
WASTE VEGETABLE OIL PROPERTIES WITH USAGE AND ITS IMPACT ON ARTISAN SOAP-MAKING
Jenalyn Thorpe
Chemical Engineering Department
Bachelor of Science
This thesis examines the impact of vegetable oil usage in industrial and home
settings on the properties of the vegetable oil and how its usage in soap affects the final
product. Waste vegetable oil (WVO) is often used to make soap as a way to be more
environmentally-friendly and create soap at a low cost in developing countries. Two
settings are examined: home usage (i.e. short-term, small-scale usage) and industrial (i.e.
long-term, almost continuous usage).
This thesis found that lightly used oil (household use) had little to no impact on
the quality of the oil, except for its scent. This resulted in a bar of soap that had very
similar properties to soap made from fresh oil, except for it was somewhat brittle.
However, when oil was used extensively the properties of the oil changed dramatically,
including a deepening of the color, free fatty acid (FFA) content increase to
approximately 5%, and an acquired scent. This resulted in a bar of soap that was darker in
color, and had less lather than fresh oil soap (by 1.4 on a scale of 5). The industrial WVO
had the advantage of reacting quickly with the lye to make soap, allowing the soap
making process to take less time, and for the bar of soap to reach a usable stage quicker,
most likely because of the high FFA%. These results demonstrate that using lightly or
heavily used vegetable oil in soap results in a high-quality product for a very low cost.

iv
v
ACKNOWLEDGEMENTS
I would like to acknowledge the help and contribution of my team members
through Global Engineering Outreach: Abbey Wilson, Connor Weeks, and Joshua Frei.
They were instrumental to making (so many) batches of soap, researching,
communicating with Porcón—and ultimately implementing the process developed in the
Granja Porcón community. I’m also grateful to Randy Lewis for his mentorship; to
Matthew Memmott, for agreeing to be my reader and providing support; to Laura Kneib
(owner of F.R.O.G. Soap) for her willingness to share her expertise on working with
waste vegetable oil (WVO) in soap-making; to Sam Thorpe, for his continued support
and encouragement.

vi
vii
TABLE OF CONTENTS
TITLE .............................................................................................................................................. i
ABSTRACT ................................................................................................................................... iii
ACKNOWLEDGEMENTS ............................................................................................................ v
TABLE OF CONTENTS .............................................................................................................. vii
TABLE OF TABLES .................................................................................................................... ix
TABLE OF FIGURES ................................................................................................................... ix
1. INTRODUCTION ...................................................................................................................... 1
2. EXPERIMENTAL ...................................................................................................................... 4
3. RESULTS AND DISCUSSION ............................................................................................... 10
4. CONCLUSIONS..................................................................................................................... 244
REFERENCES ........................................................................................................................... 277
APPENDIX ................................................................................................................................. 299

viii
ix
TABLE OF TABLES
Table 1: Scale for Measure of Soap Quality ................................................................................... 7
Table 2: Linear Regression Parameters for FFA Content vs Time ............................................... 12
Table 3: Characteristics of Industrial WVO vs New Oil Soap ................................................... 222
Table 4: Characteristics of Household WVO vs New Oil Soap ................................................. 233
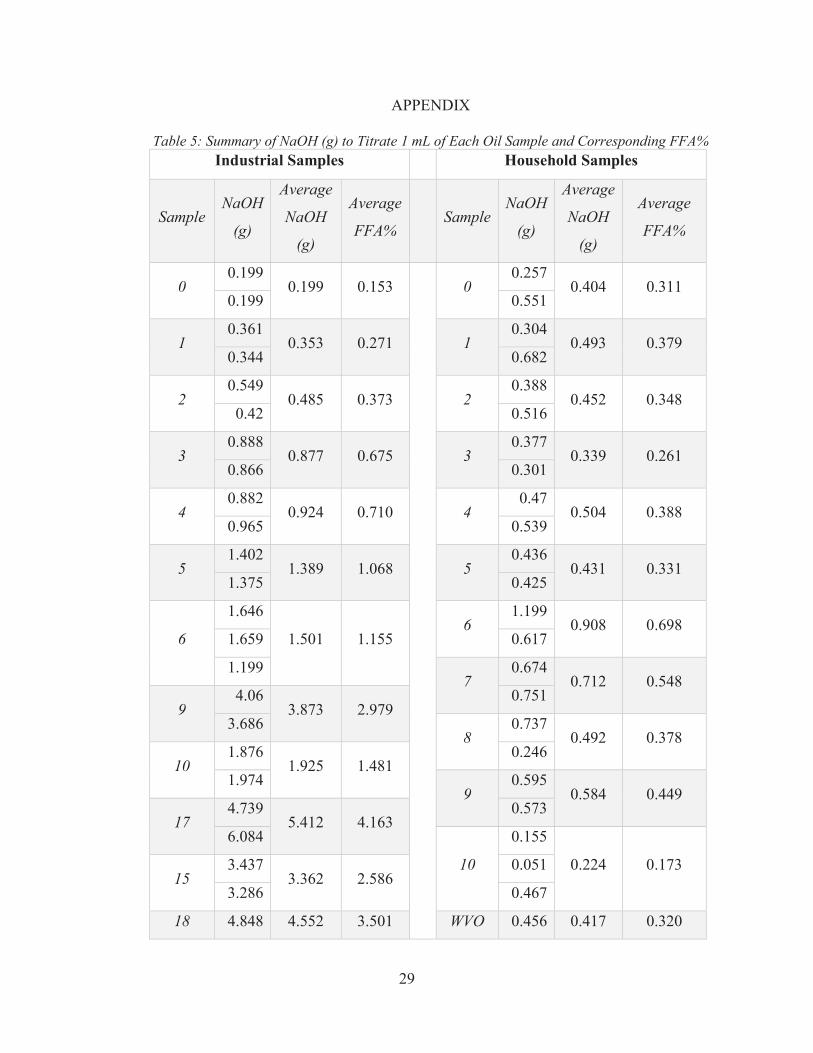
Table 5: Summary of NaOH (g) to Titrate 1 mL of Each Oil Sample and Corresponding FFA%
..................................................................................................................................................... 299
Table 6: Summary of Average HSV Values for Industrial and Household Use Oil Samples .... 311
Table 7: Summary of Scent Test Perception Numbers for Industrial and Household Use Oil
Samples ....................................................................................................................................... 322
TABLE OF FIGURES
Figure 1: Saponification reaction. Image is modified from Đokić, et al. ....................................... 2
Figure 2: Soap mixture at trace. ...................................................................................................... 9
Figure 3: Free fatty acid content of industrial peanut oil with time, with 95% confidence interval
bands. ............................................................................................................................................ 11
Figure 4: FFA content (%) plotted against time (i.e. sample number) for household use samples.
....................................................................................................................................................... 13
Figure 5: Industrial oil samples, from clean (0) to WVO (W)...................................................... 14
Figure 6: HSV values of industrial oil with time. ....................................................................... 166
Figure 7: A comparison of home-usage oil samples, from least used (left) to most used (right).
..................................................................................................................................................... 177
Figure 8: HSV values over time for household use oil samples. ................................................ 188
x
Figure 9: Scent of industrial oil with time. ................................................................................. 199
Figure 10: Impact of fry time on scent of household use samples................................................ 20
Figure 11: A visual comparison of industrial WVO (left) vs. clean oil soaps (right) made with
peanut oil. .................................................................................................................................... 211
Figure 12: A comparison of household WVO (left) vs clean oil soaps (right) made with soybean
oil. ............................................................................................................................................... 233
1
1. INTRODUCTION
1.1 WVO Problem Worldwide
Waste vegetable oils (WVOs) are commonly produced in high quantities in many
countries, with the highest being in the US (10 million tonnes per year) [1]. They are
commonly produced as by-products of community living where foods are fried. In the
United States, the EPA (Environmental Protection Agency) warns that vegetable oils can
cause significant effects to the environment, including: fouling shorelines; coating
animals and plants and suffocating them through depletion of oxygen; destroying food
supplies, breeding animals, and habitats; and being toxic [2]. Large generators of used oil
are required to properly store and dispose of WVOs.
WVO oil consumption is also a sizable problem in Peru. Peru produced 270
tonnes of vegetable oil in 2014, with another 38 tonnes imported; an estimated third of
this oil is discarded as WVO. While estimates are not precise, much of the household
WVO goes down the drains or is disposed of in the trash, while much of the industrial
WVO (i.e. from restaurants) goes to Bioils, a company that collects WVO across South
America and sends it to Europe, where Royal Dutch Shell converts it into biodiesel [3].
Small, remote towns like Porcón, Peru (population 2000, approximately 30 km
from the nearest sizeable city) do not have access to WVO collecting facilities and create
such small quantities of WVO that biodiesel production is not feasible [4]. However, this
WVO can be recycled to lessen environmental impacts and enhance the community by
using the WVO as the primary feedstock in a soap-making process. Such a process can
also provide a means for developing communities to improve personal hygiene [5].
2
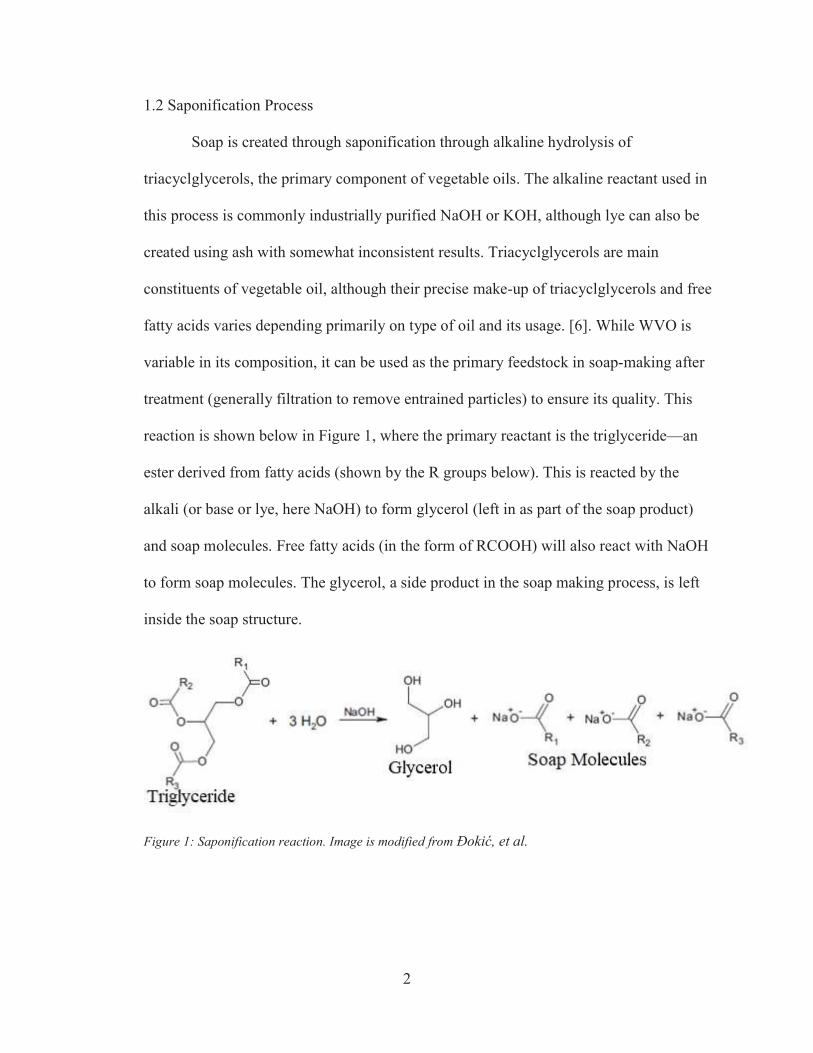
1.2 Saponification Process
Soap is created through saponification through alkaline hydrolysis of
triacyclglycerols, the primary component of vegetable oils. The alkaline reactant used in
this process is commonly industrially purified NaOH or KOH, although lye can also be
created using ash with somewhat inconsistent results. Triacyclglycerols are main
constituents of vegetable oil, although their precise make-up of triacyclglycerols and free
fatty acids varies depending primarily on type of oil and its usage. [6]. While WVO is
variable in its composition, it can be used as the primary feedstock in soap-making after
treatment (generally filtration to remove entrained particles) to ensure its quality. This
reaction is shown below in Figure 1, where the primary reactant is the triglyceride—an
ester derived from fatty acids (shown by the R groups below). This is reacted by the
alkali (or base or lye, here NaOH) to form glycerol (left in as part of the soap product)
and soap molecules. Free fatty acids (in the form of RCOOH) will also react with NaOH
to form soap molecules. The glycerol, a side product in the soap making process, is left
inside the soap structure.
Figure 1: Saponification reaction. Image is modified from Đokić, et al.
3
1.3 Soap Making in Remote Areas
Soap making can be advantageous for small towns where WVO production may
be variable and limited and labor is scarce, making biodiesel production inopportune.
Small-scale soap making processes have been implemented in developing communities
across the world [7]. Although sources for sodium hydroxide may vary in remote areas,
small quantities of sodium hydroxide can be found commercially, such as through
Mercado Libre (equivalent to the U.S. Amazon) in Peru.
Adding a soap-making process to the community of Porcón, Peru will be
advantageous in more than one way. Hand-made artisan soaps will add to the diverse
handcrafted souvenirs offered to tourists visiting Porcón and offer an additional stream of
revenue. Additionally, a soap-making process can help the people of Porcón to be more
environmentally aware and to reduce waste (household and restaurant WVO) by using it
to create valuable products.
1.4 Understanding Properties of WVO through Usage
The characteristics of soap vary greatly depending on the types of oils or fats that
are used to create it. Different vegetable oils have different compositions of fatty acids
which affect properties such has hardness or lather. Vegetable oil also changes properties
with usage. For example, fatty acids can be freed from triglyceride structures causing the
smoke point to decrease; scents of foods fried can be left behind in the waste oil; the
color of the oil can darken; and particulates and water molecules can be left behind from
food items and become incorporated into the oil [8]. These side effects have the potential
4
to impact the quality of the bar of soap created—and have implications for other usages
(such as re-using oil again for frying or using the WVO in biodiesel production). As
usage situations vary, two scenarios were studied for WVO production—industrial (long-
term, almost continual usage of frying oil) and home usage (limited, short-term oil usage
in small quantities over a cook stove).
2. EXPERIMENTAL
2.1. Oil Characterization
2.1.1. FFA Content
Refined vegetable oils contain less than 0.05% free fatty acids, or FFA [9].
However, triglycerides can break down in the presence of water, heat, or other elements
to which they are exposed during use. The free fatty acid content can be measured by
titrating the oil with NaOH (1% wt) and phenolphthalein, an indicator that turns pink
when the pH of the solution exceeds approximately 8.0. In the presence of lye, the fatty
acids will quickly react (in comparison to the triglycerides, that react relatively slowly
through the saponification process). NaOH solution is added until it is in slight excess,
turning the solution pink. The amount of NaOH that must be added to the solution to
neutralize any FFA present is representative of the how broken down the oil molecules
have become during usage scenarios. The approximate free fatty acid content (%) in the
oil is determined by dividing the mL of NaOH solution by 1.3. Titrations were performed
at least two times (more if results were inconsistent with each other) to ensure
consistency and representativeness for each sample [10].
5
2.1.2. Color
Color is important aesthetically and because it affects the color of the final bar.
Color can be measured through an online color summarizer for different qualities of the
color [11]. While there are several ways to measure the color of the samples, color was
measured in terms HSV, a common system for measuring the type of color. HSV stands
for hue, saturation, and value. Hue describes the color; saturation is a measure of how
intense the color is, and value is a measure of how much white or black (i.e. brightness) is
incorporated with the color. Saturation and value are normalized to a scale of 100, where
100 for saturation is completely saturated (i.e. vibrant and not faded); and for value is
completely bright (or no black blended). Hue is expressed in terms of angle in the color
circle with red being 0, followed the other colors rainbow order until 360 [11].
To measure the color of the samples, a picture of each sample was taken on a
white background during the same time of the day (to keep background light constant).
All samples were taken in the same type of container to keep the thickness uniform
between samples, as the oil appears darker or lighter depending on its thickness. The
picture was then analyzed for its color content based on HSV, using an online color
summarizer that analyzes the color of each pixel in the picture taken. Average values are
reported below.
2.1.3. Scent
Much of the scent in WVO is eliminated during the saponification process;
however, odorous WVO can be unpleasant to work with and can also carry through to the
6
final bar of soap. Scent can be measured by perception on a scale of 1 to 5, as shown
below. Scent tests were performed twice for each unfiltered sample, and if the results
were more than 1 different, the scent tests were repeated until the results were consistent.
These tests were performed by one individual; however, the tests were performed for the
samples randomly and blindly as to remove as much uncertainty and bias as possible. The
average scent value is recorded in the Results section.
1—strong and lingering scent of fried food
2—noticeable and somewhat strong scent of fried food
3—mild scent of fried food
4—strong scent of oil, or very weak scent of fried food
5—no noticeable scent, neutral scent, or very weak scent of oil
2.1.4. Soap Quality
While soap cannot be produced for every sample of oil during usage, soap quality
can be assessed for clean and completely used oil. Soap was assessed for the following
qualities: hardness, lather, conditioning effect, and scent. Soaps were tested after they had
reached a safe pH range (8-10). Hardness is measured by dropping a hammer from a
fixed height on a screw and seeing how deeply the screw penetrates the soap. Smell is
judged by smelling the bar of soap after use. Lather is based off the number of bubbles
formed after lathering with soap for 10-15 seconds. Conditioning is how the hands feel
after washing with the soap.
7
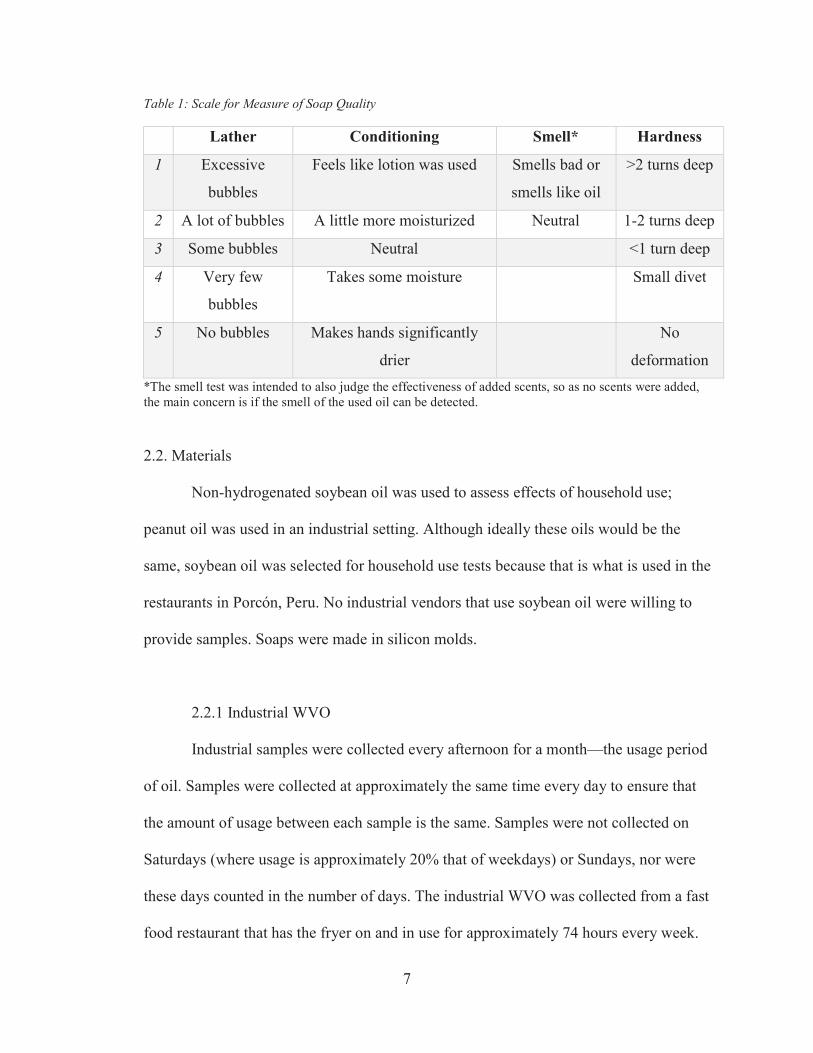
Table 1: Scale for Measure of Soap Quality
Lather Conditioning Smell* Hardness
1 Excessive
bubbles
Feels like lotion was used Smells bad or
smells like oil
>2 turns deep
2 A lot of bubbles A little more moisturized Neutral 1-2 turns deep
3 Some bubbles Neutral <1 turn deep
4 Very few
bubbles
Takes some moisture Small divet
5 No bubbles Makes hands significantly
drier
No
deformation *The smell test was intended to also judge the effectiveness of added scents, so as no scents were added, the main concern is if the smell of the used oil can be detected.
2.2. Materials
Non-hydrogenated soybean oil was used to assess effects of household use;
peanut oil was used in an industrial setting. Although ideally these oils would be the
same, soybean oil was selected for household use tests because that is what is used in the
restaurants in Porcón, Peru. No industrial vendors that use soybean oil were willing to
provide samples. Soaps were made in silicon molds.
2.2.1 Industrial WVO
Industrial samples were collected every afternoon for a month—the usage period
of oil. Samples were collected at approximately the same time every day to ensure that
the amount of usage between each sample is the same. Samples were not collected on
Saturdays (where usage is approximately 20% that of weekdays) or Sundays, nor were
these days counted in the number of days. The industrial WVO was collected from a fast
food restaurant that has the fryer on and in use for approximately 74 hours every week.
8
The oil is used to fry primarily chicken and potatoes. 20 samples were collected. These
samples were each tested for color, scent, and FFA value. Final WVO was used to make
soap samples.
2.2.2 Household WVO
Household samples were created by using soybean oil in frying. The oil was used
to fry assorted items, such as potatoes, donuts, onion rings, and battered fish (tilapia).
Samples were collected between frying like items. One batch of household oil was
created, with a total 12 samples. These samples were each tested for color, scent, and
FFA value. Final WVO was used to make soap samples.
2.4 Soap Creation
Soap was created by following a standard procedure as outlined below.
1. The desired amount of vegetable oil (unused or filtered WVO) was weighed,
generally 200 g.
2. Personal protective equipment (PPE) was donned. This included closed-toed
shoes, eye glasses or goggles, apron, and gloves.
3. The corresponding NaOH was weighed. This was determined using standard
saponification numbers: 0.133 for peanut oil and 0.136 for soybean oil [12]. The
saponification number means that for every gram oil, there is the corresponding
part of NaOH. Thus for soybean oil, each gram of oil requires 0.136 grams of
NaOH to completely saponify the oil.
9
4. The corresponding quantity of water was measured. Water and NaOH were used
in a 1:1 weight ratio.
5. The NaOH was slowly poured into the water and agitated until the NaOH was
fully dissolved in the water. Note that this is an exothermic process, so the
container would often become warm to the touch.
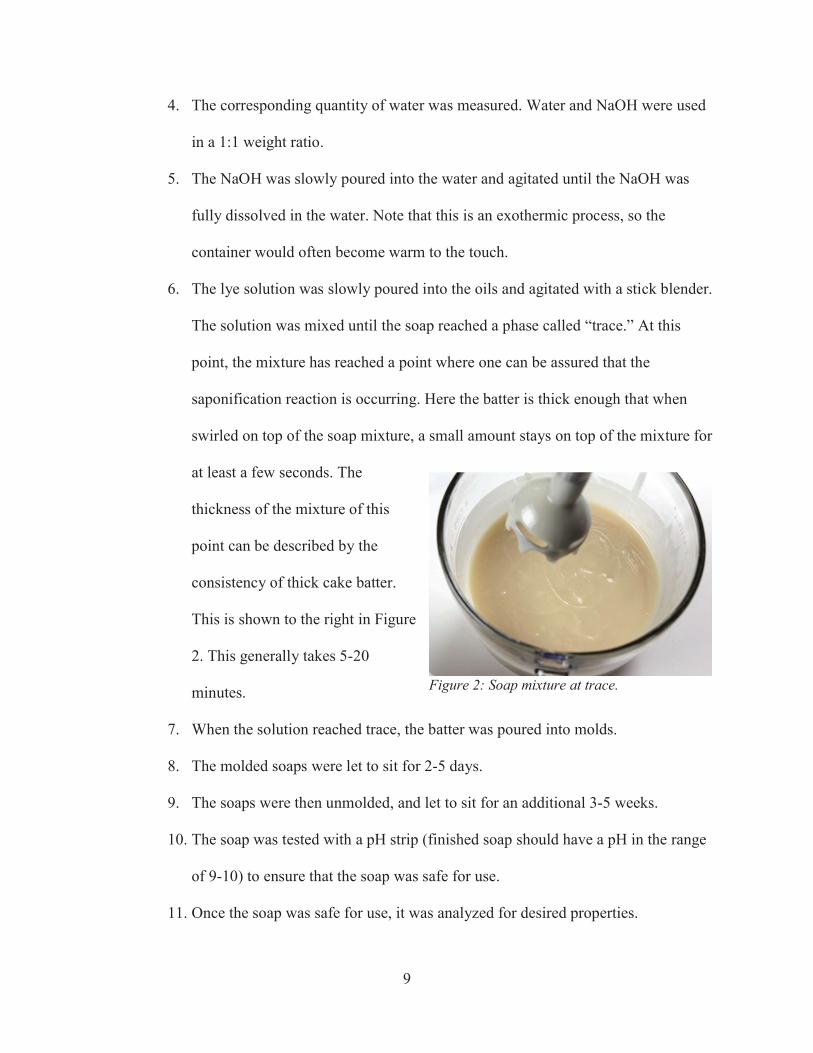
6. The lye solution was slowly poured into the oils and agitated with a stick blender.
The solution was mixed until the soap reached a phase called “trace.” At this
point, the mixture has reached a point where one can be assured that the
saponification reaction is occurring. Here the batter is thick enough that when
swirled on top of the soap mixture, a small amount stays on top of the mixture for
at least a few seconds. The
thickness of the mixture of this
point can be described by the
consistency of thick cake batter.
This is shown to the right in Figure
2. This generally takes 5-20
minutes.
7. When the solution reached trace, the batter was poured into molds.
8. The molded soaps were let to sit for 2-5 days.
9. The soaps were then unmolded, and let to sit for an additional 3-5 weeks.
10. The soap was tested with a pH strip (finished soap should have a pH in the range
of 9-10) to ensure that the soap was safe for use.
11. Once the soap was safe for use, it was analyzed for desired properties.
Figure 2: Soap mixture at trace.
10
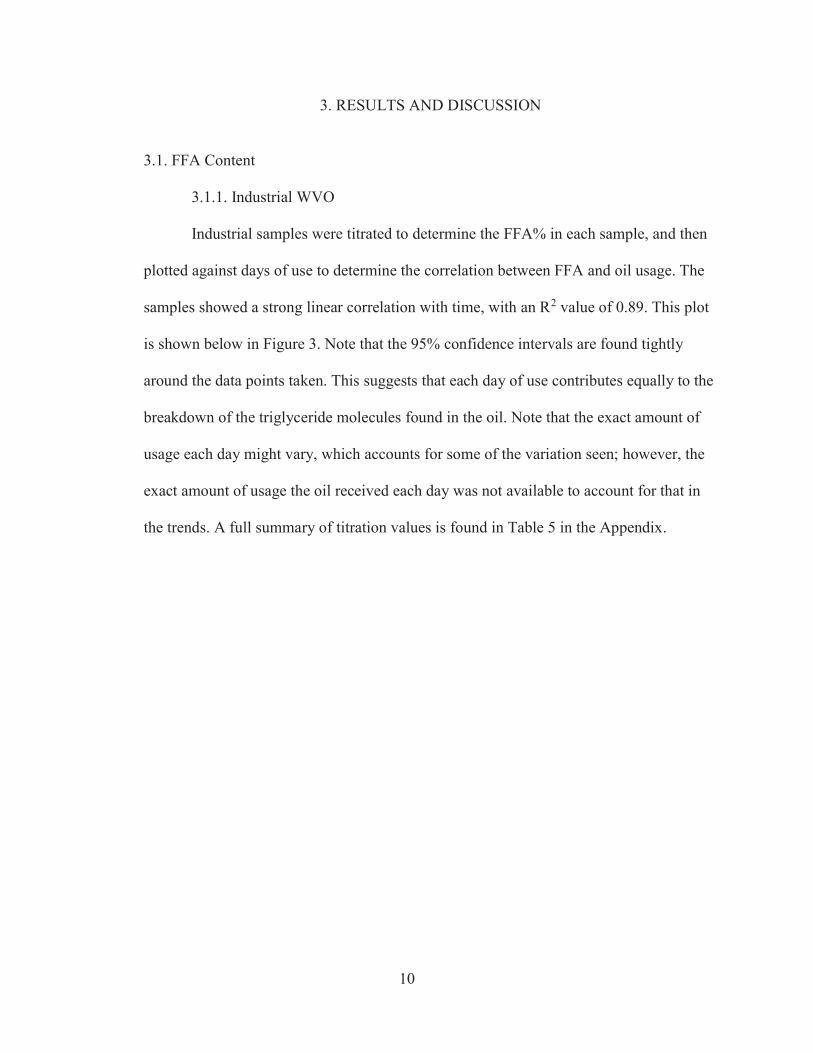
3. RESULTS AND DISCUSSION
3.1. FFA Content
3.1.1. Industrial WVO
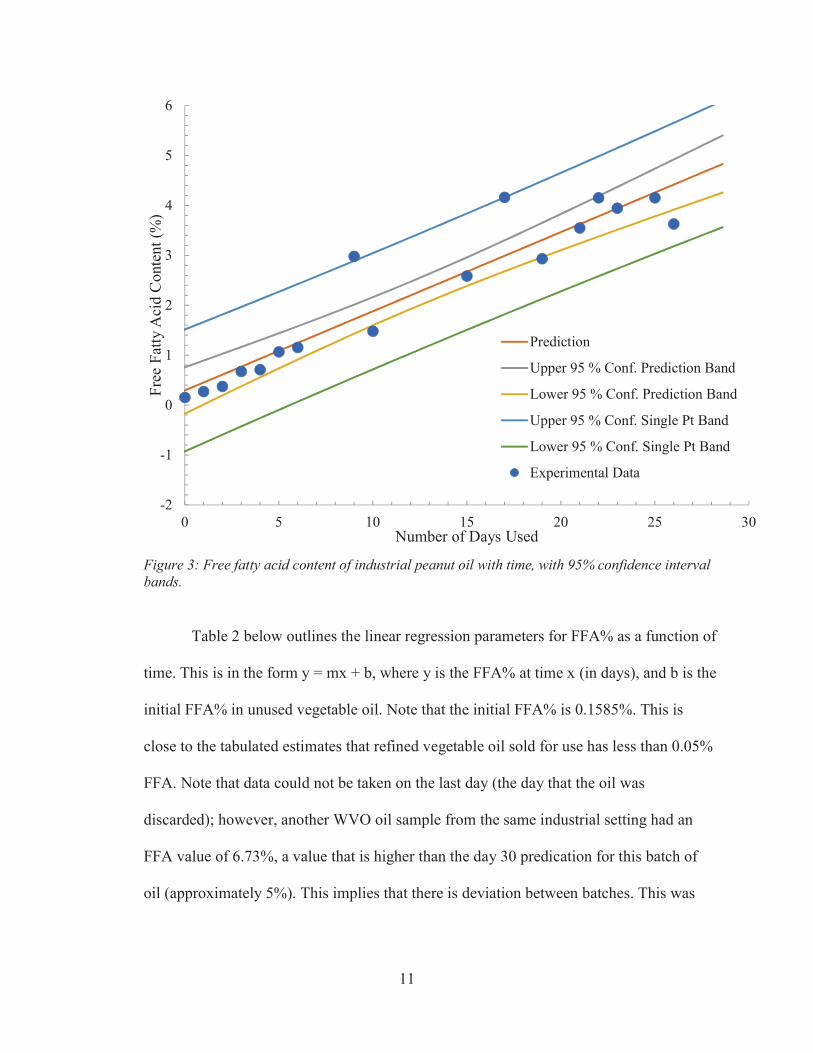
Industrial samples were titrated to determine the FFA% in each sample, and then
plotted against days of use to determine the correlation between FFA and oil usage. The
samples showed a strong linear correlation with time, with an R2 value of 0.89. This plot
is shown below in Figure 3. Note that the 95% confidence intervals are found tightly
around the data points taken. This suggests that each day of use contributes equally to the
breakdown of the triglyceride molecules found in the oil. Note that the exact amount of
usage each day might vary, which accounts for some of the variation seen; however, the
exact amount of usage the oil received each day was not available to account for that in
the trends. A full summary of titration values is found in Table 5 in the Appendix.
11
Figure 3: Free fatty acid content of industrial peanut oil with time, with 95% confidence interval bands.
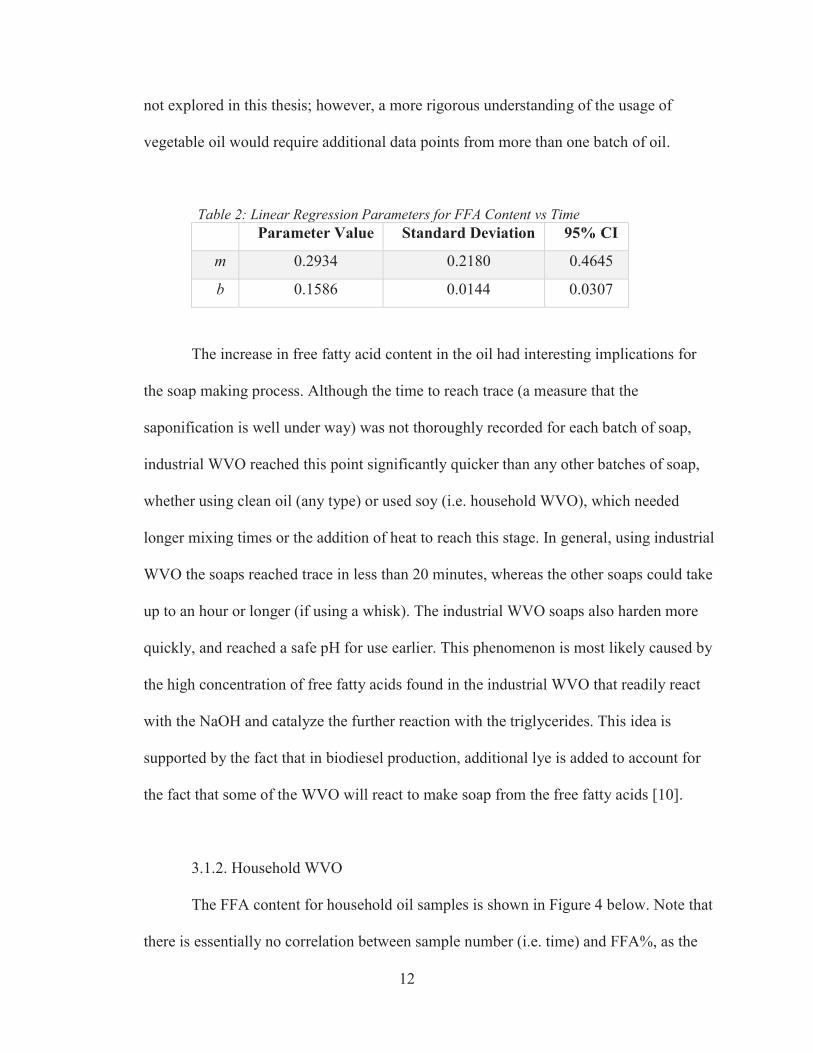
Table 2 below outlines the linear regression parameters for FFA% as a function of
time. This is in the form y = mx + b, where y is the FFA% at time x (in days), and b is the
initial FFA% in unused vegetable oil. Note that the initial FFA% is 0.1585%. This is
close to the tabulated estimates that refined vegetable oil sold for use has less than 0.05%
FFA. Note that data could not be taken on the last day (the day that the oil was
discarded); however, another WVO oil sample from the same industrial setting had an
FFA value of 6.73%, a value that is higher than the day 30 predication for this batch of
oil (approximately 5%). This implies that there is deviation between batches. This was
-2
-1
0
1
2
3
4
5
6
0 5 10 15 20 25 30
Free
Fat
ty A
cid
Con
tent
(%)
Number of Days Used
Prediction
Upper 95 % Conf. Prediction Band
Lower 95 % Conf. Prediction Band
Upper 95 % Conf. Single Pt Band
Lower 95 % Conf. Single Pt Band
Experimental Data
12
not explored in this thesis; however, a more rigorous understanding of the usage of
vegetable oil would require additional data points from more than one batch of oil.
Table 2: Linear Regression Parameters for FFA Content vs Time Parameter Value Standard Deviation 95% CI
m 0.2934 0.2180 0.4645
b 0.1586 0.0144 0.0307
The increase in free fatty acid content in the oil had interesting implications for
the soap making process. Although the time to reach trace (a measure that the
saponification is well under way) was not thoroughly recorded for each batch of soap,
industrial WVO reached this point significantly quicker than any other batches of soap,
whether using clean oil (any type) or used soy (i.e. household WVO), which needed
longer mixing times or the addition of heat to reach this stage. In general, using industrial
WVO the soaps reached trace in less than 20 minutes, whereas the other soaps could take
up to an hour or longer (if using a whisk). The industrial WVO soaps also harden more
quickly, and reached a safe pH for use earlier. This phenomenon is most likely caused by
the high concentration of free fatty acids found in the industrial WVO that readily react
with the NaOH and catalyze the further reaction with the triglycerides. This idea is
supported by the fact that in biodiesel production, additional lye is added to account for
the fact that some of the WVO will react to make soap from the free fatty acids [10].
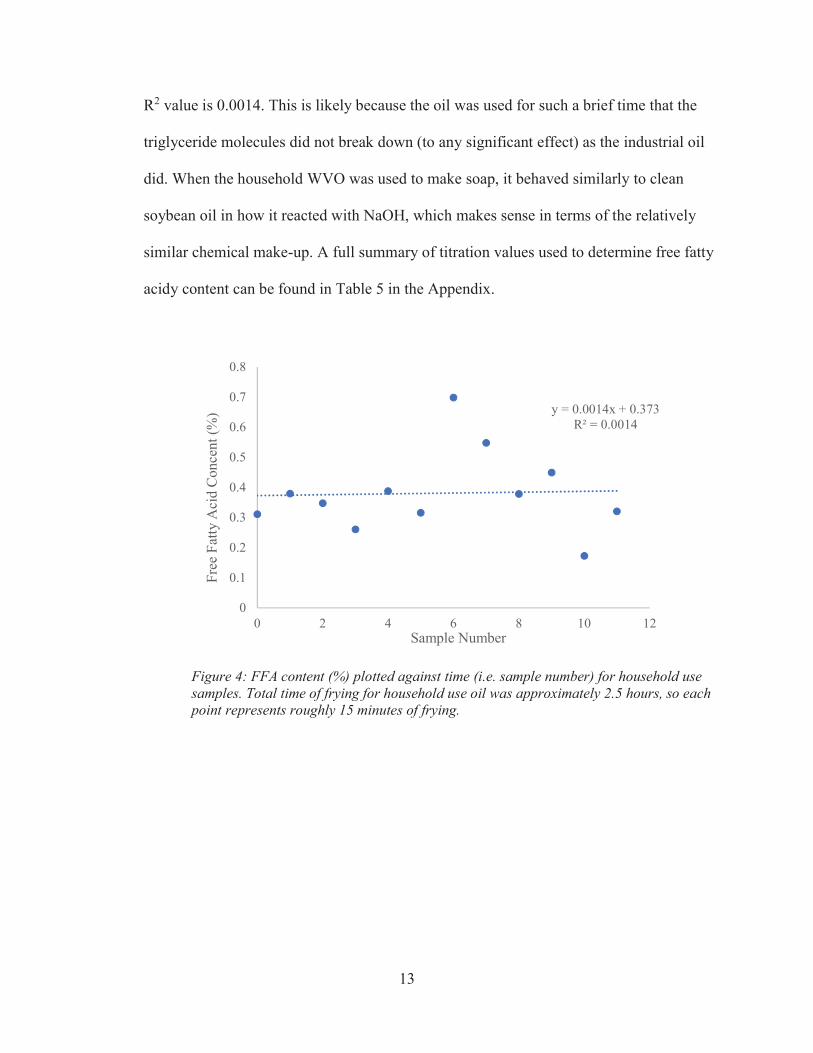
3.1.2. Household WVO
The FFA content for household oil samples is shown in Figure 4 below. Note that
there is essentially no correlation between sample number (i.e. time) and FFA%, as the
13
R2 value is 0.0014. This is likely because the oil was used for such a brief time that the
triglyceride molecules did not break down (to any significant effect) as the industrial oil
did. When the household WVO was used to make soap, it behaved similarly to clean
soybean oil in how it reacted with NaOH, which makes sense in terms of the relatively
similar chemical make-up. A full summary of titration values used to determine free fatty
acidy content can be found in Table 5 in the Appendix.
Figure 4: FFA content (%) plotted against time (i.e. sample number) for household use samples. Total time of frying for household use oil was approximately 2.5 hours, so each point represents roughly 15 minutes of frying.
y = 0.0014x + 0.373R² = 0.0014
0
0.1
0.2
0.3
0.4
0.5
0.6
0.7
0.8
0 2 4 6 8 10 12
Free
Fat
ty A
cid
Con
cent
(%)
Sample Number
14
3.2. Color
3.2.1. Industrial WVO
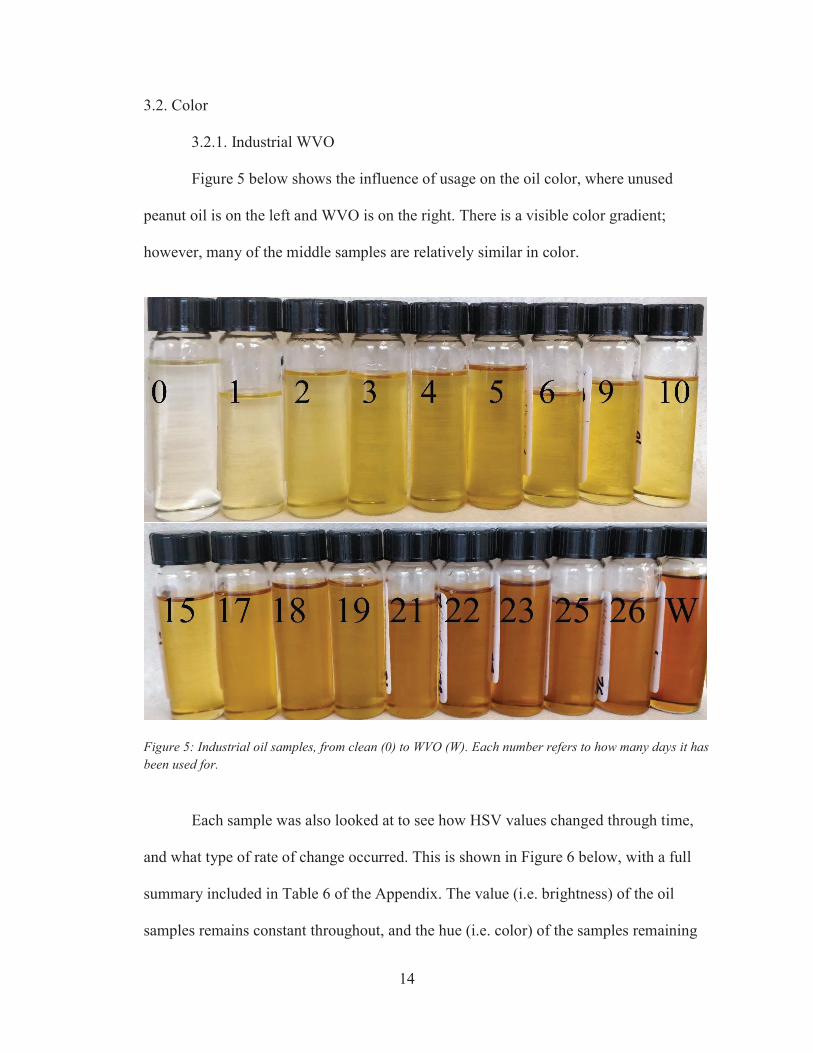
Figure 5 below shows the influence of usage on the oil color, where unused
peanut oil is on the left and WVO is on the right. There is a visible color gradient;
however, many of the middle samples are relatively similar in color.
Figure 5: Industrial oil samples, from clean (0) to WVO (W). Each number refers to how many days it has been used for.
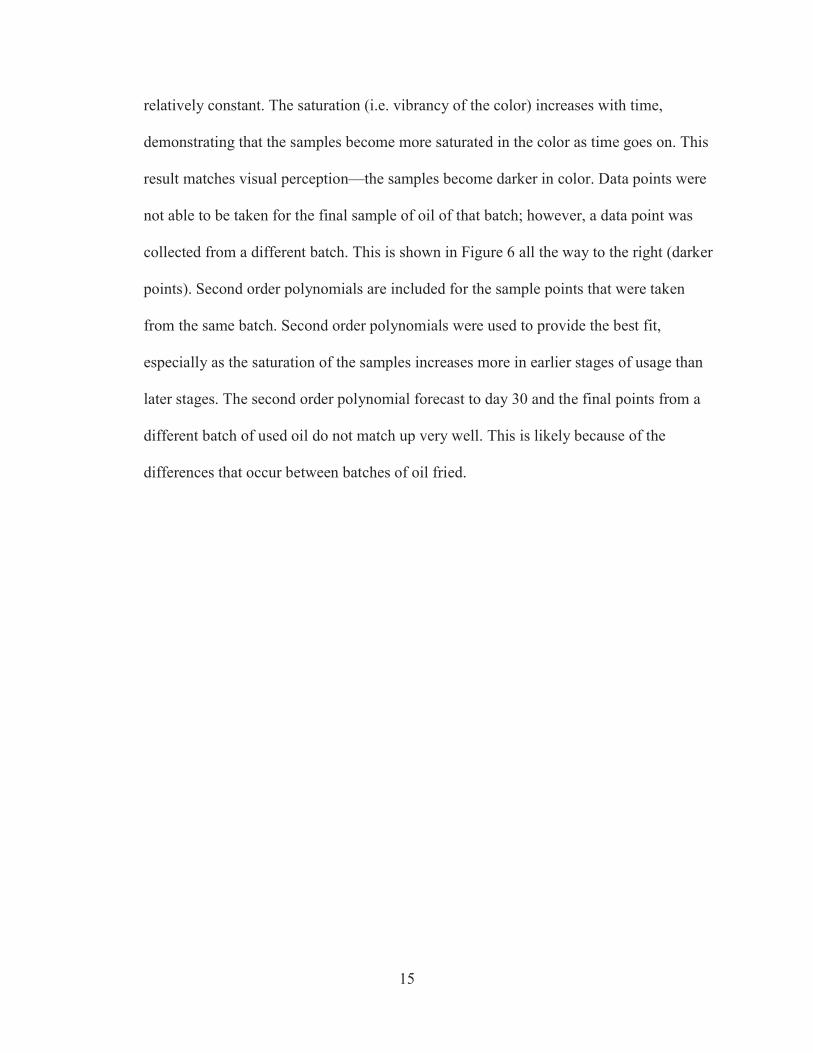
Each sample was also looked at to see how HSV values changed through time,
and what type of rate of change occurred. This is shown in Figure 6 below, with a full
summary included in Table 6 of the Appendix. The value (i.e. brightness) of the oil
samples remains constant throughout, and the hue (i.e. color) of the samples remaining
15
relatively constant. The saturation (i.e. vibrancy of the color) increases with time,
demonstrating that the samples become more saturated in the color as time goes on. This
result matches visual perception—the samples become darker in color. Data points were
not able to be taken for the final sample of oil of that batch; however, a data point was
collected from a different batch. This is shown in Figure 6 all the way to the right (darker
points). Second order polynomials are included for the sample points that were taken
from the same batch. Second order polynomials were used to provide the best fit,
especially as the saturation of the samples increases more in earlier stages of usage than
later stages. The second order polynomial forecast to day 30 and the final points from a
different batch of used oil do not match up very well. This is likely because of the
differences that occur between batches of oil fried.
16
Figure 6: HSV values of industrial oil with time. Final points (all the way to the right) are WVO samples from a different batch of industrial vegetable oil. Lines between points are to guide the eye.
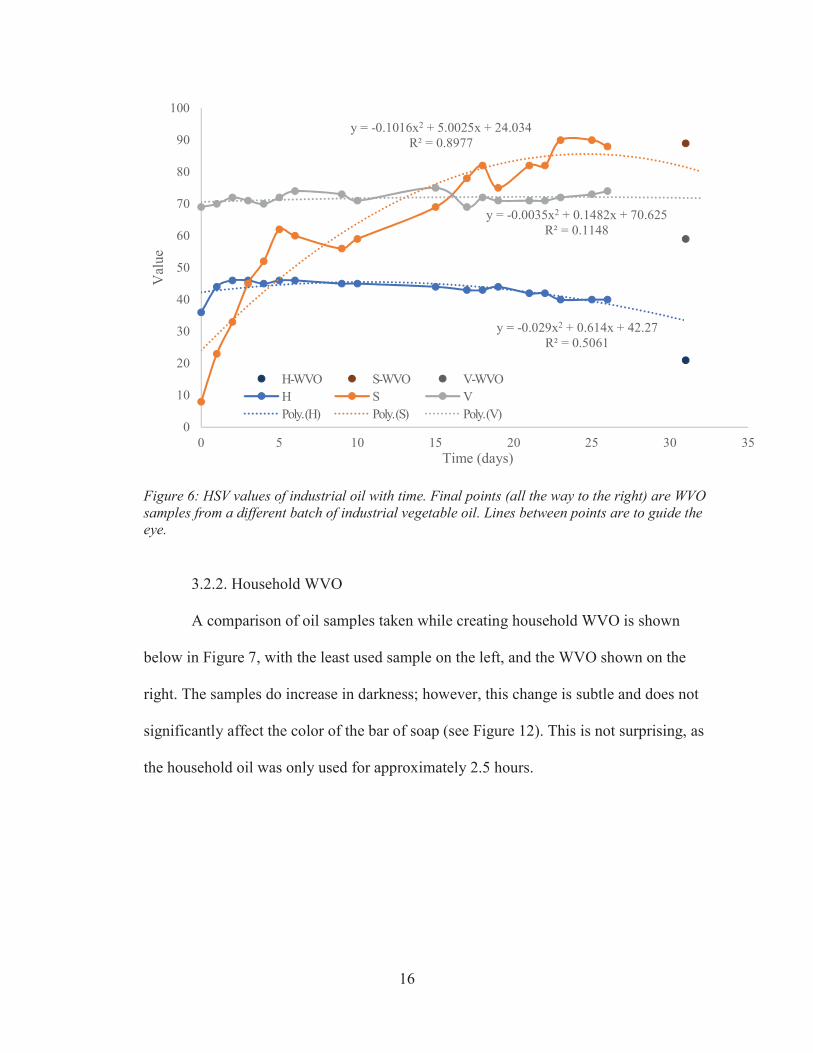
3.2.2. Household WVO
A comparison of oil samples taken while creating household WVO is shown
below in Figure 7, with the least used sample on the left, and the WVO shown on the
right. The samples do increase in darkness; however, this change is subtle and does not
significantly affect the color of the bar of soap (see Figure 12). This is not surprising, as
the household oil was only used for approximately 2.5 hours.
y = -0.029x2 + 0.614x + 42.27R² = 0.5061
y = -0.1016x2 + 5.0025x + 24.034R² = 0.8977
y = -0.0035x2 + 0.1482x + 70.625R² = 0.1148
0
10
20
30
40
50
60
70
80
90
100
0 5 10 15 20 25 30 35
Val
ue
Time (days)
H-WVO S-WVO V-WVOH S VPoly. (H) Poly. (S) Poly. (V)
17
Figure 7: A comparison of home-usage oil samples, from least used (left) to most used (right).
These samples were analyzed to determine the precise color differences that occur
over time, as shown in Figure 8 (HSV values). A full summary can be found in Table 6 of
the Appendix. As can be seen, the HSV values remained relatively constant except for the
saturation level. The value and hue values (constant here) are relatively similar to that of
the industrial samples, confirming that the pictures were taken in relatively similar
lighting and that the oils can be compared for color changes. The saturation value also
starts at approximately the same value. Unlike the value and hue values, the saturation
18
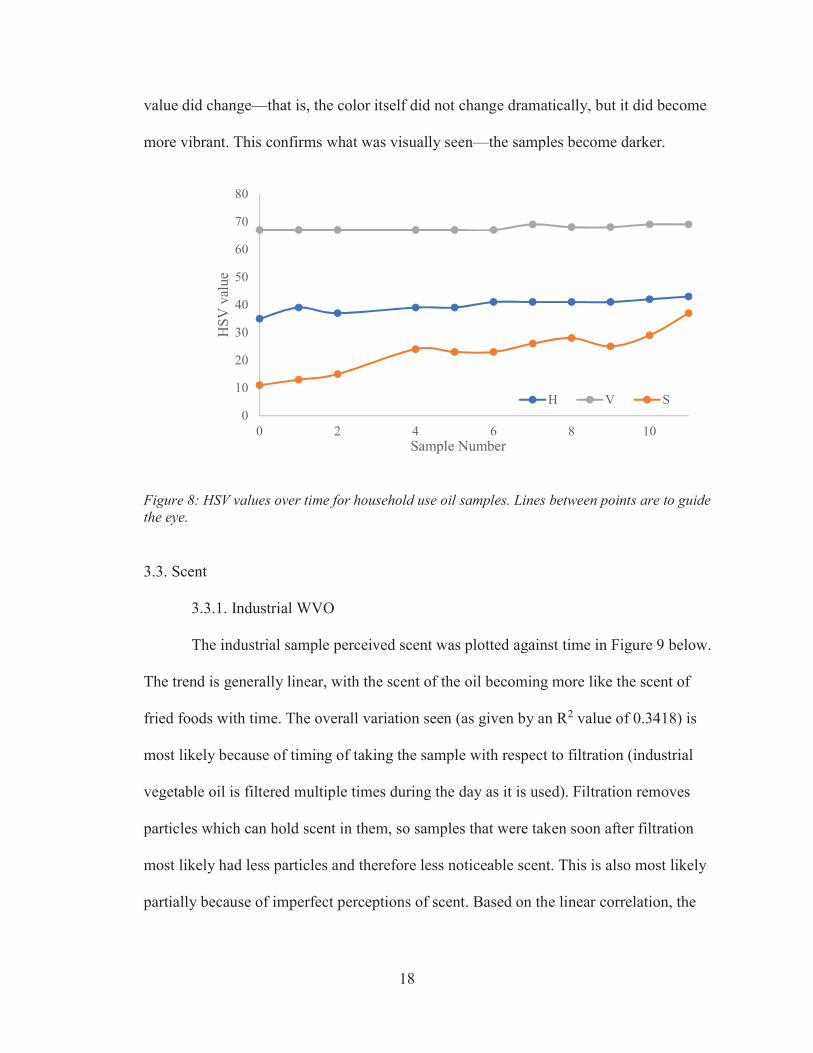
value did change—that is, the color itself did not change dramatically, but it did become
more vibrant. This confirms what was visually seen—the samples become darker.
Figure 8: HSV values over time for household use oil samples. Lines between points are to guide the eye.
3.3. Scent
3.3.1. Industrial WVO
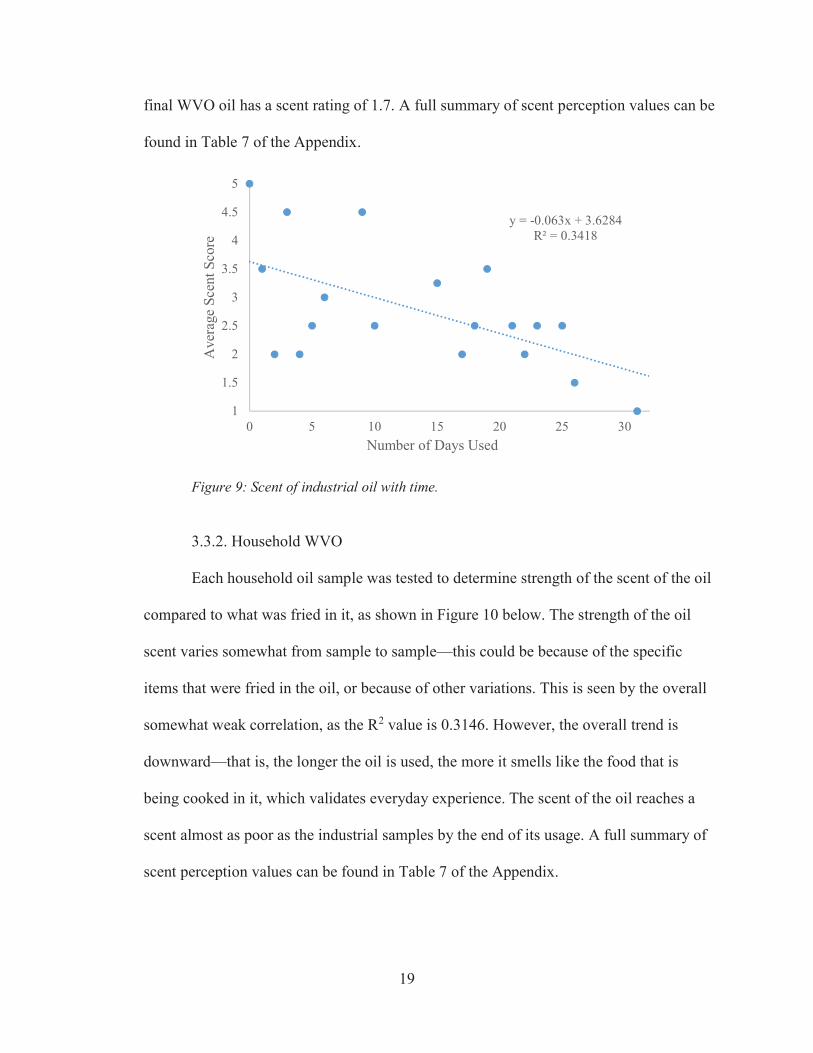
The industrial sample perceived scent was plotted against time in Figure 9 below.
The trend is generally linear, with the scent of the oil becoming more like the scent of
fried foods with time. The overall variation seen (as given by an R2 value of 0.3418) is
most likely because of timing of taking the sample with respect to filtration (industrial
vegetable oil is filtered multiple times during the day as it is used). Filtration removes
particles which can hold scent in them, so samples that were taken soon after filtration
most likely had less particles and therefore less noticeable scent. This is also most likely
partially because of imperfect perceptions of scent. Based on the linear correlation, the
0
10
20
30
40
50
60
70
80
0 2 4 6 8 10
HSV
val
ue
Sample Number
H V S
19
final WVO oil has a scent rating of 1.7. A full summary of scent perception values can be
found in Table 7 of the Appendix.
Figure 9: Scent of industrial oil with time.
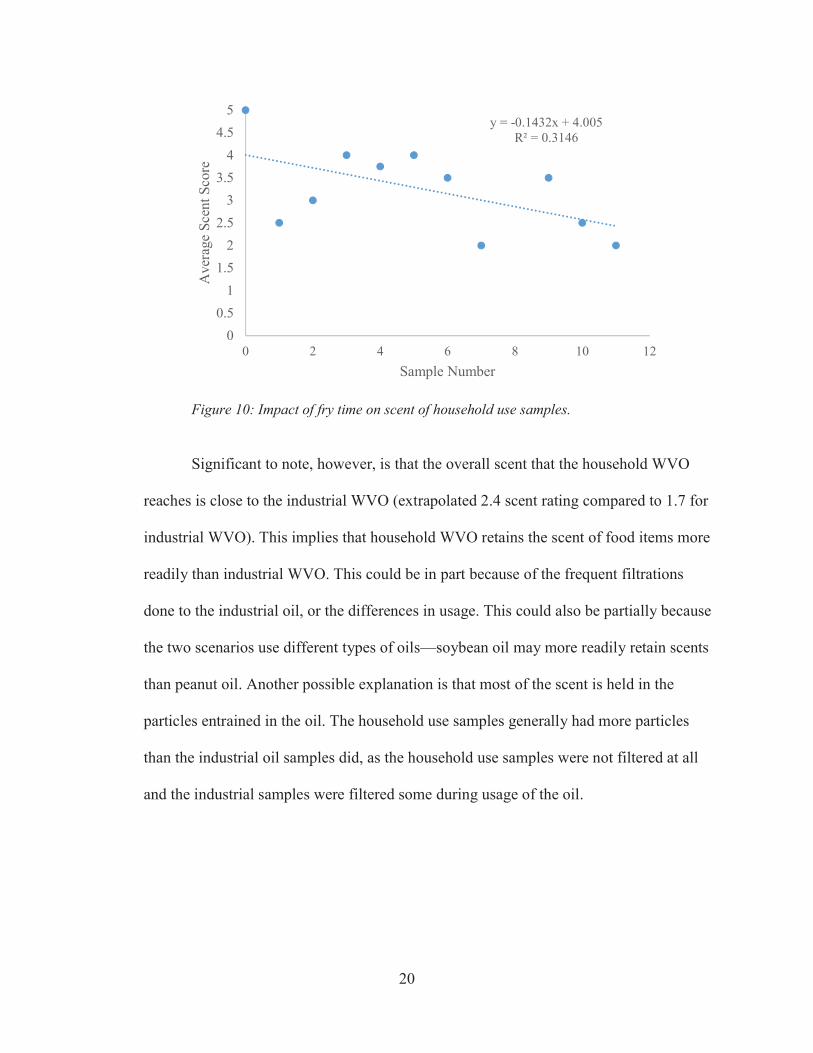
3.3.2. Household WVO
Each household oil sample was tested to determine strength of the scent of the oil
compared to what was fried in it, as shown in Figure 10 below. The strength of the oil
scent varies somewhat from sample to sample—this could be because of the specific
items that were fried in the oil, or because of other variations. This is seen by the overall
somewhat weak correlation, as the R2 value is 0.3146. However, the overall trend is
downward—that is, the longer the oil is used, the more it smells like the food that is
being cooked in it, which validates everyday experience. The scent of the oil reaches a
scent almost as poor as the industrial samples by the end of its usage. A full summary of
scent perception values can be found in Table 7 of the Appendix.
y = -0.063x + 3.6284R² = 0.3418
1
1.5
2
2.5
3
3.5
4
4.5
5
0 5 10 15 20 25 30
Ave
rage
Sce
nt S
core
Number of Days Used
20
Figure 10: Impact of fry time on scent of household use samples.
Significant to note, however, is that the overall scent that the household WVO
reaches is close to the industrial WVO (extrapolated 2.4 scent rating compared to 1.7 for
industrial WVO). This implies that household WVO retains the scent of food items more
readily than industrial WVO. This could be in part because of the frequent filtrations
done to the industrial oil, or the differences in usage. This could also be partially because
the two scenarios use different types of oils—soybean oil may more readily retain scents
than peanut oil. Another possible explanation is that most of the scent is held in the
particles entrained in the oil. The household use samples generally had more particles
than the industrial oil samples did, as the household use samples were not filtered at all
and the industrial samples were filtered some during usage of the oil.
y = -0.1432x + 4.005R² = 0.3146
00.5
11.5
22.5
33.5
44.5
5
0 2 4 6 8 10 12
Ave
rage
Sce
nt S
core
Sample Number
21
3.4. Soap Characterization
3.4.1. Industrial WVO
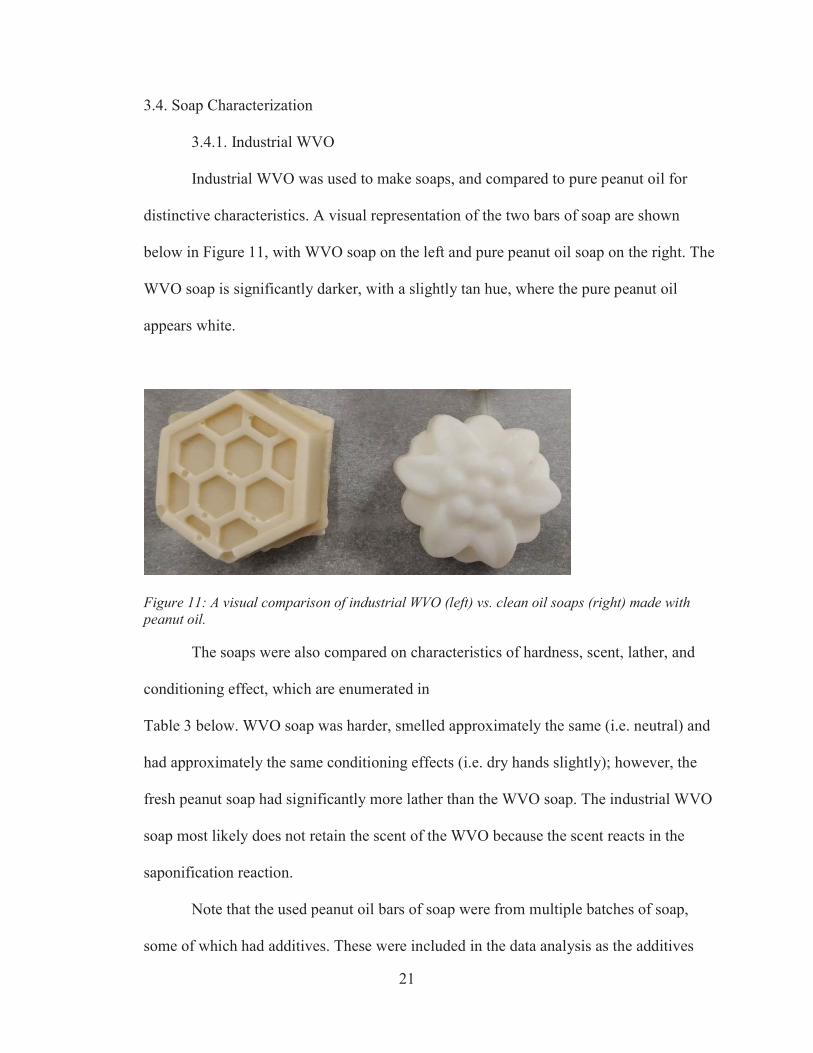
Industrial WVO was used to make soaps, and compared to pure peanut oil for
distinctive characteristics. A visual representation of the two bars of soap are shown
below in Figure 11, with WVO soap on the left and pure peanut oil soap on the right. The
WVO soap is significantly darker, with a slightly tan hue, where the pure peanut oil
appears white.
Figure 11: A visual comparison of industrial WVO (left) vs. clean oil soaps (right) made with peanut oil. The soaps were also compared on characteristics of hardness, scent, lather, and
conditioning effect, which are enumerated in
Table 3 below. WVO soap was harder, smelled approximately the same (i.e. neutral) and
had approximately the same conditioning effects (i.e. dry hands slightly); however, the
fresh peanut soap had significantly more lather than the WVO soap. The industrial WVO
soap most likely does not retain the scent of the WVO because the scent reacts in the
saponification reaction.
Note that the used peanut oil bars of soap were from multiple batches of soap,
some of which had additives. These were included in the data analysis as the additives
22
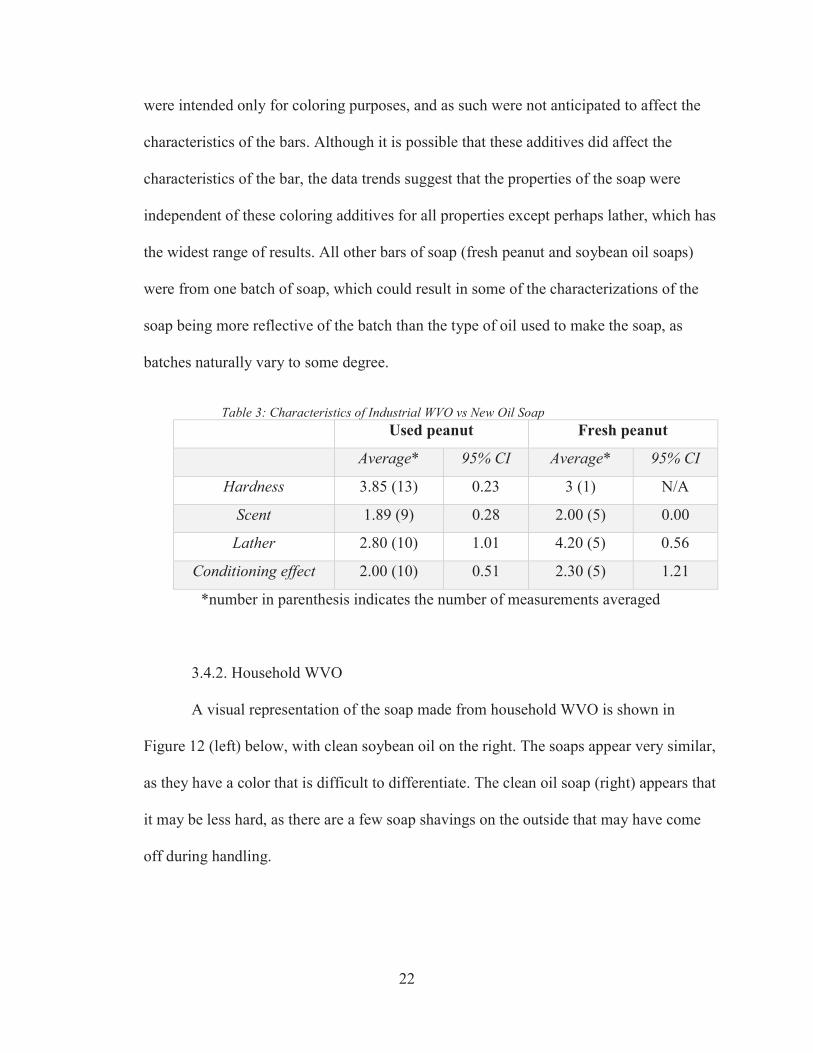
were intended only for coloring purposes, and as such were not anticipated to affect the
characteristics of the bars. Although it is possible that these additives did affect the
characteristics of the bar, the data trends suggest that the properties of the soap were
independent of these coloring additives for all properties except perhaps lather, which has
the widest range of results. All other bars of soap (fresh peanut and soybean oil soaps)
were from one batch of soap, which could result in some of the characterizations of the
soap being more reflective of the batch than the type of oil used to make the soap, as
batches naturally vary to some degree.
Table 3: Characteristics of Industrial WVO vs New Oil Soap
Used peanut Fresh peanut
Average* 95% CI Average* 95% CI
Hardness 3.85 (13) 0.23 3 (1) N/A
Scent 1.89 (9) 0.28 2.00 (5) 0.00
Lather 2.80 (10) 1.01 4.20 (5) 0.56
Conditioning effect 2.00 (10) 0.51 2.30 (5) 1.21
*number in parenthesis indicates the number of measurements averaged
3.4.2. Household WVO
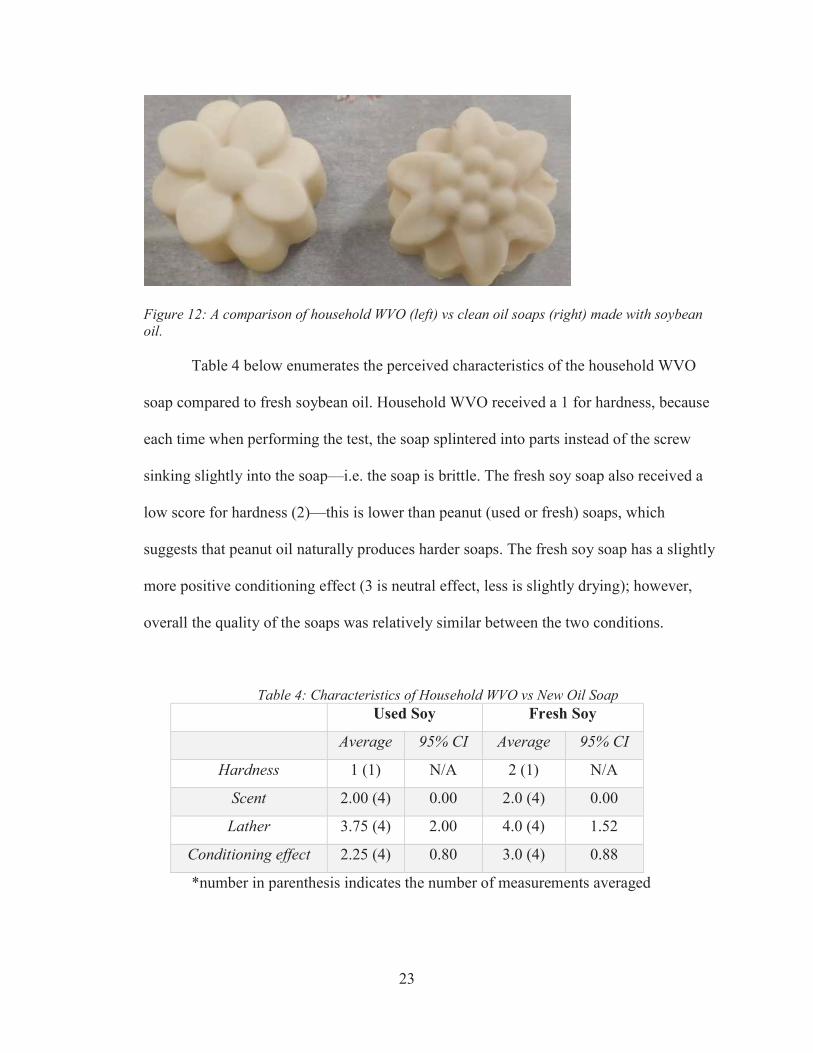
A visual representation of the soap made from household WVO is shown in
Figure 12 (left) below, with clean soybean oil on the right. The soaps appear very similar,
as they have a color that is difficult to differentiate. The clean oil soap (right) appears that
it may be less hard, as there are a few soap shavings on the outside that may have come
off during handling.
23
Figure 12: A comparison of household WVO (left) vs clean oil soaps (right) made with soybean oil.
Table 4 below enumerates the perceived characteristics of the household WVO
soap compared to fresh soybean oil. Household WVO received a 1 for hardness, because
each time when performing the test, the soap splintered into parts instead of the screw
sinking slightly into the soap—i.e. the soap is brittle. The fresh soy soap also received a
low score for hardness (2)—this is lower than peanut (used or fresh) soaps, which
suggests that peanut oil naturally produces harder soaps. The fresh soy soap has a slightly
more positive conditioning effect (3 is neutral effect, less is slightly drying); however,
overall the quality of the soaps was relatively similar between the two conditions.
Table 4: Characteristics of Household WVO vs New Oil Soap Used Soy Fresh Soy
Average 95% CI Average 95% CI
Hardness 1 (1) N/A 2 (1) N/A
Scent 2.00 (4) 0.00 2.0 (4) 0.00
Lather 3.75 (4) 2.00 4.0 (4) 1.52
Conditioning effect 2.25 (4) 0.80 3.0 (4) 0.88
*number in parenthesis indicates the number of measurements averaged
24
4. CONCLUSIONS
4.1 Summary of Results and Conclusions
The usage of the oil has the potential to significantly impact its qualities. For
example, oil used in industrial settings (i.e. long-term, intensive use) experienced a
notable change in properties, including increase in FFA content to approximately 5%, a
significant darkening of color, and the acquiring of scent of fried food. However,
household WVO remained largely the same as fresh oil for all characteristics except for
scent, which readily reached approximately the same scent of industrial WVO.
These changes in the oil had an impact on the quality of the soap that they were
used in. For example, industrial WVO soap was darker in color than soap made from
fresh peanut oil, and was harder; however, fresh peanut oil soap had more lather. The
qualities of scent and condition effect were not significantly affected between the two.
The industrial WVO had the very positive effect of accelerating the saponification
reaction, making it easy to make soap without the use of an electric mixture or the
addition of heat.
4.2 Implications for Soap-Making in Porcón, Peru
We anticipate that the WVO in Porcón, Peru will be similar to WVO created, as
the soybean oil used in the restaurants is discarded daily. As such, the oil will likely still
have the scent of the fried foods (primarily fish and potatoes), will be a slightly darker
color, although will have the same chemical make-up. If this is the case, the WVO will
create soap that is very similar to soap made from fresh soybean oil, although it may be
brittle and have somewhat less lather. These poor qualities may be partially overcome by
25
additions to the soap of salt (for hardness) and sugar (for lather), as well as making soaps
with a mixture of oils instead of one type. These changes could be explored more to
confirm that these changes would be effective. Overall, we anticipate that soap from
WVO in Porcón will give a high-quality product that will appeal to tourists (their
intended use for the soap).
4.2 Recommendations for Further Experimentation
Given limited resources and the time-consuming nature of the data collection, the
quantity of data collected was limited. To give more confidence in the results presented
in this thesis, the effects of usage on vegetable oil quality should be studied more
rigorously. For home use samples, we recommend taking samples as oil is used in frying
from multiple individuals (and cultures) that have assorted styles of frying—and different
foods that are fried. Additionally, for industrial samples, we recommend taking samples
from multiple fryers in the same usage, as well as from different restaurants. A broader
data set would give greater insight into the impact of usage on oil quality, as well as the
types of usage that most drastically affect the oil quality.
Additionally, as the oil types were different in the usage scenarios (peanut in
industrial, soybean in household), comparison between usage impacts between the two
scenarios is not perfectly valid. As such, we recommend sampling oil usage where the
type of oil used is the same. Other studies could also be done to analyze the relative
resistance of several types of oil to breakdown; however, these studies should be done
when comparing similar usage scenarios.
26
Also, characterization of soap properties was done with only 3 individuals; further
testing of the soaps from a varied audience would give greater confidence in the reported
soap characteristics in the report. We also recommend making multiple batches of soap
with the same type of oil to ensure that the characteristics of the soap are not batch-
specific, but are oil-specific.
Finally, additional work could be done to connect some of the properties
discussed above. For example, correlations and relationships could be developed between
the FFA content of the sample, its saturation, and the amount of mixing time for the soap
to reach trace. These correlations would allow for an easy way to predict the performance
of the oil in a soap-making setting.
27
REFERENCES
[1] Đokić M, Kesić Ž, Krstić J, et al. (2012), Decrease of free fatty acid content in
vegetable oil using silica supported ferric sulfate catalyst. Fuel 97:595–602. doi:
10.1016/j.fuel.2012.03.039.
[2] (2017) Vegetable Oils and Animal Fats. In: EPA. www.epa.gov/emergency-response/.
Accessed 27 Mar 2018.
[3] (2016) El aceite de cocina tiene futuro. In: LaRepublica.pe. larepublica.pe/domingo/.
Accessed 27 Mar 2018.
[4] Historia y Cultura. In: Granja Porcon. www.granjaporcon.org.pe. Accessed 27 Mar
2018.
[5] Ejemot-Nwadiaro RI, Ehiri JE, Arikpo D, et al. (2015), Hand washing for preventing
diarrhoea. Cochrane Database of Systematic Reviews. doi: 10.1002/14651858.cd004265.
[6] Đokić M, Kesić Ž, Krstić J, et al. (2012), Decrease of free fatty acid content in
vegetable oil using silica supported ferric sulfate catalyst. Fuel 97:595–602. doi:
10.1016/j.fuel.2012.03.039.
[7] Hazeltine B (2001) Chapter 7 - Household Technologies. In: Bull C (ed) Field Guide
to Appropriate Technology, 1st edn. Elsevier Science & Technology, pp 684–687.
[8] Beck L (2017) 'Smoke point' matters when cooking with oil. In: The Globe and Mail.
www.theglobeandmail.com. Accessed 27 Mar 2018.
[9] Wang T (2011) Soybean Oil. In: Gunstone FD (ed). Vegetable Oils in Food
Technology: Composition, Properties and Uses, 2nd edn. Wiley-Blackwell, Ames, IO, pp
59–105.
28
[10] Blair G Titrating Oil. In: Utah Biodiesel Supply. www.utahbiodieselsupply.com.
Accessed 27 Mar 2018.
[11] Krzywinski M Image Color Summarizer. In: Image Color Summarizer - RGB and
HSV Image Statistics. http://mkweb.bcgsc.ca/color-summarizer/. Accessed 3 Apr 2018.
[12] Dunn KM (2010) Scientific Soapmaking: The Chemistry of the Cold Process.
Clavicula Press, Farmville, VA.
29
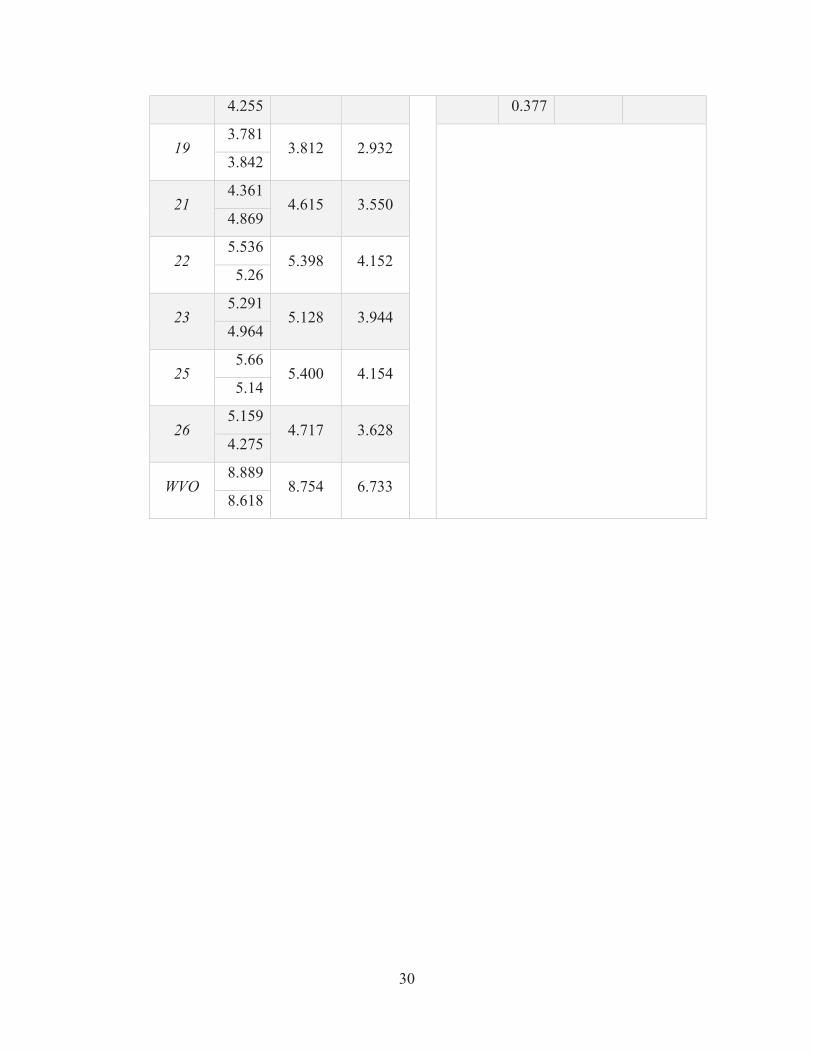
APPENDIX
Table 5: Summary of NaOH (g) to Titrate 1 mL of Each Oil Sample and Corresponding FFA% Industrial Samples
Household Samples
Sample NaOH
(g)
Average
NaOH
(g)
Average
FFA%
Sample NaOH
(g)
Average
NaOH
(g)
Average
FFA%
0 0.199
0.199 0.153
0 0.257
0.404 0.311 0.199 0.551
1 0.361
0.353 0.271 1 0.304
0.493 0.379 0.344 0.682
2 0.549
0.485 0.373 2 0.388
0.452 0.348 0.42 0.516
3 0.888
0.877 0.675 3 0.377
0.339 0.261 0.866 0.301
4 0.882
0.924 0.710 4 0.47
0.504 0.388 0.965 0.539
5 1.402
1.389 1.068 5 0.436
0.431 0.331 1.375 0.425
6
1.646
1.501 1.155 6
1.199 0.908 0.698
1.659 0.617
1.199 7
0.674 0.712 0.548
9 4.06
3.873 2.979 0.751
3.686 8
0.737 0.492 0.378
10 1.876
1.925 1.481 0.246
1.974 9
0.595 0.584 0.449
17 4.739
5.412 4.163 0.573
6.084
10
0.155
0.224 0.173 15
3.437 3.362 2.586
0.051
3.286 0.467
18 4.848 4.552 3.501 WVO 0.456 0.417 0.320
30
4.255 0.377
19 3.781
3.812 2.932
3.842
21 4.361
4.615 3.550 4.869
22 5.536
5.398 4.152 5.26
23 5.291
5.128 3.944 4.964
25 5.66
5.400 4.154 5.14
26 5.159
4.717 3.628 4.275
WVO 8.889
8.754 6.733 8.618

31
Table 6: Summary of Average HSV Values for Industrial and Household Use Oil Samples Industrial Samples
Household Samples
Sample H S V
Sample H S V
0 36 8 69
0 35 11 67
1 44 23 70
1 39 13 67
2 46 33 72
2 37 15 67
3 46 45 71
4 39 24 67
4 45 52 70
5 39 23 67
5 46 62 72
6 41 23 67
6 46 60 74
7 41 26 69
9 45 56 73
8 41 28 68
10 45 59 71
9 41 25 68
15 44 69 75
10 42 29 69
17 43 78 69
11 43 37 69
18 43 82 72
19 44 75 71
21 42 82 71
22 42 82 71
23 40 90 72
25 40 90 73
26 40 88 74
31 21 89 59

32
Table 7: Summary of Scent Test Perception Numbers for Industrial and Household Use Oil Samples
Industrial Samples Household Samples Sample 1 2 3 4 Average Sample 1 2 3 4 Average
0 5 5
5
0 5 5
5
1 3 4
3.5
1 3 2
2.5
2 2 2
2
2 3 3
3
3 5 4
4.5
3 4 4
4
4 2 2
2
4 3 5 3 4 3.75
5 2 3
2.5
5 4 4
4
6 3 3
3
6 3 4
3.5
9 5 4
4.5
7 2 2
2
10 2 3
2.5
8
15 4 2 4 3 3.25
9 4 3
3.5
17 2 2
2
10 3 2
2.5
18 2 4 2 2 2.5
11 2 2
2
19 3 4
3.5
21 2 3
2.5
22 2 2
2
23 3 1 3 3 2.5
25 3 2
2.5
26 1 2
1.5
31 1 1
1