want to manage the impact of volatility in your portfolio? report... · rex volmaxx long vix weekly...
TRANSCRIPT
powershares.com | @PowerShares
There are risks involved with investing in ETFs, including possible loss of money. Shares are not actively managed and are subject to risks similar to those of stocks, including those regarding short selling and margin maintenance requirements. Ordinary brokerage commissions apply. The Fund’s return may not match the return of the Underlying Index. The Fund is subject to certain other risks. Please see the current prospectus for more information regarding the risk associated with an investment in the Fund.In general, equity values fluctuate, sometimes widely, in response to activities specific to the company as well as general market, economic and political conditions.Volatility: is a statistical measurement of the magnitude of up and down asset price fluctuations over time.
Investments focused in a particular industry are subject to greater risk, and are more greatly impacted by market volatility, than more diversified investments.The Fund is non-diversified and may experience greater volatility than a more diversified investment.There is no assurance that the Fund will provide low volatility.Shares are not individually redeemable and owners of the shares may acquire those shares from the Funds and tender those shares for redemption to the Funds in Creation Unit aggregations only, typically consisting of 50,000 shares.Shares are not FDIC insured, may lose value and have no bank guarantee.
Invesco PowerShares Capital Management LLC and Invesco Distributors, Inc. are indirect, wholly owned subsidiaries of Invesco Ltd.
Before investing, investors should carefully read the prospectus/summary prospectus and carefully consider the investment objectives, risks, charges and expenses. For this and more complete information about the Fund call 800 983 0903 or visit invescopowershares.com for the prospectus/summary prospectus.
US4327 04/15
S&P 500® Low Volatility
We believe managing the impact of volatility is critical when pursuing long-term investment goals — that’s why PowerShares offers the industry’s largest suite of S&P Low Volatility ETFs, including SPLV, so you can choose the solution that’s right for your needs.
A core allocation to low volatility might help:
Buffer portfolios during down markets
Provide growth during up markets
Offer a smoother ride during volatile markets
Learn more powershares.com/LowVol
Want to Manage the Impact of Volatility in Your Portfolio?
A D V E R T I S E M E N T
ADVERTISEMENT
powershares.com | @PowerShares
There are risks involved with investing in ETFs, including possible loss of money. Shares are not actively managed and are subject to risks similar to those of stocks, including those regarding short selling and margin maintenance requirements. Ordinary brokerage commissions apply. The Fund’s return may not match the return of the Underlying Index. The Funds are subject to certain other risks. Please see the current prospectus for more information regarding the risk associated with an investment in the Funds.In general, equity values fluctuate, sometimes widely, in response to activities specific to the company as well as general market, economic and political conditions.The Funds are non-diversified and may experience greater volatility than a more diversified investment.
Investments focused in a particular industry are subject to greater risk, and are more greatly impacted by market volatility, than more diversified investments.Stocks of small and mid-sized companies tend to be more vulnerable to adverse developments, may be more volatile, and may be illiquid or restricted as to resale.There is no assurance that the Funds will provide low volatility.Shares are not individually redeemable and owners of the shares may acquire those shares from the Funds and tender those shares for redemption to the Funds in Creation Unit aggregations only, typically consisting of 50,000 shares.Shares are not FDIC insured, may lose value and have no bank guarantee.
Invesco PowerShares Capital Management LLC and Invesco Distributors, Inc. are indirect, wholly owned subsidiaries of Invesco Ltd.
Before investing, investors should carefully read the prospectus/summary prospectus and carefully consider the investment objectives, risks, charges and expenses. For this and more complete information about the Fund call 800 983 0903 or visit invescopowershares.com for the prospectus/summary prospectus.
US13845 12/15
Mid Cap Small Cap
International Developed
Large Cap
Emerging Markets
Europe Currency Hedged
ex-Rate Sensitive
We believe managing the impact of volatility is critical when pursuing long-term investment goals — that’s why PowerShares offers the industry’s largest suite of S&P Low Volatility ETFs, so you can choose the solution that’s right for your needs.
A core allocation to low volatility might help:
Buffer portfolios during down markets
Provide growth during up markets
Offer a smoother ride during volatile markets
Learn more powershares.com/LowVol
with PowerShares S&P Index Low Volatility ETFs
The Power of a Low Volatility Investing Approach
FXEU


ADVERTISEMENT
One Strong Core
www.spdji.com/indexology
The interlocking might of U.S. Mid and Small Caps strengthens a Large Cap core. Assemble your winning strategy with S&P DJI-based ETFs and mutual funds to push your core forward.
S&P 500®
S&P MidCap 400®
S&P SmallCap 600®
indexology®
powers purpose
© S&P Dow Jones Indices LLC, a division of S&P Global 2016. All rights reserved. S&P® and Indexology® and Indexology® ® are registered trademarks of Standard & Poor’s Financial Services LLC. ® are registered trademarks of Standard & Poor’s Financial Services LLC. ®
Dow Jones® is a registered trademark of Dow Jones Trademark Holdings LLC. It is not possible to invest directly in an index. S® is a registered trademark of Dow Jones Trademark Holdings LLC. It is not possible to invest directly in an index. S® &P Dow Jones Indices receives compensation for licensing its indices to third parties. S&P Dow Jones Indices LLC does not make investment recommendations and does not endorse, sponsor, promote or sell any investment product or fund.
© 2016 ETF.com. All rights reserved. The text, images and other materials contained or displayed are proprietary to ETF.com, except where otherwise noted, and constitute valuable intellectual property. No material from any part of any ETF.com publication, product, service, report, email or website may be downloaded, transmitted, broadcast, transferred, assigned, reproduced or in any other way used or otherwise disseminated in any form to any person or entity, without the explicit written consent of ETF.com. For permission to photocopy and use material electronically, please contact [email protected] or call 646-558-6985.
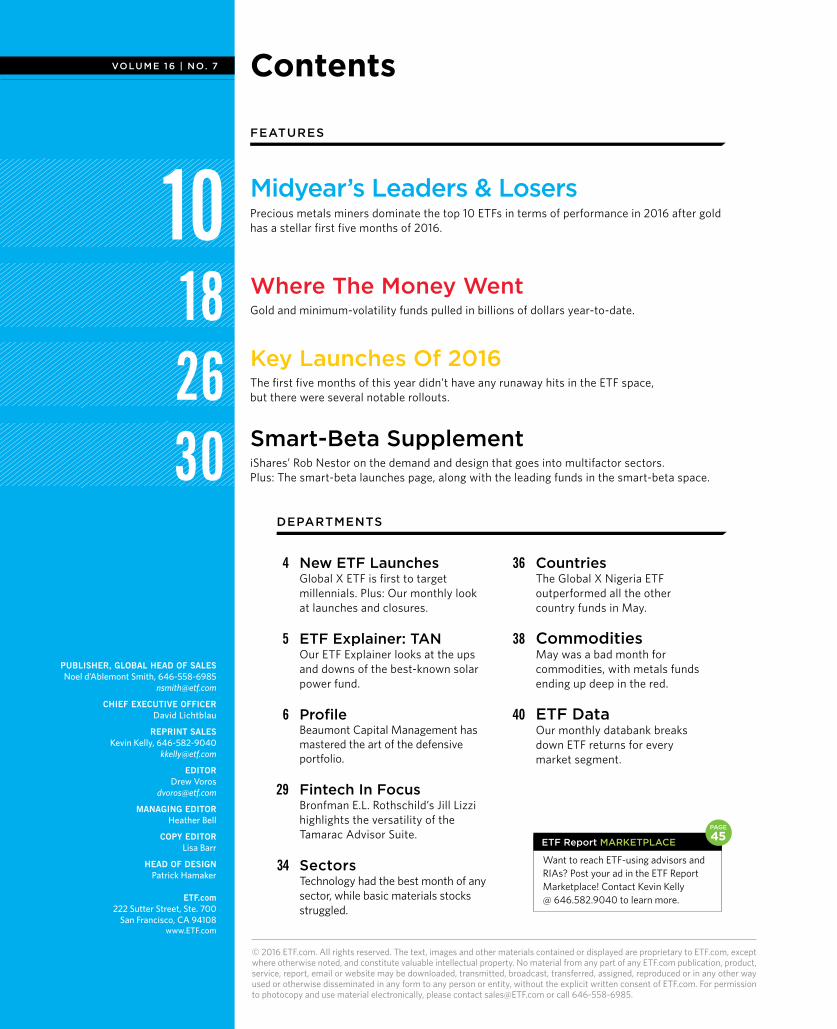
VOLUME 16 | NO. 7 Contents
PUBLISHER, GLOBAL HEAD OF SALESNoel d’Ablemont Smith, 646-558-6985
CHIEF EXECUTIVE OFFICER David Lichtblau
REPRINT SALESKevin Kelly, 646-582-9040
EDITOR Drew Voros
MANAGING EDITOR Heather Bell
COPY EDITOR Lisa Barr
HEAD OF DESIGN Patrick Hamaker
ETF.com222 Sutter Street, Ste. 700
San Francisco, CA 94108www.ETF.com
Want to reach ETF-using advisors and RIAs? Post your ad in the ETF Report Marketplace! Contact Kevin Kelly @ 646.582.9040 to learn more.
ETF Report MARKETPLACE
4 New ETF Launches Global X ETF is first to target millennials. Plus: Our monthly look at launches and closures.
5 ETF Explainer: TAN Our ETF Explainer looks at the ups and downs of the best-known solar power fund.
6 Profile Beaumont Capital Management has mastered the art of the defensive portfolio.
29 Fintech In Focus Bronfman E.L. Rothschild’s Jill Lizzi highlights the versatility of the Tamarac Advisor Suite.
34 Sectors Technology had the best month of any sector, while basic materials stocks struggled.
DEPARTMENTS
Midyear’s Leaders & LosersPrecious metals miners dominate the top 10 ETFs in terms of performance in 2016 after gold has a stellar first five months of 2016.
Where The Money Went Gold and minimum-volatility funds pulled in billions of dollars year-to-date.
Key Launches Of 2016The first five months of this year didn’t have any runaway hits in the ETF space, but there were several notable rollouts.
Smart-Beta SupplementiShares’ Rob Nestor on the demand and design that goes into multifactor sectors. Plus: The smart-beta launches page, along with the leading funds in the smart-beta space.
10182630
FEATURES
36 Countries The Global X Nigeria ETF outperformed all the other country funds in May.
38 Commodities May was a bad month for commodities, with metals funds ending up deep in the red.
40 ETF Data Our monthly databank breaks down ETF returns for every market segment.
45PAGE
4 ETF.com/ETF Report
Global X Millennials Thematic ETFFirst-of-its-kind ETF targets 1980-2000 demographic cohort
an average daily turnover for the preced-ing six months of at least $2 million.
INDXX has identified eight millennial spending categories, but the prospectus notes that they could change over time. They include social and entertainment; clothing and apparel; travel and mobil-ity; food, restaurants and consumer sta-ples; financial services and investments; housing and home goods; education and employment; and health and fitness.
Using a wide range of publicly avail-able information sources, the methodology focuses on companies with significant expo-sure to millennial spending habits, select-ing five to 15 companies for each spending category based on a composite score.
Source: ETF.com. Data and information as of 5/31/2016. ETF Filings sidebar covers launches and filings for the month of May.
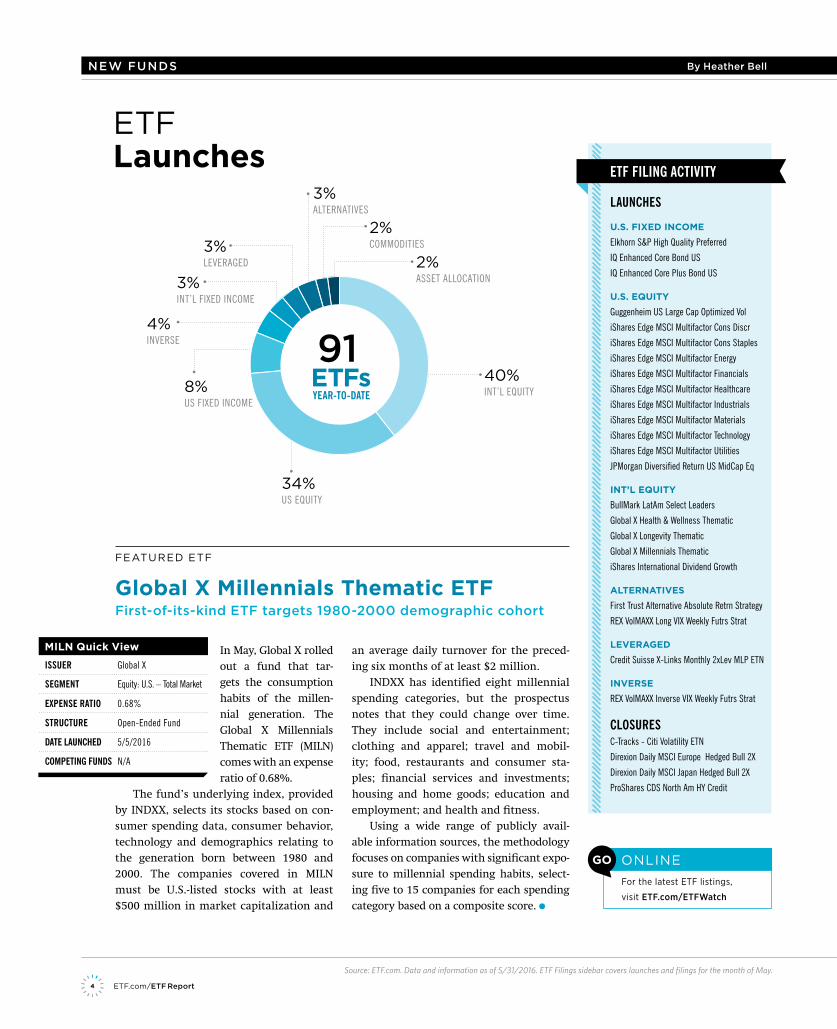
ETFLaunches
FEATURED ETF
NEW FUNDS By Heather Bell
In May, Global X rolled out a fund that tar-gets the consumption habits of the millen-nial generation. The Global X Millennials Thematic ETF (MILN) comes with an expense ratio of 0.68%.
The fund’s underlying index, provided by INDXX, selects its stocks based on con-sumer spending data, consumer behavior, technology and demographics relating to the generation born between 1980 and 2000. The companies covered in MILN must be U.S.-listed stocks with at least $500 million in market capitalization and
ETF FILING ACTIVITY
LAUNCHES
U.S. FIXED INCOME
Elkhorn S&P High Quality Preferred
IQ Enhanced Core Bond US
IQ Enhanced Core Plus Bond US
U.S. EQUITY
Guggenheim US Large Cap Optimized Vol
iShares Edge MSCI Multifactor Cons Discr
iShares Edge MSCI Multifactor Cons Staples
iShares Edge MSCI Multifactor Energy
iShares Edge MSCI Multifactor Financials
iShares Edge MSCI Multifactor Healthcare
iShares Edge MSCI Multifactor Industrials
iShares Edge MSCI Multifactor Materials
iShares Edge MSCI Multifactor Technology
iShares Edge MSCI Multifactor Utilities
JPMorgan Diversified Return US MidCap Eq
INT’L EQUITY
BullMark LatAm Select Leaders
Global X Health & Wellness Thematic
Global X Longevity Thematic
Global X Millennials Thematic
iShares International Dividend Growth
ALTERNATIVES
First Trust Alternative Absolute Retrn Strategy
REX VolMAXX Long VIX Weekly Futrs Strat
LEVERAGED
Credit Suisse X-Links Monthly 2xLev MLP ETN
INVERSE
REX VolMAXX Inverse VIX Weekly Futrs Strat
CLOSURESC-Tracks - Citi Volatility ETN
Direxion Daily MSCI Europe Hedged Bull 2X
Direxion Daily MSCI Japan Hedged Bull 2X
ProShares CDS North Am HY Credit
MILN Quick View
ISSUER Global X
SEGMENT Equity: U.S. – Total Market
EXPENSE RATIO 0.68%
STRUCTURE Open-Ended Fund
DATE LAUNCHED 5/5/2016
COMPETING FUNDS N/A
GO
For the latest ETF listings,
visit ETF.com/ETFWatch
ONLINE
34%US EQUITY
8% US FIXED INCOME
40% INT’L EQUITY
4% INVERSE
3% LEVERAGED 2%
ASSET ALLOCATION
2% COMMODITIES
3% ALTERNATIVES
3% INT’L FIXED INCOME
ETFs91
YEAR-TO-DATE
5JULY 2016
Guggenheim Solar
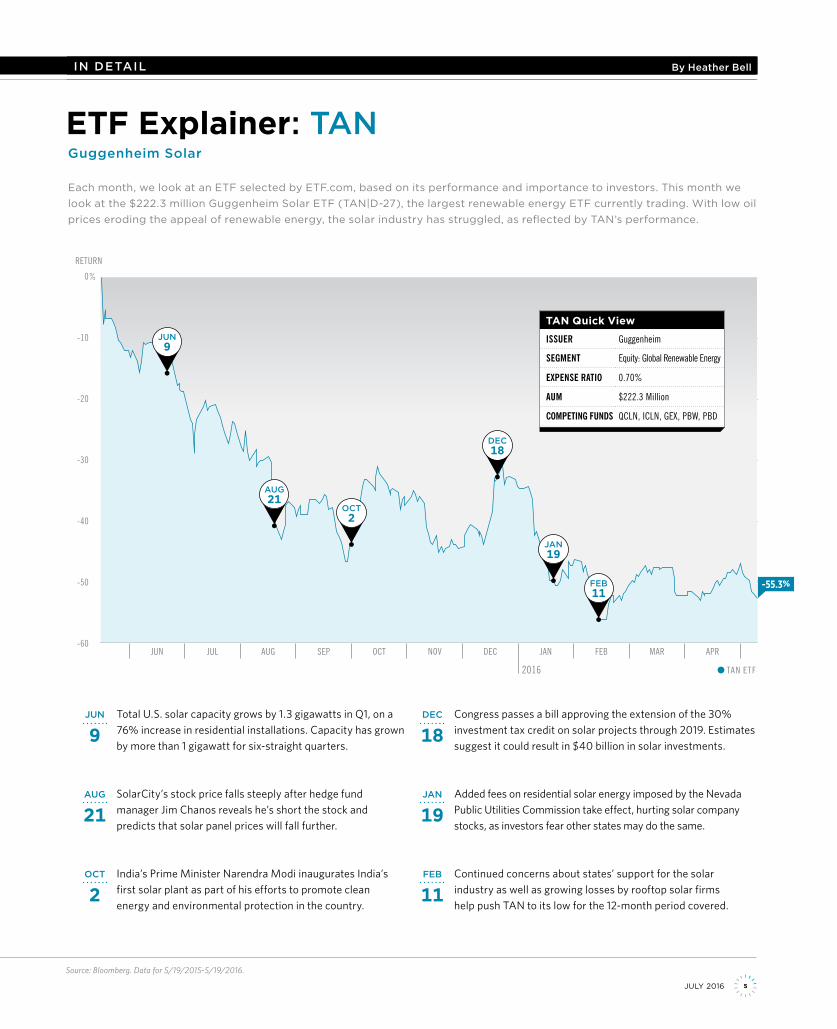
Each month, we look at an ETF selected by ETF.com, based on its performance and importance to investors. This month we look at the $222.3 million Guggenheim Solar ETF (TAN|D-27), the largest renewable energy ETF currently trading. With low oil prices eroding the appeal of renewable energy, the solar industry has struggled, as reflected by TAN’s performance.
Source: Bloomberg. Data for 5/19/2015-5/19/2016.
ETF Explainer: TAN
JUN Total U.S. solar capacity grows by 1.3 gigawatts in Q1, on a 76% increase in residential installations. Capacity has grown by more than 1 gigawatt for six-straight quarters.
9DEC Congress passes a bill approving the extension of the 30%
investment tax credit on solar projects through 2019. Estimates suggest it could result in $40 billion in solar investments.
18
AUG SolarCity’s stock price falls steeply after hedge fund manager Jim Chanos reveals he’s short the stock and predicts that solar panel prices will fall further.
21JAN Added fees on residential solar energy imposed by the Nevada
Public Utilities Commission take effect, hurting solar company stocks, as investors fear other states may do the same.
19
OCT India’s Prime Minister Narendra Modi inaugurates India’s first solar plant as part of his efforts to promote clean energy and environmental protection in the country.
2FEB Continued concerns about states’ support for the solar
industry as well as growing losses by rooftop solar firms help push TAN to its low for the 12-month period covered.
11
IN DETAIL By Heather Bell
JUN JUL AUG SEP OCT NOV DEC JAN FEB MAR APR
2016
0
-10
-20
-30
-40
-50
-60
%
RETURN
TAN ETF
-55.3%
TAN Quick View
ISSUER Guggenheim
SEGMENT Equity: Global Renewable Energy
EXPENSE RATIO 0.70%
AUM $222.3 Million
COMPETING FUNDS QCLN, ICLN, GEX, PBW, PBD
JUN9
AUG21
OCT2
DEC18
JAN19
FEB11
6 ETF.com/ETF Report
Smoothing ThePath For Investors
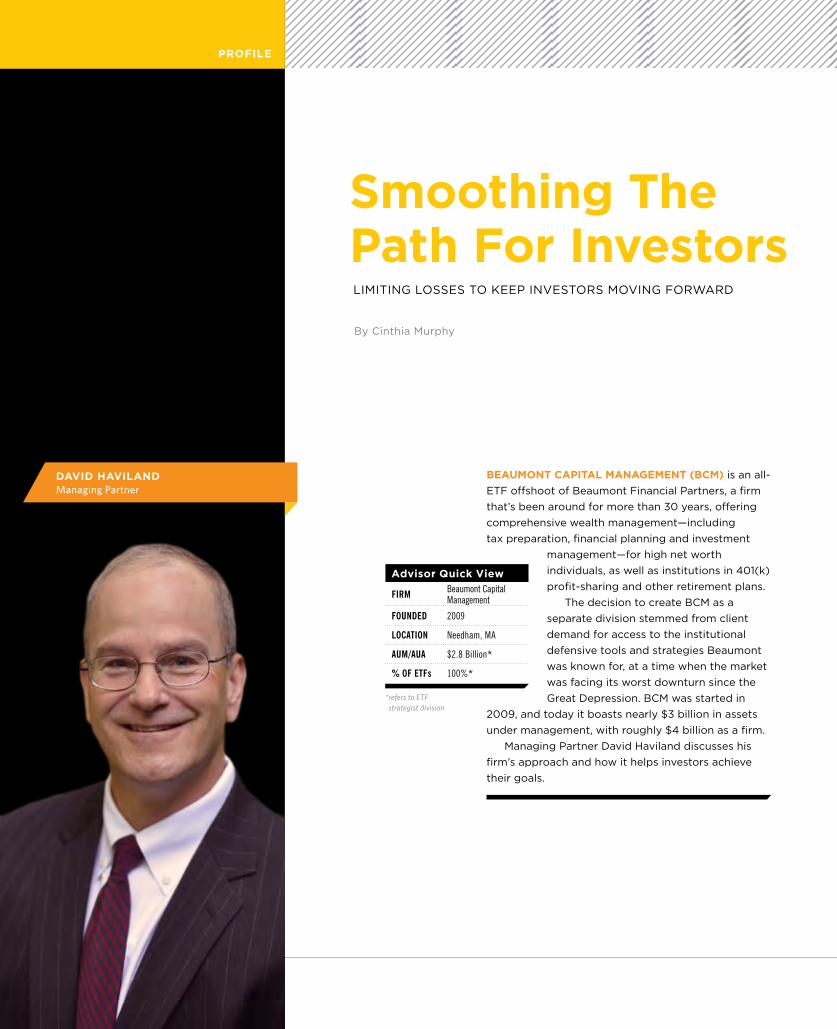
BEAUMONT CAPITAL MANAGEMENT (BCM) is an all-ETF offshoot of Beaumont Financial Partners, a firm that’s been around for more than 30 years, offering comprehensive wealth management—including tax preparation, financial planning and investment
management—for high net worth individuals, as well as institutions in 401(k) profit-sharing and other retirement plans.
The decision to create BCM as a separate division stemmed from client demand for access to the institutional defensive tools and strategies Beaumont was known for, at a time when the market was facing its worst downturn since the Great Depression. BCM was started in
2009, and today it boasts nearly $3 billion in assets under management, with roughly $4 billion as a firm.
Managing Partner David Haviland discusses his firm’s approach and how it helps investors achieve their goals.
By Cinthia Murphy
LIMITING LOSSES TO KEEP INVESTORS MOVING FORWARD
FIRM Beaumont Capital Management
FOUNDED 2009
LOCATION Needham, MA
AUM/AUA $2.8 Billion*
% OF ETFs 100%*
Advisor Quick View
6 ETF.com/ETF Report
DAVID HAVILAND Managing Partner
* refers to ETF strategist division
PROFILE

7JULY 2016
Why is defense the best offense when it comes to investing?
I learned a long time ago, from my father, that what clients care the most about is not losing a lot of money. And it is borne out in the philosophy of our firm: The No. 1 rule of successful long-term investing is to avoid large losses that become present in bear markets.
We’ve been around since 1981, and we’ve lived through the 2001-02 and the 2008-09 downturns. Our clients asked us if we could institutionalize our defen-sive philosophy in managing money, and so in 2009, we started Beaumont Capital Management, where we used long-only ETFs and some rules-based systems to provide this defensive capability during downturns.
Is 2009, then, the first time you used ETFs in your practice?
No, we’d used them before. We find ETFs to be a very easy and beneficial vehicle to form investment strategies with. You need to learn how to trade them, but once you do, the trading and liquidity is tremendous. You avoid individual company risk, and you can get both passive and active management within ETFs. It’s low cost. ETFs are a great tool, particularly for BCM, where we’re 100% dedicated to providing tactical and dynamic investment strategies.
In a vast world of investment managers, what sets BCM apart?
Having an investment advisory background really gives us some unique perspectives on managing money. To be clear, at BCM, we don’t compete against our investment advisor client base. But what sets us apart is Beaumont’s long history of being an advisor, and sitting down with clients. We’ve got a very good understanding of what cli-ents want and/or need. And when we bring this perspec-tive to asset management, it allows us to bring many advantages.
Let me give you an example. In the 401(k) space, when we’re working with a client, we’ve literally been in each and every role within the 401(k) space. We’ve been an advisor to a plan. We’ve been an advisor to a participant. We’ve been an advisor to a sponsor. We’re a sponsor. And now we’re a fund manager in the 401(k) space. That gives us unique perspective when it comes to managing money.
Let’s talk about one of your flagship approaches, which is centered on sector rotation. Why do you
think that’s a good way to go?Sector rotation, and momentum-based investing, have been around for at least 50 years.
We’re seeking to take advantage of how sectors per-form in different stages of the business cycle, and the stock market cycle. There are times when various sec-tors are going to outperform, and times they’re going to underperform.
When you’re in a roaring bull market, almost all the sectors are on. But in a market like we’re in right now, we’re only invested in some sectors in U.S. large-cap. We’re able to avoid the volatility that’s been present in the energy and materials sectors. That goes to our process, where we’re taking advantage of momentum in each sec-tor. There are more inputs involved, but if the momentum and price movement of a sector is positive, it’s likely we’ll own it. And we equal-weight them in the portfolio.
How are your clients using these sector strategies in their portfolios?
Many of our advisor clients use the U.S. sector rotation as a core holding, and as a substitute to the S&P 500, tak-ing advantage of the fact that their clients are looking for an automatic sale process before you get too deep into a rout such as 2008 or 2009. Remember that it’s all about being defensive, so in these strategies, we’re getting out of the way before sectors see large losses. In fact, recently, we were as much as 75% cash during a market downturn, but we got invested fairly quickly as the momentum was re-established.
You also have a separate series called Decathlon. How is that one different?
The momentum-based sector rotation series is tactically constrained, meaning it’s constrained to the indices where each of those sectors resides, and uses cash as the defensive mechanism. The Decathlon series is tactically unconstrained. It uses pattern recognition technology to seek investment opportunities that are positive, regard-less of where they are. And by “unconstrained,” I mean they’re unconstrained across geography, asset class and market capitalization—we have currency funds, com-modity funds, real estate funds; there’s a plethora of choices in equity and bonds.
8 ETF.com/ETF Report
BCM has attracted some $3 billion since 2009, becoming one of the biggest strategists in the
space. To what do you attribute your success? Philosophy? A really strong distribution network and marketing? At its core, our philosophy of not losing large amounts of money resonates well with other financial profes-sionals, because we design our products to meet their clients’ needs. This is backed up by behavioral finance. Investors feel losses far more powerfully than gains. It’s this response to negative returns that drives most inves-tors to do the worst possible things at the worst possible times, which is to sell during the capitulation stage of bear markets. And then, they compound their error by waiting three, five, seven years until the markets have “proven” that it’s safe to get back in, and they invest at or near the top of that next cycle.
What all of our systems do—our momentum-based, sector rotation series, as well as our Decathlon series—is seek to avoid the vast majority of those losses and smooth the ride for investors, so that everyone can con-centrate on doing the right thing, which is get out of the way of the large losses, but stay invested during “nor-mal” market action.
BCM is a tactical shop. How should investors use tactical managers?
A properly constructed portfolio should involve strate-gic as well as tactical components. To be very simplistic, if you were building a portfolio, and you were to put one-third into strategic equity, one-third into strategic fixed income and one-third into tactical, we’d take each of those buckets and then divide again in half.
In the strategic, you would have half in index-based passive investments, and half in the best strategic man-ager you can find; for example, S&P 500 and Will Danoff of Contrafund, because Will is one of eight managers that has beaten the S&P on a one-, three-, five-, 10-, 20- and 25-year basis.
On the fixed-income side, we would suggest using something like the iShares Core U.S. Aggregate Bond ETF (AGG|A-98), and then maybe the SPDR DoubleLine Total Return Tactical ETF (TOTL|C), which is Jeffrey Gundlach’s fund, which is actively managed and has the ability to generate alpha in a rising-interest-rate environment.
Then you have your tactical allocation, which we recommend be divided into two managers. The idea is to build a robust portfolio that focuses on both active and
passive, and it’s diversified. If either the bond or stock part of the portfolio goes into a period of market failure, the tactical manager can rotate out of the way or raise cash. It’s all about smoothing out the ride for the inves-tor, and keeping them invested over a full market cycle.
How do you choose ETFs? Are you provider-agnostic?
We are provider-agnostic, with a notable exception to the obvious: In our sector rotation, we offer the State Street SPDRs as our flagship. That’s who we started with originally. For customers who clear through Fidelity, we use the Fidelity ETFs, because currently, they’re trading commission-waived, at the lowest embedded expense ratio. So if you’re supersensitive to expense, then the Advantage series is the preferred family. And we’re also using some First Trust ETFs, which have their own quan-titative process.
In our Decathlon series, the process uses price his-tory as part of the system, and tries to avoid overcon-centration. So the pool is primarily made up of iShares ETFs. It has a broad selection of ETFs with long track records and diverse attributes.
As the strategist space grows, do you feel pressured to innovate?
We’ve got a very well-defined, three-year rolling strate-gic plan as a business. And we’re continuing to expand within the 401(k) and retirement markets. That is our current strategic initiative. We also just became a model manager on a mutual fund, and are in negotiations on a second fund.
In the near future, we will be getting into more of the institutional market. But the opportunity within the 401(k) space and these other markets is something we’re looking to grow in. I don’t feel any pressure, though. I think our strategies and the benefits they provide speak for themselves.
As an ETF strategist, what’s the opportunity you see in the 401(k) space?
I believe it’s massive. And the reason it’s so large is because of the shortcomings of the first generation of target-date funds out there. We offer target-date funds that are among the lowest-cost target-date fund fami-lies in the industry. Our total expense ratio, all in, is less than half of the average of actively managed tar-get-date funds used in 401(k)s today.
PROFILE
8 ETF.com/ETF Report
ADVERTISEMENT
S:8”
You wear many hats fulfi lling your responsibility to your clients. But the biggest challenge you face is managing their investment expectations. We share the belief that long-term, low-cost investing is the right approach. That’s why Vanguard offers you research, low-cost ETFs, and over 40 years of indexing experience to help make managing your clients’ expectations exactly that. More manageable.
For the support you deserve, visit our Financial Advisors siteat advisors.vanguard.com/BD today.
800 414-4684
Are you Vanguarding® your clients’ portfolios?
All investing is subject to risk, including the possible loss of the money you invest.
Vanguard ETF Shares can be bought and sold only through a broker (who may charge a commission) and cannot be redeemed with the issuing Fund. The market price of Vanguard ETF Shares may be more or less than net asset value.
For more information about Vanguard ETF Shares, visit advisors.vanguard.com/BD, call 800 414-4684, or contact your broker to obtain a prospectus. Investment objectives, risks, charges, expenses, and other important information are contained in the prospectus; read and consider it carefully before investing.
© 2016 The Vanguard Group, Inc. All rights reserved. Vanguard Marketing Corporation, Distributor. U.S. Patent Nos. 6,879,964; 7,337,138; 7,720,749; 7,925,573; 8,090,646; and 8,417,623.
Follow us @Vanguard_FA for important insights, news and education.
You don’t just manage portfolios. You manage expectations. That’s a huge responsibility.
PERFORMING ETFs OF 2016
MIDYEAR REPORT
&
top 10 nonleveraged/noninverse exchange-traded funds of the year all belong to a single group: gold and silver miners.
Miner ETFs, which had been beaten down for years amid falling gold prices and other industry-related woes, finally had things working in their favor when gold unexpectedly surged at the start of 2016.
Though concerns about misman-agement and high costs remain, for now, investors are looking past all that and seeing the industry as a leveraged bet on higher gold prices. With gold trending up, that’s a bet that’s paying off.
RETURNS OF 64% OR MOREThe threshold to be among
the top-performing ETFs is high. Each of the top 10 has gains rang-ing from 64% to 131%, with the PureFunds ISE Junior Silver ETF (SILJ|F-64) at the top of the pack.
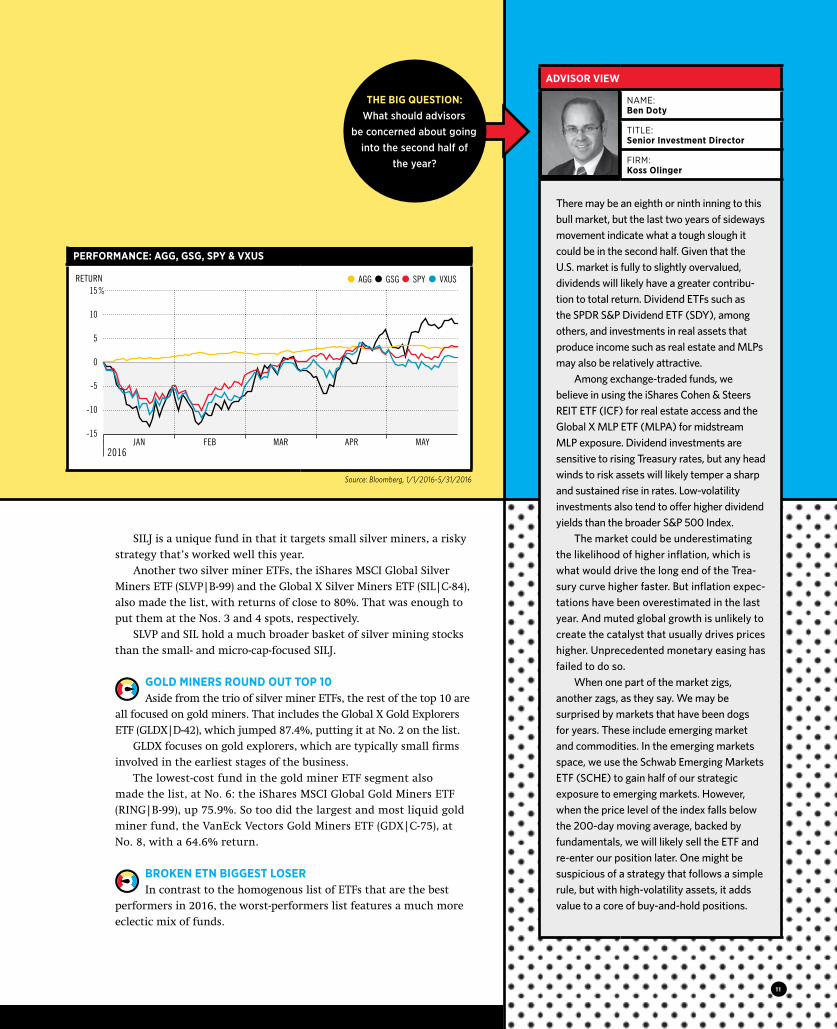
IT’S BEEN A GOOD YEAR FOR FINANCIAL MAR-KETS SO FAR IN 2016. After a bumpy start to the year, most major asset classes were up through the end of May, including stocks, bonds and commodities.
Even international stocks are hanging in there, with a slight gain for the year. As of this writing, the Vanguard Total International Stock ETF (VXUS|A-97) was up by 1.1% year-to-date.
U.S. stocks are doing a bit better—the SPDR S&P 500 ETF (SPY|A-97) is up 3.5%. That’s essentially the same return that bonds have given investors this year; the iShares Core U.S. Aggregate Bond ETF (AGG|A-98) has gained 3.3% on the year.
Meanwhile, leading all asset classes are commodities. The iShares S&P GSCI Commodity Indexed Trust (GSG|C-91) rallied 8.4% through the first five months of the year.
MINERS DOMINATE TOP PERFORMERS LISTThe strong gains in commodities are thanks to
a surprising rebound in the price of oil and gold. The United States Brent Oil Fund (BNO), for example, is up a cool 22.9% year-to-date, while the SPDR Gold Trust (GLD|A-100) is up about 14.4%.
But as impressive as the gains in those ETFs are, they aren’t even close to the top of the heap. The
BESTWORST
By Sumit Roy
10
SILJ is a unique fund in that it targets small silver miners, a risky strategy that’s worked well this year.
Another two silver miner ETFs, the iShares MSCI Global Silver Miners ETF (SLVP|B-99) and the Global X Silver Miners ETF (SIL|C-84), also made the list, with returns of close to 80%. That was enough to put them at the Nos. 3 and 4 spots, respectively.
SLVP and SIL hold a much broader basket of silver mining stocks than the small- and micro-cap-focused SILJ.
GOLD MINERS ROUND OUT TOP 10Aside from the trio of silver miner ETFs, the rest of the top 10 are
all focused on gold miners. That includes the Global X Gold Explorers ETF (GLDX|D-42), which jumped 87.4%, putting it at No. 2 on the list.
GLDX focuses on gold explorers, which are typically small firms involved in the earliest stages of the business.
The lowest-cost fund in the gold miner ETF segment also made the list, at No. 6: the iShares MSCI Global Gold Miners ETF (RING|B-99), up 75.9%. So too did the largest and most liquid gold miner fund, the VanEck Vectors Gold Miners ETF (GDX|C-75), at No. 8, with a 64.6% return.
BROKEN ETN BIGGEST LOSERIn contrast to the homogenous list of ETFs that are the best
performers in 2016, the worst-performers list features a much more eclectic mix of funds.
ADVISOR VIEW
NAME: Ben Doty
TITLE: Senior Investment Director
FIRM: Koss Olinger
There may be an eighth or ninth inning to this bull market, but the last two years of sideways movement indicate what a tough slough it could be in the second half. Given that the U.S. market is fully to slightly overvalued, dividends will likely have a greater contribu-tion to total return. Dividend ETFs such as the SPDR S&P Dividend ETF (SDY), among others, and investments in real assets that produce income such as real estate and MLPs may also be relatively attractive.
Among exchange-traded funds, we believe in using the iShares Cohen & Steers REIT ETF (ICF) for real estate access and the Global X MLP ETF (MLPA) for midstream MLP exposure. Dividend investments are sensitive to rising Treasury rates, but any head winds to risk assets will likely temper a sharp and sustained rise in rates. Low-volatility investments also tend to offer higher dividend yields than the broader S&P 500 Index.
The market could be underestimating the likelihood of higher inflation, which is what would drive the long end of the Trea-sury curve higher faster. But inflation expec-tations have been overestimated in the last year. And muted global growth is unlikely to create the catalyst that usually drives prices higher. Unprecedented monetary easing has failed to do so.
When one part of the market zigs, another zags, as they say. We may be surprised by markets that have been dogs for years. These include emerging market and commodities. In the emerging markets space, we use the Schwab Emerging Markets ETF (SCHE) to gain half of our strategic exposure to emerging markets. However, when the price level of the index falls below the 200-day moving average, backed by fundamentals, we will likely sell the ETF and re-enter our position later. One might be suspicious of a strategy that follows a simple rule, but with high-volatility assets, it adds value to a core of buy-and-hold positions.
THE BIG QUESTION: What should advisors
be concerned about going into the second half of
the year?
PERFORMANCE: AGG, GSG, SPY & VXUS
JAN FEB MAR APR MAY2016
Source: Bloomberg, 1/1/2016-5/31/2016
15
10
5
0
-5
-10
-15
% RETURN AGG GSG SPY VXUS
11

February, the VIX traded north of 30, and VIX products were up nearly 50% on the year. Today the VIX is at less than half those levels, at 14.
SOLAR, BIOTECH & JAPAN FARE POORLYRounding out the bottom 10 are two solar ETFs, a bio-
tech ETF and a Japan ETF. The Guggenheim Solar ETF (TAN|D-27) and the VanEck
Vectors Solar Energy ETF (KWT|F-27) shed 28.2% and 25.1%, respectively, so far this year.
Analysts point to the stunning collapse of SunEdison as hurting sentiment in the solar industry. The company had a market cap of as much as $10 billion last year before its rapid descent began; last month, SunEdison filed for bankruptcy.
Cheap prices for fossil fuels used in electricity generation such as natural gas and coal—which are seen as competition for solar—may also be weighing on solar ETFs.
Meanwhile, biotech ETFs such as the BioShares Biotechnol-ogy Clinical Trials Fund (BBC), which is down 27.9% this year, have been battered amid concerns that a new U.S. president may be bad for the industry. Presidential candidates Hillary Clinton and Donald Trump have both complained about the high cost of drugs, and may make moves to increase regula-tions on biotech firms if they are elected.
Finally, Japan has been one of the worst-performing stock markets of the year, which helps explain the lousy perfor-mance of the WisdomTree Japan Hedged Financials Fund (DXJF|D-64), down 23.1% on the year.
Frustration that years of “Abenomics” and unprecedented monetary stimulus haven’t given the country’s economy the boost that was expected is partially why investors have been selling Japanese stocks.
Negative interest rates in particular are seen as hurting Japanese financial firms, while the strength in the yen (which hurts Japanese exporters) is another reason for the underper-formance in Japanese equities more broadly.
The worst among them is the iPath Bloomberg Natural Gas Subindex Total Return ETN (GAZ|F-65), with a loss of 45.8% year-to-date.
GAZ is a prime example of a broken product. Back in 2009, the issuer—Barclays—suspended issuances of the exchange-traded note, throwing a wrench into the process that normally keeps ETNs close to their net asset value.
In turn, GAZ would go on to often trade at sizable premiums to its NAV, with no rhyme or reason to its fluctuations. The ETN still holds some correlation to natural gas prices—which are down this year—but it’s a product most investors should stay away from.
For comparison, the United States Natural Gas Fund (UNG|B-94)—which also tracks natural gas but continues to function normally—is down only 20.5% this year.
TOP 10 ETFs THROUGH MAY 31, 2016
TICKER FUND RETURN (%)
SILJ PureFunds ISE Junior Silver (Small Cap Miners/Explorers) ETF 130.97GLDX Global X Gold Explorers ETF 87.40SLVP iShares MSCI Global Silver Miners ETF 82.74SIL Global X Silver Miners ETF 79.25
GDXJ VanEck Vectors Junior Gold Miners ETF 75.95RING iShares MSCI Global Gold Miners ETF 75.91SGDJ Sprott Junior Gold Miners ETF 71.24GDX VanEck Vectors Gold Miners ETF 64.58
PSAU PowerShares Global Gold & Precious Metals Portfolio 64.26SGDM Sprott Gold Miners ETF 64.02
BOTTOM 10 ETFs THROUGH MAY 31, 2016
TICKER FUND RETURN (%)
GAZ iPath Bloomberg Natural Gas Subindex Total Return ETN -45.82VXUP AccuShares Spot CBOE VIX Up Shares -34.08GRN iPath Global Carbon ETN -33.30VIXY ProShares VIX Short-Term Futures ETF -32.63VXX iPath S&P 500 VIX Short-Term Futures ETN -32.49VIIX VelocityShares Daily Long VIX Short-Term ETN -32.31TAN Guggenheim Solar ETF -28.17BBC BioShares Biotechnology Clinical Trials Fund -27.92KWT VanEck Vectors Solar Energy ETF -25.07DXJF WisdomTree Japan Hedged Financials Fund -23.07
ROLLER-COASTER RIDE FOR VIX ETFs
At No. 3 on the worst-performers list is the iPath Global Carbon ETN (GRN|F)—a tiny ETN that tracks the carbon market—with a 33.3% loss.
Also on the list are four volatility products—including the largest and most liquid, the iPath S&P 500 VIX Short-Term Futures ETN (VXX|B-47)—with losses of up to 34% for 2016 so far.
Volatility spiked dramatically earlier this year as the stock market plunged, but it’s since come back down. At one point in
Source: ETF.com as of 5/31/2016
Source: ETF.com as of 5/31/2016
12
ADVERTISEMENT
SMALL CAPS WITH
GRITJANUS SMART GROWTH™ ETFs
Exposure to small and mid-cap growth has been a valuable source of investor return, but not without the risks that can surround some young, growing companies. Drawing on a legacy of equity investing experience, our systematic strategy identifi es resilient companies poised for long-run, sustainable growth while avoiding those companies on a riskier path.
We call our approach Smart Growth.™
Learn more at Janus.com/SmartGrowthETFs.
Please consider the charges, risks, expenses, and investment objectives carefully before investing. For a prospectus containing this and other information, please call 877.33JANUS (52687) or download the fi le from janus.com/ETFs. Read it carefully before you invest or send money. Past performance is no guarantee of future results.
OBJECTIVES: JSMD and JSML seek investment results that correspond generally, before fees and expenses, to the performance of their underlying indices, the Janus Small/Mid Cap Growth Alpha and Janus Small Cap Growth Alpha Indices, respectively. They pursue their investment objectives by using a passive index-based approach, normally investing at least 80% of its net assets in securities that comprise their underlying indices.
There are risks involved with investing, including possible loss of principal. Performance depends upon the underlying index in which it invests. Smaller capitalization companies may be less stable and more susceptible to adverse developments, and their securities may be more volatile and less liquid than larger capitalization companies.
Performance for very short time periods may not be indicative of future performance. JSMD and JSML are new ETFs and have less than one year of operating history.
ETF shares are not individually redeemable and owners of the shares may acquire those shares from the Fund and tender those shares for redemption to the Fund in Creation Units only, typically consisting of aggregations of 50,000 shares.
Ordinary brokerage commissions apply and will reduce returns.
Janus Capital Management LLC is the investment adviser and ALPS Distributors, Inc. is the distributor. ALPS is not affi liated with Janus or Janus Index & Calculation Services LLC.
Janus is a registered trademark of Janus International Holding LLC. ©Janus International Holding LLC. Janus Distributors LLC.
C-0216-106972 05-30-17
JNS112
32346 Janus GRIT Print Ad_ETFReport_APR16.indd 1 3/1/16 9:45 AM
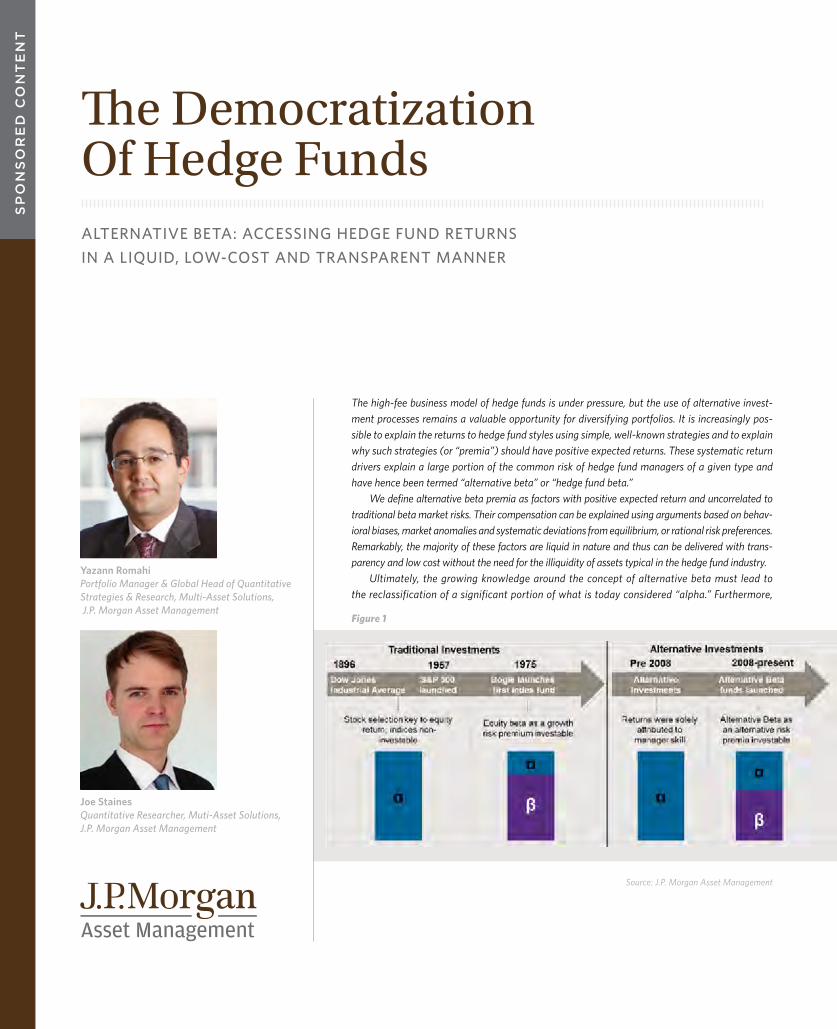
The high-fee business model of hedge funds is under pressure, but the use of alternative invest-ment processes remains a valuable opportunity for diversifying portfolios. It is increasingly pos-sible to explain the returns to hedge fund styles using simple, well-known strategies and to explain why such strategies (or “premia”) should have positive expected returns. These systematic return drivers explain a large portion of the common risk of hedge fund managers of a given type and have hence been termed “alternative beta” or “hedge fund beta.”
We define alternative beta premia as factors with positive expected return and uncorrelated to traditional beta market risks. Their compensation can be explained using arguments based on behav-ioral biases, market anomalies and systematic deviations from equilibrium, or rational risk preferences. Remarkably, the majority of these factors are liquid in nature and thus can be delivered with trans-parency and low cost without the need for the illiquidity of assets typical in the hedge fund industry.
Ultimately, the growing knowledge around the concept of alternative beta must lead to the reclassification of a significant portion of what is today considered “alpha.” Furthermore,
The Democratization Of Hedge Funds ALTERNATIVE BETA: ACCESSING HEDGE FUND RETURNS
IN A LIQUID, LOW-COST AND TRANSPARENT MANNER
Yazann RomahiPortfolio Manager & Global Head of Quantitative Strategies & Research, Multi-Asset Solutions, J.P. Morgan Asset Management
Joe StainesQuantitative Researcher, Muti-Asset Solutions, J.P. Morgan Asset Management
Source: J.P. Morgan Asset Management
Figure 1
SP
ON
SO
RE
D C
ON
TE
NT
investors’ increased understanding of the factor risk exposures associated with different hedge fund styles will help in the pur-suit of better diversified portfolios with greater transparency.
Redefining Alpha & BetaConventionally, alpha is understood to be the excess return due to active management, while beta is thought to be the return due to the market. However, portfolio theory allows for any number of risk factors. Beta is in fact best defined as the portion of returns that can be attributed to one or more sys-tematic exposures to an economic premium. Alpha is then the portion of returns that cannot be explained by these system-atic exposures.
Since the 1970s, common risk factors have been acknowl-edged in traditional investments such as stocks and bonds. Prior to this, what seemed obvious to market participants was that one needed to know which stocks to buy. The idea that there was a risk premium attached to simply being exposed to the markets was alien to market participants. Yet today we take that concept entirely for granted. Increasingly, the same is happening to hedge funds. This evolution in the under-standing of alternative investment returns has the potential to change the industry on two fronts: firstly, by providing a benchmark for hedge fund managers; and secondly, by allow-ing direct investment in the alternative premia. This strategy of investment in premia provides a low-cost, transparent and liquid way to diversify portfolios.
Explaining & Reproducing Hedge Fund ReturnsBecause the average hedge fund contains market risk, first-gen-eration “hedge fund replication” strategies focused on replicating hedge fund index returns using a mix of traditional asset classes. Now that we know that hedge funds are exposed to long/short risk premia, it is clear why this early approach was doomed to fall short. It does, however, highlight how hedge fund return streams can be more accurately replicated by constructing hedge fund strategies from the bottom up. In other words, by investing in the same individual securities that the hedge fund manager would invest in, one is able to much better capture the true premium.
These systematic exposures have come to be known as “alternative beta.” Alternative beta and average hedge fund returns are analogous to equity beta and average equity man-ager returns. Below we show, for three popular hedge fund styles, how the average performance of the styles can be attrib-uted to systematic exposures to known premia and how a strat-egy combining those premia can make an attractive investment.
Equity Long/Short Alternative risk premia relating to equity long/short and equity-market-neutral hedge funds are very closely tied to the history of the development of the concept of beta itself. When equity beta was first introduced, some managers continued to outperform the traditional indexes simply by giving a value or size bias. When Fama and French articulated the idea of
risk premia compensating these types of exposures, the bar was raised on active managers. The perhaps-surprising result in the equity hedge fund world is that what we previously assumed was alpha is in fact a long/short variant of what we previously were already familiar with in the traditional world.
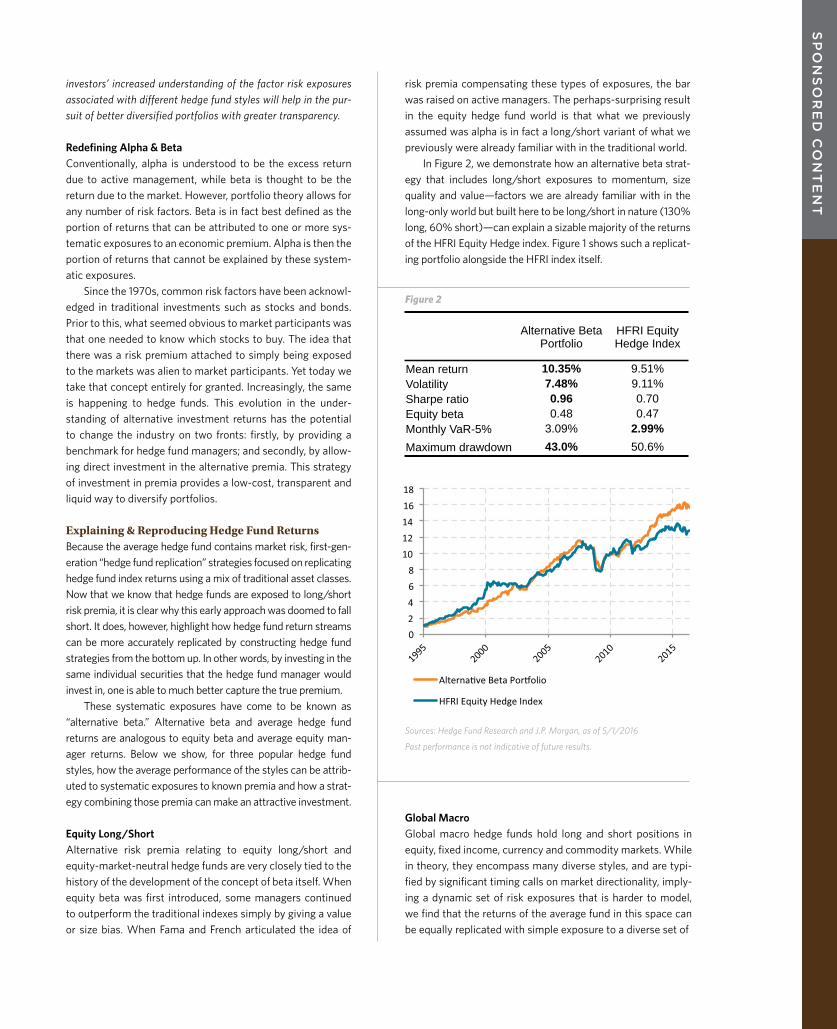
In Figure 2, we demonstrate how an alternative beta strat-egy that includes long/short exposures to momentum, size quality and value—factors we are already familiar with in the long-only world but built here to be long/short in nature (130% long, 60% short)—can explain a sizable majority of the returns of the HFRI Equity Hedge index. Figure 1 shows such a replicat-ing portfolio alongside the HFRI index itself.
Figure 2
SP
ON
SO
RE
D C
ON
TE
NT
Alternative Beta Portfolio
HFRI Equity Hedge Index
Mean return 10.35% 9.51% Volatility 7.48% 9.11% Sharpe ratio 0.96 0.70 Equity beta 0.48 0.47 Monthly VaR-5% 3.09% 2.99% Maximum drawdown 43.0% 50.6%
Global MacroGlobal macro hedge funds hold long and short positions in equity, fixed income, currency and commodity markets. While in theory, they encompass many diverse styles, and are typi-fied by significant timing calls on market directionality, imply-ing a dynamic set of risk exposures that is harder to model, we find that the returns of the average fund in this space can be equally replicated with simple exposure to a diverse set of
Sources: Hedge Fund Research and J.P. Morgan, as of 5/1/2016
Past performance is not indicative of future results.
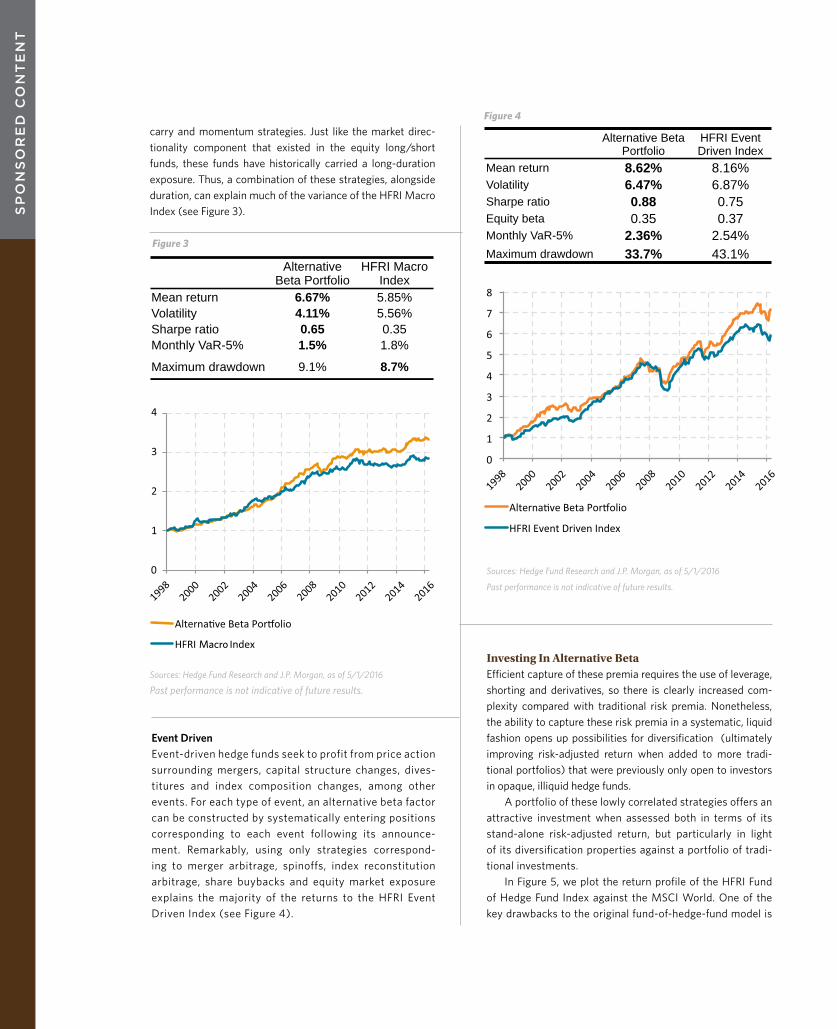
carry and momentum strategies. Just like the market direc-tionality component that existed in the equity long/short funds, these funds have historically carried a long-duration exposure. Thus, a combination of these strategies, alongside duration, can explain much of the variance of the HFRI Macro Index (see Figure 3).S
PO
NS
OR
ED
CO
NT
EN
T
Investing In Alternative BetaEfficient capture of these premia requires the use of leverage, shorting and derivatives, so there is clearly increased com-plexity compared with traditional risk premia. Nonetheless, the ability to capture these risk premia in a systematic, liquid fashion opens up possibilities for diversification (ultimately improving risk-adjusted return when added to more tradi-tional portfolios) that were previously only open to investors in opaque, illiquid hedge funds.
A portfolio of these lowly correlated strategies offers an attractive investment when assessed both in terms of its stand-alone risk-adjusted return, but particularly in light of its diversification properties against a portfolio of tradi-tional investments.
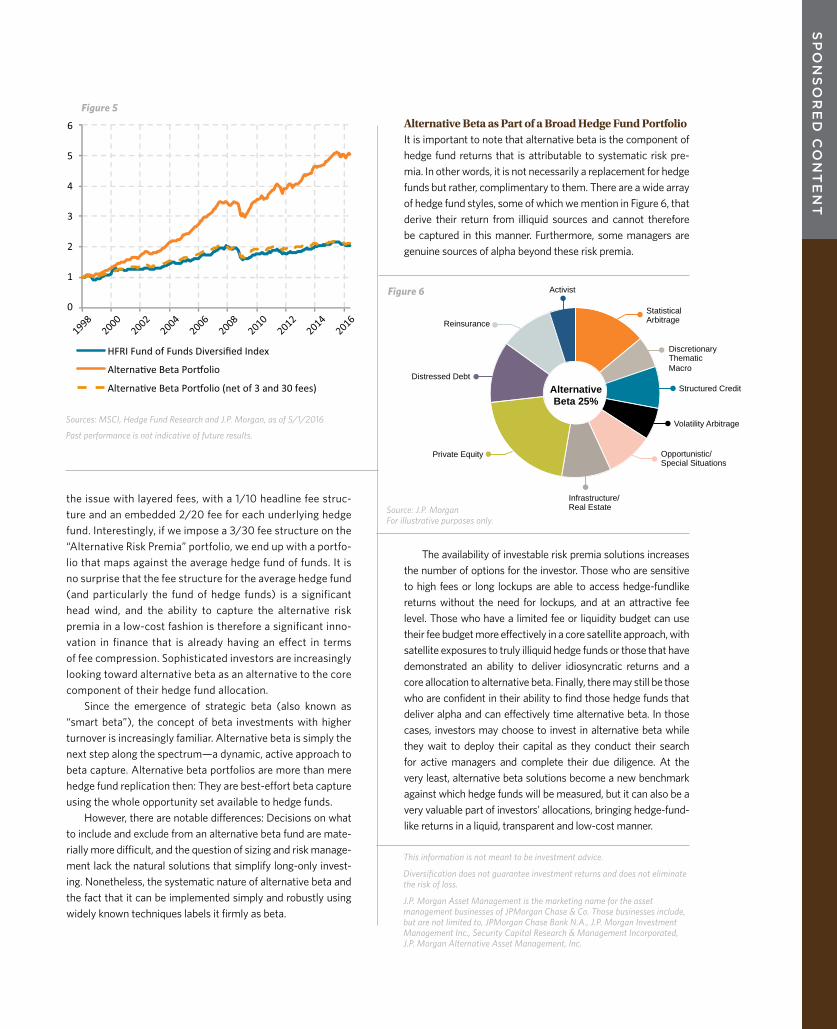
In Figure 5, we plot the return profile of the HFRI Fund of Hedge Fund Index against the MSCI World. One of the key drawbacks to the original fund-of-hedge-fund model is
Alternative Beta Portfolio
HFRI Macro Index
Mean return 6.67% 5.85% Volatility 4.11% 5.56% Sharpe ratio 0.65 0.35 Monthly VaR-5% 1.5% 1.8%
Maximum drawdown 9.1% 8.7%
Alternative Beta Portfolio
HFRI Event Driven Index
Mean return 8.62% 8.16% Volatility 6.47% 6.87% Sharpe ratio 0.88 0.75 Equity beta 0.35 0.37 Monthly VaR-5% 2.36% 2.54% Maximum drawdown 33.7% 43.1%
Event DrivenEvent-driven hedge funds seek to profit from price action surrounding mergers, capital structure changes, dives-titures and index composition changes, among other events. For each type of event, an alternative beta factor can be constructed by systematically entering positions corresponding to each event following its announce-ment. Remarkably, using only strategies correspond-ing to merger arbitrage, spinoffs, index reconstitution arbitrage, share buybacks and equity market exposure explains the majority of the returns to the HFRI Event Driven Index (see Figure 4).
Sources: Hedge Fund Research and J.P. Morgan, as of 5/1/2016
Past performance is not indicative of future results.
Sources: Hedge Fund Research and J.P. Morgan, as of 5/1/2016
Past performance is not indicative of future results.
Figure 3
Figure 4
Private Equity
Structured Credit Alternative Beta 25%
Statistical Arbitrage
Discretionary Thematic Macro
Opportunistic/Special Situations
Infrastructure/ Real Estate
Distressed Debt
Reinsurance
Activist
Volatility Arbitrage
This information is not meant to be investment advice.
Diversification does not guarantee investment returns and does not eliminate the risk of loss.
J.P. Morgan Asset Management is the marketing name for the asset management businesses of JPMorgan Chase & Co. Those businesses include, but are not limited to, JPMorgan Chase Bank N.A., J.P. Morgan Investment Management Inc., Security Capital Research & Management Incorporated, J.P. Morgan Alternative Asset Management, Inc.
SP
ON
SO
RE
D C
ON
TE
NT
the issue with layered fees, with a 1/10 headline fee struc-ture and an embedded 2/20 fee for each underlying hedge fund. Interestingly, if we impose a 3/30 fee structure on the “Alternative Risk Premia” portfolio, we end up with a portfo-lio that maps against the average hedge fund of funds. It is no surprise that the fee structure for the average hedge fund (and particularly the fund of hedge funds) is a significant head wind, and the ability to capture the alternative risk premia in a low-cost fashion is therefore a significant inno-vation in finance that is already having an effect in terms of fee compression. Sophisticated investors are increasingly looking toward alternative beta as an alternative to the core component of their hedge fund allocation.
Since the emergence of strategic beta (also known as “smart beta”), the concept of beta investments with higher turnover is increasingly familiar. Alternative beta is simply the next step along the spectrum—a dynamic, active approach to beta capture. Alternative beta portfolios are more than mere hedge fund replication then: They are best-effort beta capture using the whole opportunity set available to hedge funds.
However, there are notable differences: Decisions on what to include and exclude from an alternative beta fund are mate-rially more difficult, and the question of sizing and risk manage-ment lack the natural solutions that simplify long-only invest-ing. Nonetheless, the systematic nature of alternative beta and the fact that it can be implemented simply and robustly using widely known techniques labels it firmly as beta.
Alternative Beta as Part of a Broad Hedge Fund PortfolioIt is important to note that alternative beta is the component of hedge fund returns that is attributable to systematic risk pre-mia. In other words, it is not necessarily a replacement for hedge funds but rather, complimentary to them. There are a wide array of hedge fund styles, some of which we mention in Figure 6, that derive their return from illiquid sources and cannot therefore be captured in this manner. Furthermore, some managers are genuine sources of alpha beyond these risk premia.
Sources: MSCI, Hedge Fund Research and J.P. Morgan, as of 5/1/2016
Past performance is not indicative of future results.
Source: J.P. MorganFor illustrative purposes only.
The availability of investable risk premia solutions increases the number of options for the investor. Those who are sensitive to high fees or long lockups are able to access hedge-fundlike returns without the need for lockups, and at an attractive fee level. Those who have a limited fee or liquidity budget can use their fee budget more effectively in a core satellite approach, with satellite exposures to truly illiquid hedge funds or those that have demonstrated an ability to deliver idiosyncratic returns and a core allocation to alternative beta. Finally, there may still be those who are confident in their ability to find those hedge funds that deliver alpha and can effectively time alternative beta. In those cases, investors may choose to invest in alternative beta while they wait to deploy their capital as they conduct their search for active managers and complete their due diligence. At the very least, alternative beta solutions become a new benchmark against which hedge funds will be measured, but it can also be a very valuable part of investors’ allocations, bringing hedge-fund-like returns in a liquid, transparent and low-cost manner.
Figure 5
Figure 6
ing on low-volatility names. As InsideETFs CEO Matt Hougan wrote on ETF.com, “The beauty of USMV is that, by lowering the overall volatility of the portfolio, it should help investors ride out short-term volatility and therefore hold their positions for the long haul.”
In a way, demand for USMV speaks to investors’ desire to stay invested even when the market isn’t making it easy to do so in the short run.
When it came to equity expo-sure, large-cap equity ETFs weren’t all that popular in the first five months of the year. Developed-mar-ket equities, by and large, weren’t either. International equities—including emerging market stocks—were even less hot. As an asset class, foreign stock funds lost more than $14.6 billion in assets—the biggest net redemptions of any asset class tracked by FactSet in the period.
PLENTY HAS BEEN SAID ABOUT THE DANGERS OF READING TOO MUCH INTO ETF ASSET FLOWS. And yet there’s really no other way to slice it: ETF investors are playing it safe—defensively, even—in 2016.
Perhaps it’s because the equity market hasn’t done all that much. The S&P 500 rallied only some 3% in five months amid highly volatile, choppy action. In that period, U.S. equity ETFs gathered a paltry $3.9 bil-lion in fresh net inflows, a muted demand that largely centered on funds focused on things like dividends and value stocks—the more defensive-type fare within equity plays.
The most popular equity ETF so far this year, in fact, is the iShares Edge MSCI Min Vol USA ETF (USMV|A-69), attracting more than $5.3 billion in five months, accord-ing to FactSet data. USMV is only No. 2 in terms of assets gathered (within the entire 1,900-plus fund universe in 2016) to an even more risk-off play: the SPDR Gold Trust (GLD|A-100), which raked in more than $8.8 billion in net inflows in the January-to-May period.
‘THE BEAUTY OF USMV’USMV is a low-volatility strategy that looks to
capture as much upside in the equity as possible while protecting investors from downside action by focus-
RISK-OFF ETFs
ATTRACTING ASSETS
By Cinthia Murphy
MIDYEAR REPORT
18
But through it all, USMV reigned supreme, holding on to the No. 2 spot, with positive net creations month after month, growing to become a $13.25 billion ETF.
‘AGED AND OVERVALUED BULL MARKET’“The cyclical bull market is aged and
overvalued,” Steve Blumenthal, chairman and chief executive officer of CMG Capital Management, said of the risk aversion among investors. He noted that of the 36 cyclical bull market moves since 1900, the current cyclical bull is already the third-longest bull-run.
“The flows tell me that money is growing cautious. And it should,” Blumenthal said. “My personal view is that there’s a growing loss of confidence in central bank policy.”
Nothing suggests caution like a stampede into gold. GLD has been the most popular ETF so far this year, with $8.8 billion in inflows. And as investors rushed in, the fund didn’t disappoint, rallying more than 14% in five months.
Also hugely popular were broad, investment-grade fixed-income strategies such as the iShares Core U.S. Aggregate Bond ETF (AGG|A-98), the iShares TIPS Bond ETF (TIP|A-99) and the Van-guard Total Bond Market Index Fund (BND|A-94), or funds investing in Treasurys and TIPS.
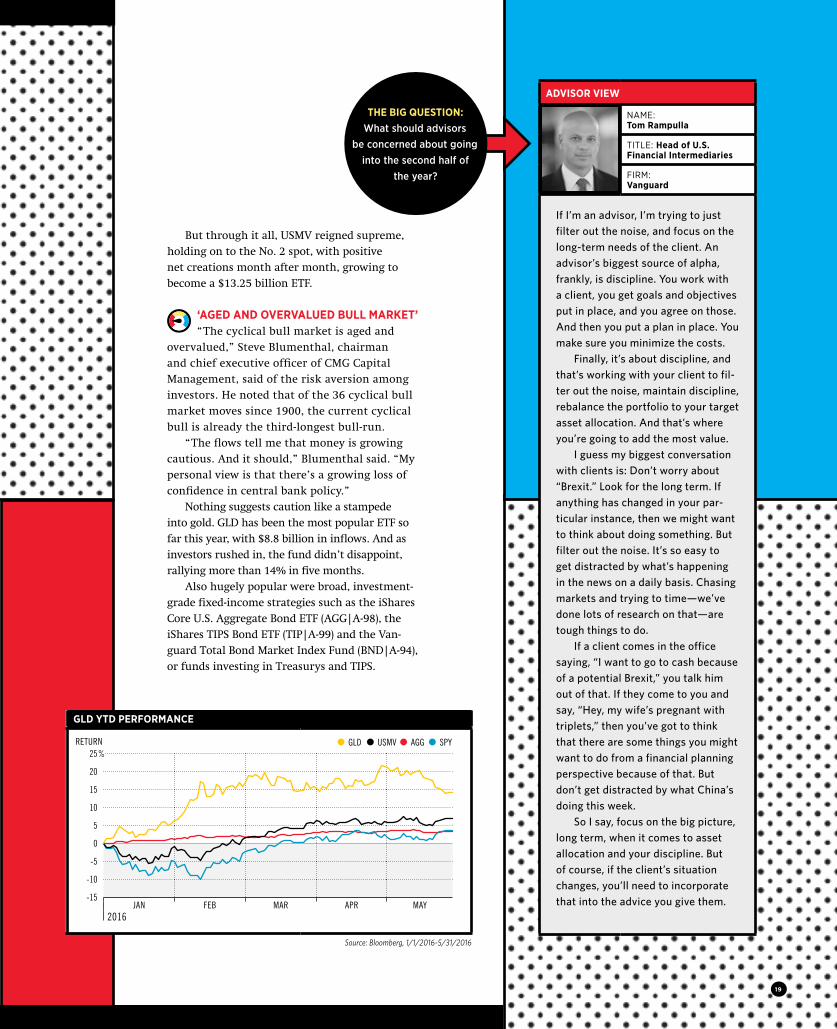
ADVISOR VIEW
NAME: Tom Rampulla
TITLE: Head of U.S. Financial Intermediaries
FIRM: Vanguard
If I’m an advisor, I’m trying to just filter out the noise, and focus on the long-term needs of the client. An advisor’s biggest source of alpha, frankly, is discipline. You work with a client, you get goals and objectives put in place, and you agree on those. And then you put a plan in place. You make sure you minimize the costs.
Finally, it’s about discipline, and that’s working with your client to fil-ter out the noise, maintain discipline, rebalance the portfolio to your target asset allocation. And that’s where you’re going to add the most value.
I guess my biggest conversation with clients is: Don’t worry about “Brexit.” Look for the long term. If anything has changed in your par-ticular instance, then we might want to think about doing something. But filter out the noise. It’s so easy to get distracted by what’s happening in the news on a daily basis. Chasing markets and trying to time—we’ve done lots of research on that—are tough things to do.
If a client comes in the office saying, “I want to go to cash because of a potential Brexit,” you talk him out of that. If they come to you and say, “Hey, my wife’s pregnant with triplets,” then you’ve got to think that there are some things you might want to do from a financial planning perspective because of that. But don’t get distracted by what China’s doing this week.
So I say, focus on the big picture, long term, when it comes to asset allocation and your discipline. But of course, if the client’s situation changes, you’ll need to incorporate that into the advice you give them.
THE BIG QUESTION: What should advisors
be concerned about going into the second half of
the year?
GLD YTD PERFORMANCE
JAN FEB MAR APR MAY2016
Source: Bloomberg, 1/1/2016-5/31/2016
25
20
15
10
5
0
-5
-10
-15
% RETURN GLD USMV AGG SPY
19
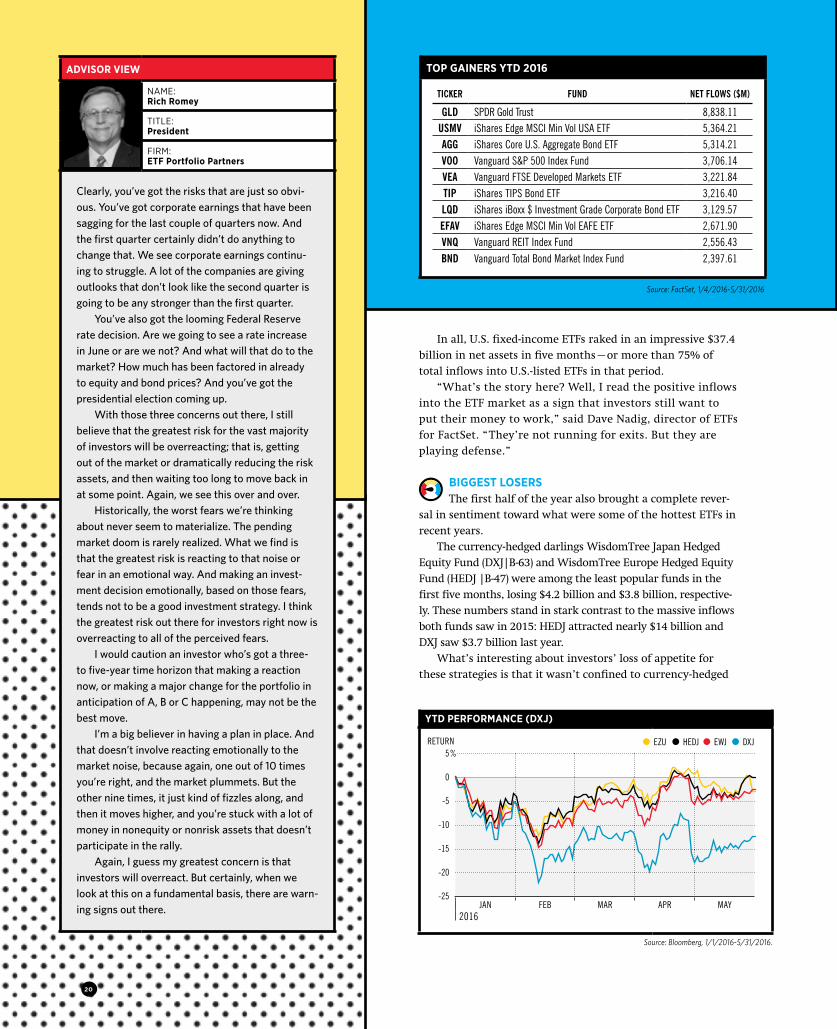
YTD PERFORMANCE (DXJ)
JAN FEB MAR APR MAY2016
Source: Bloomberg, 1/1/2016-5/31/2016.
5
0
-5
-10
-15
-20
-25
% RETURN EZU HEDJ EWJ DXJ
In all, U.S. fixed-income ETFs raked in an impressive $37.4 billion in net assets in five months—or more than 75% of total inflows into U.S.-listed ETFs in that period.
“What’s the story here? Well, I read the positive inflows into the ETF market as a sign that investors still want to put their money to work,” said Dave Nadig, director of ETFs for FactSet. “They’re not running for exits. But they are playing defense.”
BIGGEST LOSERSThe first half of the year also brought a complete rever-
sal in sentiment toward what were some of the hottest ETFs in recent years.
The currency-hedged darlings WisdomTree Japan Hedged Equity Fund (DXJ|B-63) and WisdomTree Europe Hedged Equity Fund (HEDJ |B-47) were among the least popular funds in the first five months, losing $4.2 billion and $3.8 billion, respective-ly. These numbers stand in stark contrast to the massive inflows both funds saw in 2015: HEDJ attracted nearly $14 billion and DXJ saw $3.7 billion last year.
What’s interesting about investors’ loss of appetite for these strategies is that it wasn’t confined to currency-hedged
ADVISOR VIEW
NAME: Rich Romey
TITLE: President
FIRM: ETF Portfolio Partners
Clearly, you’ve got the risks that are just so obvi-ous. You’ve got corporate earnings that have been sagging for the last couple of quarters now. And the first quarter certainly didn’t do anything to change that. We see corporate earnings continu-ing to struggle. A lot of the companies are giving outlooks that don’t look like the second quarter is going to be any stronger than the first quarter.
You’ve also got the looming Federal Reserve rate decision. Are we going to see a rate increase in June or are we not? And what will that do to the market? How much has been factored in already to equity and bond prices? And you’ve got the presidential election coming up.
With those three concerns out there, I still believe that the greatest risk for the vast majority of investors will be overreacting; that is, getting out of the market or dramatically reducing the risk assets, and then waiting too long to move back in at some point. Again, we see this over and over.
Historically, the worst fears we’re thinking about never seem to materialize. The pending market doom is rarely realized. What we find is that the greatest risk is reacting to that noise or fear in an emotional way. And making an invest-ment decision emotionally, based on those fears, tends not to be a good investment strategy. I think the greatest risk out there for investors right now is overreacting to all of the perceived fears.
I would caution an investor who’s got a three- to five-year time horizon that making a reaction now, or making a major change for the portfolio in anticipation of A, B or C happening, may not be the best move.
I’m a big believer in having a plan in place. And that doesn’t involve reacting emotionally to the market noise, because again, one out of 10 times you’re right, and the market plummets. But the other nine times, it just kind of fizzles along, and then it moves higher, and you’re stuck with a lot of money in nonequity or nonrisk assets that doesn’t participate in the rally.
Again, I guess my greatest concern is that investors will overreact. But certainly, when we look at this on a fundamental basis, there are warn-ing signs out there.
TOP GAINERS YTD 2016
TICKER FUND NET FLOWS ($M)
GLD SPDR Gold Trust 8,838.11USMV iShares Edge MSCI Min Vol USA ETF 5,364.21AGG iShares Core U.S. Aggregate Bond ETF 5,314.21VOO Vanguard S&P 500 Index Fund 3,706.14VEA Vanguard FTSE Developed Markets ETF 3,221.84TIP iShares TIPS Bond ETF 3,216.40LQD iShares iBoxx $ Investment Grade Corporate Bond ETF 3,129.57EFAV iShares Edge MSCI Min Vol EAFE ETF 2,671.90VNQ Vanguard REIT Index Fund 2,556.43BND Vanguard Total Bond Market Index Fund 2,397.61
Source: FactSet, 1/4/2016-5/31/2016
20
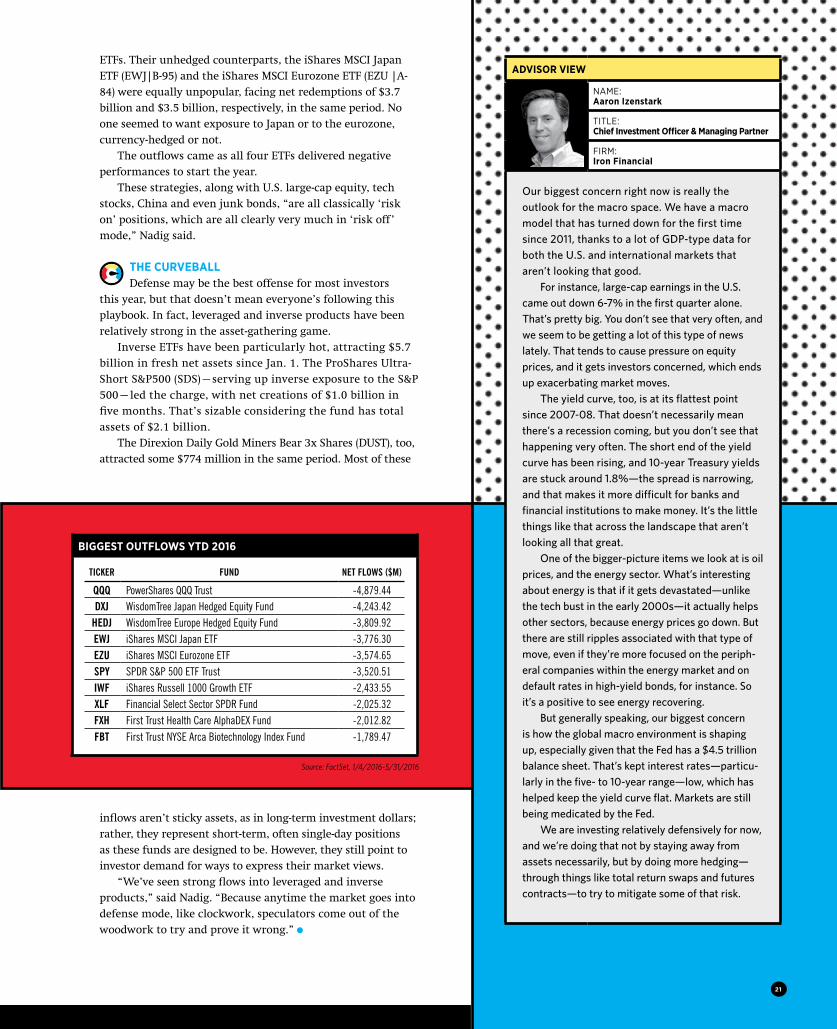
ADVISOR VIEW
NAME: Aaron Izenstark
TITLE: Chief Investment Officer & Managing Partner
FIRM: Iron Financial
Our biggest concern right now is really the outlook for the macro space. We have a macro model that has turned down for the first time since 2011, thanks to a lot of GDP-type data for both the U.S. and international markets that aren’t looking that good.
For instance, large-cap earnings in the U.S. came out down 6-7% in the first quarter alone. That’s pretty big. You don’t see that very often, and we seem to be getting a lot of this type of news lately. That tends to cause pressure on equity prices, and it gets investors concerned, which ends up exacerbating market moves.
The yield curve, too, is at its flattest point since 2007-08. That doesn’t necessarily mean there’s a recession coming, but you don’t see that happening very often. The short end of the yield curve has been rising, and 10-year Treasury yields are stuck around 1.8%—the spread is narrowing, and that makes it more difficult for banks and financial institutions to make money. It’s the little things like that across the landscape that aren’t looking all that great.
One of the bigger-picture items we look at is oil prices, and the energy sector. What’s interesting about energy is that if it gets devastated—unlike the tech bust in the early 2000s—it actually helps other sectors, because energy prices go down. But there are still ripples associated with that type of move, even if they’re more focused on the periph-eral companies within the energy market and on default rates in high-yield bonds, for instance. So it’s a positive to see energy recovering.
But generally speaking, our biggest concern is how the global macro environment is shaping up, especially given that the Fed has a $4.5 trillion balance sheet. That’s kept interest rates—particu-larly in the five- to 10-year range—low, which has helped keep the yield curve flat. Markets are still being medicated by the Fed.
We are investing relatively defensively for now, and we’re doing that not by staying away from assets necessarily, but by doing more hedging—through things like total return swaps and futures contracts—to try to mitigate some of that risk.
ETFs. Their unhedged counterparts, the iShares MSCI Japan ETF (EWJ|B-95) and the iShares MSCI Eurozone ETF (EZU |A-84) were equally unpopular, facing net redemptions of $3.7 billion and $3.5 billion, respectively, in the same period. No one seemed to want exposure to Japan or to the eurozone, currency-hedged or not.
The outflows came as all four ETFs delivered negative performances to start the year.
These strategies, along with U.S. large-cap equity, tech stocks, China and even junk bonds, “are all classically ‘risk on’ positions, which are all clearly very much in ‘risk off’ mode,” Nadig said.
THE CURVEBALLDefense may be the best offense for most investors
this year, but that doesn’t mean everyone’s following this playbook. In fact, leveraged and inverse products have been relatively strong in the asset-gathering game.
Inverse ETFs have been particularly hot, attracting $5.7 billion in fresh net assets since Jan. 1. The ProShares Ultra-Short S&P500 (SDS)—serving up inverse exposure to the S&P 500—led the charge, with net creations of $1.0 billion in five months. That’s sizable considering the fund has total assets of $2.1 billion.
The Direxion Daily Gold Miners Bear 3x Shares (DUST), too, attracted some $774 million in the same period. Most of these
BIGGEST OUTFLOWS YTD 2016
TICKER FUND NET FLOWS ($M)
QQQ PowerShares QQQ Trust -4,879.44DXJ WisdomTree Japan Hedged Equity Fund -4,243.42
HEDJ WisdomTree Europe Hedged Equity Fund -3,809.92EWJ iShares MSCI Japan ETF -3,776.30EZU iShares MSCI Eurozone ETF -3,574.65SPY SPDR S&P 500 ETF Trust -3,520.51IWF iShares Russell 1000 Growth ETF -2,433.55XLF Financial Select Sector SPDR Fund -2,025.32FXH First Trust Health Care AlphaDEX Fund -2,012.82FBT First Trust NYSE Arca Biotechnology Index Fund -1,789.47
inflows aren’t sticky assets, as in long-term investment dollars; rather, they represent short-term, often single-day positions as these funds are designed to be. However, they still point to investor demand for ways to express their market views.
“We’ve seen strong flows into leveraged and inverse products,” said Nadig. “Because anytime the market goes into defense mode, like clockwork, speculators come out of the woodwork to try and prove it wrong.”
Source: FactSet, 1/4/2016-5/31/2016
21
The search for the best way to represent or gain exposure to the “market” had, until recently, experienced two major milestones:
• The first came in 1896, when Charles Dow created the original price-weighted stock index. For decades, it served as the accepted concept of the market until stock splits and corporate actions exposed the limitation of Dow’s methodology.
• The second came more than a half century later, in 1957, when Standard & Poor’s unveiled the S&P 500 Index, a market capitalization index that was broader in scope and more adaptable to corporate action.
Much has changed since 1957, yet the popularity of Standard & Poor’s mar-ket-capitalization-weighting methodology perseveres. An entire industry has been built on the concept that the S&P 500 Index provides the best rep-resentation of the U.S. equity market, and more than $2 trillion is currently invested in market-cap-weighted strategies.1 The confidence in market-cap weighting has endured even though there is not any research proving that it is the most ideal way to gain exposure to the equity market or the factors that drive equity performance. In fact, it’s been quite the contrary, as mar-ket-cap weighted indices have proven to expose investors to unintended concentrations of risk, often at inopportune times.
While investors were increasingly allocating more dollars to market-cap- weighted strategies, by the late 1990s teams of academics began uncov-ering a number of factors beyond broad market exposure—such as value, size, momentum and low volatility—that the historical evidence demonstrat-ed were even more significant and persistent drivers of equity returns over decades.
At the same time, the drawbacks of market-cap-weighted indices were being laid bare. Since market-cap-weighted indices are price driven, they give the highest priced stocks the largest weightings, and the lowest priced stocks the smallest. A company’s market capitalization at any point in time is not necessarily a true measure of its economic value, but rather an indicator of the prevailing market sentiment on that stock at the time. As former U.S. Federal Reserve Chairman Alan Greenspan famously noted, sentiment can sometimes become “irrationally exuberant.” When that happens, sector exposure in a market-cap-weighted portfolio can become skewed. Within the S&P 500 Index, for example, weightings often favor booming sectors. Energy was 30% of the index in 1980, technology 30% in 1999, and financials 22% in 2006, all on the eve of crises in each of these sectors.2 That presented concentration risk and, with that level of exposure, investors in passive portfolios that mirrored the index fully participated in the subsequent busts those sectors experienced.
Smart Beta Strategies Tap Other Return Drivers
Building on the work of the academics who identified the additional key return drivers, a new category of investments has emerged, called smart beta. Each of these smart beta strategies uses a different weighting methodology, with the goal of delivering better returns and less concentration risk.
The first generation of smart beta strategies employed style tilts, by focusing on growth or value stocks. The next generation directly targeted specific factors—such as momentum or low volatility—to determine stock weights, or they used a particular fundamental of a stock—such as earnings, dividends, or revenue—to weight securities and provide favorable tilts toward several of the key return drivers.
Which Stocks? Which Weighting Strategies?
It is important to note that the primary issue with market cap indices is not with the stocks they hold, but rather with the weightings those stocks are assigned. Investors who own market-cap-weighted strategies that track a major, well-known index are not being exposed to inferior stocks. In fact, it’s generally quite the opposite. To be included in the Standard & Poor’s indices, as an example, a company must meet multiple criteria, such as having four consecutive quarters of profits. That is an entirely reasonable—and effective–measure of quality.
To build a strategy that will capture, and possibly exceed, the returns available from a broad market, while mitigating risk, it is NOT necessary to create a new index with different securities. Using the securities in an already well-established index will provide investors with broad, diversified exposure to a market.
The problem with portfolios that aim to track a market, generally arises from the scheme used to weight securities, and market cap can cause investors to be excessively exposed to overvalued stocks. The risk of such overexpo-sure becomes heightened during stock market bubbles, which in the past 35 years have occurred three times.
If market capitalization isn’t the best weighting strategy, what is? Is it one that focuses on particular factor or a fundamental-weighting methodology that could provide favorable exposure to a combination of the return drivers?
To answer that question, investors and their advisors must first identify their objectives. What are they trying to accomplish?
• The highest possible return?
• The best risk-adjusted return?
• The lowest volatility?
• The most defensive portfolio?
A New Alternative to Passive Investing: A Revenue-Based Smart Beta StrategyBy Sharon French, Head of Beta Solutions and Vince Lowry, Leader Revenue Weighted Strategy Team
SPONSORED CONTENT SPONSORED CONTENT
All are worthy goals, but selecting factor tilts or fundamental weighting schemes that focus narrowly on any of these goals could bring unintended consequences, such as less diversification or significant style or market-cap drift away from the target market or index.
The goal with any smart beta strategy is to maintain the best aspects of a market-cap portfolio—including broad diversification—while avoiding the worst, including the tendency to focus on overvalued stocks and sectors. Ideally, a smart beta strategy should also not bring a significant style or market-cap drift away from the attributes of the broad market index. It must also offer a rules-based and transparent investment strategy and satisfy the practical matters of enabling any firm that offers a smart beta product to deliver a cost-efficient and liquid investment vehicle to investors.
Revenue Weighting Offers a Combination of Compelling Potential Benefits
One fundamental strategy–revenue weighting–can satisfy many of these criteria. A revenue-based portfolio weights companies according to their trailing 12-month sales revenue, and rebalances quarterly on the basis of the latest sales results. Revenue is the purest measure of performance on a company’s income statement, and it is difficult to manipulate. The potential benefits the strategy offers include:
1. Broad market diversification. Every company in the S&P 500 Index has sales, so revenue weighting will still provide full, diversified exposure to the market.
2. Minimal style and market cap drift from the original target. The result of the revenue weight is a large-cap core/value portfolio3 with a beta to the market of only slightly higher than 1.4
3. A transparent, rules-based investment process. Weighting by revenue is a straightforward approach. To see the weighting scheme in action, consider that the total trailing 12-month revenue of the S&P 500 Index on December 31, 2015 was $10.7 trillion, and Procter & Gamble’s was $69.3 billion. That level of sales relative to the whole universe of U.S. large-cap stocks would result in P&G having a 0.65% weighting in the
revenue-based portfolio at the end of 2015 versus a 1.21% weighting in the market-cap index.5 If, in future quarters, P&G’s revenues were to increase relative to the broad market, it would get a higher weighting in the revenue-weighted portfolio. Similarly, if its relative revenues declined, it would have a lower weighting.
Revenue weighting also provides potential risk benefits and improved valuation characteristics. The quarterly rebalancing is designed to pull the portfolio away from companies with faster growing market capitalizations relative to the market and toward companies with faster growing revenues relative to the market. The result of the quarterly rebalancing is that histori-cally the revenue-weighted portfolio has lower price-to-sales ratios than the market cap index across each of the 10 GICS (Global Industry Classification Standards) sectors.
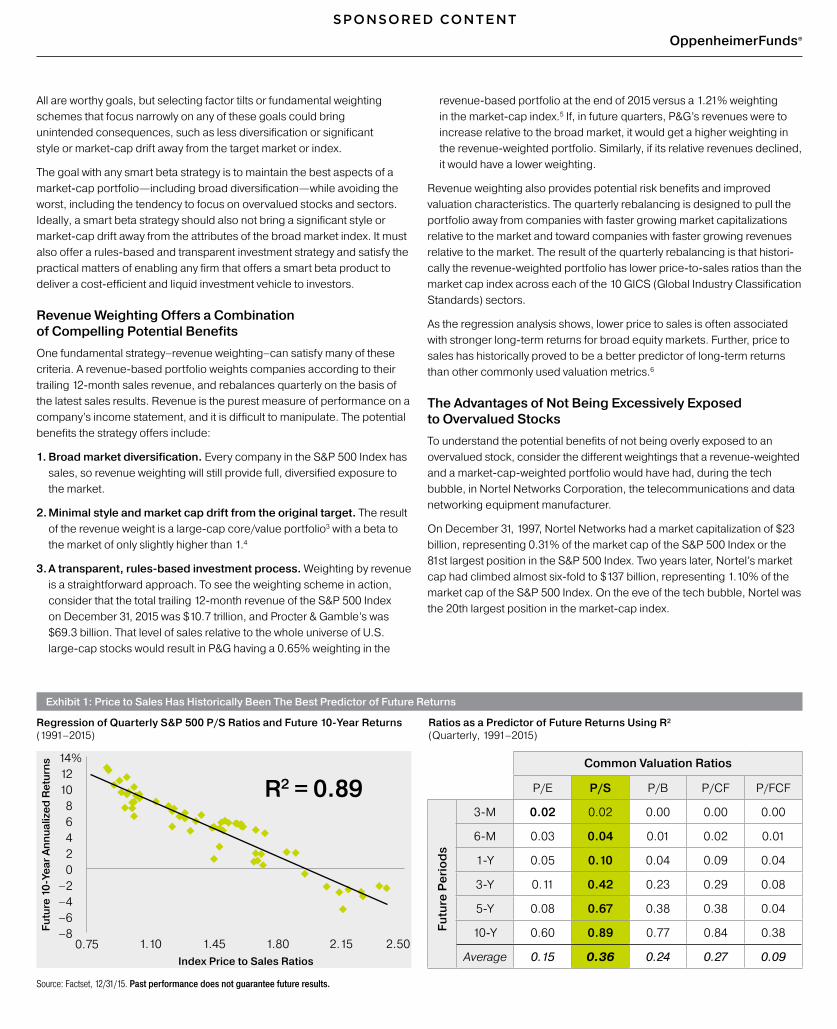
As the regression analysis shows, lower price to sales is often associated with stronger long-term returns for broad equity markets. Further, price to sales has historically proved to be a better predictor of long-term returns than other commonly used valuation metrics.6
The Advantages of Not Being Excessively Exposed to Overvalued Stocks
To understand the potential benefits of not being overly exposed to an overvalued stock, consider the different weightings that a revenue-weighted and a market-cap-weighted portfolio would have had, during the tech bubble, in Nortel Networks Corporation, the telecommunications and data networking equipment manufacturer.
On December 31, 1997, Nortel Networks had a market capitalization of $23 billion, representing 0.31% of the market cap of the S&P 500 Index or the 81st largest position in the S&P 500 Index. Two years later, Nortel’s market cap had climbed almost six-fold to $137 billion, representing 1.10% of the market cap of the S&P 500 Index. On the eve of the tech bubble, Nortel was the 20th largest position in the market-cap index.
OppenheimerFunds®
Exhibit 1: Price to Sales Has Historically Been The Best Predictor of Future Returns
Regression of Quarterly S&P 500 P/S Ratios and Future 10-Year Returns (1991–2015)
Ratios as a Predictor of Future Returns Using R² (Quarterly, 1991–2015)
Source: Factset, 12/31/15. Past performance does not guarantee future results.
Common Valuation Ratios
P/E P/S P/B P/CF P/FCF
3-M 0.02 0.02 0.00 0.00 0.00
6-M 0.03 0.04 0.01 0.02 0.01
1-Y 0.05 0.10 0.04 0.09 0.04
3-Y 0.11 0.42 0.23 0.29 0.08
5-Y 0.08 0.67 0.38 0.38 0.04
10-Y 0.60 0.89 0.77 0.84 0.38
Average 0.15 0.36 0.24 0.27 0.09
Futu
re P
erio
ds
Index Price to Sales Ratios
Futu
re 1
0-Ye
ar A
nnua
lized
Ret
urns
0.75 1.10 1.45 1.80 2.15 2.50–8–6–4–2
02468
101214%
R2 = 0.89
SPONSORED CONTENT SPONSORED CONTENT

Over that same period, Nortel’s revenues grew only slightly faster than those of the broad index. The weighting of Nortel in the revenue-based portfolio was significantly smaller than that of the market-cap index, ranging between 0.35% and 0.40% throughout the period.7
Nortel’s significant underperformance during the tech bust proved a significant drag on the performance of the S&P 500 Index, while its poor performance had much less of an impact on the revenue-weighted portfolio. Nortel is but one example of many information technology companies whose larger weightings in the market-capitalization index in the late 1990s were not justified by the companies’ fundamentals.
Revenue-Weighted Strategies Measure Well in the Factors that Drive Returns
Revenue weighting provides favorable tilts toward several of the key drivers of return. A regression analysis reveals the degree to which a hypothetical large-cap revenue-weighted strategy would have delivered on the return drivers over the past 43 years. The results are presented in pentagons, commonly known as radar or spider charts. (A plot point near the outer edge of the pentagon means a favorable tilt toward a particular attribute, a plot point closer to the center means a lower tilt.)
The S&P 500 Index “scores” in the mid-range for all of the factors that can drive returns, except for size.
Exhibit 2: Revenue vs. Market-Cap Weighting and the Drivers of Return
Sources: Ned Davis Research, CRSP, Kenneth French Data Library, 12/31/15.
The revenue-weighted approach provides more favorable tilts toward four of the five drivers of returns, as outlined below.
• Value By having sales determine the weightings, and not a consideration influenced by stocks’ prices, a revenue-based strategy will be more focused on companies with more attractive valuations, as measured by their price-to-book value.
• Size By eliminating the market-cap weighting that the index employs, a revenue-weighting strategy will own more companies with lower capitalizations than the index.
• Momentum This is one factor the revenue-weighted portfolio will score lower on be-cause momentum is a function of price, which is not taken into account with the focus on sales. There are risk management benefits to this low score, as the portfolio will have lower exposure to potentially overpriced stocks and typically experience smaller drawdowns during bouts of intense downside volatility, like the aftermath of the 1990s tech bubble.7
• Low Volatility Revenue weighting brings a slightly higher focus on companies that don’t experience wide price swings. That helps drive long-term returns and sta-bilize the returns that investors experience.
Results
To assess how using a revenue-weighted approach might perform versus the traditional market-cap-weighted approach, we conducted a study by weighing the constituents of the S&P 500 Index based on revenue and compared that to the traditional S&P 500 Index. For purposes of our research, we assumed a 0.09% management fee for the fully passive market-cap approach and a 0.49% fee for the revenue-weighted strategy.
Our research shows that over the past 43 years, the revenue-weighted strategy delivered an extra 150 basis points (1.50%) in average annual returns. Over the full period, it nearly doubled the returns of the market-cap index. On an initial investment of $100,000, that higher return translated into more than $5.5 million in additional returns.
The revenue-weighted strategy generated that outperformance with only slightly higher standard deviation of returns, experienced almost entirely on the upside of markets. The revenue-weighted strategy captured 136% of the S&P 500’s upside and 99% of the downside. The Sharpe ratio of the revenue-weighted strategy over this period was 0.73 compared with 0.65 for the S&P 500 Index.7
Exhibit 3: Revenue-Weighted Strategy Outperformed the Market-Cap Weighted S&P 500 Over the Past Four Decades
Growth of $100,000: 1972-2015 (net of fees)*
Source: Ned Davis Research, 12/31/15. Expense ratios were determined by the current expense ratio of OppenheimerFunds Large-Cap Revenue ETF (0.49%) and SPDR S&P 500 ETF Trust (0.09%), the most commonly held ETF in the world. Past performance does not guarantee future results.
The Right Way to Invest
MarketHigh Beta
Low VolatilityPrice stable companies
MomentumWinners
SizeSmall Firms
ValueLow price to book
Market CapRevenue
1972 1982 1992 2002 2012 2015
S&P 500 IndexS&P 500 Index: Revenue-Weighted
0
3,000,000
6,000,000
9,000,000
12,000,000
$15,000,000S&P 500 Index: Revenue-Weighted
S&P 500 Index $11,911,064
$6,548,470
Annualized Standard Up Down Return Deviation Capture Capture
Revenue-Weighted 11.5% 15.8% 136% 99%Cap-Weighted 10.0% 15.3% — —
SPONSORED CONTENT SPONSORED CONTENT
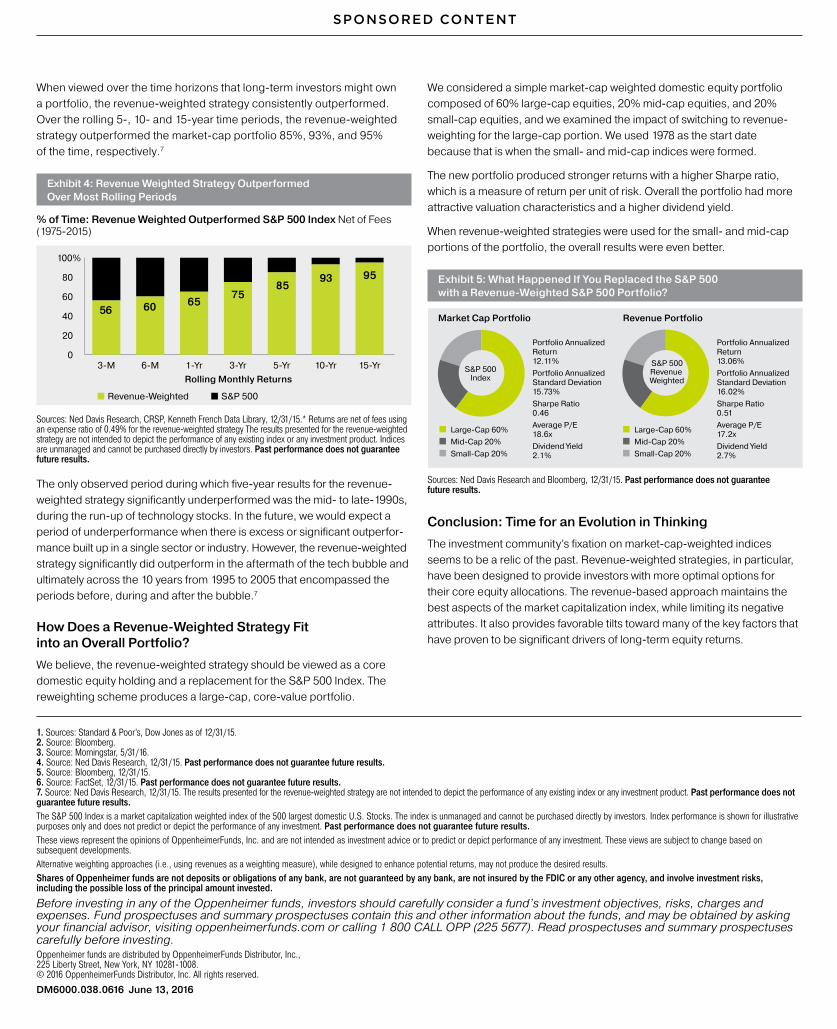
When viewed over the time horizons that long-term investors might own a portfolio, the revenue-weighted strategy consistently outperformed. Over the rolling 5-, 10- and 15-year time periods, the revenue-weighted strategy outperformed the market-cap portfolio 85%, 93%, and 95% of the time, respectively.7
Exhibit 4: Revenue Weighted Strategy Outperformed Over Most Rolling Periods
% of Time: Revenue Weighted Outperformed S&P 500 Index Net of Fees (1975-2015)
Sources: Ned Davis Research, CRSP, Kenneth French Data Library, 12/31/15.* Returns are net of fees using an expense ratio of 0.49% for the revenue-weighted strategy The results presented for the revenue-weighted strategy are not intended to depict the performance of any existing index or any investment product. Indices are unmanaged and cannot be purchased directly by investors. Past performance does not guarantee future results.
The only observed period during which five-year results for the revenue- weighted strategy significantly underperformed was the mid- to late-1990s, during the run-up of technology stocks. In the future, we would expect a period of underperformance when there is excess or significant outperfor-mance built up in a single sector or industry. However, the revenue-weighted strategy significantly did outperform in the aftermath of the tech bubble and ultimately across the 10 years from 1995 to 2005 that encompassed the periods before, during and after the bubble.7
How Does a Revenue-Weighted Strategy Fit into an Overall Portfolio?
We believe, the revenue-weighted strategy should be viewed as a core domestic equity holding and a replacement for the S&P 500 Index. The reweighting scheme produces a large-cap, core-value portfolio.
We considered a simple market-cap weighted domestic equity portfolio composed of 60% large-cap equities, 20% mid-cap equities, and 20% small-cap equities, and we examined the impact of switching to revenue- weighting for the large-cap portion. We used 1978 as the start date because that is when the small- and mid-cap indices were formed.
The new portfolio produced stronger returns with a higher Sharpe ratio, which is a measure of return per unit of risk. Overall the portfolio had more attractive valuation characteristics and a higher dividend yield.
When revenue-weighted strategies were used for the small- and mid-cap portions of the portfolio, the overall results were even better.
Exhibit 5: What Happened If You Replaced the S&P 500 with a Revenue-Weighted S&P 500 Portfolio?
Sources: Ned Davis Research and Bloomberg, 12/31/15. Past performance does not guarantee future results.
Conclusion: Time for an Evolution in Thinking
The investment community’s fixation on market-cap-weighted indices seems to be a relic of the past. Revenue-weighted strategies, in particular, have been designed to provide investors with more optimal options for their core equity allocations. The revenue-based approach maintains the best aspects of the market capitalization index, while limiting its negative attributes. It also provides favorable tilts toward many of the key factors that have proven to be significant drivers of long-term equity returns.
1. Sources: Standard & Poor’s, Dow Jones as of 12/31/15. 2. Source: Bloomberg. 3. Source: Morningstar, 5/31/16. 4. Source: Ned Davis Research, 12/31/15. Past performance does not guarantee future results. 5. Source: Bloomberg, 12/31/15. 6. Source: FactSet, 12/31/15. Past performance does not guarantee future results.7. Source: Ned Davis Research, 12/31/15. The results presented for the revenue-weighted strategy are not intended to depict the performance of any existing index or any investment product. Past performance does not guarantee future results.The S&P 500 Index is a market capitalization weighted index of the 500 largest domestic U.S. Stocks. The index is unmanaged and cannot be purchased directly by investors. Index performance is shown for illustrative purposes only and does not predict or depict the performance of any investment. Past performance does not guarantee future results.These views represent the opinions of OppenheimerFunds, Inc. and are not intended as investment advice or to predict or depict performance of any investment. These views are subject to change based on subsequent developments. Alternative weighting approaches (i.e., using revenues as a weighting measure), while designed to enhance potential returns, may not produce the desired results.Shares of Oppenheimer funds are not deposits or obligations of any bank, are not guaranteed by any bank, are not insured by the FDIC or any other agency, and involve investment risks, including the possible loss of the principal amount invested.
Before investing in any of the Oppenheimer funds, investors should carefully consider a fund’s investment objectives, risks, charges and expenses. Fund prospectuses and summary prospectuses contain this and other information about the funds, and may be obtained by asking your financial advisor, visiting oppenheimerfunds.com or calling 1 800 CALL OPP (225 5677). Read prospectuses and summary prospectuses carefully before investing.Oppenheimer funds are distributed by OppenheimerFunds Distributor, Inc., 225 Liberty Street, New York, NY 10281-1008. © 2016 OppenheimerFunds Distributor, Inc. All rights reserved.
DM6000.038.0616 June 13, 2016
Portfolio Annualized�Return�12.11%Portfolio Annualized�Standard Deviation�15.73%Sharpe Ratio�0.46Average P/E�18.6xDividend Yield�2.1%
Portfolio Annualized Return�13.06%Portfolio Annualized Standard Deviation�16.02%Sharpe Ratio�0.51Average P/E�17.2xDividend Yield�2.7%
Market Cap Portfolio Revenue Portfolio
■ Large-Cap 60%■ Mid-Cap 20%■ Small-Cap 20%
■ Large-Cap 60%■ Mid-Cap 20%■ Small-Cap 20%
S&P 500Index
S&P 500Revenue WeightedRolling Monthly Returns
Revenue-Weighted S&P 500
0
20
40
60
80
100%
15-Yr10-Yr5-Yr3-Yr1-Yr6-M3-M
56 60 6575
8593 95
SPONSORED CONTENT SPONSORED CONTENT

26 ETF.com/ETF Report
BIGGEST LAUNCHESSO FAR THIS YEAR
NO BLOCKBUSTERS, BUT AN INTERESTING ROSTER
The first five months of 2016 are really an example of extremes when it comes to ETF launches, with two funds in particular attracting assets of more than $200 mil-lion. No other funds that have launched this year have even begun to approach those levels.
However, neither of those funds has what one could consider a traditional back story.
The first, the SPDR SSGA Gender Diversity Index ETF (SHE), launched in early March, and has grown its assets under management to nearly $270 million. Keep in mind, though, that pension fund CalSTRS seeded the fund with $250 million at its launch, so the amount of assets is perhaps less impressive than the conviction one of the country’s largest pension funds expressed by investing in SHE right out of the gate.
The ETF is a large-cap U.S. fund that gives heavier weights to companies that include women in executive positions. SHE has outperformed the SPDR S&P 500 ETF (SPY|A-97) since its launch.
26 ETF.com/ETF Report
By Heather Bell
27JULY 2016
ETNs are not known forgathering
significant assets.
Dynamic Currency Hedging The second-largest fund to launch so far in 2016 is the WisdomTree Dynamic Currency Hedged International Equity Fund (DDWM), which uses an adjustable currency hedge and represents the most successful fund in the wave of next-gener-ation currency-hedged ETFs that have recently launched. DDWM’s index relies on difference in interest rates, momentum and long-term valuations to determine to what extent it should hedge its portfolio, anywhere from 0% to 100%. The currency hedging is reset monthly.
The fund has roughly $242 million in assets under management, but the vast majority of that flowed into the fund in one day in late April, a few months after its January launch. The fund has performed differently from its unhedged and fully hedged counterparts, DWM and HDWM, aligning most closely with DWM and outperforming it in key spots. Given that DDWM costs 0.35% in expense ratio versus the 0.48% charged by DWM, it looks like at least one investor considered it to be a pretty good deal.
ETNs Have Their Season Exchange-traded notes are not known for gathering significant assets. The largest has just $3.7 billion, but in the early months of 2016, ETNs were a good chunk of the most popular launches. In fact, four of the top 10 launches so far this year are ETNs.
That said, the UBS AG FI Enhanced Global High Yield ETN (FIHD), the third-largest ETF launched this year, is a far cry from the assets of SHE or DDWM, coming in at almost $64 million at the end of May. FIHD looks to provide two times the returns of the MSCI World High Divi-dend Yield Index on a quarterly basis.
Despite being publicly traded, FIHD is part of the suite of ETNs that were created for Fisher Investments by various issuers. Fisher Invest-ments is likely the source of almost all of FIHD’s assets.
Another ETN created for Fisher Investments is in the top 10, with some $46 million in assets under management. The UBS AG Enhanced Europe 50 ETN (FIEE) launched in February and provides twice the return of its underlying index, the Stoxx Europe 50 Index, on a quarterly basis.
Two leveraged master limited partnership ETNs also rank in the top 10 funds in terms of assets. The Etracs 2xMonthly Leveraged S&P MLP Index ETN Series B (MLPZ) and the Etracs 2xMonthly Leveraged Alerian MLP Infrastructure Index ETN Series B (MLPQ) have roughly $50 mil-lion in assets under management apiece.
The funds have both performed well as MLPs have rebounded from their lows along with oil prices, which they reached around the time the ETNs launched.
27JULY 2016
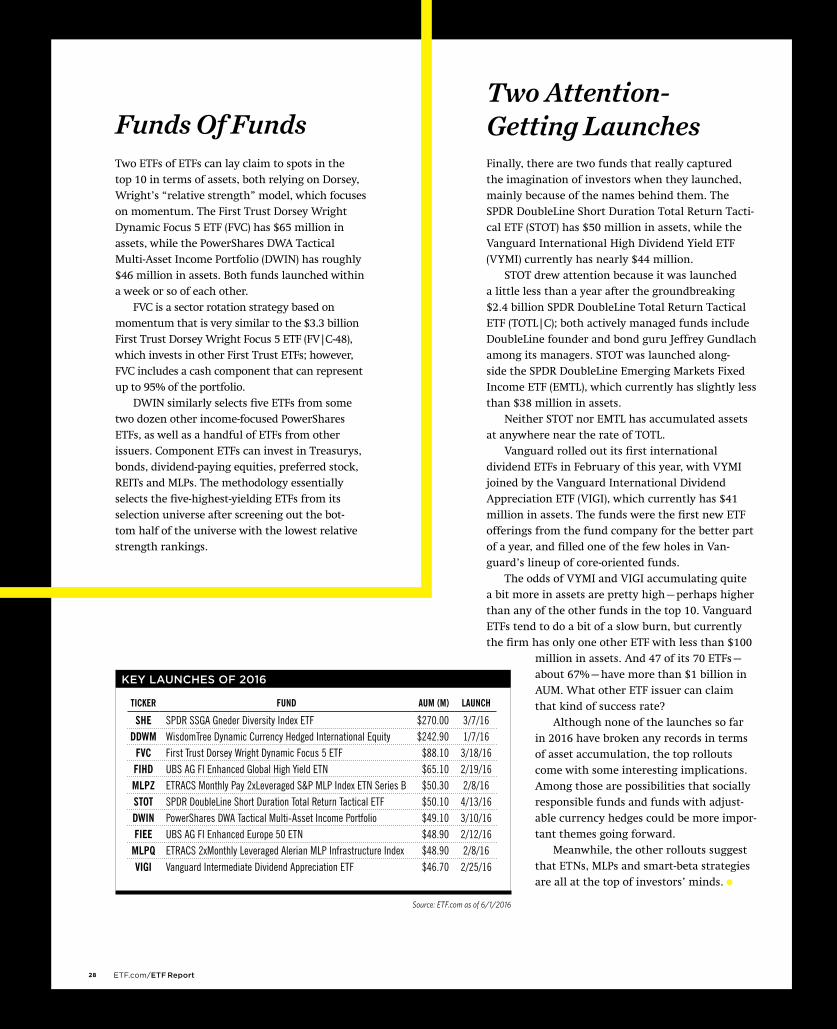
28 ETF.com/ETF Report
Funds Of FundsTwo ETFs of ETFs can lay claim to spots in the top 10 in terms of assets, both relying on Dorsey, Wright’s “relative strength” model, which focuses on momentum. The First Trust Dorsey Wright Dynamic Focus 5 ETF (FVC) has $65 million in assets, while the PowerShares DWA Tactical Multi-Asset Income Portfolio (DWIN) has roughly $46 million in assets. Both funds launched within a week or so of each other.
FVC is a sector rotation strategy based on momentum that is very similar to the $3.3 billion First Trust Dorsey Wright Focus 5 ETF (FV|C-48), which invests in other First Trust ETFs; however, FVC includes a cash component that can represent up to 95% of the portfolio.
DWIN similarly selects five ETFs from some two dozen other income-focused PowerShares ETFs, as well as a handful of ETFs from other issuers. Component ETFs can invest in Treasurys, bonds, dividend-paying equities, preferred stock, REITs and MLPs. The methodology essentially selects the five-highest-yielding ETFs from its selection universe after screening out the bot-tom half of the universe with the lowest relative strength rankings.
Two Attention- Getting Launches Finally, there are two funds that really captured the imagination of investors when they launched, mainly because of the names behind them. The SPDR DoubleLine Short Duration Total Return Tacti-cal ETF (STOT) has $50 million in assets, while the Vanguard International High Dividend Yield ETF (VYMI) currently has nearly $44 million.
STOT drew attention because it was launched a little less than a year after the groundbreaking $2.4 billion SPDR DoubleLine Total Return Tactical ETF (TOTL|C); both actively managed funds include DoubleLine founder and bond guru Jeffrey Gundlach among its managers. STOT was launched along-side the SPDR DoubleLine Emerging Markets Fixed Income ETF (EMTL), which currently has slightly less than $38 million in assets.
Neither STOT nor EMTL has accumulated assets at anywhere near the rate of TOTL.
Vanguard rolled out its first international dividend ETFs in February of this year, with VYMI joined by the Vanguard International Dividend Appreciation ETF (VIGI), which currently has $41 million in assets. The funds were the first new ETF offerings from the fund company for the better part of a year, and filled one of the few holes in Van-guard’s lineup of core-oriented funds.
The odds of VYMI and VIGI accumulating quite a bit more in assets are pretty high—perhaps higher than any of the other funds in the top 10. Vanguard ETFs tend to do a bit of a slow burn, but currently the firm has only one other ETF with less than $100
million in assets. And 47 of its 70 ETFs—about 67%—have more than $1 billion in AUM. What other ETF issuer can claim that kind of success rate?
Although none of the launches so far in 2016 have broken any records in terms of asset accumulation, the top rollouts come with some interesting implications. Among those are possibilities that socially responsible funds and funds with adjust-able currency hedges could be more impor-tant themes going forward.
Meanwhile, the other rollouts suggest that ETNs, MLPs and smart-beta strategies are all at the top of investors’ minds.
KEY LAUNCHES OF 2016
TICKER FUND AUM (M) LAUNCH
SHE SPDR SSGA Gneder Diversity Index ETF $270.00 3/7/16DDWM WisdomTree Dynamic Currency Hedged International Equity $242.90 1/7/16
FVC First Trust Dorsey Wright Dynamic Focus 5 ETF $88.10 3/18/16FIHD UBS AG FI Enhanced Global High Yield ETN $65.10 2/19/16MLPZ ETRACS Monthly Pay 2xLeveraged S&P MLP Index ETN Series B $50.30 2/8/16STOT SPDR DoubleLine Short Duration Total Return Tactical ETF $50.10 4/13/16DWIN PowerShares DWA Tactical Multi-Asset Income Portfolio $49.10 3/10/16FIEE UBS AG FI Enhanced Europe 50 ETN $48.90 2/12/16
MLPQ ETRACS 2xMonthly Leveraged Alerian MLP Infrastructure Index $48.90 2/8/16VIGI Vanguard Intermediate Dividend Appreciation ETF $46.70 2/25/16
Source: ETF.com as of 6/1/2016
28 ETF.com/ETF Report

29JULY 2016
TAMARAC ADVISOR SUITE
What financial technology app, program or other solution do you find most helpful in your business?I have been using the Tamarac Advisor Suite—I used that at my old firm (Highline, which was bought by Bronfman last year) and I was responsible for imple-menting it and for training our entire staff. Tama-rac is our reporting software. It’s also our customer relationship management (CRM) software, and they offer a rebalancing tool.
What made you choose Tamarac?When I came to [Bronfman], Tamarac was on a short list, and I had great experience with it at my old firm. It’s a company that’s constantly evolving. It offers new releases every two months, which is amazing, and it’s hugely different from the reporting software that we usu-ally find for wealth advisors. It offers daily performance report-ing, and it’s constantly releasing new features that help make our lives easier.
How long have you used it?I’ve been a user for a minimum of seven years, and on the CRM side, I’ve been a user for three years.
How does Bronfman use Tamarac?Every single advisor that’s a client-facing individ-ual who either manages clients or assists an advi-sor that’s managing clients uses the reporting software in some way. Our entire firm uses the CRM to make sure we’re creating a client expe-rience that’s uniform across the board, and that we’re creating workflows across the company.
You like that Tamarac is an integrated solution. How does that help?A lot of times you have different software that doesn’t talk to each other. They can be really helpful in a specific facet of a company, but you spend a lot of time exporting this infor-mation, importing into here, trying to compile information in different ways. I think Tamarac does a really good job of giving us the informa-tion we need at our fingertips with the click of a few buttons, which is huge. It’s very efficient.
What is a particularly outstanding feature? Security is a big thing. We need to make sure our clients’ assets are secure in a custody relationship, but we can’t make it so secure that we can’t access it. Tamarac makes our
information secure in the cloud so it’s accessible to all employees. So Tamarac is extremely good about being up-to-date with security functions and communicat-ing those, and helping us get clients’ information in a secure way. Each one of our clients has their own client portal they’re able to log in to and get their informa-tion, instead of us sending that information out over
email or in a way that isn’t as secure as them logging in to a website.
How has Tamarac helped you become more efficient?Tamarac helps us leverage our time, so we can spend more time in front of the client and less time on the back-office items. It’s a click of a button for us to really get the information we need instead of spending a lot of time behind the scenes trying to dig through and sort through what we need. Management reports, client reports, understanding where we are in a pro-cess—all of that’s easily accessible and certainly makes our time more efficient.
FINTECH IN FOCUS
FINTECHTOOLS
FIRM: Bronfman E.L. Rothschild
LOCATION: Rockville, MD
FOUNDED: 2014
AUM: $3.5B
% IN ETFS: ~10%
JILL LIZZIWealth Advisor
By Debbie Carlson
TAMARAC MAKES OUR INFORMATION
SECURE IN THE CLOUD
FINTECH TOOL OF THE MONTH
TECHNOLOGY: Tamarac Advisor Suite
WHAT IT IS: Web-based back-office software for independent advisors and wealth managers.
WHAT IT DOES: Integrates portfolio management, performance reporting, billing, rebalancing and trading software with an online client portal and an enterprise-level customer relationship management software. Components can be purchased separately or as a complete unit.

30 ETF.com/ETF Report
Why did iShares launch sector-based multifactor ETFs?Sectors remain often the first entree for investors into ETFs in general. It’s a place where they frequently test out ETFs if they’re relatively unfamiliar with them. We think our multifactor approach highlights these factors that have outper-formed the market in the long term and make a lot of sense in the sector space. We think it’s a great chance to distinguish ourselves in that category and differenti-ate ourselves with an approach that dem-onstrates a long-term ability to add value over the broader asset class.
What have investors and fund managers asked you for regarding multisector smart-beta funds? There are a couple of home offices in the retail space that have indicated interest because they’re frequent model builders. They’re also [into] smart beta aggressively across the board beyond sectors. And they thought that intersection made sense. People are much more interested in a broad asset-class offering in that category,
BLACKROCK’S iSHARES recent launch of nine multifactor sector exchange-traded funds represents a big bet on smart beta being an important part of investors’ future portfolio construction.
Additionally, the firm unveiled a new website about factor investing and a smart-beta guide. The world’s largest smart-beta ETF provider also rebranded its current factor-based funds under the name “iShares Edge.” Including the nine new multifactor sector funds, the iShares Edge suite comprises eight single-factor, 15 multifactor, 11 minimum-volatility and one fixed-income ETF, representing more than $28 billion in assets under management.
Rob Nestor, head of iShares smart beta strategy at BlackRock, spoke to ETF Report about what the ETF provider sees in the space.
Rob NestoriSHARES MAKES BIG BET ON MULTIFACTOR SECTORS
By Debbie Carlson
S M A R T- B E TA C O R N E R

31JULY 2016
and it’s dominating our discussions across the traditional financial advisors (FAs), across institutions and those home offices.
What type of investor/manager is asking about multisector smart-beta funds?Across the board, people are asking, but I wouldn’t say it’s overwhelming that people are asking about multifactor sec-tors. We’re a bit ahead of what we think people are going to want.
A “build it and they will come” sort of thing?Exactly. The two categories we have had the most communicated interest in are the minimum-volatility category and multifactor. We built ours in a way that’s a little different from the rest of the smart-beta universe. We believe mini-mum-volatility strategies are primarily a risk-mitigating strategy. Those are not about trying to outperform.
Then there are individual or return-seeking factors. On an individual basis, our multifactor approach is specifically designed to outperform the market with a comparable risk of the market. And so when you think of the classic risk/return chart, minimum volatility is about going left—same return, less risk. Multifactor strategies are going north—same risk, greater return. And those are very distinct portfolio objectives. Those decisions should be made at the portfolio level, not within that product.
These funds seem to be pretty similar to the Hancock Dimensional Fund Advisors smart-beta sector funds. What audience are you targeting? We’re targeting primarily sector alloca-tors and model builders with sectors in mind, so that can be for the retail home office models that a lot of the FAs follow, or asset managers that utilize them as part of a top-down asset allocation model.
Or asset managers that are more bottoms-up that don’t utilize all the sectors. They tend to put on bets in the most efficient way possible within a portfolio that would complement single-security holdings. They will often use sector ETFs to effi-ciently make that call on technology or financials or what have you.
How are yours different, aside from a lower expense ratio?The major difference is the Hancock funds follow the DFA model, and they primarily focus on value and size—with some quality bent—but they don’t use the momentum factor directly. The use of the momentum factor is the major difference. We also have a little bit broader lineup and are priced slightly lower.
The Hancock funds haven’t performed that well. Considering theirs have been slow out of the gate, why will your funds be more attractive?I think our relationships in the ETF world, our heritage in working with MSCI—the index provider in this space—and our fun-damental philosophy on what works in the space will carry the day and allow us to make a case to a variety of different cli-ents on why they make sense, if you were inclined to be a sector investor. We’re not trying to convince nonsector investors to start using sectors. That’s not our focus.
Our multifactor approach is specifically designed to outperform the market with a comparable risk of the market
32 ETF.com/ETF Report
S M A R T- B E TA C O R N E R
As part of the launch, BlackRock also launched a factors website and an iShares smart-beta guide. Why?The biggest gap in this space is under-standing. Factors are not new; we’ve been doing it for 30 years on the institu-tional side. It’s mostly been the purview of a small cadre of buy-side investors who had access to the data. ETFs have democratized access to factor investing in a very, very efficient way. There is this veil of complication I think we need to lift. Esoterically, in terms of how the methodology is built, there is some com-plication there, but what drives returns isn’t that complicated.
Traditional market-cap weighting still works, but what traditional market weighting doesn’t address are two to three very fundamental client outcomes we hear requested every day: 1) I want participate in the long-trend return of the broad asset classes, but do so with less risk; 2) Despite appreciating the benefits of past investing, I still feel compelled to outperform, and smart beta can do that, too; and 3) I want to build an income port-folio with dividend smart beta.
In February, a research report from Research Affiliates (RA) said there was the possibility things with smart beta might go wrong. Considering who they are, it raised some eyebrows. Is this a concern given how much factor-based investing has grown? I think in a lot of cases the thread has been lost with regard to what Rob [Arnott] and RA focused on. Valuations matter, but they’re not the only measure. They matter much more to the short-term investor than they do a long-term investor. The rise of valuation in certain areas of the factor space is part of the cycles of factors. It doesn’t change the thesis of outperfor-mance in the long term. To be frank, it will change potentially what that excess return will be from today to some future date.
One of the biggest things [Rob] focused on … was growth of low-volatility and minimum-volatility strategies. Where the analysis missed the boat unquestionably was that the price of insurance has risen; but these strategies are built on exactly what I said—they’re built to mitigate risk, not to outperform. The thread of what a lot of what Rob talked about was having a focus on outperformance. The last 18 months have been sideways to down, and volatility has been high. That’s exactly when you expect minimum volatility to outperform. When the markets rally, minimum volatility will lag.
ETFs have democratized access to factor
investing in a very, very efficient way
You’re already the biggest provider of smart-beta ETFs; what’s BlackRock/iShares’ strategy for factor investing going forward?We built our product to fit into the asset allocation [model] everyone’s familiar with. If you look at our minimum-volatil-ity suite, it’s built to go along with com-mon asset classes. We’re helping people learn how to plug that into the natural asset allocation. We’re spending a lot of time consulting on portfolio construction within the retail and institutional busi-ness, where clients give us their portfolio, we do the X-ray on the risk they have and the different dimensions, and figure out how to plug factors into that portfolio to meet the risk/reward equation they’re try-ing to achieve.

33JULY 2016
AGGP QUICK VIEW
ISSUER IndexIQ
SEGMENT Fixed Income: U.S. - Broad Market
EXPENSE RATIO 0.35%
STRUCTURE Open-Ended Fund
DATE LAUNCHED 5/10/2016
COMPETING FUNDS IUSB, FIBR, INC
Sources: ETF.com and FactSet. All data as of 5/31/2016. Launches cover April and May 2016.
*Covers April and May 2016.
Smart-Beta Launches
63% SMART BETA
37% OTHER FUNDS
FEATURED ETF PROFILETOP 10 SMART-BETA ETFs BY AUM
SMART BETA VS. OTHER ETF LAUNCHES*
RECENT SMART-BETA ETF LAUNCHES
IQ Enhanced Core Plus Bond U.S.IndexIQ rolled out an ETF in May on the NYSE that uses momentum to overweight and underweight different bond sectors. The IQ Enhanced Core Plus Bond U.S. ETF (AGGP) charges 0.35%.
AGGP is a “funds of funds” that, accord-ing to the prospectus, is designed to out-perform the broad U.S. dollar-denominated taxable fixed-income space. It invests pri-marily in other ETFs.
The methodology relies on short-term and long-term momentum, overweighting high-momentum sectors and underweighting low-momentum sectors. The index is recon-stituted annually, but rebalanced monthly.
AGGP covers investment-grade and high-yield debt that falls into the following sectors:• Short-term U.S. Treasurys (one- to three-
year maturities)• Intermediate-term U.S. Treasurys (three-
to 10-year maturities)• Long-term U.S. Treasurys (greater than
10-year maturities)• U.S. investment-grade corporate bonds• U.S. investment-grade mortgage-backed
securities• U.S. high-yield (or “junk”) debt• U.S.-dollar-denominated debt of emerging
market issuers
LAUNCHES
Amplify Online Retail
BullMark LatAm Select Leaders
Credit Suisse X-Links Monthly 2xLev Alerian MLP ETN
Deutsche X-trackers FTSE Emrg Comprehensive Factor
Dhando Junoon
Global X Health & Wellness Thematic
Global X Longevity Thematic
Global X Millennials Thematic
Guggenheim Large Cap Optimized Diversification
Guggenheim US Large Cap Optimized Volatility
IQ Enhanced Core Bond U.S.
IQ Enhanced Core Plus Bond U.S.
iShares Edge MSCI Multifactor Consumer Discr
iShares Edge MSCI Multifactor Consumer Staples
iShares Edge MSCI Multifactor Energy
iShares Edge MSCI Multifactor Financials
iShares Edge MSCI Multifactor Healthcare
iShares Edge MSCI Multifactor Industrials
iShares Edge MSCI Multifactor Materials
iShares Edge MSCI Multifactor Technology
iShares Edge MSCI Multifactor Utilities
iShares International Dividend Growth
JPMorgan Diversified Return Europe Currency Hedged
JPMorgan Diversified Return Intl Currency Hedged
JPMorgan Diversified Return US Mid Cap Equity
Sprott Buzz Social Media Insights
WisdomTree Emerging Markets Dividend
WisdomTree International Quality Dividend Growth
WisdomTree Fundamental US Corp Bond
WisdomTree Fundamental US HiYld Corp Bond
WisdomTree Fundamental US Short-Term Corp Bond
WisdomTree Fundamental US Short-Term HiYld Corp Bond
1 iShares Russell 1000 Growth
TICKER: IWF ER: 0.20% AUM: $29.4B
2 iShares Russell 1000 Value
TICKER: IWD ER: 0.20% AUM: $27.7B
3 Vanguard Value
TICKER: VTV ER: 0.09% AUM: $21.4B
4 Vanguard Dividend Appreciation
TICKER: VIG ER: 0.09% AUM: $20.9B
5 Vanguard Growth
TICKER: VUG ER: 0.08% AUM: $20.8B
6 iShares Select Dividend
TICKER: DVY ER: 0.39% AUM: $14.8B
7 Vanguard High Dividend Yield
TICKER: VYM ER: 0.09% AUM: $13.8B
8 iShares S&P 500 Growth
TICKER: IVW ER: 0.18% AUM: $13.6B
9 SPDR S&P Dividend
TICKER: SDY ER: 0.39% AUM: $13.3B
10 iShares Edge MSCI Min Vol USA
TICKER: USMV ER: 0.15% AUM: $13.2B
GO
For the latest smart-beta listings, visit:
www.ETF.com/channels/smart-beta-etfs
ONLINE
FUNDS LAUNCHED
49
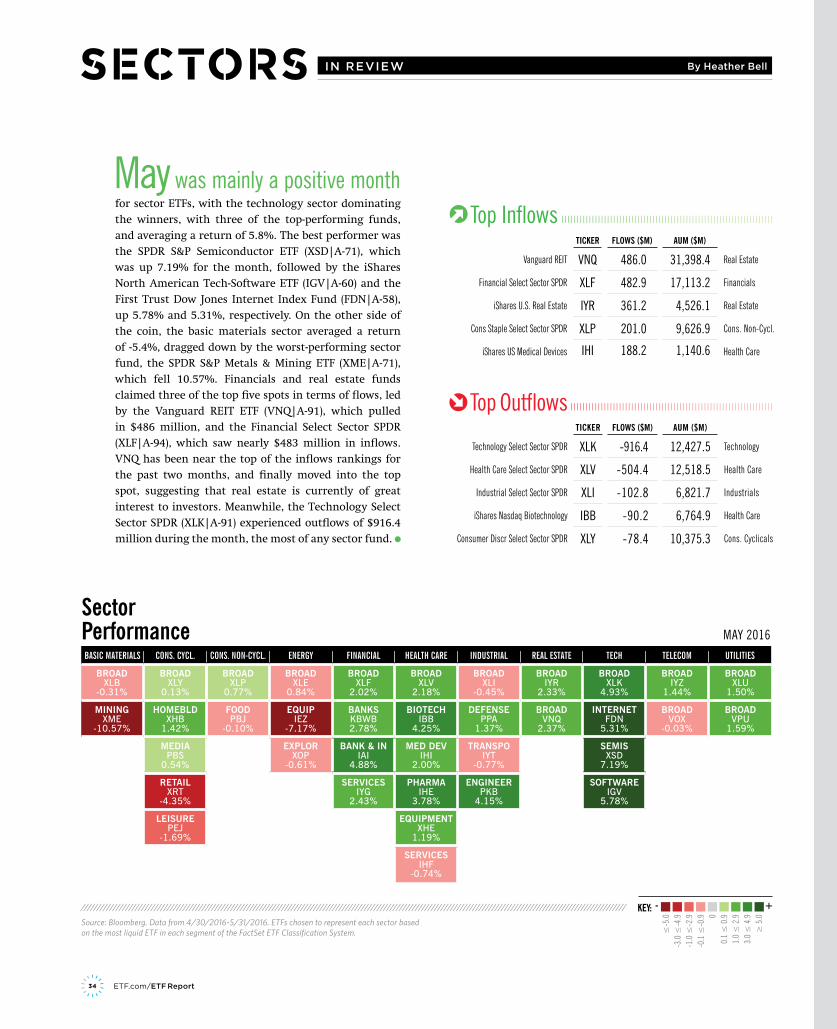
34 ETF.com/ETF Report
Carefully consider the fund’s investment objectives, risk factors, and charges and expenses before investing. This and other information can be found in the fund’s prospectus, which may be obtained by calling 1-855-329-3837, or by viewing or downloading a prospectus from deutsche-etfs.com. Read the prospectus carefully before investing.
Deutsche X-trackers ETFs (“ETFs”) are managed by DBX Advisors LLC or (the “Adviser”), and distributed by ALPS Distributors, Inc. (“ALPS”). The Adviser is asubsidiary of Deutsche Bank AG, and is not affiliated with ALPS.
Investing involves risk, including the possible loss of principal. Bond investments are subject to interest rate, credit, liquidity and market risks to varying degrees. When interest rates rise, bond prices generally fall. Credit risk refers to the ability of an issuer to make timely payments of principal and interest. Foreign investing involves greater and different risks than investing in US companies, including currency fluctuations, less liquidity, less developed or less efficient trading markets, lack of comprehensive company information, political instability and differing auditing and legal standards. Emerging markets tend to be more volatile and less liquid than the markets of more mature economies, and generally have less diverse and less mature economic structures and less stable political systems than those of developed countries. The fund seeks to mitigate the potential negative impact of rising Treasury interest rates by taking short positions in U.S. Treasury notes or bonds, or futures relating to those instruments. These short positions are not intended to mitigate credit risk or other factors that may have a greater impact on performance than rising or falling interest rates. The short positions may limit the potential positive impact of falling interest rates and there is no guarantee that the short positions will completely eliminate the interest rate risk of the long positions. Investing in derivatives entails special risks relating to liquidity, leverage and credit that may reduce returns and/or increase volatility. Performance of the Fund may diverge from that of the Underlying Index due to operating expenses, transaction costs, cash flows, use of sampling strategies or operational inefficiencies. An investment in this fund should be considered only as a supplement to a complete investment program for those investors willing to accept the risks associated with that fund. See the prospectus for details.
Shares are not individually redeemable, and owners of Shares may acquire those Shares from the Fund, or tender such Shares for redemption to the Fund, inCreation Units only.
Deutsche Asset Management represents the asset management activities conducted by Deutsche Bank AG or any of its subsidiaries. DBX 2101 (6/17)
R-46991-1 (6/16)
Find out more at ETFMarketplace.com
A New Home for the Deutsche X-trackers FamilyDeutsche X-trackers Emerging Markets Bond - Interest Rate Hedged ETF (Bats: EMIH)Deutsche X-trackers High Yield Corporate Bond - Interest Rate Hedged ETF (Bats: HYIH)Deutsche X-trackers Investment Grade Bond - Interest Rate Hedged ETF (Bats: IGIH)
We are proud to welcome Deutsche Asset Management tothe Bats ETF Marketplacefor sector ETFs, with the technology sector dominating
the winners, with three of the top-performing funds, and averaging a return of 5.8%. The best performer was the SPDR S&P Semiconductor ETF (XSD|A-71), which was up 7.19% for the month, followed by the iShares North American Tech-Software ETF (IGV|A-60) and the First Trust Dow Jones Internet Index Fund (FDN|A-58), up 5.78% and 5.31%, respectively. On the other side of the coin, the basic materials sector averaged a return of -5.4%, dragged down by the worst-performing sector fund, the SPDR S&P Metals & Mining ETF (XME|A-71), which fell 10.57%. Financials and real estate funds claimed three of the top five spots in terms of flows, led by the Vanguard REIT ETF (VNQ|A-91), which pulled in $486 million, and the Financial Select Sector SPDR (XLF|A-94), which saw nearly $483 million in inflows. VNQ has been near the top of the inflows rankings for the past two months, and finally moved into the top spot, suggesting that real estate is currently of great interest to investors. Meanwhile, the Technology Select Sector SPDR (XLK|A-91) experienced outflows of $916.4 million during the month, the most of any sector fund.
May was mainly a positive month
BASIC MATERIALS CONS. CYCL. CONS. NON-CYCL. ENERGY FINANCIAL HEALTH CARE INDUSTRIAL REAL ESTATE TECH TELECOM UTILITIES
BROADXLB
-0.31%
BROADXLY
0.13%
BROADXLP
0.77%
BROADXLE
0.84%
BROADXLF
2.02%
BROADXLV
2.18%
BROADXLI
-0.45%
BROADIYR
2.33%
BROADXLK
4.93%
BROADIYZ
1.44%
BROADXLU
1.50%
MININGXME
-10.57%
HOMEBLDXHB
1.42%
FOODPBJ
-0.10%
EQUIPIEZ
-7.17%
BANKSKBWB2.78%
BIOTECHIBB
4.25%
DEFENSEPPA
1.37%
BROADVNQ
2.37%
INTERNETFDN
5.31%
BROADVOX
-0.03%
BROADVPU
1.59%
MEDIAPBS
0.54%
EXPLORXOP
-0.61%
BANK & INIAI
4.88%
MED DEVIHI
2.00%
TRANSPOIYT
-0.77%
SEMISXSD
7.19%
RETAILXRT
-4.35%
SERVICESIYG
2.43%
PHARMAIHE
3.78%
ENGINEERPKB
4.15%
SOFTWAREIGV
5.78%
LEISUREPEJ
-1.69%
EQUIPMENTXHE
1.19%
SERVICESIHF
-0.74%
Sector Performance MAY 2016
///////////////////////////////////////////////////////////////////////////////////////////////////////////////////////////////////////////////////////////////////////////
≤-5
.0-3
.0 ≤
-4.9
-1.0
≤-2
.9-0
.1 ≤
-0.9 0
0.1
≤ 0
.91.
0 ≤
2.9
3.0
≤ 4
.9≥
5.0
KEY:
+
Source: Bloomberg. Data from 4/30/2016-5/31/2016. ETFs chosen to represent each sector based on the most liquid ETF in each segment of the FactSet ETF Classification System.
-
IN REVIEW
| | | | | | | | | | | | | | | | | | | | | | | | | | | | | | | | | | | | | | | | | | | | | | | | | | | | | | | | | | | | | | | | | | |Top Outflows
| | | | | | | | | | | | | | | | | | | | | | | | | | | | | | | | | | | | | | | | | | | | | | | | | | | | | | | | | | | | | | | | | | | | | |Top InflowsTICKER FLOWS ($M) AUM ($M)
Vanguard REIT VNQ 486.0 31,398.4 Real Estate
Financial Select Sector SPDR XLF 482.9 17,113.2 Financials
iShares U.S. Real Estate IYR 361.2 4,526.1 Real Estate
Cons Staple Select Sector SPDR XLP 201.0 9,626.9 Cons. Non-Cycl.
iShares US Medical Devices IHI 188.2 1,140.6 Health Care
TICKER FLOWS ($M) AUM ($M)
Technology Select Sector SPDR XLK -916.4 12,427.5 Technology
Health Care Select Sector SPDR XLV -504.4 12,518.5 Health Care
Industrial Select Sector SPDR XLI -102.8 6,821.7 Industrials
iShares Nasdaq Biotechnology IBB -90.2 6,764.9 Health Care
Consumer Discr Select Sector SPDR XLY -78.4 10,375.3 Cons. Cyclicals
By Heather Bell

ADVERTISEMENT
Carefully consider the fund’s investment objectives, risk factors, and charges and expenses before investing. This and other information can be found in the fund’s prospectus, which may be obtained by calling 1-855-329-3837, or by viewing or downloading a prospectus from deutsche-etfs.com. Read the prospectus carefully before investing.
Deutsche X-trackers ETFs (“ETFs”) are managed by DBX Advisors LLC or (the “Adviser”), and distributed by ALPS Distributors, Inc. (“ALPS”). The Adviser is asubsidiary of Deutsche Bank AG, and is not affiliated with ALPS.
Investing involves risk, including the possible loss of principal. Bond investments are subject to interest rate, credit, liquidity and market risks to varying degrees. When interest rates rise, bond prices generally fall. Credit risk refers to the ability of an issuer to make timely payments of principal and interest. Foreign investing involves greater and different risks than investing in US companies, including currency fluctuations, less liquidity, less developed or less efficient trading markets, lack of comprehensive company information, political instability and differing auditing and legal standards. Emerging markets tend to be more volatile and less liquid than the markets of more mature economies, and generally have less diverse and less mature economic structures and less stable political systems than those of developed countries. The fund seeks to mitigate the potential negative impact of rising Treasury interest rates by taking short positions in U.S. Treasury notes or bonds, or futures relating to those instruments. These short positions are not intended to mitigate credit risk or other factors that may have a greater impact on performance than rising or falling interest rates. The short positions may limit the potential positive impact of falling interest rates and there is no guarantee that the short positions will completely eliminate the interest rate risk of the long positions. Investing in derivatives entails special risks relating to liquidity, leverage and credit that may reduce returns and/or increase volatility. Performance of the Fund may diverge from that of the Underlying Index due to operating expenses, transaction costs, cash flows, use of sampling strategies or operational inefficiencies. An investment in this fund should be considered only as a supplement to a complete investment program for those investors willing to accept the risks associated with that fund. See the prospectus for details.
Shares are not individually redeemable, and owners of Shares may acquire those Shares from the Fund, or tender such Shares for redemption to the Fund, inCreation Units only.
Deutsche Asset Management represents the asset management activities conducted by Deutsche Bank AG or any of its subsidiaries. DBX 2101 (6/17)
R-46991-1 (6/16)
Find out more at ETFMarketplace.com
A New Home for the Deutsche X-trackers FamilyDeutsche X-trackers Emerging Markets Bond - Interest Rate Hedged ETF (Bats: EMIH)Deutsche X-trackers High Yield Corporate Bond - Interest Rate Hedged ETF (Bats: HYIH)Deutsche X-trackers Investment Grade Bond - Interest Rate Hedged ETF (Bats: IGIH)
We are proud to welcome Deutsche Asset Management tothe Bats ETF Marketplace
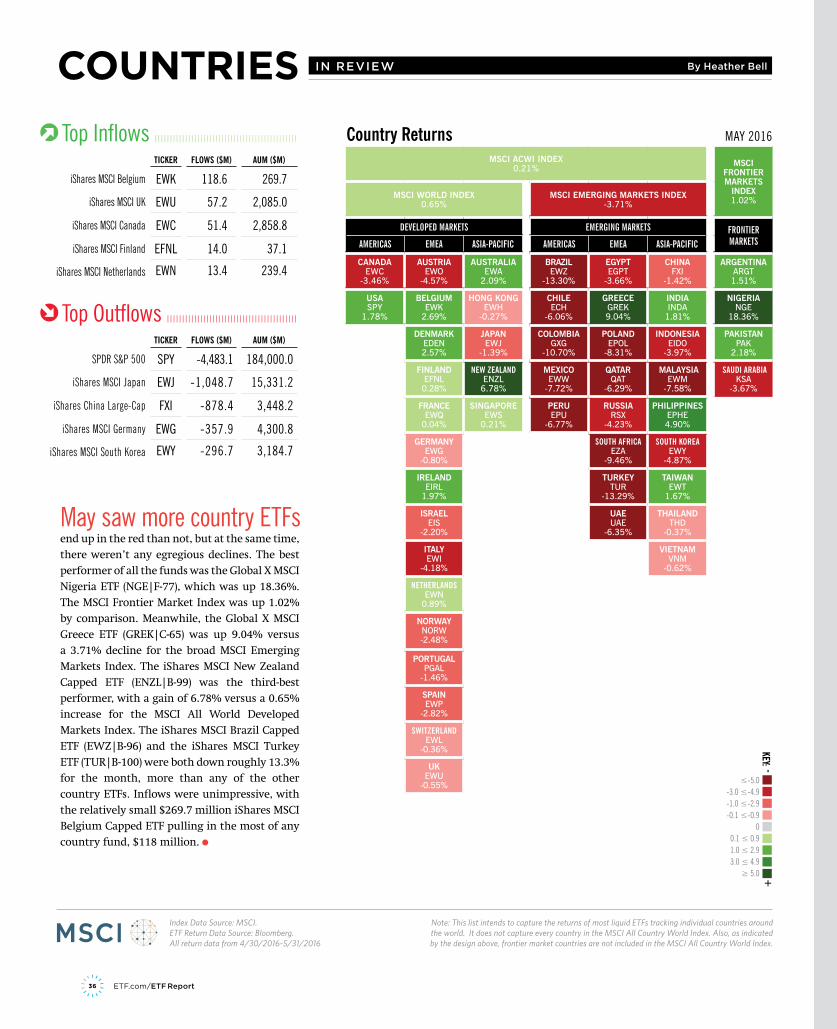
36 ETF.com/ETF Report
COUNTRIES IN REVIEW By Heather Bell
end up in the red than not, but at the same time, there weren’t any egregious declines. The best performer of all the funds was the Global X MSCI Nigeria ETF (NGE|F-77), which was up 18.36%. The MSCI Frontier Market Index was up 1.02% by comparison. Meanwhile, the Global X MSCI Greece ETF (GREK|C-65) was up 9.04% versus a 3.71% decline for the broad MSCI Emerging Markets Index. The iShares MSCI New Zealand Capped ETF (ENZL|B-99) was the third-best performer, with a gain of 6.78% versus a 0.65% increase for the MSCI All World Developed Markets Index. The iShares MSCI Brazil Capped ETF (EWZ|B-96) and the iShares MSCI Turkey ETF (TUR|B-100) were both down roughly 13.3% for the month, more than any of the other country ETFs. Inflows were unimpressive, with the relatively small $269.7 million iShares MSCI Belgium Capped ETF pulling in the most of any country fund, $118 million.
May saw more country ETFs
MSCI ACWI INDEX 0.21%
MSCI FRONTIER MARKETS
INDEX 1.02%
MSCI WORLD INDEX 0.65%
MSCI EMERGING MARKETS INDEX -3.71%
DEVELOPED MARKETS EMERGING MARKETS FRONTIER MARKETSAMERICAS EMEA ASIA-PACIFIC AMERICAS EMEA ASIA-PACIFIC
CANADAEWC
-3.46%
AUSTRIAEWO
-4.57%
AUSTRALIAEWA
2.09%
BRAZIL EWZ
-13.30%
EGYPTEGPT
-3.66%
CHINA FXI
-1.42%
ARGENTINA ARGT 1.51%
USA SPY
1.78%
BELGIUM EWK
2.69%
HONG KONG EWH
-0.27%
CHILE ECH
-6.06%
GREECE GREK 9.04%
INDIA INDA
1.81%
NIGERIA NGE
18.36%
DENMARK EDEN 2.57%
JAPAN EWJ
-1.39%
COLOMBIA GXG
-10.70%
POLAND EPOL
-8.31%
INDONESIA EIDO
-3.97%
PAKISTAN PAK
2.18%
FINLAND EFNL0.28%
NEW ZEALAND ENZL6.78%
MEXICOEWW
-7.72%
QATARQAT
-6.29%
MALAYSIA EWM
-7.58%
SAUDI ARABIA KSA
-3.67%
FRANCE EWQ
0.04%
SINGAPORE EWS
0.21%
PERUEPU
-6.77%
RUSSIA RSX
-4.23%
PHILIPPINES EPHE 4.90%
GERMANY EWG
-0.80%
SOUTH AFRICA EZA
-9.46%
SOUTH KOREA EWY
-4.87%
IRELAND EIRL
1.97%
TURKEYTUR
-13.29%
TAIWAN EWT
1.67%
ISRAELEIS
-2.20%
UAE UAE
-6.35%
THAILAND THD
-0.37%
ITALY EWI
-4.18%
VIETNAM VNM
-0.62%
NETHERLANDS EWN
0.89%
NORWAY NORW -2.48%
PORTUGAL PGAL
-1.46%
SPAIN EWP
-2.82%
SWITZERLAND EWL
-0.36%
UK EWU
-0.55%
Country Returns MAY 2016
Note: This list intends to capture the returns of most liquid ETFs tracking individual countries around the world. It does not capture every country in the MSCI All Country World Index. Also, as indicated by the design above, frontier market countries are not included in the MSCI All Country World Index.
Index Data Source: MSCI.ETF Return Data Source: Bloomberg.All return data from 4/30/2016-5/31/2016
≤-5.0-3.0 ≤-4.9-1.0 ≤-2.9-0.1 ≤-0.9
00.1 ≤ 0.91.0 ≤ 2.93.0 ≤ 4.9
≥ 5.0
KEY:
+-
Top Inflows | | | | | | | | | | | | | | | | | | | | | | | | | | | | | | | | | | | | | | | | | | | | | | |TICKER FLOWS ($M) AUM ($M)
iShares MSCI Belgium EWK 118.6 269.7
iShares MSCI UK EWU 57.2 2,085.0
iShares MSCI Canada EWC 51.4 2,858.8
iShares MSCI Finland EFNL 14.0 37.1
iShares MSCI Netherlands EWN 13.4 239.4
Top Outflows | | | | | | | | | | | | | | | | | | | | | | | | | | | | | | | | | | | | | | | | | | |TICKER FLOWS ($M) AUM ($M)
SPDR S&P 500 SPY -4,483.1 184,000.0
iShares MSCI Japan EWJ -1,048.7 15,331.2
iShares China Large-Cap FXI -878.4 3,448.2
iShares MSCI Germany EWG -357.9 4,300.8
iShares MSCI South Korea EWY -296.7 3,184.7
ADVERTISEMENT
HOW DO YOU DEFINE YOUR BORDERS?
A single, fully integrated approach with no gaps or overlaps, across developed markets around
the world, excluding the U.S. and Canada
LEARN MORE AT MSCI.COM/INDEXES
MSCI DELIVERS
THE MODERN INDEX STRATEGYYou cannot invest in an index. MSCI does not sponsor, recommend or endorse any ETFs or other products or trading strategies tracking any MSCI index. © 2016 MSCI Inc. All rights reserved.
MSCI EAFE
8.75x10.75inch-MSCI-EAFE-Ad-en.indd 1 07/06/2016 16:21
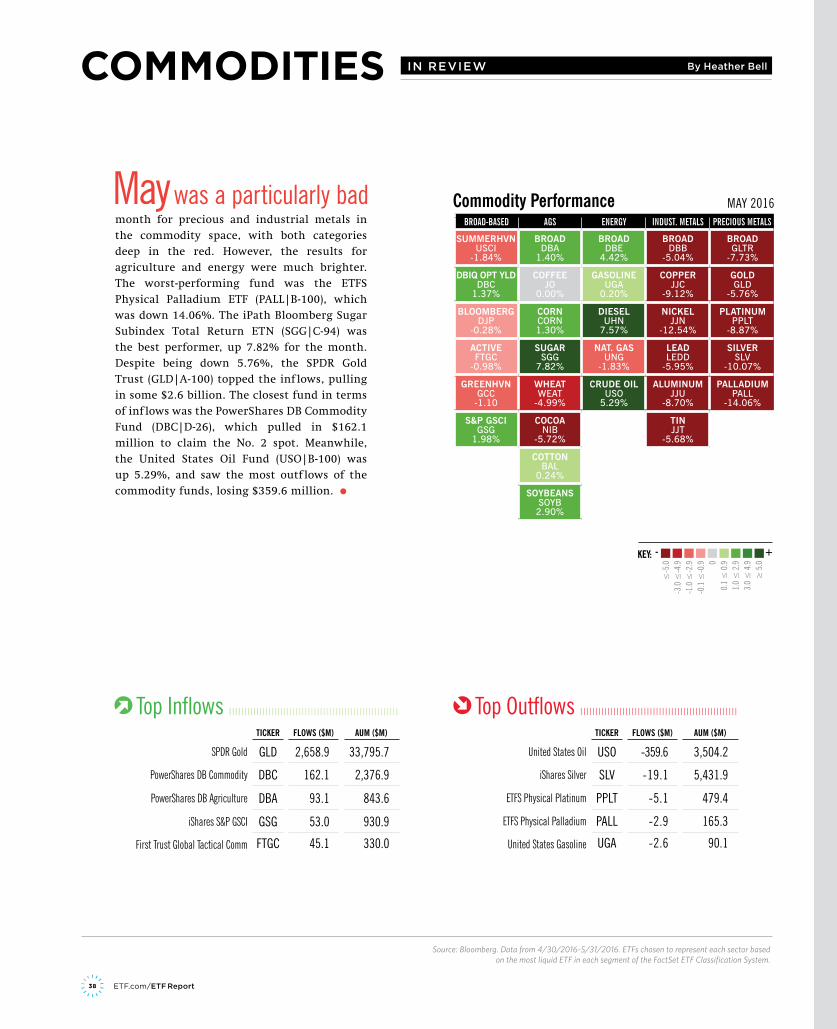
38 ETF.com/ETF Report
COMMODITIES IN REVIEW By Heather Bell
month for precious and industrial metals in the commodity space, with both categories deep in the red. However, the results for agriculture and energy were much brighter. The worst-performing fund was the ETFS Physical Palladium ETF (PALL|B-100), which was down 14.06%. The iPath Bloomberg Sugar Subindex Total Return ETN (SGG|C-94) was the best performer, up 7.82% for the month. Despite being down 5.76%, the SPDR Gold Trust (GLD|A-100) topped the inf lows, pulling in some $2.6 billion. The closest fund in terms of inf lows was the PowerShares DB Commodity Fund (DBC|D-26), which pulled in $162.1 million to claim the No. 2 spot. Meanwhile, the United States Oil Fund (USO|B-100) was up 5.29%, and saw the most outf lows of the commodity funds, losing $359.6 million.
May was a particularly badBROAD-BASED AGS ENERGY INDUST. METALS PRECIOUS METALS
SUMMERHVNUSCI
-1.84%
BROADDBA
1.40%
BROADDBE
4.42%
BROADDBB
-5.04%
BROADGLTR
-7.73%
DBIQ OPT YLDDBC
1.37%
COFFEEJO
0.00%
GASOLINE UGA
0.20%
COPPER JJC
-9.12%
GOLDGLD
-5.76%
BLOOMBERGDJP
-0.28%
CORN CORN 1.30%
DIESEL UHN
7.57%
NICKEL JJN
-12.54%
PLATINUM PPLT
-8.87%
ACTIVEFTGC
-0.98%
SUGAR SGG
7.82%
NAT. GAS UNG
-1.83%
LEAD LEDD
-5.95%
SILVER SLV
-10.07%
GREENHVNGCC-1.10
WHEAT WEAT
-4.99%
CRUDE OIL USO
5.29%
ALUMINUM JJU
-8.70%
PALLADIUMPALL
-14.06%
S&P GSCIGSG
1.98%
COCOA NIB
-5.72%
TIN JJT
-5.68%
COTTON BAL
0.24%
SOYBEANS SOYB 2.90%
Commodity Performance MAY 2016
Source: Bloomberg. Data from 4/30/2016-5/31/2016. ETFs chosen to represent each sector based on the most liquid ETF in each segment of the FactSet ETF Classification System.
≤-5
.0-3
.0 ≤
-4.9
-1.0
≤-2
.9-0
.1 ≤
-0.9 0
0.1
≤ 0
.91.
0 ≤
2.9
3.0
≤ 4
.9≥
5.0
KEY:
+-
Top Inflows | | | | | | | | | | | | | | | | | | | | | | | | | | | | | | | | | | | | | | | | | | | | | | | | | | | | | | | |TICKER FLOWS ($M) AUM ($M)
SPDR Gold GLD 2,658.9 33,795.7
PowerShares DB Commodity DBC 162.1 2,376.9
PowerShares DB Agriculture DBA 93.1 843.6
iShares S&P GSCI GSG 53.0 930.9
First Trust Global Tactical Comm FTGC 45.1 330.0
Top Outflows | | | | | | | | | | | | | | | | | | | | | | | | | | | | | | | | | | | | | | | | | | | | | | | | | | | |TICKER FLOWS ($M) AUM ($M)
United States Oil USO -359.6 3,504.2
iShares Silver SLV -19.1 5,431.9
ETFS Physical Platinum PPLT -5.1 479.4
ETFS Physical Palladium PALL -2.9 165.3
United States Gasoline UGA -2.6 90.1

ADVERTISEMENT
To obtain a copy of the prospectus, call 1-800-920-0259 or to download a copy, visit http://www.unitedstatescommodityindexfund.com/prospectus-usci.php or write to ALPS Distributors, Inc., 1290 Broadway, Suite 1100, Denver, CO 80203.Fund distributed by ALPS Distributors, Inc.Commodities and futures generally are volatile and are not suitable for all investors. The fund is speculative and involves a high degree of risk. An investor may lose all or substantially all of an investment in USCI. Funds that focus on a single sector generally experience greater volatility. USCI and its design mark, service mark and trademark are owned by United States Commodity Funds LLC.
C
M
Y
CM
MY
CY
CMY
K
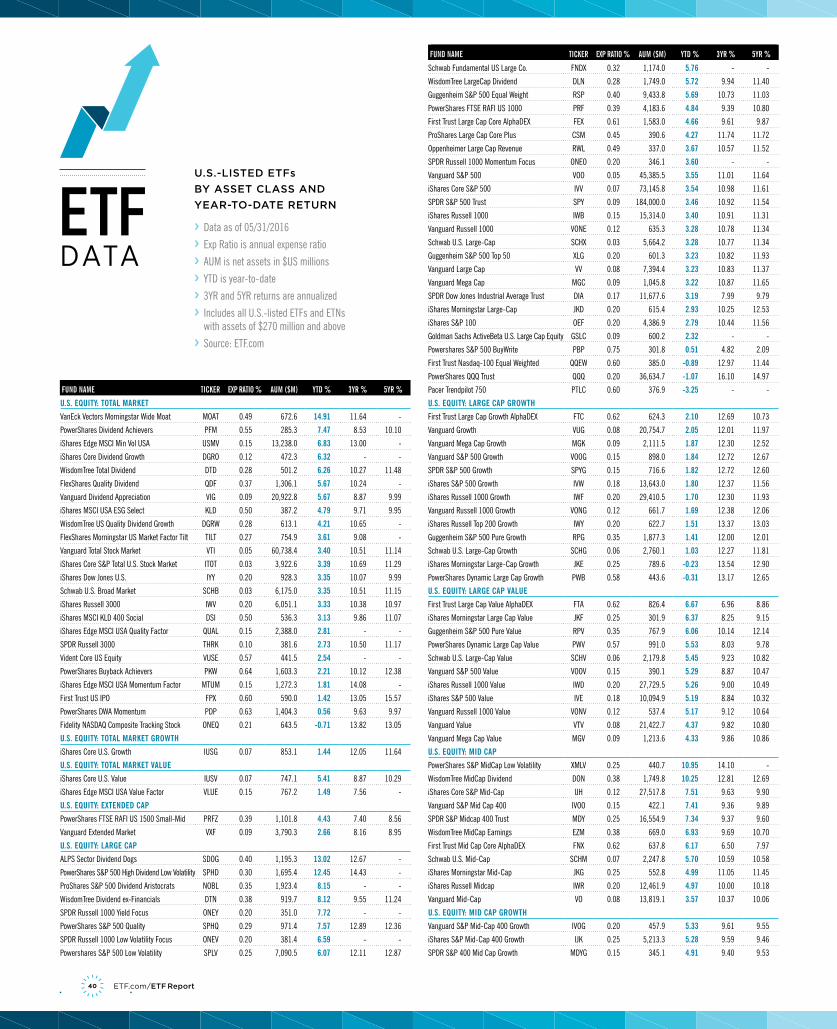
40 ETF.com/ETF Report
U.S. EQUITY: TOTAL MARKET
VanEck Vectors Morningstar Wide Moat MOAT 0.49 672.6 14.91 11.64 -
PowerShares Dividend Achievers PFM 0.55 285.3 7.47 8.53 10.10
iShares Edge MSCI Min Vol USA USMV 0.15 13,238.0 6.83 13.00 -
iShares Core Dividend Growth DGRO 0.12 472.3 6.32 - -
WisdomTree Total Dividend DTD 0.28 501.2 6.26 10.27 11.48
FlexShares Quality Dividend QDF 0.37 1,306.1 5.67 10.24 -
Vanguard Dividend Appreciation VIG 0.09 20,922.8 5.67 8.87 9.99
iShares MSCI USA ESG Select KLD 0.50 387.2 4.79 9.71 9.95
WisdomTree US Quality Dividend Growth DGRW 0.28 613.1 4.21 10.65 -
FlexShares Morningstar US Market Factor Tilt TILT 0.27 754.9 3.61 9.08 -
Vanguard Total Stock Market VTI 0.05 60,738.4 3.40 10.51 11.14
iShares Core S&P Total U.S. Stock Market ITOT 0.03 3,922.6 3.39 10.69 11.29
iShares Dow Jones U.S. IYY 0.20 928.3 3.35 10.07 9.99
Schwab U.S. Broad Market SCHB 0.03 6,175.0 3.35 10.51 11.15
iShares Russell 3000 IWV 0.20 6,051.1 3.33 10.38 10.97
iShares MSCI KLD 400 Social DSI 0.50 536.3 3.13 9.86 11.07
iShares Edge MSCI USA Quality Factor QUAL 0.15 2,388.0 2.81 - -
SPDR Russell 3000 THRK 0.10 381.6 2.73 10.50 11.17
Vident Core US Equity VUSE 0.57 441.5 2.54 - -
PowerShares Buyback Achievers PKW 0.64 1,603.3 2.21 10.12 12.38
iShares Edge MSCI USA Momentum Factor MTUM 0.15 1,272.3 1.81 14.08 -
First Trust US IPO FPX 0.60 590.0 1.42 13.05 15.57
PowerShares DWA Momentum PDP 0.63 1,404.3 0.56 9.63 9.97
Fidelity NASDAQ Composite Tracking Stock ONEQ 0.21 643.5 -0.71 13.82 13.05
U.S. EQUITY: TOTAL MARKET GROWTH
iShares Core U.S. Growth IUSG 0.07 853.1 1.44 12.05 11.64
U.S. EQUITY: TOTAL MARKET VALUE
iShares Core U.S. Value IUSV 0.07 747.1 5.41 8.87 10.29
iShares Edge MSCI USA Value Factor VLUE 0.15 767.2 1.49 7.56 -
U.S. EQUITY: EXTENDED CAP
PowerShares FTSE RAFI US 1500 Small-Mid PRFZ 0.39 1,101.8 4.43 7.40 8.56
Vanguard Extended Market VXF 0.09 3,790.3 2.66 8.16 8.95
U.S. EQUITY: LARGE CAP
ALPS Sector Dividend Dogs SDOG 0.40 1,195.3 13.02 12.67 -
PowerShares S&P 500 High Dividend Low Volatility SPHD 0.30 1,695.4 12.45 14.43 -
ProShares S&P 500 Dividend Aristocrats NOBL 0.35 1,923.4 8.15 - -
WisdomTree Dividend ex-Financials DTN 0.38 919.7 8.12 9.55 11.24
SPDR Russell 1000 Yield Focus ONEY 0.20 351.0 7.72 - -
PowerShares S&P 500 Quality SPHQ 0.29 971.4 7.57 12.89 12.36
SPDR Russell 1000 Low Volatility Focus ONEV 0.20 381.4 6.59 - -
Powershares S&P 500 Low Volatility SPLV 0.25 7,090.5 6.07 12.11 12.87
Schwab Fundamental US Large Co. FNDX 0.32 1,174.0 5.76 - -
WisdomTree LargeCap Dividend DLN 0.28 1,749.0 5.72 9.94 11.40
Guggenheim S&P 500 Equal Weight RSP 0.40 9,433.8 5.69 10.73 11.03
PowerShares FTSE RAFI US 1000 PRF 0.39 4,183.6 4.84 9.39 10.80
First Trust Large Cap Core AlphaDEX FEX 0.61 1,583.0 4.66 9.61 9.87
ProShares Large Cap Core Plus CSM 0.45 390.6 4.27 11.74 11.72
Oppenheimer Large Cap Revenue RWL 0.49 337.0 3.67 10.57 11.52
SPDR Russell 1000 Momentum Focus ONEO 0.20 346.1 3.60 - -
Vanguard S&P 500 VOO 0.05 45,385.5 3.55 11.01 11.64
iShares Core S&P 500 IVV 0.07 73,145.8 3.54 10.98 11.61
SPDR S&P 500 Trust SPY 0.09 184,000.0 3.46 10.92 11.54
iShares Russell 1000 IWB 0.15 15,314.0 3.40 10.91 11.31
Vanguard Russell 1000 VONE 0.12 635.3 3.28 10.78 11.34
Schwab U.S. Large-Cap SCHX 0.03 5,664.2 3.28 10.77 11.34
Guggenheim S&P 500 Top 50 XLG 0.20 601.3 3.23 10.82 11.93
Vanguard Large Cap VV 0.08 7,394.4 3.23 10.83 11.37
Vanguard Mega Cap MGC 0.09 1,045.8 3.22 10.87 11.65
SPDR Dow Jones Industrial Average Trust DIA 0.17 11,677.6 3.19 7.99 9.79
iShares Morningstar Large-Cap JKD 0.20 615.4 2.93 10.25 12.53
iShares S&P 100 OEF 0.20 4,386.9 2.79 10.44 11.56
Goldman Sachs ActiveBeta U.S. Large Cap Equity GSLC 0.09 600.2 2.32 - -
Powershares S&P 500 BuyWrite PBP 0.75 301.8 0.51 4.82 2.09
First Trust Nasdaq-100 Equal Weighted QQEW 0.60 385.0 -0.89 12.97 11.44
PowerShares QQQ Trust QQQ 0.20 36,634.7 -1.07 16.10 14.97
Pacer Trendpilot 750 PTLC 0.60 376.9 -3.25 - -
U.S. EQUITY: LARGE CAP GROWTH
First Trust Large Cap Growth AlphaDEX FTC 0.62 624.3 2.10 12.69 10.73
Vanguard Growth VUG 0.08 20,754.7 2.05 12.01 11.97
Vanguard Mega Cap Growth MGK 0.09 2,111.5 1.87 12.30 12.52
Vanguard S&P 500 Growth VOOG 0.15 898.0 1.84 12.72 12.67
SPDR S&P 500 Growth SPYG 0.15 716.6 1.82 12.72 12.60
iShares S&P 500 Growth IVW 0.18 13,643.0 1.80 12.37 11.56
iShares Russell 1000 Growth IWF 0.20 29,410.5 1.70 12.30 11.93
Vanguard Russell 1000 Growth VONG 0.12 661.7 1.69 12.38 12.06
iShares Russell Top 200 Growth IWY 0.20 622.7 1.51 13.37 13.03
Guggenheim S&P 500 Pure Growth RPG 0.35 1,877.3 1.41 12.00 12.01
Schwab U.S. Large-Cap Growth SCHG 0.06 2,760.1 1.03 12.27 11.81
iShares Morningstar Large-Cap Growth JKE 0.25 789.6 -0.23 13.54 12.90
PowerShares Dynamic Large Cap Growth PWB 0.58 443.6 -0.31 13.17 12.65
U.S. EQUITY: LARGE CAP VALUE
First Trust Large Cap Value AlphaDEX FTA 0.62 826.4 6.67 6.96 8.86
iShares Morningstar Large Cap Value JKF 0.25 301.9 6.37 8.25 9.15
Guggenheim S&P 500 Pure Value RPV 0.35 767.9 6.06 10.14 12.14
PowerShares Dynamic Large Cap Value PWV 0.57 991.0 5.53 8.03 9.78
Schwab U.S. Large-Cap Value SCHV 0.06 2,179.8 5.45 9.23 10.82
Vanguard S&P 500 Value VOOV 0.15 390.1 5.29 8.87 10.47
iShares Russell 1000 Value IWD 0.20 27,729.5 5.26 9.00 10.49
iShares S&P 500 Value IVE 0.18 10,094.9 5.19 8.84 10.32
Vanguard Russell 1000 Value VONV 0.12 537.4 5.17 9.12 10.64
Vanguard Value VTV 0.08 21,422.7 4.37 9.82 10.80
Vanguard Mega Cap Value MGV 0.09 1,213.6 4.33 9.86 10.86
U.S. EQUITY: MID CAP
PowerShares S&P MidCap Low Volatility XMLV 0.25 440.7 10.95 14.10 -
WisdomTree MidCap Dividend DON 0.38 1,749.8 10.25 12.81 12.69
iShares Core S&P Mid-Cap IJH 0.12 27,517.8 7.51 9.63 9.90
Vanguard S&P Mid Cap 400 IVOO 0.15 422.1 7.41 9.36 9.89
SPDR S&P Midcap 400 Trust MDY 0.25 16,554.9 7.34 9.37 9.60
WisdomTree MidCap Earnings EZM 0.38 669.0 6.93 9.69 10.70
First Trust Mid Cap Core AlphaDEX FNX 0.62 637.8 6.17 6.50 7.97
Schwab U.S. Mid-Cap SCHM 0.07 2,247.8 5.70 10.59 10.58
iShares Morningstar Mid-Cap JKG 0.25 552.8 4.99 11.05 11.45
iShares Russell Midcap IWR 0.20 12,461.9 4.97 10.00 10.18
Vanguard Mid-Cap VO 0.08 13,819.1 3.57 10.37 10.06
U.S. EQUITY: MID CAP GROWTH
Vanguard S&P Mid-Cap 400 Growth IVOG 0.20 457.9 5.33 9.61 9.55
iShares S&P Mid-Cap 400 Growth IJK 0.25 5,213.3 5.28 9.59 9.46
SPDR S&P 400 Mid Cap Growth MDYG 0.15 345.1 4.91 9.40 9.53
FUND NAME TICKER EXP RATIO % AUM ($M) YTD % 3YR % 5YR %
U.S.-LISTED ETFs BY ASSET CLASS AND YEAR-TO-DATE RETURN
› Data as of 05/31/2016› Exp Ratio is annual expense ratio› AUM is net assets in $US millions› YTD is year-to-date› 3YR and 5YR returns are annualized› Includes all U.S.-listed ETFs and ETNs
with assets of $270 million and above› Source: ETF.com
ETFDATA
FUND NAME TICKER EXP RATIO % AUM ($M) YTD % 3YR % 5YR %

41JULY 2016
Vanguard Mid Cap Growth VOT 0.08 3,305.4 3.05 9.96 8.98
iShares Russell Mid-Cap Growth IWP 0.25 6,120.7 2.16 9.89 9.44
Guggenheim S&P Midcap 400 Pure Growth RFG 0.35 622.2 0.03 6.57 7.48
U.S. EQUITY: MID CAP VALUE
Vanguard S&P Mid Cap 400 Value IVOV 0.20 365.8 9.84 9.36 10.26
iShares S&P Mid-Cap 400 Value IJJ 0.25 4,534.0 9.58 9.30 10.10
iShares Russell Mid-Cap Value IWS 0.25 7,321.6 7.88 10.02 10.73
Vanguard Mid Cap Value VOE 0.08 4,823.7 4.22 10.69 11.02
U.S. EQUITY: SMALL CAP
WisdomTree SmallCap Dividend DES 0.38 1,319.1 8.71 9.29 11.02
PowerShares S&P SmallCap Low Volatility XSLV 0.25 395.9 8.02 12.92 -
Oppenheimer Small Cap Revenue RWJ 0.54 293.3 7.25 8.85 10.64
Schwab Fundamental US Small Co. FNDA 0.32 791.1 5.65 - -
SPDR S&P 600 Small Cap SLY 0.15 431.8 5.61 9.85 10.72
iShares Core S&P Small Cap IJR 0.12 17,995.3 5.53 9.93 10.61
Vanguard Small-Cap VB 0.08 12,595.0 4.78 8.49 9.40
WisdomTree SmallCap Earnings EES 0.38 380.6 4.71 7.01 9.09
First Trust Small Cap Core AlphaDEX FYX 0.63 414.0 4.65 5.53 8.05
Schwab U.S. Small-Cap SCHA 0.07 3,351.1 4.26 8.25 9.18
iShares Russell 2000 IWM 0.20 26,379.6 2.43 7.02 7.92
Vanguard Russell 2000 VTWO 0.15 589.8 2.31 6.99 7.88
U.S. EQUITY: SMALL CAP GROWTH
iShares S&P Small-Cap 600 Growth IJT 0.25 3,170.5 3.38 10.56 10.36
SPDR S&P 600 Small Cap Growth SLYG 0.15 667.4 3.30 10.51 10.45
Vanguard Small-Cap Growth VBK 0.08 4,392.7 1.92 6.94 7.72
iShares Russell 2000 Growth IWO 0.25 5,992.6 -0.88 7.87 8.31
U.S. EQUITY: SMALL CAP VALUE
SPDR S&P 600 Small Cap Value SLYV 0.15 479.5 8.03 9.12 10.77
iShares Morningstar Small Cap Value JKL 0.30 387.9 7.93 7.75 9.60
iShares S&P Small-Cap 600 Value IJS 0.25 3,645.1 7.86 8.96 10.68
Vanguard Small Cap Value VBR 0.08 6,828.9 7.19 9.72 10.42
iShares Russell 2000 Value IWN 0.25 5,818.9 5.82 6.00 7.42
U.S. EQUITY: MICRO CAP
iShares Micro-Cap IWC 0.60 711.5 -1.06 6.23 6.82
U.S. EQUITY: BASIC MATERIALS
SPDR S&P Metals & Mining XME 0.35 678.1 47.98 -14.80 -19.80
Vanguard Materials VAW 0.10 1,256.9 9.96 6.69 5.62
iShares U.S. Basic Materials IYM 0.45 510.5 9.18 4.11 0.94
Materials Select Sector SPDR XLB 0.14 2,684.5 8.48 7.47 5.66
U.S. EQUITY: CONSUMER CYCLICALS
iShares U.S. Home Construction ITB 0.45 1,411.9 1.94 4.62 15.90
Consumer Discretionary Select Sector SPDR XLY 0.14 10,375.3 1.80 13.81 16.15
Vanguard Consumer Discretionary VCR 0.10 1,807.1 1.35 12.46 15.12
iShares U.S. Consumer Services IYC 0.45 941.6 0.39 13.37 15.77
SPDR S&P Homebuilders XHB 0.35 1,469.3 0.16 3.92 13.37
First Trust Consumer Discretionary AlphaDEX FXD 0.63 1,826.3 0.11 8.13 9.53
SPDR S&P Retail XRT 0.35 653.5 -1.83 3.93 10.57
U.S. EQUITY: CONSUMER NON-CYCLICALS
First Trust Consumer Staples AlphaDEX FXG 0.62 2,480.1 5.88 16.36 13.95
Guggenheim S&P 500 Equal Weight Cons. Staples RHS 0.40 765.4 5.50 16.26 15.01
Vanguard Consumer Staples VDC 0.10 3,131.7 5.09 12.50 13.36
Consumer Staples Select Sector SPDR XLP 0.14 9,626.9 4.83 12.42 13.31
iShares U.S. Consumer Goods IYK 0.45 888.4 4.32 11.12 12.13
PowerShares Dynamic Food & Beverage PBJ 0.58 301.9 0.36 11.10 10.35
PowerShares DWA Consumer Staples Momentum PSL 0.60 289.8 -0.28 13.42 12.68
U.S. EQUITY: ENERGY
SPDR S&P Oil & Gas Exploration & Production XOP 0.35 2,062.7 17.86 -15.20 -9.21
First Trust North American Energy Infrastructure EMLP 0.95 1,163.9 16.76 4.00 -
Vanguard Energy VDE 0.10 3,777.4 12.78 -4.41 -1.65
Fidelity MSCI Energy FENY 0.12 423.2 12.00 - -
Global X MLP MLPA 0.45 276.0 11.82 -5.17 -
Energy Select Sector SPDR XLE 0.14 13,979.1 11.65 -3.72 -0.72
Barclays ETN+ Select MLP ETN ATMP 0.95 313.9 11.50 -3.52 -
iShares U.S. Energy IYE 0.45 1,243.5 11.38 -4.41 -1.25
Credit Suisse X-Links Cushing MLP Infrastr ETN MLPN 0.85 462.3 9.40 -7.34 -0.93
First Trust Energy AlphaDEX FXN 0.64 1,526.5 8.95 -11.31 -8.20
ETRACS Alerian MLP ETN AMU 0.80 441.8 8.77 -7.16 -
iShares U.S. Oil & Gas Exploration & Production IEO 0.45 420.4 7.72 -7.50 -3.52
Alerian MLP AMLP 0.85 8,156.8 7.07 -4.19 1.66
ETRACS Alerian MLP Infrastructure ETN MLPI 0.85 2,191.6 5.05 -7.10 -0.04
J.P. Morgan Alerian MLP ETN AMJ 0.85 3,599.8 4.28 -9.16 -1.49
iPath S&P MLP ETN IMLP 0.80 279.6 3.27 -9.22 -
U.S. EQUITY: FINANCIALS
SPDR S&P Insurance KIE 0.35 594.5 5.52 12.51 13.01
First Trust Financials AlphaDEX FXO 0.64 771.2 3.52 9.56 10.18
Vanguard Financials VFH 0.10 3,456.4 1.19 8.62 10.31
iShares U.S. Financials IYF 0.45 1,212.6 1.02 8.66 10.69
iShares U.S. Regional Banks IAT 0.45 428.4 0.50 9.00 9.87
Financial Select Sector SPDR XLF 0.14 17,113.2 0.20 8.13 10.42
SPDR S&P Regional Banking KRE 0.35 1,835.4 -0.20 10.14 11.99
SPDR S&P Bank KBE 0.35 2,332.0 -0.72 7.40 7.96
PowerShares KBW Bank KBWB 0.35 363.3 -2.30 7.25 -
iShares US Financial Services IYG 0.45 581.4 -2.41 7.69 10.68
U.S. EQUITY: HEALTH CARE
iShares U.S. Medical Devices IHI 0.45 1,140.6 7.10 19.30 14.56
iShares U.S. Healthcare Providers IHF 0.45 689.4 0.84 15.12 14.12
SPDR S&P Health Care Services XHS 0.35 282.4 -0.04 13.21 -
Health Care Select Sector SPDR XLV 0.14 12,518.5 -0.59 15.78 16.60
iShares U.S. Healthcare IYH 0.45 1,842.2 -1.06 15.18 16.31
Guggenheim S&P 500 Equal Weight Healthcare RYH 0.40 489.6 -1.51 17.48 16.41
Fidelity MSCI Health Care FHLC 0.12 617.5 -1.79 - -
Vanguard Health Care VHT 0.09 5,461.0 -1.79 15.82 16.49
First Trust Health Care AlphaDEX FXH 0.62 1,169.5 -3.33 13.35 14.02
PowerShares Dynamic Pharmaceuticals PJP 0.56 1,183.8 -7.47 18.36 21.11
iShares U.S. Pharmaceuticals IHE 0.45 637.1 -9.12 14.96 16.57
SPDR S&P Pharmaceuticals XPH 0.35 534.2 -14.92 13.26 14.78
First Trust NYSE Arca Biotechnology FBT 0.55 874.2 -15.51 17.43 16.56
SPDR S&P Biotech XBI 0.35 1,904.1 -17.21 17.00 18.86
iShares NASDAQ Biotechnology IBB 0.48 6,764.9 -17.26 16.08 20.89
U.S. EQUITY: INDUSTRIALS
iShares U.S. Industrials IYJ 0.45 755.0 6.73 10.49 10.70
Industrial Select Sector SPDR XLI 0.14 6,821.7 6.03 10.92 10.55
Vanguard Industrials VIS 0.10 2,136.9 5.84 10.58 10.76
iShares U.S. Aerospace & Defense ITA 0.44 762.7 5.20 16.81 15.57
iShares Transportation Average IYT 0.45 532.3 4.11 8.65 8.35
PowerShares Aerospace & Defense PPA 0.66 304.7 3.88 15.76 14.39
U.S. EQUITY: TECHNOLOGY
PowerShares S&P SmallCap Information Technology PSCT 0.29 376.6 7.49 16.33 12.32
VanEck Vectors Semiconductor SMH 0.35 291.2 6.79 15.98 -
iShares PHLX Semiconductor SOXX 0.47 432.0 6.03 15.89 11.22
Guggenheim S&P 500 Equal Weight Technology RYT 0.40 684.1 4.14 14.82 11.69
Technology Select Sector SPDR XLK 0.14 12,427.5 3.70 13.90 12.83
iShares North American Tech-Software IGV 0.47 738.1 3.09 15.82 10.80
iShares North American Tech IGM 0.47 812.5 2.23 14.90 13.06
Fidelity MSCI Information Technology FTEC 0.12 408.8 2.02 - -
Vanguard Information Technology VGT 0.10 8,577.1 1.95 14.41 12.43
iShares U.S. Technology IYW 0.45 2,374.5 1.37 13.46 11.17
First Trust Technology AlphaDEX FXL 0.63 486.4 1.04 10.98 6.53
SPDR Morgan Stanley Technology MTK 0.35 507.0 0.30 13.38 10.76
PowerShares NASDAQ Internet PNQI 0.60 279.5 -1.82 17.57 14.81
First Trust Dow Jones Internet FDN 0.54 3,167.3 -1.94 16.90 14.68
U.S. EQUITY: TELECOMMUNICATIONS
Vanguard Telecommunication Services VOX 0.10 1,455.4 10.71 10.00 8.66
iShares U.S. Telecommunications IYZ 0.45 693.2 10.47 8.47 5.44
U.S. EQUITY: UTILITIES
Vanguard Utilities VPU 0.10 2,308.9 14.85 13.16 12.02
iShares U.S. Utilities IDU 0.45 1,063.5 14.79 13.20 11.87
First Trust Utilities AlphaDEX FXU 0.66 1,681.5 14.72 11.88 8.29
Utilities Select Sector SPDR XLU 0.14 8,343.0 14.42 13.33 11.91
U.S. EQUITY: REAL ESTATE
iShares Mortgage Real Estate Capped REM 0.48 990.9 10.24 3.26 4.53
Vanguard REIT VNQ 0.12 31,398.4 6.13 10.19 10.21
First Trust S&P REIT FRI 0.48 282.8 5.90 9.59 9.67
iShares U.S. Real Estate IYR 0.45 4,526.1 5.47 8.66 8.66
FUND NAME TICKER EXP RATIO % AUM ($M) YTD % 3YR % 5YR % FUND NAME TICKER EXP RATIO % AUM ($M) YTD % 3YR % 5YR %
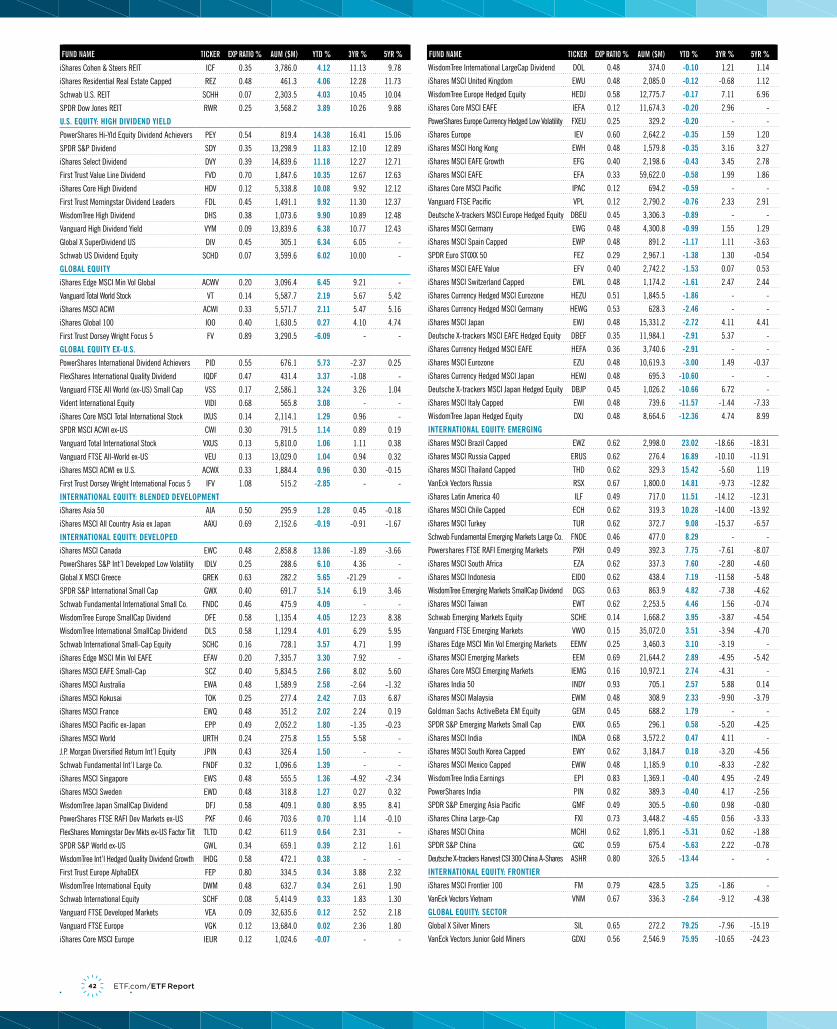
42 ETF.com/ETF Report
FUND NAME TICKER EXP RATIO % AUM ($M) YTD % 3YR % 5YR % FUND NAME TICKER EXP RATIO % AUM ($M) YTD % 3YR % 5YR %
iShares Cohen & Steers REIT ICF 0.35 3,786.0 4.12 11.13 9.78
iShares Residential Real Estate Capped REZ 0.48 461.3 4.06 12.28 11.73
Schwab U.S. REIT SCHH 0.07 2,303.5 4.03 10.45 10.04
SPDR Dow Jones REIT RWR 0.25 3,568.2 3.89 10.26 9.88
U.S. EQUITY: HIGH DIVIDEND YIELD
PowerShares Hi-Yld Equity Dividend Achievers PEY 0.54 819.4 14.38 16.41 15.06
SPDR S&P Dividend SDY 0.35 13,298.9 11.83 12.10 12.89
iShares Select Dividend DVY 0.39 14,839.6 11.18 12.27 12.71
First Trust Value Line Dividend FVD 0.70 1,847.6 10.35 12.67 12.63
iShares Core High Dividend HDV 0.12 5,338.8 10.08 9.92 12.12
First Trust Morningstar Dividend Leaders FDL 0.45 1,491.1 9.92 11.30 12.37
WisdomTree High Dividend DHS 0.38 1,073.6 9.90 10.89 12.48
Vanguard High Dividend Yield VYM 0.09 13,839.6 6.38 10.77 12.43
Global X SuperDividend US DIV 0.45 305.1 6.34 6.05 -
Schwab US Dividend Equity SCHD 0.07 3,599.6 6.02 10.00 -
GLOBAL EQUITY
iShares Edge MSCI Min Vol Global ACWV 0.20 3,096.4 6.45 9.21 -
Vanguard Total World Stock VT 0.14 5,587.7 2.19 5.67 5.42
iShares MSCI ACWI ACWI 0.33 5,571.7 2.11 5.47 5.16
iShares Global 100 IOO 0.40 1,630.5 0.27 4.10 4.74
First Trust Dorsey Wright Focus 5 FV 0.89 3,290.5 -6.09 - -
GLOBAL EQUITY EX-U.S.
PowerShares International Dividend Achievers PID 0.55 676.1 5.73 -2.37 0.25
FlexShares International Quality Dividend IQDF 0.47 431.4 3.37 -1.08 -
Vanguard FTSE All World (ex-US) Small Cap VSS 0.17 2,586.1 3.24 3.26 1.04
Vident International Equity VIDI 0.68 565.8 3.08 - -
iShares Core MSCI Total International Stock IXUS 0.14 2,114.1 1.29 0.96 -
SPDR MSCI ACWI ex-US CWI 0.30 791.5 1.14 0.89 0.19
Vanguard Total International Stock VXUS 0.13 5,810.0 1.06 1.11 0.38
Vanguard FTSE All-World ex-US VEU 0.13 13,029.0 1.04 0.94 0.32
iShares MSCI ACWI ex U.S. ACWX 0.33 1,884.4 0.96 0.30 -0.15
First Trust Dorsey Wright International Focus 5 IFV 1.08 515.2 -2.85 - -
INTERNATIONAL EQUITY: BLENDED DEVELOPMENT
iShares Asia 50 AIA 0.50 295.9 1.28 0.45 -0.18
iShares MSCI All Country Asia ex Japan AAXJ 0.69 2,152.6 -0.19 -0.91 -1.67
INTERNATIONAL EQUITY: DEVELOPED
iShares MSCI Canada EWC 0.48 2,858.8 13.86 -1.89 -3.66
PowerShares S&P Int’l Developed Low Volatility IDLV 0.25 288.6 6.10 4.36 -
Global X MSCI Greece GREK 0.63 282.2 5.65 -21.29 -
SPDR S&P International Small Cap GWX 0.40 691.7 5.14 6.19 3.46
Schwab Fundamental International Small Co. FNDC 0.46 475.9 4.09 - -
WisdomTree Europe SmallCap Dividend DFE 0.58 1,135.4 4.05 12.23 8.38
WisdomTree International SmallCap Dividend DLS 0.58 1,129.4 4.01 6.29 5.95
Schwab International Small-Cap Equity SCHC 0.16 728.1 3.57 4.71 1.99
iShares Edge MSCI Min Vol EAFE EFAV 0.20 7,335.7 3.30 7.92 -
iShares MSCI EAFE Small-Cap SCZ 0.40 5,834.5 2.66 8.02 5.60
iShares MSCI Australia EWA 0.48 1,589.9 2.58 -2.64 -1.32
iShares MSCI Kokusai TOK 0.25 277.4 2.42 7.03 6.87
iShares MSCI France EWQ 0.48 351.2 2.02 2.24 0.19
iShares MSCI Pacific ex-Japan EPP 0.49 2,052.2 1.80 -1.35 -0.23
iShares MSCI World URTH 0.24 275.8 1.55 5.58 -
J.P. Morgan Diversified Return Int’l Equity JPIN 0.43 326.4 1.50 - -
Schwab Fundamental Int’l Large Co. FNDF 0.32 1,096.6 1.39 - -
iShares MSCI Singapore EWS 0.48 555.5 1.36 -4.92 -2.34
iShares MSCI Sweden EWD 0.48 318.8 1.27 0.27 0.32
WisdomTree Japan SmallCap Dividend DFJ 0.58 409.1 0.80 8.95 8.41
PowerShares FTSE RAFI Dev Markets ex-US PXF 0.46 703.6 0.70 1.14 -0.10
FlexShares Morningstar Dev Mkts ex-US Factor Tilt TLTD 0.42 611.9 0.64 2.31 -
SPDR S&P World ex-US GWL 0.34 659.1 0.39 2.12 1.61
WisdomTree Int’l Hedged Quality Dividend Growth IHDG 0.58 472.1 0.38 - -
First Trust Europe AlphaDEX FEP 0.80 334.5 0.34 3.88 2.32
WisdomTree International Equity DWM 0.48 632.7 0.34 2.61 1.90
Schwab International Equity SCHF 0.08 5,414.9 0.33 1.83 1.30
Vanguard FTSE Developed Markets VEA 0.09 32,635.6 0.12 2.52 2.18
Vanguard FTSE Europe VGK 0.12 13,684.0 0.02 2.36 1.80
iShares Core MSCI Europe IEUR 0.12 1,024.6 -0.07 - -
WisdomTree International LargeCap Dividend DOL 0.48 374.0 -0.10 1.21 1.14
iShares MSCI United Kingdom EWU 0.48 2,085.0 -0.12 -0.68 1.12
WisdomTree Europe Hedged Equity HEDJ 0.58 12,775.7 -0.17 7.11 6.96
iShares Core MSCI EAFE IEFA 0.12 11,674.3 -0.20 2.96 -
PowerShares Europe Currency Hedged Low Volatility FXEU 0.25 329.2 -0.20 - -
iShares Europe IEV 0.60 2,642.2 -0.35 1.59 1.20
iShares MSCI Hong Kong EWH 0.48 1,579.8 -0.35 3.16 3.27
iShares MSCI EAFE Growth EFG 0.40 2,198.6 -0.43 3.45 2.78
iShares MSCI EAFE EFA 0.33 59,622.0 -0.58 1.99 1.86
iShares Core MSCI Pacific IPAC 0.12 694.2 -0.59 - -
Vanguard FTSE Pacific VPL 0.12 2,790.2 -0.76 2.33 2.91
Deutsche X-trackers MSCI Europe Hedged Equity DBEU 0.45 3,306.3 -0.89 - -
iShares MSCI Germany EWG 0.48 4,300.8 -0.99 1.55 1.29
iShares MSCI Spain Capped EWP 0.48 891.2 -1.17 1.11 -3.63
SPDR Euro STOXX 50 FEZ 0.29 2,967.1 -1.38 1.30 -0.54
iShares MSCI EAFE Value EFV 0.40 2,742.2 -1.53 0.07 0.53
iShares MSCI Switzerland Capped EWL 0.48 1,174.2 -1.61 2.47 2.44
iShares Currency Hedged MSCI Eurozone HEZU 0.51 1,845.5 -1.86 - -
iShares Currency Hedged MSCI Germany HEWG 0.53 628.3 -2.46 - -
iShares MSCI Japan EWJ 0.48 15,331.2 -2.72 4.11 4.41
Deutsche X-trackers MSCI EAFE Hedged Equity DBEF 0.35 11,984.1 -2.91 5.37 -
iShares Currency Hedged MSCI EAFE HEFA 0.36 3,740.6 -2.91 - -
iShares MSCI Eurozone EZU 0.48 10,619.3 -3.00 1.49 -0.37
iShares Currency Hedged MSCI Japan HEWJ 0.48 695.3 -10.60 - -
Deutsche X-trackers MSCI Japan Hedged Equity DBJP 0.45 1,026.2 -10.66 6.72 -
iShares MSCI Italy Capped EWI 0.48 739.6 -11.57 -1.44 -7.33
WisdomTree Japan Hedged Equity DXJ 0.48 8,664.6 -12.36 4.74 8.99
INTERNATIONAL EQUITY: EMERGING
iShares MSCI Brazil Capped EWZ 0.62 2,998.0 23.02 -18.66 -18.31
iShares MSCI Russia Capped ERUS 0.62 276.4 16.89 -10.10 -11.91
iShares MSCI Thailand Capped THD 0.62 329.3 15.42 -5.60 1.19
VanEck Vectors Russia RSX 0.67 1,800.0 14.81 -9.73 -12.82
iShares Latin America 40 ILF 0.49 717.0 11.51 -14.12 -12.31
iShares MSCI Chile Capped ECH 0.62 319.3 10.28 -14.00 -13.92
iShares MSCI Turkey TUR 0.62 372.7 9.08 -15.37 -6.57
Schwab Fundamental Emerging Markets Large Co. FNDE 0.46 477.0 8.29 - -
Powershares FTSE RAFI Emerging Markets PXH 0.49 392.3 7.75 -7.61 -8.07
iShares MSCI South Africa EZA 0.62 337.3 7.60 -2.80 -4.60
iShares MSCI Indonesia EIDO 0.62 438.4 7.19 -11.58 -5.48
WisdomTree Emerging Markets SmallCap Dividend DGS 0.63 863.9 4.82 -7.38 -4.62
iShares MSCI Taiwan EWT 0.62 2,253.5 4.46 1.56 -0.74
Schwab Emerging Markets Equity SCHE 0.14 1,668.2 3.95 -3.87 -4.54
Vanguard FTSE Emerging Markets VWO 0.15 35,072.0 3.51 -3.94 -4.70
iShares Edge MSCI Min Vol Emerging Markets EEMV 0.25 3,460.3 3.10 -3.19 -
iShares MSCI Emerging Markets EEM 0.69 21,644.2 2.89 -4.95 -5.42
iShares Core MSCI Emerging Markets IEMG 0.16 10,972.1 2.74 -4.31 -
iShares India 50 INDY 0.93 705.1 2.57 5.88 0.14
iShares MSCI Malaysia EWM 0.48 308.9 2.33 -9.90 -3.79
Goldman Sachs ActiveBeta EM Equity GEM 0.45 688.2 1.79 - -
SPDR S&P Emerging Markets Small Cap EWX 0.65 296.1 0.58 -5.20 -4.25
iShares MSCI India INDA 0.68 3,572.2 0.47 4.11 -
iShares MSCI South Korea Capped EWY 0.62 3,184.7 0.18 -3.20 -4.56
iShares MSCI Mexico Capped EWW 0.48 1,185.9 0.10 -8.33 -2.82
WisdomTree India Earnings EPI 0.83 1,369.1 -0.40 4.95 -2.49
PowerShares India PIN 0.82 389.3 -0.40 4.17 -2.56
SPDR S&P Emerging Asia Pacific GMF 0.49 305.5 -0.60 0.98 -0.80
iShares China Large-Cap FXI 0.73 3,448.2 -4.65 0.56 -3.33
iShares MSCI China MCHI 0.62 1,895.1 -5.31 0.62 -1.88
SPDR S&P China GXC 0.59 675.4 -5.63 2.22 -0.78
Deutsche X-trackers Harvest CSI 300 China A-Shares ASHR 0.80 326.5 -13.44 - -
INTERNATIONAL EQUITY: FRONTIER
iShares MSCI Frontier 100 FM 0.79 428.5 3.25 -1.86 -
VanEck Vectors Vietnam VNM 0.67 336.3 -2.64 -9.12 -4.38
GLOBAL EQUITY: SECTOR
Global X Silver Miners SIL 0.65 272.2 79.25 -7.96 -15.19
VanEck Vectors Junior Gold Miners GDXJ 0.56 2,546.9 75.95 -10.65 -24.23
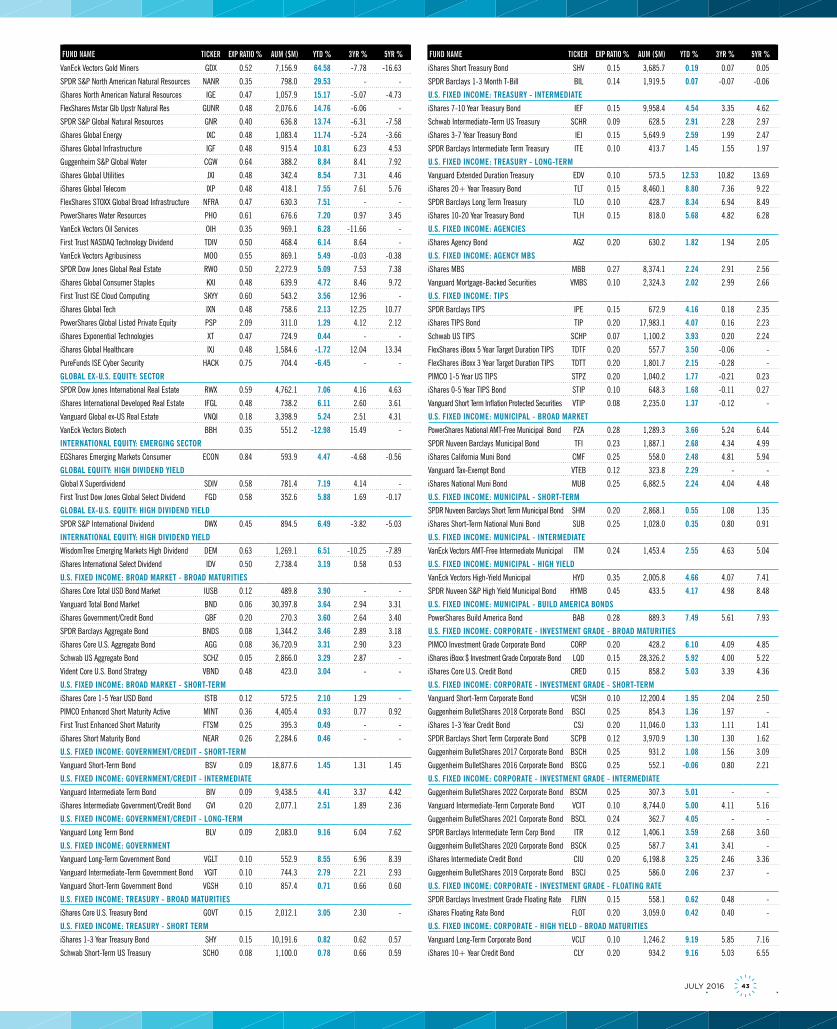
43JULY 2016
FUND NAME TICKER EXP RATIO % AUM ($M) YTD % 3YR % 5YR % FUND NAME TICKER EXP RATIO % AUM ($M) YTD % 3YR % 5YR %
VanEck Vectors Gold Miners GDX 0.52 7,156.9 64.58 -7.78 -16.63
SPDR S&P North American Natural Resources NANR 0.35 798.0 29.53 - -
iShares North American Natural Resources IGE 0.47 1,057.9 15.17 -5.07 -4.73
FlexShares Mstar Glb Upstr Natural Res GUNR 0.48 2,076.6 14.76 -6.06 -
SPDR S&P Global Natural Resources GNR 0.40 636.8 13.74 -6.31 -7.58
iShares Global Energy IXC 0.48 1,083.4 11.74 -5.24 -3.66
iShares Global Infrastructure IGF 0.48 915.4 10.81 6.23 4.53
Guggenheim S&P Global Water CGW 0.64 388.2 8.84 8.41 7.92
iShares Global Utilities JXI 0.48 342.4 8.54 7.31 4.46
iShares Global Telecom IXP 0.48 418.1 7.55 7.61 5.76
FlexShares STOXX Global Broad Infrastructure NFRA 0.47 630.3 7.51 - -
PowerShares Water Resources PHO 0.61 676.6 7.20 0.97 3.45
VanEck Vectors Oil Services OIH 0.35 969.1 6.28 -11.66 -
First Trust NASDAQ Technology Dividend TDIV 0.50 468.4 6.14 8.64 -
VanEck Vectors Agribusiness MOO 0.55 869.1 5.49 -0.03 -0.38
SPDR Dow Jones Global Real Estate RWO 0.50 2,272.9 5.09 7.53 7.38
iShares Global Consumer Staples KXI 0.48 639.9 4.72 8.46 9.72
First Trust ISE Cloud Computing SKYY 0.60 543.2 3.56 12.96 -
iShares Global Tech IXN 0.48 758.6 2.13 12.25 10.77
PowerShares Global Listed Private Equity PSP 2.09 311.0 1.29 4.12 2.12
iShares Exponential Technologies XT 0.47 724.9 0.44 - -
iShares Global Healthcare IXJ 0.48 1,584.6 -1.72 12.04 13.34
PureFunds ISE Cyber Security HACK 0.75 704.4 -6.45 - -
GLOBAL EX-U.S. EQUITY: SECTOR
SPDR Dow Jones International Real Estate RWX 0.59 4,762.1 7.06 4.16 4.63
iShares International Developed Real Estate IFGL 0.48 738.2 6.11 2.60 3.61
Vanguard Global ex-US Real Estate VNQI 0.18 3,398.9 5.24 2.51 4.31
VanEck Vectors Biotech BBH 0.35 551.2 -12.98 15.49 -
INTERNATIONAL EQUITY: EMERGING SECTOR
EGShares Emerging Markets Consumer ECON 0.84 593.9 4.47 -4.68 -0.56
GLOBAL EQUITY: HIGH DIVIDEND YIELD
Global X Superdividend SDIV 0.58 781.4 7.19 4.14 -
First Trust Dow Jones Global Select Dividend FGD 0.58 352.6 5.88 1.69 -0.17
GLOBAL EX-U.S. EQUITY: HIGH DIVIDEND YIELD
SPDR S&P International Dividend DWX 0.45 894.5 6.49 -3.82 -5.03
INTERNATIONAL EQUITY: HIGH DIVIDEND YIELD
WisdomTree Emerging Markets High Dividend DEM 0.63 1,269.1 6.51 -10.25 -7.89
iShares International Select Dividend IDV 0.50 2,738.4 3.19 0.58 0.53
U.S. FIXED INCOME: BROAD MARKET - BROAD MATURITIES
iShares Core Total USD Bond Market IUSB 0.12 489.8 3.90 - -
Vanguard Total Bond Market BND 0.06 30,397.8 3.64 2.94 3.31
iShares Government/Credit Bond GBF 0.20 270.3 3.60 2.64 3.40
SPDR Barclays Aggregate Bond BNDS 0.08 1,344.2 3.46 2.89 3.18
iShares Core U.S. Aggregate Bond AGG 0.08 36,720.9 3.31 2.90 3.23
Schwab US Aggregate Bond SCHZ 0.05 2,866.0 3.29 2.87 -
Vident Core U.S. Bond Strategy VBND 0.48 423.0 3.04 - -
U.S. FIXED INCOME: BROAD MARKET - SHORT-TERM
iShares Core 1-5 Year USD Bond ISTB 0.12 572.5 2.10 1.29 -
PIMCO Enhanced Short Maturity Active MINT 0.36 4,405.4 0.93 0.77 0.92
First Trust Enhanced Short Maturity FTSM 0.25 395.3 0.49 - -
iShares Short Maturity Bond NEAR 0.26 2,284.6 0.46 - -
U.S. FIXED INCOME: GOVERNMENT/CREDIT - SHORT-TERM
Vanguard Short-Term Bond BSV 0.09 18,877.6 1.45 1.31 1.45
U.S. FIXED INCOME: GOVERNMENT/CREDIT - INTERMEDIATE
Vanguard Intermediate Term Bond BIV 0.09 9,438.5 4.41 3.37 4.42
iShares Intermediate Government/Credit Bond GVI 0.20 2,077.1 2.51 1.89 2.36
U.S. FIXED INCOME: GOVERNMENT/CREDIT - LONG-TERM
Vanguard Long Term Bond BLV 0.09 2,083.0 9.16 6.04 7.62
U.S. FIXED INCOME: GOVERNMENT
Vanguard Long-Term Government Bond VGLT 0.10 552.9 8.55 6.96 8.39
Vanguard Intermediate-Term Government Bond VGIT 0.10 744.3 2.79 2.21 2.93
Vanguard Short-Term Government Bond VGSH 0.10 857.4 0.71 0.66 0.60
U.S. FIXED INCOME: TREASURY - BROAD MATURITIES
iShares Core U.S. Treasury Bond GOVT 0.15 2,012.1 3.05 2.30 -
U.S. FIXED INCOME: TREASURY - SHORT TERM
iShares 1-3 Year Treasury Bond SHY 0.15 10,191.6 0.82 0.62 0.57
Schwab Short-Term US Treasury SCHO 0.08 1,100.0 0.78 0.66 0.59
iShares Short Treasury Bond SHV 0.15 3,685.7 0.19 0.07 0.05
SPDR Barclays 1-3 Month T-Bill BIL 0.14 1,919.5 0.07 -0.07 -0.06
U.S. FIXED INCOME: TREASURY - INTERMEDIATE
iShares 7-10 Year Treasury Bond IEF 0.15 9,958.4 4.54 3.35 4.62
Schwab Intermediate-Term US Treasury SCHR 0.09 628.5 2.91 2.28 2.97
iShares 3-7 Year Treasury Bond IEI 0.15 5,649.9 2.59 1.99 2.47
SPDR Barclays Intermediate Term Treasury ITE 0.10 413.7 1.45 1.55 1.97
U.S. FIXED INCOME: TREASURY - LONG-TERM
Vanguard Extended Duration Treasury EDV 0.10 573.5 12.53 10.82 13.69
iShares 20+ Year Treasury Bond TLT 0.15 8,460.1 8.80 7.36 9.22
SPDR Barclays Long Term Treasury TLO 0.10 428.7 8.34 6.94 8.49
iShares 10-20 Year Treasury Bond TLH 0.15 818.0 5.68 4.82 6.28
U.S. FIXED INCOME: AGENCIES
iShares Agency Bond AGZ 0.20 630.2 1.82 1.94 2.05
U.S. FIXED INCOME: AGENCY MBS
iShares MBS MBB 0.27 8,374.1 2.24 2.91 2.56
Vanguard Mortgage-Backed Securities VMBS 0.10 2,324.3 2.02 2.99 2.66
U.S. FIXED INCOME: TIPS
SPDR Barclays TIPS IPE 0.15 672.9 4.16 0.18 2.35
iShares TIPS Bond TIP 0.20 17,983.1 4.07 0.16 2.23
Schwab US TIPS SCHP 0.07 1,100.2 3.93 0.20 2.24
FlexShares iBoxx 5 Year Target Duration TIPS TDTF 0.20 557.7 3.50 -0.06 -
FlexShares iBoxx 3 Year Target Duration TIPS TDTT 0.20 1,801.7 2.15 -0.28 -
PIMCO 1-5 Year US TIPS STPZ 0.20 1,040.2 1.77 -0.21 0.23
iShares 0-5 Year TIPS Bond STIP 0.10 648.3 1.68 -0.11 0.27
Vanguard Short Term Inflation Protected Securities VTIP 0.08 2,235.0 1.37 -0.12 -
U.S. FIXED INCOME: MUNICIPAL - BROAD MARKET
PowerShares National AMT-Free Municipal Bond PZA 0.28 1,289.3 3.66 5.24 6.44
SPDR Nuveen Barclays Municipal Bond TFI 0.23 1,887.1 2.68 4.34 4.99
iShares California Muni Bond CMF 0.25 558.0 2.48 4.81 5.94
Vanguard Tax-Exempt Bond VTEB 0.12 323.8 2.29 - -
iShares National Muni Bond MUB 0.25 6,882.5 2.24 4.04 4.48
U.S. FIXED INCOME: MUNICIPAL - SHORT-TERM
SPDR Nuveen Barclays Short Term Municipal Bond SHM 0.20 2,868.1 0.55 1.08 1.35
iShares Short-Term National Muni Bond SUB 0.25 1,028.0 0.35 0.80 0.91
U.S. FIXED INCOME: MUNICIPAL - INTERMEDIATE
VanEck Vectors AMT-Free Intermediate Municipal ITM 0.24 1,453.4 2.55 4.63 5.04
U.S. FIXED INCOME: MUNICIPAL - HIGH YIELD
VanEck Vectors High-Yield Municipal HYD 0.35 2,005.8 4.66 4.07 7.41
SPDR Nuveen S&P High Yield Municipal Bond HYMB 0.45 433.5 4.17 4.98 8.48
U.S. FIXED INCOME: MUNICIPAL - BUILD AMERICA BONDS
PowerShares Build America Bond BAB 0.28 889.3 7.49 5.61 7.93
U.S. FIXED INCOME: CORPORATE - INVESTMENT GRADE - BROAD MATURITIES
PIMCO Investment Grade Corporate Bond CORP 0.20 428.2 6.10 4.09 4.85
iShares iBoxx $ Investment Grade Corporate Bond LQD 0.15 28,326.2 5.92 4.00 5.22
iShares Core U.S. Credit Bond CRED 0.15 858.2 5.03 3.39 4.36
U.S. FIXED INCOME: CORPORATE - INVESTMENT GRADE - SHORT-TERM
Vanguard Short-Term Corporate Bond VCSH 0.10 12,200.4 1.95 2.04 2.50
Guggenheim BulletShares 2018 Corporate Bond BSCI 0.25 854.3 1.36 1.97 -
iShares 1-3 Year Credit Bond CSJ 0.20 11,046.0 1.33 1.11 1.41
SPDR Barclays Short Term Corporate Bond SCPB 0.12 3,970.9 1.30 1.30 1.62
Guggenheim BulletShares 2017 Corporate Bond BSCH 0.25 931.2 1.08 1.56 3.09
Guggenheim BulletShares 2016 Corporate Bond BSCG 0.25 552.1 -0.06 0.80 2.21
U.S. FIXED INCOME: CORPORATE - INVESTMENT GRADE - INTERMEDIATE
Guggenheim BulletShares 2022 Corporate Bond BSCM 0.25 307.3 5.01 - -
Vanguard Intermediate-Term Corporate Bond VCIT 0.10 8,744.0 5.00 4.11 5.16
Guggenheim BulletShares 2021 Corporate Bond BSCL 0.24 362.7 4.05 - -
SPDR Barclays Intermediate Term Corp Bond ITR 0.12 1,406.1 3.59 2.68 3.60
Guggenheim BulletShares 2020 Corporate Bond BSCK 0.25 587.7 3.41 3.41 -
iShares Intermediate Credit Bond CIU 0.20 6,198.8 3.25 2.46 3.36
Guggenheim BulletShares 2019 Corporate Bond BSCJ 0.25 586.0 2.06 2.37 -
U.S. FIXED INCOME: CORPORATE - INVESTMENT GRADE - FLOATING RATE
SPDR Barclays Investment Grade Floating Rate FLRN 0.15 558.1 0.62 0.48 -
iShares Floating Rate Bond FLOT 0.20 3,059.0 0.42 0.40 -
U.S. FIXED INCOME: CORPORATE - HIGH YIELD - BROAD MATURITIES
Vanguard Long-Term Corporate Bond VCLT 0.10 1,246.2 9.19 5.85 7.16
iShares 10+ Year Credit Bond CLY 0.20 934.2 9.16 5.03 6.55

44 ETF.com/ETF Report
FUND NAME TICKER EXP RATIO % AUM ($M) YTD % 3YR % 5YR % FUND NAME TICKER EXP RATIO % AUM ($M) YTD % 3YR % 5YR %
Powershares Fundamental HiYld Corporate Bond PHB 0.50 840.8 6.16 2.67 4.27
SPDR Barclays High Yield Bond JNK 0.40 12,268.9 6.14 1.23 3.59
iShares iBoxx $ High Yield Corporate Bond HYG 0.50 15,058.8 5.79 2.13 4.23
U.S. FIXED INCOME: CORPORATE - HIGH YIELD - SHORT-TERM
PIMCO 0-5 Year High Yield Corporate Bond HYS 0.55 1,948.5 6.76 2.00 -
Guggenheim BulletShares 2018 HiYld Corp Bond BSJI 0.44 689.7 6.23 2.13 -
SPDR Barclays Short Term High Yield Bond SJNK 0.40 2,961.9 5.96 0.53 -
iShares 0-5 Year High Yield Corporate Bond SHYG 0.30 880.0 5.21 - -
Guggenheim Bulletshares 2017 HiYld Corp Bond BSJH 0.43 710.3 4.66 2.73 -
Guggenheim BulletShares 2016 HiYld Corp Bond BSJG 0.44 568.7 0.79 2.54 -
U.S. FIXED INCOME: CORPORATE - HIGH YIELD - INTERMEDIATE
Guggenheim BulletShares 2019 HiYld Corp Bond BSJJ 0.43 349.1 5.60 - -
U.S. FIXED INCOME: CORPORATE - CONVERTIBLES
SPDR Barclays Convertible Securities CWB 0.40 2,250.9 2.24 6.20 6.10
U.S. FIXED INCOME: CORPORATE - LOANS
PowerShares Senior Loan BKLN 0.65 4,497.1 5.02 1.34 2.75
Highland iBoxx Senior Loan SNLN 0.55 355.3 4.44 1.41 -
U.S. FIXED INCOME: CORPORATE - PREFERRED STOCK
VanEck Vectors Pref Securities ex Financials PFXF 0.40 337.1 8.84 6.07 -
iShares U.S. Preferred Stock PFF 0.47 15,755.2 3.92 5.79 6.08
SPDR Wells Fargo Preferred Stock PSK 0.45 544.8 3.87 6.65 6.17
PowerShares Preferred PGX 0.50 4,078.8 3.58 7.31 7.44
PowerShares Financial Preferred PGF 0.63 1,669.1 3.41 7.37 7.24
GLOBAL FIXED INCOME
First Trust Tactical High Yield HYLS 1.23 892.0 4.30 3.58 -
First Trust Senior Loan FTSL 0.85 461.4 4.22 2.34 -
RiverFront Strategic Income RIGS 0.11 322.5 4.14 - -
First Trust Preferred Securities & Income FPE 0.86 864.4 3.47 4.22 -
SPDR Blackstone / GSO Senior Loan SRLN 0.70 779.7 3.24 1.56 -
SPDR DoubleLine Total Return Tactical TOTL 0.55 2,433.5 2.78 - -
PIMCO Total Return Active BOND 0.57 2,559.7 2.16 2.85 -
Guggenheim Enhanced Short Duration GSY 0.30 710.0 0.75 1.07 1.11
INTERNATIONAL FIXED INCOME: BLENDED DEVELOPMENT
SPDR Barclays International Treasury Bond BWX 0.50 1,441.9 6.66 -0.38 -0.61
SPDR Citi Intl Govt Inflation-Protected Bond WIP 0.50 598.1 5.66 -2.40 -0.59
Vanguard Total International Bond BNDX 0.15 5,176.3 3.85 - -
INTERNATIONAL FIXED INCOME: DEVELOPED
iShares International Treasury Bond IGOV 0.35 722.3 7.67 0.06 -0.38
PowerShares Variable Rate Preferred VRP 0.50 649.6 3.74 - -
INTERNATIONAL FIXED INCOME: EMERGING
VanEck Vectors Emerging Markets HiYld Bond HYEM 0.40 289.2 8.02 2.59 -
VanEck Vectors J.P. Morgan EM Local Currency Bond EMLC 0.47 1,466.4 7.02 -6.72 -3.46
iShares JP Morgan USD Emerging Markets Bond EMB 0.40 6,457.4 6.57 3.49 5.05
Powershares Emerging Markets Sovereign Debt PCY 0.50 3,128.6 6.30 4.41 5.99
WisdomTree Emerging Markets Local Debt ELD 0.55 367.8 6.25 -6.81 -3.73
Vanguard Emerging Markets Government Bond VWOB 0.34 695.8 6.24 - -
iShares Emerging Markets Local Currency Bond LEMB 0.50 363.7 5.20 -4.31 -
COMMODITIES: BROAD MARKET
iShares Commodities Select Strategy COMT 0.48 294.2 12.40 - -
PowerShares DB Commodity Tracking DBC 0.85 2,376.9 10.10 -17.16 -13.45
PowerShares DB Opt Yld Div Commodity Strategy PDBC 0.60 378.5 9.48 - -
iPath Bloomberg Commodity ETN DJP 0.70 830.7 9.41 -15.06 -14.16
iShares S&P GSCI Commodity Trust GSG 0.48 930.9 8.36 -20.63 -15.75
First Trust Global Tactical Commodity Strategy FTGC 0.95 330.0 3.59 - -
United States Commodity USCI 0.92 566.0 2.62 -9.15 -9.30
COMMODITIES: AGRICULTURE
PowerShares DB Agriculture DBA 0.75 843.6 3.40 -5.80 -8.24
COMMODITIES: ENERGY
United States Oil USO 0.74 3,504.2 7.91 -28.63 -21.80
iPath S&P GSCI Crude Oil ETN OIL 0.75 883.7 3.21 -32.92 -24.85
PowerShares DB Oil DBO 0.62 486.8 0.11 -29.08 -21.70
United States Natural Gas UNG 1.01 529.4 -20.53 -31.40 -31.98
COMMODITIES: PRECIOUS METALS
ETFS Physical Silver SIVR 0.30 300.0 15.53 -10.66 -16.41
iShares Silver Trust SLV 0.50 5,431.9 15.16 -10.86 -16.60
iShares Gold Trust IAU 0.25 7,720.5 14.57 -4.52 -4.81
SPDR Gold Trust GLD 0.40 33,795.7 14.39 -4.67 -4.96
ETFS Physical Swiss Gold SGOL 0.39 961.3 14.39 -4.63 -4.95
ETFS Physical Platinum PPLT 0.60 479.4 9.62 -12.94 -12.35
ASSET ALLOCATION
First Trust Multi-Asset Diversified Income MDIV 0.68 812.4 7.78 2.76 -
PowerShares CEF Income Composite PCEF 1.94 617.4 6.79 3.51 4.58
Guggenheim Multi-Asset Income CVY 0.83 443.9 5.89 -2.40 2.62
iShares Core Moderate Allocation AOM 0.23 489.0 3.37 4.15 4.65
iShares Core Conservative Allocation AOK 0.24 271.4 3.31 3.38 4.03
iShares Core Growth Allocation AOR 0.22 728.9 2.87 5.39 6.00
iShares Core Aggressive Allocation AOA 0.20 429.0 2.71 6.41 6.96
WBI Tactical Income WBII 1.05 401.1 1.59 - -
ALTERNATIVES: ABSOLUTE RETURN
IQ Hedge Multi-Strategy Tracker QAI 0.91 1,084.3 1.76 1.62 1.92
ALTERNATIVES: TACTICAL TOOLS
iPath S&P 500 VIX Short-Term Futures ETN VXX 0.89 1,507.0 -32.49 -43.87 -47.57
ProShares VIX Short-Term Futures VIXY 0.84 276.7 -32.63 -44.23 -47.82
LEVERAGED
Direxion Daily Junior Gold Miners Bull 3X JNUG 1.01 277.3 247.34 - -
Direxion Daily Gold Miners Bull 3x NUGT 1.03 1,218.1 200.95 -59.74 -66.40
ProShares Ultra Silver AGQ 0.88 293.2 28.36 -26.77 -39.13
Direxion Daily Energy Bull 3x ERX 1.00 565.8 23.30 -24.80 -18.28
ETRACS Monthly Pay 2xLev Mortgage REIT ETN MORL 0.80 283.3 12.89 3.59 -
Deutsche Bank FI Enhanced Global HiYld ETN FIEG 1.75 345.7 11.16 - -
Barclays ETN+FI Enhanced Global HiYld ETN FIGY 0.76 1,383.8 10.66 10.17 -
ProShares UltraPro S&P500 UPRO 0.95 689.5 6.64 26.84 26.54
Direxion Daily S&P 500 Bull 3x SPXL 0.96 482.0 6.42 26.36 24.73
ProShares Ultra S&P 500 SSO 0.89 1,499.5 5.38 19.28 19.86
ProShares Ultra Bloomberg Crude Oil UCO 0.87 929.3 2.79 -54.69 -44.85
Credit Suisse FI Large Cap Growth Enhanced ETN FLGE 1.52 662.7 2.18 - -
UBS AG FI Enhanced Large Cap Growth ETN FBGX 1.52 881.5 2.10 - -
Direxion Daily Small Cap Bull 3x TNA 0.98 719.4 0.99 10.55 8.15
ProShares Ultra Financials UYG 0.95 691.2 -0.14 14.46 16.80
Direxion Daily Financial Bull 3x FAS 0.96 1,216.7 -2.37 19.16 19.30
Barclays ETN+FI Enhanced Europe 50 ETN FEEU 0.76 673.5 -3.23 -1.10 -
Credit Suisse FI Enhanced Europe 50 ETN FIEU 0.80 299.8 -4.10 - -
ProShares Ultra QQQ QLD 0.95 869.6 -4.25 29.86 26.78
VelocityShares 3x Long Crude Oil ETN UWTI 1.35 1,041.3 -7.85 -75.87 -
ProShares UltraPro QQQ TQQQ 0.95 1,163.5 -8.52 42.63 36.51
ProShares Ultra NASDAQ Biotechnology BIB 0.95 483.7 -35.21 23.87 35.61
VelocityShares 3X Long Natural Gas ETN UGAZ 1.65 315.3 -59.08 -80.54 -
VelocityShares Daily 2x VIX Short-Term ETN TVIX 1.65 426.6 -61.34 -79.50 -83.35
ProShares Ultra VIX Short-Term Futures UVXY 1.32 875.1 -61.73 -79.59 -
INVERSE
VelocityShares Daily Inverse VIX Short-Term ETN XIV 1.35 989.6 23.06 12.30 11.05
ProShares Short VIX Short-Term Futures SVXY 1.28 510.4 22.74 12.04 -
ProShares Short QQQ PSQ 0.95 465.8 -0.73 -16.73 -16.52
ProShares UltraShort QQQ QID 0.95 392.0 -2.69 -31.80 -31.85
Powershares DB US Dollar Bullish UUP 0.74 854.1 -3.16 3.19 3.09
ProShares Short Dow30 DOG 0.95 346.1 -4.29 -9.63 -11.61
ProShares Short Russell2000 RWM 0.95 552.9 -4.41 -10.26 -12.57
ProShares Short S&P500 SH 0.90 3,013.4 -4.50 -12.04 -13.18
ProShares UltraShort Euro EUO 0.90 396.3 -5.05 7.74 7.23
ProShares Short MSCI Emerging Markets EUM 0.95 301.3 -5.74 -0.69 -1.15
ProShares UltraPro Short QQQ SQQQ 0.95 536.3 -5.79 -45.53 -46.02
ProShares Short 20+ Year Treasury TBF 0.95 635.1 -8.77 -9.57 -11.57
ProShares UltraShort S&P500 SDS 0.91 2,167.2 -9.33 -23.32 -25.83
Direxion Daily Financial Bear 3X FAZ 0.98 355.2 -13.26 -35.33 -44.45
ProShares UltraPro Short S&P500 SPXU 0.93 820.6 -14.92 -34.38 -38.25
Direxion Daily S&P 500 Bear 3X SPXS 0.98 496.3 -15.43 -35.40 -38.82
ProShares UltraShort 20+ Year Treasury TBT 0.93 2,117.0 -17.20 -18.81 -22.79
Direxion Daily Small Cap Bear 3x TZA 0.98 570.8 -17.40 -33.65 -41.29
Direxion Daily 20+ Year Treasury Bear 3x TMV 0.92 358.2 -25.80 -29.58 -35.22
VelocityShares 3X Inverse Crude Oil ETN DWTI 1.35 363.4 -62.89 16.91 -
Direxion Daily Gold Miners Bear 3x DUST 0.97 407.0 -89.71 -65.02 -38.00
T H E M A R K E T P L A C E
Institutional manager offering 20+ years of experience in dynamic portfolio risk management, global tactical asset allocation strategies
and designing flexible investment solutions for advisors and clients.
Want to reach Advisors and RIAs who use ETFs in their practice?
POST YOUR AD IN THE ETF REPORT MARKETPLACE!
Contact Kevin Kelly, Director of sales @ 646.582.9040 to learn more.
Accuvest manages country-focused ETF solutions to help institutions and advisors effectively navigate
the complexities of global equity markets.
Providing our worth by building yoursWe combine Experience, Performance and Unequaled Client
Service to bring you the greatest benefit of all,Peace of Mind.
The Bridge Between Protection and Growth®
We deliver asset class strategies using ETFs; our objective rule sets strive to target 80% of the asset classes’ upside while working to have only 40% of the drawdown.
Contact UsRoger Scheffel, Portfolio Manager
[email protected] | wstcm.com
Global clients...Global Portfolios
925.930.2882 | [email protected] | www.accuvest
Thomas S. Quealy, CEO | 716-633-3800 | [email protected]
Website: www.jaforlines.comPhone: (516) 609 3370Email: [email protected]
www.riverfrontig.comDoug [email protected] 804-549-4800
CLS believes in an outcome-based investing approach that brings global, Risk Budgeted strategies to investors - focusing on what investors can control, not what they cannot.
888.455.4244 CLSinvest.com
AForlines Global offers 4 risk-adjusted Global Tactical
strategies ranging from Income to Growth.
Our portfolios are used as the risk-managed core of a
client’s portfolio.
Call us to learn more.
RiverFront Investment Group is a global asset
manager utilizing a dynamic, tactical
investment approach with uncommon
transparency.
™
Contact Us Today www.sageadvisory.com | 512.327.5530
Reliable active investment management guided by a seasoned perspective.
ETF.com winner for best ETF Strategist
ADVERTISEMENT