wages and risk-taking in occupational credit unions ... · pdf filetheory and evidence ... we...
TRANSCRIPT

1 See Srinivasan and King(1998) for an overview ofcredit unions and a discussionof current issues surroundingcredit unions.
FEDERAL RESERVE BANK OF ST. LOU IS
13
MARCH/APR I L 1999
Wages andRisk-Taking In OccupationalCredit Unions:Theory andEvidenceWilliam R. Emmonsand Frank A. Schmid
Credit unions are regulated and insureddepository financial institutions dedi-cated to the saving, credit, and other
basic financial needs of selected groups ofconsumers.1 Previous research has tendedto suggest that credit unions operate ineffi-ciently. In particular, given widely dispersedownership and—in the case of employer-based or occupational credit unions—thepresence of one or more sponsors primarilyengaged in non-financial activities, thereare reasons to believe that a managerialagency problem may be important.
In this article, we present a simplemodel of an occupational credit union in which the manager wishes to engage in expense-preference behavior. Thesponsor must choose whether to acceptthis behavior and deduct the monetaryequivalent from the manager’s wage—whatwe call the Demsetz solution, as describedin Demsetz (1983)—or to offer higher, so-called efficiency wages to discourage it. We show how wage expenses and risk-taking by the credit union areintimately connected.
We simulate the theoretical model tobuild intuition about the relationshipamong credit union size, wages, and risk-taking. Then we provide empiricalevidence that supports a link between the
size of occupational credit unions and thelevels of wage expense and risk-taking. Inparticular, larger credit unions tend to havehigher wage expenses and take less risk.We also document an important role forexternal control mechanisms, namely, localdeposit-market competition. Wage expenseis higher and risk-taking is lower in creditunions that face a less competitive localdeposit market.
The article is organized as follows: Thefirst section reviews previous research oncredit unions. The second section presentsour simple model of a credit-union sponsorwho chooses both the compensation schemefor the credit-union manager and the amountof risky lending the credit union will do.This model nests both the Demsetz wageregime, in which the manager is allowed toshirk, that is, loaf on the job, but is paid alow wage, and an efficiency-wage regime,in which the manager is promised a highwage but is punished severely if caughtshirking. The third section presents anonstochastic simulation, comparative-sta-tics results, and testable hypotheses. Thesimulation illustrates that the optimalchoice of a compensation regime dependson the configuration of parameter valuesand exogenous variables that happen to exist.The fourth section contains a descriptionof our empirical methods and results. Thefinal section presents our conclusions. Anappendix provides details on the empiricalmethodology, the dataset, and the variableswe employ.
PREVIOUS RESEARCHON CREDIT UNIONS
It is useful to distinguish between twomain approaches taken in economic researchregarding credit unions. One approachfocuses on the legal structure of credit unionsas consumer-owned cooperatives andexplores how credit unions produce anddistribute financial services. We refer tothis branch of the literature as the structural
William R. Emmons is a research economist and Frank A. Schmid is a senior research economist at the Federal Reserve Bank of St. Louis.Robert Webb and Marcela Williams provided research assistance.

FEDERAL RESERVE BANK OF ST. LOU IS
14
MARCH/APR I L 1999
approach to credit unions. The otherapproach—and the one this article followsmost closely—focuses on the importantyet largely extralegal and unregulated relationship between the management of a credit union and its members andsponsor(s). We call this the agencyapproach to credit unions.
The Structural Approach to Credit Unions
Early theoretical research on U.S.credit unions in the structural traditionincludes Taylor (1971), Flannery (1974),Smith, Cargill, and Meyer (1981), andSmith (1984). These papers highlight animportant conflict of interest that arisesbetween members in determining the poli-cies of the credit union. Savers—memberswho have deposits in the credit union butinsignificant or no loans outstanding—want the highest possible deposit interestrate, while borrowers—members who haveborrowed a significant amount of moneyfrom the credit union relative to theirdeposits—prefer the lowest possible lendingrate. Clearly, these two objectives conflict.The question becomes, what policy will agiven credit union follow?
Empirical research on whether creditunions are in fact saver-dominated or bor-rower-dominated finds mixed results.Flannery (1974) finds a tendency towardborrower domination in U.S. credit unions(i.e., low borrowing rates), Patin and McNiel(1991) find evidence of saver domination(high deposit rates), while Smith (1986)finds no evidence of domination by eithergroup. One might surmise from thisinconclusive evidence that there is no gen-eral pattern among all credit unions withrespect to rate-setting policy, and hence,domination by either savers or borrowers.
More recent theoretical research in thestructural tradition includes Besley, Coate,and Loury (1993), who analyze memberincentives in rotating saving and creditassociations in developing countries; Hartand Moore (1996, 1998), who modelmember incentives and conflicts in stockexchanges and cooperatives more generally;
Banerjee, Besley, and Guinnane (1994), andEmmons and Mueller (1998), both of whomstudy member incentives in cooperativebanks in Germany; and Davis (1998), wholooks at the long-term sustainability of co-operative financial institutions. Althoughmodeling techniques have changed in recentyears, the basic issues investigated by newerresearch still revolve around the governanceand incentive structures implied by coopera-tive ownership of financial institutions.
Some recent empirical work in thestructural tradition examines the operatingefficiency of credit unions. Fried, Lovell, andVanden Eeckaut (1993) find evidence ofwidespread operating inefficiency amongcredit unions of about the same degree asfound by many other researchers studyingother types of depository financial institu-tions. Extending the work of Fried et. al.(1993), Fried, Lovell, and Yaisawarng(1998) find that credit-union mergers maybe effective in raising the performance ofunderperforming acquired institutions.
Emmons and Schmid (1999) adopt asomewhat different empirical approach tofocus on the role of common bonds in creditunions. Using a semi-parametric estimationtechnique like the one used in this article,they show that the smaller the potentialmembership group, the higher memberparticipation rates are in credit unions.These authors attribute the size-participa-tion rate relationship to the declining abilityof credit unions to satisfy member prefer-ences as member heterogeneity increases.This result may point toward agency prob-lems in credit unions that are aggravated asmember attachment to the credit uniondeclines, although they do not test for suchproblems explicitly.
The Agency Approach to Credit Unions
Credit unions have a comparativelyweak governance structure compared toshareholder-owned financial institutions in the sense that no private individual orsmall group of individuals has the financialincentive to intervene strongly to disciplinethe management when the credit union’s

FEDERAL RESERVE BANK OF ST. LOU IS
15
2 These circumstances stand instark contrast to those of astockholder-owned firm(although there is ample evi-dence that governance of mod-ern stock banks also is rife withinefficiencies). Individuals canassemble large and powerfulblocks of stock ownershipeither to exert control over theexisting management or to exe-cute a takeover and replace themanagement.
MARCH/APR I L 1999
policies or performance go astray (Rasmusen,1988, p. 397). This is because a one-person,one-vote governance structure quickly leadsto free-riding incentives as the number ofmembers increases. Reinforcing this tendencyof monitoring incentives to weaken in largercredit unions is the lack of a discipliningrole for takeovers since building a control-ling coalition of credit-union members maybe difficult.2
One implication of its weak governancestructure is likely to be that a credit union’smanagement becomes the de facto residualclaimant to the institution’s surplus. Thatis, even though a credit-union managercannot profit by paying excessive dividendsto large stockholders (including perhapshimself) or through gains on underpricedstock options, he may be able to convincethe board of directors to pay him a large salaryand grant him other nonwage perquisitesof control, such as a luxurious office, extrastaff, generous travel allowances, or simplya “quiet life.” Hence, agency problems maybe of the first order of importance in credit-union management and performance.
How can credit unions and other mutualfinancial institutions survive if they aresubject to potentially large managerialagency problems? Two reasonable expla-nations have been offered correspondingto the period before and after the introduc-tion of federal deposit insurance in theUnited States. Rasmusen (1988) suggeststhat mutual financial institutions thrivedin the pre-deposit insurance era preciselybecause the manager had substantial powerand discretion. An agency problem couldhelp mutual financial institutions to survivebecause any risk-averse manager with sub-stantial discretion could be expected tooperate in a very conservative manner topreserve his position, salary, and consumptionof perquisites. In contrast to stockholder-owned banks, whose managers are likelyto be large holders of the bank’s stock andthus more interested in gambling withdepositors’ funds, credit-union managershave no way of obtaining option-like pay-offs (i.e., pay-offs that are skewed towardlarge positive returns and protected againstnegative returns by limited liability). Rela-
tively poorly informed and highly risk-aversedepositors seeking a safe savings institutionwill find a mutual institution such as a creditunion quite attractive, according to Rasmusen.Even though the manager engages in pettymisappropriation of funds for his own use,he has a strong interest in avoiding riskyinvestments that might jeopardize his posi-tion. Thus, compared to a stockholder-ownedbank, a mutual bank would be preferredby uninformed and risk-averse depositorsand might survive even though it operatesinefficiently.
The advent of government regulation ofbanks and the creation of deposit insurancefor virtually all depository institutions elim-inates the advantage to risk-averse depositorsof a mutual bank compared to a stockholder-owned bank. In effect, the governmentassumes the risk borne previously by depos-itors, so the risk-taking of the bank is of no consequence to depositors. Depositorshave no reason to prefer a risk-averse man-ager, and in fact, they become risk-lovingif the safe return they are promised ishigher as a consequence of the risk. Thus,the expansion of credit unions in the post-deposit insurance era must be due tosomething besides depositors’ fear of bankrisk-taking.
Hansmann (1996, pp. 259-60)suggests that employer-sponsored creditunions continue to thrive today becauseemployers are willing to subsidize them:
Employers can also benefit fromhaving a credit union for theiremployees. The credit union tiesthe employees more tightly to theemployer, improves the employees’financial situation (and consequentlytheir effective wage), and helps keepthe employees out of financial dif-ficulties that may interfere withtheir work or create bother for theemployer (such as garnishment ofwages). For these reasons employershave often helped promote the formation of credit unions, forexample, by providing free officespace and free time off to theemployees who administer them.

FEDERAL RESERVE BANK OF ST. LOU IS
16
3 For an overview, see Milgromand Roberts (1992), or Ritterand Taylor (1997).
4 Demsetz (1983) claims thathis compensation schemeleaves both parties as well offas without shirking, thus elimi-nating the agency problem.This holds true if (and only if)the manager’s shirking causesa loss to the sponsor that isequal to the benefit it offers tothe manager. If the sponsor’sloss exceeds the manager’sbenefit, the costs of runningthe firm are higher than in theabsence of an agency problem.In the unlikely case that thesponsor’s loss from shirking islower than the manager’s bene-fit, the manager’s shirkingleads to a Pareto improvement.This case does not pose anagency problem, so we do notconsider it.
MARCH/APR I L 1999
Thus, a key feature of occupational creditunions today may be the willingness ofemployers to subsidize their existence.Note that the managerial agency problemis likely to persist because the sponsor maynot be well-suited (or motivated) to super-vising a banking business.
Empirical work following the agencyapproach to credit unions and other mutu-ally owned banks includes Akella andGreenbaum (1988), Mester (1989, 1991),Keating and Keating (1992), Schmid (1997),and Gorton and Schmid (forthcoming). Allof these papers (and many others) document“expense-preference behavior,” a positiverelationship between more diffused owner-ship of a financial institution and the levelof its expenses relative to those of institu-tions with more concentrated ownership.
We confirm the basic thrust of theseresults in our empirical investigationsbelow. We also find evidence that thedegree of local deposit-market competitionis linked to the extent of the agencyproblem we observe.
THE MODEL This section describes a model of an
occupational credit union that nests twocompeting hypotheses regarding the com-pensation of agents who can engage inopportunistic behavior. It also allows usto derive hypotheses concerning the risk-taking of the credit union. The model isbased on the costly-state verification para-digm introduced by Townsend (1979).The problem to be solved is one of conflictinginterests between the manager and thesponsor with respect to the manager’s con-sumption on the job, which we termexpense-preference behavior or “shirking.”We assume that the sponsor can observethe manager’s shirking but must wait for agovernment regulator to be able to proveit. An inspection occurs if (and only if)the credit union encounters financial distress.Although the regulator carries it out, aninspection adds to the operating costs ofthe credit union (as discussed below).
We consider two competing hypotheses.Demsetz (1983) suggests that firms may
accept shirking by the manager and subtractthe pecuniary equivalent of the expectedamount of shirking from the manager’smonetary compensation (wage). Themanager’s total compensation from the jobstill may be high enough to compete withother job offers.
The efficiency wage literature providesa competing hypothesis to describe howfirms deal with an agency problem.3 Inthese models, the principal (the sponsor)increases the agent’s (the manager’s)opportunity costs of shirking to a levelthat makes shirking disadvantageous tothe agent. This is accomplished byrandomly inspecting the manager’s perfor-mance and threatening to fire him if he iscaught shirking. It is important to notethat both the Demsetz pay structure andefficiency wage compensation are generallysecond-best solutions. That is, the totalcosts of running the firm are higher thanin the absence of an agency problem.4
We consider one sponsor, the set ofcredit-union employees, and many credit-union members in a one-period model.For simplicity, we represent all credit-unionemployees with one employee, whom we callthe manager. The sponsor and the managerare risk-neutral, while the members may beeither risk-neutral or risk-averse withoutchanging our results. In our model weassume that it is the sponsor who hiresand (possibly fires) the manager, sets hiswage, and defines the lending rulebook.Since, in reality, these decision rights residein the board of directors of the credit union,we implicitly assume that the sponsor is incontrol of (or in complete agreement with)the board. We also assume that the manageris compensated at the end of the period.This allows the sponsor to tie the manager’swage to his behavior in a one-period model.
We assume that the benefit the managerenjoys from shirking, G, is discrete and knownto the sponsor. We also assume that thesole purpose of the credit union is to makeloans. The task of the manager is to screenloan applicants according to the rulebook.The rulebook is public knowledge, whichimplies that the manager’s decisions onloan applications are transparent to the

FEDERAL RESERVE BANK OF ST. LOU IS
17
sponsor and the members. We assumethat the lending decisions are verifiablebefore the court at zero cost. This meansthat there is no agency problem betweenthe sponsor and the manager with respectto lending, allowing us to model thelending decisions as if the sponsor madethem himself.
We assume that the credit unioncannot cover its costs without receivingsubsidies from the sponsor, who is thusthe de facto residual claimant of the creditunion. For simplicity, we assume that thecredit union’s operating costs consist ofmanagement compensation and, in theevent of financial distress, the sponsor’scosts associated with inspection, C. Inaddition, if the manager shirks, the creditunion loses an amount, H, that correspondsto inflated expenses.
The sponsor enjoys a benefit from thecredit union’s lending that mirrors the pro-ductivity-enhancing effect this lending hason the sponsor’s employees. There are twokinds of loans. First, there are safe loans,such as those that are fully collateralized.The benefit the sponsor receives fromthese loans equals the lump-sum amountB. It is optimal for the sponsor to definethe lending rulebook such that all safeloans are made. These loans are riskless,so there are never any financial-distresscosts associated with them. Risky loansare the second type of lending done by thecredit union; these are less than fully col-lateralized loans. The sponsor attaches avalue, g, to each dollar of risky loan granted.We assume that additional lending alwaysincreases the total risk of the portfolio.This is because, for any given dollar amountof lending, L, the sponsor chooses the leastrisky loan portfolio. To increase lending,the credit union must take on lower-qualityloans, and hence, more risk.
The total risk of the loan portfolio causesthe credit union to become insolvent withsome probability, p. The probability of dis-tress is related to the risk of the creditunion’s loan portfolio by the cumulativenormal density function Φ(lnL) with lnLbeing the natural log of the amount of lendingand φ(lnL) denoting the corresponding
normal probability density function. Thehigher the risk, the more likely the creditunion will enter distress, in which case thecredit union is inspected by the regulatorwith certainty and the sponsor incurs costsof C.
Thus, in this model, the credit union’sfinancial distress has two implications. First,inspection by the regulator reveals the truestate of the credit union’s cost situation. Thismeans that the sponsor obtains legally ver-ifiable evidence if the manager has shirked.Second, the sponsor incurs costs, C. Thesecosts include the monetary equivalent ofthe damage to the sponsor’s reputation bothwithin and outside the firm, extra manage-rial and legal resources the sponsor has toallocate to the distressed credit union, andpayments made by the sponsor to assist inthe workout of the credit union.
The sponsor chooses between an effi-ciency-wage compensation scheme and aDemsetz-style compensation structure. Inany regime, total compensation must amountto at least Wa, where Wa is the manager’sreservation wage. The reservation wage isthe amount of compensation the managercan obtain in an alternative employment.
In the efficiency-wage regime, thesponsor can increase the manager’s oppor-tunity costs of shirking to the point thatthe manager becomes indifferent betweenshirking and not shirking. This is achievedby paying the manager a premium in addi-tion to his reservation wage such that hisbenefit from shirking, G, equals the expectedvalue of losing his job. The efficiency wage,We, is the sum of the reservation wage, Wa,and the wage premium, where We> Wa. Theexpected cost of losing the job is p 3 (We-Wa).Since we use a one-period model, losingthe job in an efficiency-wage framework isa metaphor for getting paid only the reser-vation wage Wa at the end of the period.The manager will shirk if (and only if) theexpected gain of expense preference behavior,G, is strictly greater than the expected lossfrom shirking, p 3 (We-Wa). In equilibrium,there is no shirking.
In the Demsetz compensation regime,there is shirking in equilibrium but there isno wage premium. Under the assumption
MARCH/APR I L 1999

FEDERAL RESERVE BANK OF ST. LOU IS
18
5 For instance, for γ =0.7,G=0.07, C>3.3, there is nopositive value for L that solvesthe maximization problem 1.For zero risky lending, the prob-ability of inspection is zero.Consequently, the sponsor doesnot pay a wage premium,which means that the efficiencywage model does not apply.
6 In the optimization problem 1, the first-order condition for theoptimal amount of lending readsφ(lnL) x (G/Φ(lnL)2 -C) + γ L= 0.
7 In the case that the probabilitydensity function φ(lnL) is tan-gent to γ L /(C-G/Φ(lnL)2),there is only a single value of L solving Equations 2a, b.
8 It can be shown easily that forL going to infinity, the value ofthe sponsor’s objective functionZE(L) approaches infinity. Also,except for the case where thesingle-peaked probability densityfunction φ(lnL) is tangent to γ L /(C-G/Φ(lnL)2), there are two intersection points.Consequently, the optimum forthe low value of L must be a(local) maximum while the onefor the high value of L must bea (local) minimum.
MARCH/APR I L 1999
that the manager’s benefit from shirking,G, is no greater than his reservation wageW a, the sum of nonpecuniary and pecuniarycompensation is the reservation wage inequilibrium. The sponsor has no reason topay the manager more than it takes to attracthim to this job.
The sponsor chooses the compensationscheme with the highest expected pay-off.If the sponsor’s expected pay-off is negative,his participation constraint is violated andthe credit union will not exist.
Thus, there are two considerationsbearing on the sponsor’s choice of compen-sation regime. First, if the sponsor switchesfrom an efficiency-wage compensation to a Demsetz solution, he saves the wage-pre-mium (W e-W a) but will face increasedoperating costs caused by shirking, H.Second, changing to a Demsetz wage mayaffect the sponsor’s expected pay-off bychanging the optimal amount of lending, L.A change in L affects the sponsor’s benefitfrom lending as well as the probability thathe will incur costs associated with the creditunion’s financial distress and inspection.
The Efficiency-Wage HypothesisIf the sponsor installs an efficiency-
wage compensation schedule, hemaximizes his expected pay-off, ZE, bysolving the following optimization problem:
(1a) Max. ZE = B - (W - W a) - W a - pC + g LlnL, W-W a
s.t.(1b)
(1c) p = Φ(lnL)
(1d) L ≤ Lp
(1e) L > 0 .
Condition 1b is the manager’s incentive-compatibility constraint. In equilibrium,this condition binds because the sponsordoes not pay more than it takes to makethe manager indifferent between shirkingand not shirking.
Depending on the values for the para-meter γ and the exogenous variables G, Cand Lp, the model’s solution may be one oftwo possible corner solutions or an interiorsolution. There also are strictly positivevectors (γ, G, C) for which there is no pos-itive amount of risky lending, L, that solvesthe model.5 In what follows, we concen-trate on the interior solution to the model.
The interior solution for L in the effi-ciency-wage model satisfies the first-ordercondition expressed in terms of theoptimal probability of inspection p*:
(2a) .
Note that an interior solution requiresC-γ L /φ(lnL) to be greater than zero. An alternative way of writing the interiorsolution is
(2b) .
The first-order condition requires thatG/Φ (lnL)2-C is smaller than zero.6 Underthis condition it is apparent that the right-hand side (RHS) of Equation 2b is strictlyconvex in L. Since the probability densityfunction is single-peaked, there are two valuesof L solving Equations 2a, b.7 Only the smallerone satisfies the second-order condition,representing a (local) maximum. The largerof these two values of L lies in a (local)minimum (see Figure 1).8 We define L* asthe value of L that solves Equations 2a, band satisfies the second-order condition.
Solving the sponsor’s maximizationproblem for the efficiency wage premium,W- Wa, the interior solution is defined by:
(2c) .W W GC L
Le a− = −
γ
φ
*
*(ln )
1
2
φ γ(ln )
(ln )
LL
G
LC
= −
−Φ 2
Φ(ln )
(ln )
LG
CL
L
=−
γφ
1
2
p W W Ga× −( ) ≥

FEDERAL RESERVE BANK OF ST. LOU IS
19
MARCH/APR I L 1999
Again, an interior solution requires that the expression C- γ L* /φ (lnL*)is positive.
There are two corner solutions, in bothof which constraint 1d is binding for L*.The interpretation of a corner solution isthat the credit union fully exploits its lendingpotential, i.e., L = Lp. This amount oflending determines the optimal inspectionprobability, p*, via Equation 1c, which inturn determines the optimal wage premium,W e-W a, by virtue of the binding incentive-compatibility constraint 1b.
One corner solution holds if C-γ L* /φ (lnL*) > 0 and L* > Lp. In thiscase, the optimal risk of the credit union’sloan portfolio is Φ (lnLp), its highest possiblevalue. The efficiency-wage premium, We-W a,equals G/Φ (lnLp), its lowest possible value.
The other corner solution occurs whenC-γ L /φ (lnL) is nonpositive. In this case,there is no positive efficiency-wage premiumthat solves the optimization problem . Sincethe first derivative of ZE, with respect to thewage premium, is strictly negative for C-γL /φ (lnL) ≤ 0, the optimal wage premiumequals its minimum value, G/Φ (lnLp),which leads to the first corner solution,discussed above.9
In summary, the efficiency-wage regime has one interior solution that satis-fies the second-order condition (Figure 1).It also has two (identical) corner solutions.The values of the exogenous variables and theparameters determine whether the efficiency-wage or the Demsetz compensation schemewill be better for a particular sponsor. Thesponsor will install an efficiency-wage com-pensation regime if (and only if) the followingtwo conditions hold: First, the relevantefficiency- wage solution is superior to therelevant Demsetz solution and, second, itsatisfies the sponsor’s participation constraint.
The Demsetz HypothesisThe sponsor’s optimization problem
under the Demsetz hypothesis is:
(3a) Max. ZD = B - H - W - p C + γ LlnL
s. t. (3b) W = W a - min{G,W a}
(3c)
(3d) 0 ≤ L ≤ Lp.
Depending on the values for the para-meter γ and the exogenous variables C andLp, the model may have either one of twopossible corner solutions or an interiorsolution. The interior solution satisfies thefirst-order condition:
(4)
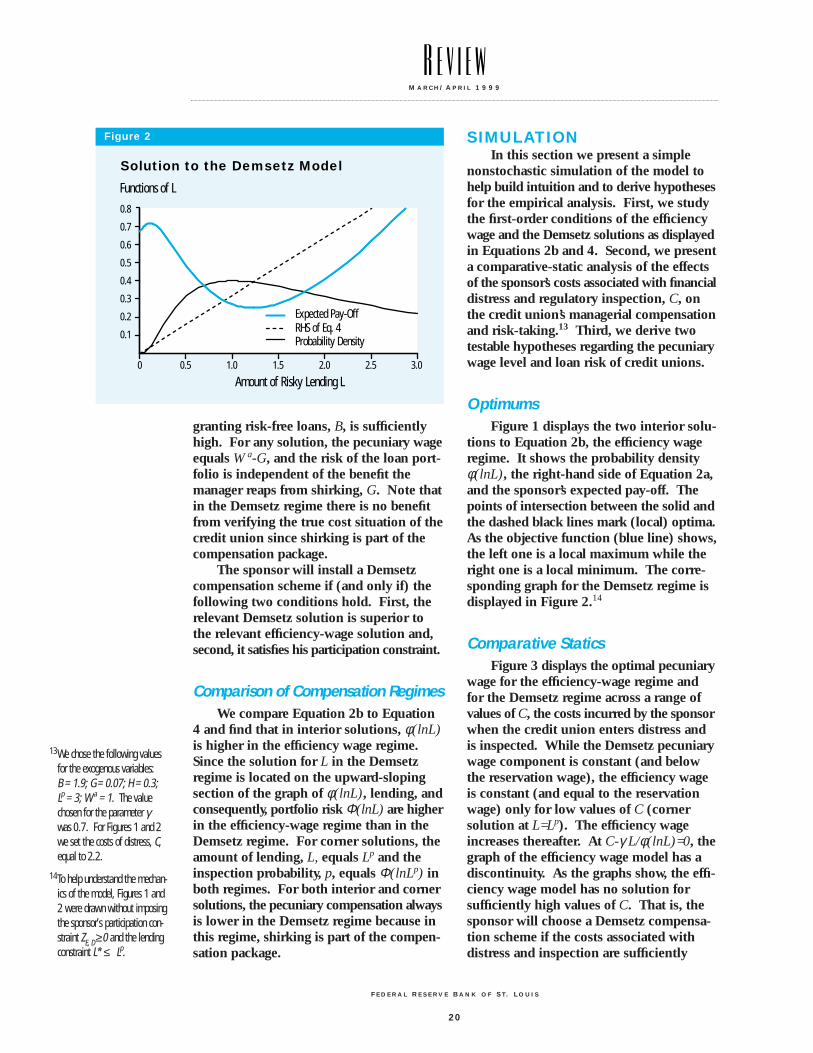
Since the right-hand side of Equation 4is linear in L and the probability densityfunction is single-peaked, there are twovalues of L that solve Equation 4.10 Onlythe smaller one, L*, satisfies the second-order condition (see Figure 2).11
One of two possible corner solutionsoccurs if L* > Lp. In this case, the amountof risky lending takes on its maximum valueLp. Another corner solution ensues whenthere is no positive amount of lending, L,that solves Equation 4.12 In this case, theamount of risky lending and the probabilityof inspection are zero. The credit unionmight, nevertheless, exist if the benefit from
φ γ(ln ) .L
L
C=
pL L
L=
>=
Φ(ln ) 0
0 0
for
for
9 When solving the optimizationproblem 1 for the wage premi-um (W -W a), the first deriva-tive of the sponsor’s objectivefunction ZE (W -W a) reads -1 +G/(W-W a)2 x (C- γ L /φ (lnL)).
10In the case where the probabili-ty density function φ (lnL) istangent to γ L / C, there isonly a single value of L solvingEquation 4.
11Similar to the efficiency wageregime, we can argue that thesponsor’s objective functionZD(L) goes to infinity for Lapproaching infinity.Consequently, the optimum forthe low value of L must be a(local) maximum while the onefor the high value of L must bea (local) minimum.
12This holds, for instance, forγ =0.7 and C>2.5.
Figure 1
0.8
0.7
0.6
0.5
0.4
0.3
0.2
0.1
0 0.5 1.0 1.5 2.0 2.5 3.0
Solution to the Efficiency Wage ModelFunctions of L
Expected Pay-OffRHS of Eq. 2bProbability Density
Amount of Risky Lending L
FEDERAL RESERVE BANK OF ST. LOU IS
20
granting risk-free loans, B, is sufficientlyhigh. For any solution, the pecuniary wageequals W a-G, and the risk of the loan port-folio is independent of the benefit themanager reaps from shirking, G. Note thatin the Demsetz regime there is no benefitfrom verifying the true cost situation of thecredit union since shirking is part of thecompensation package.
The sponsor will install a Demsetzcompensation scheme if (and only if) thefollowing two conditions hold. First, therelevant Demsetz solution is superior tothe relevant efficiency-wage solution and,second, it satisfies his participation constraint.
Comparison of Compensation RegimesWe compare Equation 2b to Equation
4 and find that in interior solutions, φ (lnL)is higher in the efficiency wage regime.Since the solution for L in the Demsetzregime is located on the upward-slopingsection of the graph of φ (lnL), lending, andconsequently, portfolio risk Φ (lnL) are higherin the efficiency-wage regime than in theDemsetz regime. For corner solutions, theamount of lending, L, equals Lp and theinspection probability, p, equals Φ (lnLp) inboth regimes. For both interior and cornersolutions, the pecuniary compensation alwaysis lower in the Demsetz regime because inthis regime, shirking is part of the compen-sation package.
SIMULATIONIn this section we present a simple
nonstochastic simulation of the model tohelp build intuition and to derive hypothesesfor the empirical analysis. First, we studythe first-order conditions of the efficiencywage and the Demsetz solutions as displayedin Equations 2b and 4. Second, we presenta comparative-static analysis of the effectsof the sponsor’s costs associated with financialdistress and regulatory inspection, C, onthe credit union’s managerial compensationand risk-taking.13 Third, we derive twotestable hypotheses regarding the pecuniarywage level and loan risk of credit unions.
OptimumsFigure 1 displays the two interior solu-
tions to Equation 2b, the efficiency wageregime. It shows the probability densityφ (lnL), the right-hand side of Equation 2a,and the sponsor’s expected pay-off. Thepoints of intersection between the solid andthe dashed black lines mark (local) optima.As the objective function (blue line) shows,the left one is a local maximum while theright one is a local minimum. The corre-sponding graph for the Demsetz regime isdisplayed in Figure 2.14
Comparative StaticsFigure 3 displays the optimal pecuniary
wage for the efficiency-wage regime andfor the Demsetz regime across a range ofvalues of C, the costs incurred by the sponsorwhen the credit union enters distress andis inspected. While the Demsetz pecuniarywage component is constant (and belowthe reservation wage), the efficiency wageis constant (and equal to the reservationwage) only for low values of C (cornersolution at L=Lp). The efficiency wageincreases thereafter. At C-γ L/φ (lnL)=0, thegraph of the efficiency wage model has adiscontinuity. As the graphs show, the effi-ciency wage model has no solution forsufficiently high values of C. That is, thesponsor will choose a Demsetz compensa-tion scheme if the costs associated withdistress and inspection are sufficiently
MARCH/APR I L 1999
13We chose the following valuesfor the exogenous variables: B = 1.9; G = 0.07; H = 0.3;Lp = 3; W a = 1. The valuechosen for the parameter γwas 0.7. For Figures 1 and 2we set the costs of distress, C,equal to 2.2.
14To help understand the mechan-ics of the model, Figures 1 and2 were drawn without imposingthe sponsor’s participation con-straint ZE, D ≥ 0 and the lendingconstraint L* ≤ Lp.
Figure 2
0.8
0.7
0.6
0.5
0.4
0.3
0.2
0.1
0 0.5 1.0 1.5 2.0 2.5 3.0
Solution to the Demsetz ModelFunctions of L
Expected Pay-OffRHS of Eq. 4Probability Density
Amount of Risky Lending L

FEDERAL RESERVE BANK OF ST. LOU IS
21
MARCH/APR I L 1999
high (but low enough to allow for anexpected pay-off greater than zero).
Figure 4 shows the optimal risk of thecredit union’s loan portfolio as the cost ofdistress and inspection, C, is allowed to vary.For low levels of C, the risk level takes onits maximum value and is independent ofthe compensation regime (corner solutionsat L=Lp in both regimes). As C increases,the optimal risk level in the Demsetz regimeswitches from the corner solution to theinterior solution at C=γ Lp/φ (lnLp). In theefficiency wage regime, this changeoveroccurs at C=γ Lp/φ (lnLp)+G/Φ (lnLp)2, ahigher value of C than in the Demsetzregime. For the range of C in which aninterior solution obtains, the optimal risklevel decreases with an increase in the costsof distress. For sufficiently high values ofC, there are no solutions for the efficiencywage model while the Demsetz modelswitches discontinuously to a corner solu-tion with zero risk (because of zero riskylending). Comparing interior solutionsacross compensation regimes shows thatfor any given value of C, the risk level inthe Demsetz regime is lower than in theefficiency wage regime.
Figure 5 displays the sponsor’s expectedpay-offs for the two compensation regimes.As in Figure 4, the graphs exhibit disconti-nuities at the values of C that mark the borderbetween corner solutions and interior solu-tions. For corner solutions at L=Lp, theexpected pay-offs are linear in the costs ofdistress. The vertical difference betweenthe two graphs equals the difference betweenthe sponsor’s loss from shirking and thewage premium. For interior solutions, thepay-offs are strictly convex in C. In thecorner solution of zero risky lending in theDemsetz regime, the pay-off is independentof the costs of distress.
In the case displayed in Figures 3 to 5,the sponsor chooses an efficiency wagecompensation structure for low values of C.As C increases, the pecuniary wage leveland the risk of the loan portfolio are leftunchanged as long as the corner solutionprevails. When, for a sufficiently highvalue of C, the efficiency wage switchesfrom the corner solution to the interior
solution, wage and risk change discontinu-ously. While the wage increases, risk falls.With further increases in C, the wage risescontinuously and the portfolio risk declinescontinuously. When the switch to theDemsetz compensation regime eventuallyoccurs, the pecuniary wage and portfoliorisk drop discontinuously. While the wageadopts its minimum value and remainsunchanged for further rises in C, the riskdeclines continuously as C increases before
Figure 3
1.5
1.4
1.3
1.2
1.1
1.0
0.9
0.80 0.5 1.0 1.5 2.0 2.5 3.53.0
Simulation: Effect of Changes in C on Wage LevelPecuniary Wage
Efficency Wage RegimeDemsetz Regime
Costs of Distress
Figure 4
0.9
0.7
0.5
0.3
0.1
-0.10 0.5 1.0 1.5 2.0 2.5 3.53.0
Simulation: Effect of Changes in C on Risk-TakingRisk of Loan Portfolio
Efficency Wage RegimeDemsetz Regime
Costs of Distress

FEDERAL RESERVE BANK OF ST. LOU IS
22
MARCH/APR I L 1999
it falls to zero in the corner solution corre-sponding to zero risky lending.
Alternative sequences of regimes arepossible as C increases. For instance, theefficiency wage regime may dominate theDemsetz regime over the whole range ofvalues of C for which it has a solution.15
Alternatively, the Demsetz scheme may besuperior to the efficiency wage compensa-tion structure for all values of C.16 It alsois possible that for low values of C, theDemsetz regime dominates, followed bythe efficiency wage regime for mediumvalues of C, while for high values of C, theDemsetz regime dominates again.17
HypothesesWe summarize the preceding discussion
by stating two testable hypotheses relatingthe credit union’s costs of distress andinspection to its wage expense and risk-taking. The first hypothesis concerns thepredicted level of wages.
HYPOTHESIS 1 (WAGE LEVEL)The impact of the costs of credit union distress and inspection on the credit union’s wage expense is either:
1. Constant (if the Demsetz regime prevails for all values of C), or
2. Nonincreasing (if the interior solution of the efficiency-wage regime never dominates, or if in the relevant range of C the Demsetz regime is not followed by an efficiency wage regime as C increases), or
3. Nondecreasing (if in the relevant range of C the efficiency-wage regime is not followed by the Demsetz regime as C increases), or
4. Hump-shaped (if the interior solutionof the efficiency-wage regime is followedby the Demsetz regime as Cincreases, or if the efficiency-wage regime is neighbored by Demsetz regimes on both sides).
If we find evidence consistent withcases one or two, we would conclude thatoccupational credit unions do not use effi-ciency wages. If, on the other hand, wefind evidence consistent with cases threeor four, we would conclude that efficiencywages are being used by sponsors of occu-pational credit unions.
The second hypothesis concerns thecredit union’s risk-taking as predicted bythe model.
HYPOTHESIS 2 (RISK-TAKING)
The risk of the credit union’s loan portfolio is nonincreasing in the costs of credit union distress.
Notice that the risk-taking hypothesis isinvariant to the compensation regime usedby a credit union, in contrast to our predic-tions for wage expense. Thus, risk-takingdoes not allow us to test the efficiency-wagepredictions against the Demsetz predictions,although it would allow us to reject thehypothesis that occupational credit unionsemploy either efficiency wages or a Demsetzcompensation scheme.
15This holds when the values of Gand H that were used forFigures 1 through 5 arechanged to 0.02 and 0.5,respectively.
16This holds when the values of Gand H that were used forFigures 1 through 5 arechanged to 0.08 and 0.1,respectively.
17This holds when the values of G and H that were used forFigures 1 through 5 arechanged to 0.11 and 0.1,respectively.
Figure 5
3.0
2.5
2.0
1.5
1.0
0.5
0 0.5 1.0 1.5 2.0 2.5 3.53.0
Simulation: Effect of Changes in C on Sponsor's Expected Pay-OffExpected Pay-Off
Efficency Wage RegimeDemsetz Regime
Costs of Distress

EMPIRICAL METHODSAND RESULTS
This section describes our dataset, theempirical methods we use, and empiricalresults. The Appendix contains more detailson the first two of these topics.
DatasetWe examine a subset of all federally
chartered and federally insured occupationalcredit unions during 1996. Table 1 providesa breakdown of our sample according to thetype of membership group characterizingeach credit union. Note that the table dis-tinguishes between credit unions with asingle common bond and those with multiplecommon bonds. Credit unions sponsoredby a single manufacturing firm, for example,numbered 744 in our sample. Credit unionswith multiple common bonds that predomi-nantly were associated with manufacturingfirms, numbered 821, and so on, for theother membership types. We dropped creditunions whose sponsors were in the finan-cial-services sector (TOM codes 20 and50) because we could not obtain data onsectoral returns on equity. For moredetails, see the Appendix.
We examine balance-sheet data as ofyear-end 1996 and income data for calendaryear 1996 for our sample of credit unions.Our dependent variables include a measureof the credit union’s average wage level rel-ative to local wages (WAGE) and the creditunion’s loan-loss allowance (ALLOWANCE).More specifically, WAGE is constructed bydividing a credit union’s per-capita wage offull-time equivalent credit union employeesby the average wage in the credit union’shome county, and then taking the logarithmof this ratio. ALLOWANCE is the logarithmof the ratio of provisions made by a creditunion for loan losses divided by its total loans.We dropped 14 (out of 2,628) observationsbecause these institutions reported zeroloan-loss allowances. Table 2 indicates thatthe median relative wage level of credit unionsin our sample was about two percent abovethe local wage level, with the overall credit-union relative wage level almost precisely
matching local mean wage levels. Loan-loss allowances, meanwhile, averaged 1.7percent of total loans, with a median valueof about 1.2 percent.
Independent variables we use includethe logarithm of total assets (ASSETS), thelogarithm of the number of members in thecredit union (MEMBERS), the Herfindahlindex of the local deposit market (HERF),the return on equity in the sponsor’s two-digit SIC-code industry (ROE), the existenceof multiple common bonds among the creditunion’s membership (MULTGROUP), thegrowth rate of real gross state product inthe credit union’s home state (GRREALGSP),and an indicator variable for sponsors inthe service sector (SERVICES). The SER-VICES variable appears only in the wageregressions because we expect systematicdifferences between wage levels in manu-facturing and service industries. All othercontrol variables are used in both hypotheses.Table 2 also gives descriptive statistics forASSETS, MEMBERS, and HERF.
We use ASSETS and MEMBERS asproxies for C, the sponsor’s costs associatedwith financial distress of the credit unionand inspection by the regulator. This isbecause larger credit unions are more likelyto be complex organizations and to offer abroad array of financial services to theirmembers. Small credit unions typically offera limited range of services such as savingsand checking accounts and automobileloans (U.S. Treasury, 1997, p. 23). Mean-
MARCH/APR I L 1999
FEDERAL RESERVE BANK OF ST. LOU IS
23
Distribution of Credit Unions by Typeof Membership
Number of Type of MembershipCredit Unions † (TOM) Codes ‡ Type of Membership
744 10-15 Manufacturing432 21-23 Services821 40-49 Multiple group – primarily manufacturing631 51-53 Multiple group – primarily services
† 2,628 observations.‡ National Credit Union Association (NCUA), Instruction No. 6010.2, July 28, 1995.
Table 1

while, 95 percent of large credit unions(more than $50 million in assets) also offermortgages, credit cards, loans to purchaseplanes, boats or recreational vehicles, ATMaccess, certificates of deposit, and personalchecking accounts. Consequently, regulatoryinspection is likely to be more difficult,time-consuming, and potentially expensivefor the sponsor of a relatively large creditunion. At the same time, interruption of alarge credit union’s activities is likely to bemore disruptive to members—and hencealso to the sponsor—because they maydepend on these activities to meet a largerproportion of their financial needs.
One of the control variables we use is the ROE of the sponsor’s industry sector. We cannot identify the sponsors from ourdataset, but we are able to identify the spon-sor’s industry. The ROE of the sponsor’sindustry serves as a crude control for the para-meter γ , the marginal valuation of credit unionlending, in the sponsor’s objective function.
Empirical MethodWe test our hypotheses using a semi-
parametric model of credit-unionperformance of the form
(5)
where yi is the i-th observation of thedependent variable; xpi is a row vector consisting of the i-th observation of theexplanatory variables of the linear (parametric)part of the model; βp is a (column) vector
of the parameters of the linear part of themodel; xi is a vector consisting of the i-thobservation of the explanatory variables inthe nonparametric part of the model; andεi is the i-th realization of the error term.We use a semiparametric model to isolateindependent variables whose effects we expect to be nonlinear, such as thenumber of members or total assets. Theparametric part of the model containsindependent variables whose effects maybe approximately linear; these variablesinclude the Herfindahl index, the sponsor’sindustry return on equity, and the growthrate of real gross state product in the creditunion’s state. In addition, indicator variablesfor the existence of multiple common bondsand for sponsor firms in the services industryare included in the parametric part of theregression. For more details on this method-ology, see the Appendix.
ResultsWe test the two hypotheses that we
derived from our model of occupationalcredit-union agency problems. First, wetest the hypothesis that higher costs asso-ciated with financial distress impact thecredit union’s wage level. We also test fora negative relationship between distresscosts and risk-taking by the credit union.
The series of plots presented in Figures6-9 are “conditioning plots.”18 In each plot,one variable is kept at its median value whilethe other variable (identified on the abscissa)is allowed to vary. The graph displays the
y x f x i ni pi p i i= + + =× β ε( ) , ,...,1
18See Cleveland and Devlin,1988; also see the Appendix of this paper for details.
MARCH/APR I L 1999
FEDERAL RESERVE BANK OF ST. LOU IS
24
Table 2
Descriptive Statistics
Minimum Median Mean Maximum Standard Deviation
Relative Wage Level † 2.258 x 10⁻² 1.019 9.963 x 10⁻¹ 3.925 3.784 x 10⁻¹
Loan-Loss Allowance ‡ 2.055 x 10⁻⁴ 1.178 x 10⁻² 1.700 x 10⁻² 3.600 x 10⁻¹ 1.975 x 10⁻²
Total Assets † 4.300 x 10⁴ 5.031 x 10⁶ 2.266 x 10⁷ 1.947 x 10⁹ 7.797 x 10⁷
Number of Members † 4.500 x 101 1.581 x 10³ 4.694 x 10³ 1.672 x 10⁵ 1.104 x 10 4
Herfindahl Index † 5.346 x 10⁻² 2.001 x 10⁻¹ 2.093 x 10⁻¹ 1 9.391 x 10⁻²
† Based on 2,628 observations.‡ Based on 2,614 observations.

impact of this independent variable on thelevel of the dependent variable. In otherwords, the slope of the graph at a particularpoint reflects the marginal impact of theindependent variable at that point. Theintercept is not identified in regressions ofthis type, so only vertical distances are mean-ingful (not the level itself). The dottedlines are 90-percent confidence bounds.
Hypothesis 1: Wage Level. Figure 6 plotsthe partial effect of an increase in the logof total credit-union assets (a proxy for Cin the theoretical model) on the relativewage level of a credit union, where the rel-ative wage is measured as the log ratio of acredit union’s per-capita wage to the localaverage wage. We hold the number ofmembers at its median value for each levelof assets. It is clear that the relationship isnon-linear, particularly at the smallest creditunions. We suspect that the high incidenceof subsidies from employers and memberswho volunteer their time accounts for someof the unusual behavior of wages at thesmallest credit unions. An upward slopein the relationship between total assets andthe relative wage level is apparent, though,except for the very large credit unions.Judging from the wide confidence intervalsfor the largest institutions, however, therelationship is not estimated very preciselyin this segment. The observed upwardslope is consistent with the hypothesis thatlarger costs associated with financialdistress translate into increased relativewage levels, as predicted by the interiorsolution of the efficiency wage model(Hypothesis 1, cases 3 and 4). Thus, theefficiency-wage theory is supported, whilethe Demsetz hypothesis—which predictsconstant wages—is not.
Figure 7 basically makes the same pointas Figure 6. The relative wage level of a creditunion increases as the log number of mem-bers—another proxy for C—increases,holding the level of total assets at its medianvalue for a given number of members. Asbefore, the relationship is unusual and quitenonlinear at the smallest credit unions andappears to be upward-sloping over the fullset of credit unions.
Table 3 presents results from the para-metric part of the model. The significantpositive coefficient on HERF indicates that,as the level of concentration increases inthe local banking market, and presumablythe intensity of competition decreases, therelative wage level of a credit union rises.If competition in the local deposit marketis an important external source of controlfor agency problems, then higher concen-tration may indicate weak market disciplinefelt by the management.
MARCH/APR I L 1999
FEDERAL RESERVE BANK OF ST. LOU IS
25
Figure 6
4
2
0
-2
-4
-610 12 14 16 18 2220
Wage Level and Total AssetsPartial Impact
Log of Total Assets
Figure 7
6
4
2
0
-2
-42 4 6 8 10 12
Wage Level and Number of MembersPartial Impact
Log of Number of Members

Hypothesis 2: Risk-taking. The intuitionfor this hypothesis is that sponsors try harderto avoid financial distress and regulatory
inspection when they are more costly.This is accomplished by choosing a lessrisky loan portfolio. We use the log ratioof a credit union’s allowance for loan lossesto total loans as a proxy for risk-takingbecause this is an unambiguous measure ofthe amount of risk the credit union sponsorbelieves is in the portfolio.
Figure 8 plots the partial effect of anincrease in the log of total credit-union assetson a credit union’s loan-loss allowance,holding the number of members at itsmedian value at each level of assets. Theoverall relationship is clearly downward-sloping, as predicted by our model. A nearlyidentical plot was obtained when we weightedthe ratio of loan allowances to loans by eachcredit union’s loan-to-asset ratio (not shown).
Figure 9 shows a similar result, thistime allowing the log number of membersin the credit union to vary while holdingfixed the credit union’s assets. A similarresult was obtained when we weighted theratio of loan allowances to loans by eachcredit union’s loan-to-asset ratio (not shown).Thus, in both cases, our proxies for greatercosts associated with financial distress (highertotal assets and more members) are associatedwith less risky loan portfolios.
Turning again to the parametric part ofthe model, Table 4 provides one more pieceof evidence supporting the predictions ofour model. The significant negative co-efficient on HERF indicates that, as thelocal banking market becomes more con-centrated and presumably less competitive,a credit union’s loan-loss allowance falls.This is consistent with the notion that creditunions that face less competition will takeon less risk. In contrast to our wage regres-sions, the coefficient on the sponsor’sindustry ROE is not significantly differentfrom zero in the risk-taking equation.
CONCLUSIONSThis article presents a theory that
explores and provides evidence that is con-sistent with an efficiency-wage view ofmanagerial agency problems at occupationalcredit unions. When costs associated withfinancial distress are likely to be high, we
MARCH/APR I L 1999
FEDERAL RESERVE BANK OF ST. LOU IS
26
Dependent Variable: Wage Level
Independent Variable Coef cient t-statistic
HERF 2.734 x 10⁻¹ 3.265 ***
ROE -1.695 x 10⁻² -3.402 ***
MULTGROUP 2.426 x 10⁻² 1.437
GRREALGSP 1.057 1.349
SERVICES -5.276 x 10⁻² -2.893 ***
Number of Observations 2628
*** Significant at the 1 percent level (two-tailed tests).
Table 3
Dependent Variable: Allowance for Loan Losses
Independent Variable Coef cient t-statistic
HERF -1.310 -6.742***
ROE -1.066 x 10⁻² -1.279
MULTGROUP 1.556 x 10⁻² 0.438
GRREALGSP -7.387 -5.637***
Number of Observations 2614
*** Significant at the 1 percent level (two-tailed tests).
Table 4
Figure 8
4
0
-4
-8
-12
-16
-2010 12 14 16 18 20 22
Allowance for Loan Lossesand Total AssetsPartial Impact
Log of Total Assets

find that credit unions tend to have relativelyhigh wage levels and their loan portfoliostend to contain relatively low levels of risk.We also find that local deposit-marketcompetition and the profitability of thesponsor’s industry are related to wages andrisk-taking.
Despite some informational and incen-tive advantages associated with the commonbond that unites occupational credit-unionmembers, these institutions face many obsta-cles going forward. Recent legislation, whichis widely seen as favorable for credit unions,is not an obvious panacea because theexpansion of credit unions to encompassmultiple common bonds threatens to dilutethe advantages associated with these bonds.Managerial agency problems may take oneven greater significance as the credit-unionmovement advances.
REFERENCESAkella, Srinivas R., and Stuart I. Greenbaum. “Savings and Loan
Ownership Structure and Expense-Preference,” Journal of Banking andFinance (September 1988), pp. 419-37.
Banerjee, Abhijit V., Timothy Besley, and Timothy W. Guinnane. “ThyNeighbor’s Keeper: The Design of a Credit Cooperative With Theoryand a Test,” Quarterly Journal of Economics (May 1994), pp. 491-515.
Besley, Timothy, Stephen Coate, and Glenn Loury. “The Economics ofRotating Savings and Credit Associations,” American Economic Review(September 1993), pp. 792-810.
Cleveland, William S., and Susan J. Devlin. “Locally WeightedRegression: An Approach to Regression Analysis by Local Fitting,”Journal of the American Statistical Association (September 1988),pp. 596-610.
_______, and _______, and Eric Grosse. “Regression by LocalFitting: Methods, Properties and Computational Algorithms,” Journalof Econometrics (January 1988), pp. 87-114.
Davis, Kevin. “Incentive Compatible Governance in Cooperative FinancialInstitutions,” Working Paper, University of Melbourne, 1998.
Demsetz, Harold. “The Structure of Ownership and the Theory of theFirm,” Journal of Law and Economics (June 1983), pp. 375-90.
Emmons, William R., and Willy Mueller. “Conflict of Interest BetweenBorrowers and Lenders in Credit Co-operatives: The Case of GermanCo-operative Banks,” Working Paper, Federal Reserve Bank of St. Louis, 1998.
_______, and Frank A. Schmid. “Credit Unions and the CommonBond,” Forthcoming in this Review, 1999.
Flannery, Mark J. “An Economic Evaluation of Credit Unions in the UnitedStates,” Federal Reserve Bank of Boston Research Report No. 54, 1974.
Fried, Harold O., C.A. Knox Lovell, and Philippe Vanden Eeckaut.“Evaluating the Performance of U.S. Credit Unions,” Journal ofBanking and Finance (April 1993), pp. 251-65.
_______, and _______, and Suthathip Yaisawarng. “The Impactof Mergers on Credit Union Service Provision,” Working Paper, UnionCollege, March 1998.
Gorton, Gary, and Frank Schmid. “Corporate Governance, OwnershipDispersion, and Efficiency: Empirical Evidence from Austrian CooperativeBanking,” Forthcoming in Journal of Corporate Finance.
Hansmann, Henry. The Ownership of Enterprise, Harvard UniversityPress, 1996.
Hart, Oliver, and John Moore. “Cooperatives vs. Outside Ownership,”Working Paper, Harvard University, 1998.
_______, and _______. “The Governance of Exchanges:Members’ Cooperatives versus Outside Ownership,” Oxford Review ofEconomic Policy (Winter 1996), pp. 53-69.
Hastie, Trevor J., and Robert J. Tibshirani. Generalized Additive Models,Chapman and Hall, 1990.
Keating, Barry P., and Maryann O. Keating. “An Empirical Estimation ofthe Degree of Expense Preference Behavior Between Credit Unions byCommon Bond Type,” Quarterly Review of Economics and Finance(Summer 1992), pp. 71-84.
Mester, Loretta J. “Agency Costs Among Savings and Loans,” Journal ofFinancial Intermediation (June 1991), pp. 257-78.
_______. “Testing for Expense Preference Behavior: Mutual versusStock Savings and Loans,” Rand Journal of Economics (Winter 1989),pp. 483-98.
MARCH/APR I L 1999
FEDERAL RESERVE BANK OF ST. LOU IS
27
Figure 9
8
4
0
-4
-8
-12
-164 5 6 7 8 9 10 11 12
Allowance for Loan Lossesand Number of MembersPartial Impact
Log of Number of Members

Milgrom, Paul, and John Roberts. Economics, Organization andManagement, Prentice Hall, 1992.
Patin, Roy P., and Douglas W. McNiel. “Benefit Imbalances Among CreditUnion Member Groups: Evidence of Borrower-Dominated, Saver-Dominated, and Neutral Behavior?” Applied Economics (April 1991),pp. 769-80.
Rasmusen, Eric. “Mutual Banks and Stock Banks,” Journal of Law andEconomics (October 1988), pp. 395-421.
Ritter, Joseph A., and Lowell J. Taylor. “Economic Models of EmployeeMotivation,” this Review (September-October 1997), pp. 3-21.
Schmid, Frank A. “Eigentümerstruktur, Agency-Kosten undUnternehmenserfolg: Empirische Evidenz für österreichischeGenossenschaftsbanken,” Ifo Studien 43(4) (1997), pp. 491-519.
Smith, Donald J. “A Test for Variant Objective Functions in CreditUnions,” Applied Economics (September 1986), pp. 959-70.
__________. “A Theoretic Framework for the Analysis of CreditUnion Decision-Making,” Journal of Finance (September 1984),pp. 1155-68.
__________, Thomas F. Cargill, and Robert A. Meyer. “An EconomicTheory of A Credit Union,” Journal of Finance (May 1981), pp. 519-28.
Speckman, Paul. “Kernel Smoothing in Partial Linear Models,” Journalof the Royal Statistical Society B 50(3) (1988), pp. 413-36.
Srinivasan, Aruna, and B. Frank King. “Credit Union Issues,” FederalReserve Bank of Atlanta Economic Review 83(3) (1998), pp. 32-41.
Taylor, Ryland A. “The Credit Union as a Cooperative Institution,”Review of Social Economy (September 1971), pp. 207-17.
Townsend, Robert M. “Optimal Contracts and Competitive Markets withCostly State Verification,” Journal of Economic Theory (October1979), pp. 265-93.
U.S. Treasury Department. Credit Unions, U.S. Government PrintingOffice, 1997.
White, Halbert. “A Heteroskedasticity-Consistent Covariance MatrixEstimator and a Direct Test for Heteroskedasticity,” Econometrica (May1980), pp. 817-38.
MARCH/APR I L 1999
FEDERAL RESERVE BANK OF ST. LOU IS
28

DATASET, VARIABLES, AND ECONOMETRICMETHODOLOGYThe Dataset
We draw our sample from the December1996 semiannual Report of Condition andIncome for Credit Unions (NCUA 5300,5300S). This dataset includes all federallychartered and federally insured credit unions.The data include income statements coveringthe calendar year 1996 and balance sheetsfrom year-end 1996. We use data for totalassets and the number of members fromyear-end 1995 to avoid endogeneity.
We concentrate on the manufacturingand services sponsor groups among occu-pational credit unions. Thus, we excludecommunity, associational, and corporatecredit unions, and occupational credit unionswith sponsors of the following types: edu-cational, military, federal, state, and localgovernment. Type of Membership (TOM)classification codes are from the NCUA(Instruction No. 6010.2, July 28, 1995).
We use the following criteria toexclude credit-union observations:
- Missing TOM codes- Activity codes other than “active”- Number of members (or potential)
members not greater than one; applies to actual and to lagged values
- Nonpositive values for total assets or lagged total assets
- Number of employees given as zero- Value for “employee compensation
and benefits” given as zero.
Definition of VariablesOur dependent variables are restricted
to be nonnegative. We use natural logarithmsto ensure that these variables are not boundedand satisfy the assumption of normally dis-tributed error terms. For data taken fromthe Report of Condition and Income for
Credit Unions, produced by the NCUA,the item numbers are in brackets.
Dependent Variables: 1) WAGE: RelativeWages of the Credit Union. To calculate therelative per-capita wages of credit unions,we divide average per-capita wages of a creditunion by the county-specific average annualwages for workers covered by the state andfederal unemployment insurance programs(from the Bureau of Labor Statistics, CoveredEmployment and Wages (ES-202) Program).In a few cases, data were suppressed toprotect the anonymity of an employer. Wediscard all credit unions in these counties.
The procedure is as follows: Divideemployee compensation and benefits[CUSA4137] by the weighted sum of thenumber of full-time employees [CUSA6047]and the number of part-time employees[CUSA6048]. We assign a weight of 0.5 to part-time employees and a weight of 1to full-time employees. According toNCUA Form 5300, full-time is defined as26 hours or more per week and part-time is25 hours or less. Then, divide the per-capitacredit-union wage by the per-capita wage in the county.
2) ALLOWANCE: Ratio of Loan-LossAllowances to Loans. Divide allowance forloan losses [CUSA3123] by total loans[CUSA1263]. Fourteen (out of 2,628)observations were dropped due to a Tobitproblem (reported zero allowances).
Independent Variables: Total assets (mea-sured in dollars) and the number ofmembers are lagged by one period andtransformed into natural logarithms whenused as regressors. Other independentvariables include:
1) HERF: the Herfindahl index. We calculate county-specific Herfindahlindexes as measures of concentration inthe local banking market. A Herfindahlindex is defined as the sum of squared
MARCH/APR I L 1999
FEDERAL RESERVE BANK O F S T. LOUIS
29
Appendix

market shares, which we measure as thefraction of total bank deposits within acounty based on FDIC Summary of Depositsdata as of June 30, 1996 (available onlineat <http://www2.fdic.gov/sod/>). By defin-ition, a Herfindahl index is greater thanzero; with a maximum value of one.
2) ROE: Return on Book Value ofEquity by Industry. ROE is defined as theratio of net profit after taxes to net worth.First, we match SIC two digit codes withtheir corresponding TOM codes of creditunions. If a TOM code matches an oddnumber of SIC codes (including the casethat it matched a single SIC code), we takethe median ROE value of these industries.If the number of SIC codes is even, wetake the mean of the two central ROEvalues of these industries. The data aretaken from several annual volumes ofIndustry Norms and Key Business Ratios,published by Dun & Bradstreet (MurrayHill, N.J.).
3) MULTGROUP: Multiple CommonBonds of Membership. We use an indicatorvariable set equal to one if the credit unionhas multiple common bonds of membership,and to zero otherwise.
4) GRREALGSP: Logarithmic Changein the Real Gross State Product. Log growthrates of real gross state product (GRREALGSP)are calculated from data provided by theU.S. Department of Commerce, Bureau ofEconomic Analysis, Regional EconomicAnalysis Division <http://www.bea.doc.gov/bea/dr1.htm>, to control for differingeconomic conditions facing credit unions.
5) SERVICES: Sponsor in the ServicesSector. We use an indicator variable setequal to one if the sponsor of the creditunion belongs to the services sector, zerootherwise. The classification is based onthe TOM codes of the credit unions.Because we use an intercept in thenonparametric part of the regression, wedrop the indicator variable for themanufacturing industry.
Econometric MethodologyWe estimate a semi-parametric model
of the additive partially linear type:
(A1)
with
• yi : i-th observation of the dependent variable
• xpi : row vector of the i-th obser-vation of the explanatory variables of the linear (parametric) part
• βp : (column) vector of the parameters of the linear part
• xi : vector of the i-th observation of the explanatory variables in the nonparametric part
• εi : i-th realization of the error term.
We estimate the model followingSpeckman (1988). In a first step, y issmoothed on the variables in the nonpara-metric part of the semiparametric model.The “smoother” matrix, S, establishes a linear relationship between yand theestimate y:
(A2)
We use the smoother LOESS (locallyweighted regression) as developed byCleveland and Devlin (1988) and Cleveland,Devlin, and Grosse (1988). In contrast tounivariate smoothers (e.g., kernel methods)that are used in conjunction with the back-fitting algorithm, this so-called locallyweighted running-line smoother does notimpose the restriction that the influence ofthe explanatory variables within the non-parametric part is additive (Hastie andTibshirani, 1990, pp. 29-31). We use locallyquadratic fitting with a smoothing parameterof 0.3.
In a second step, the vector containingthe dependent variable and the matrix ofthe explanatory variables of the parametricpart are adjusted for the influence of thenonparametric part:
(A3a) ˜ ( )y I S y= − ×
ˆ .y S y= ×
y x f x i ni pi p i i= + + =× β ε( ) , ,...,1
MARCH/APR I L 1999
FEDERAL RESERVE BANK OF ST. LOU IS
30

(A3b)
with I being the identity matrix.In a third step, the vector βp is
estimated using ordinary least squares:
(A4)
As Speckman (1988) has shown, the bias ofthe estimator βp is asymptotically negligible.
The estimated impact of the explanatoryvariables in the partially linear model is
(A5)
Thus, we obtain as the estimated vector ofthe dependent variable the following:
(A6)
It is then straightforward to show that y isa linear function in y:
(A7a)
with
(A7b)
(A7c)
Based on the linearity of A7a, we use resultsfrom Cleveland and Devlin (1988, p. 599)on the distribution of the residuals of LOESSregressions to estimate standard errors forβp as proposed by Speckman (1988, p.421). We correct these standard errors forheteroskedasticity following White (1980).
We present the impact of each of thevariables of the nonparametric part (partialimpact) in so-called conditioning plots(Cleveland and Devlin, 1988). While oneof these variables is set equal to its median,the other one is varied over all observations.Since the intercept in the estimated semi-parametric model is not identified, onlythe changes in the values on the ordinate,not the values themselves, should be inter-preted. The graphs we present includebands representing 90 percent confidenceintervals.
S S I X X X X I SF p p p p= − ′ ′ −−[ ( ˜ ˜ ) ˜ ( )].1
L X X X X I S Ss p p p p F= ′ ′ − +−( ˜ ˜ ) ˜ ( )1
ˆy L yS= ×
ˆ ˆ ˆ .y X fp p p= +β
ˆ ( ˆ ).f S y Xp p p= −× β
ˆ ( ˜ ˜ ) ˜ ˜ .β p p p pX X X y= ′ ′− ×1
˜ ( )X I S Xp p= − ×
MARCH/APR I L 1999
FEDERAL RESERVE BANK OF ST. LOU IS
31

MARCH/APR I L 1999
FEDERAL RESERVE BANK OF ST. LOU IS
32