wageningen university & research: two partners verweij... · wageningen university &...
TRANSCRIPT

Wageningen University & Research: Two Partners
Fundamental & Applied research for public & private sector
“To explore the potential of nature
to improve the quality of life”

WORKSHOP
REGIONAL DEVELOPMENT STRATEGIES FOR SUSTAINABLE AGRICULTRURE,
RURAL AND URBAN REGIONS
Theme: Agro-Food Chains and Market Outlooks
13 May 2019, Moscow
Author: Irina Verweij-Novikova, PhD

Focus Research Areas:
● International and Dutch markets
● Data
Focus Education programmes:
only applied or within projects & top-sectors
Collaborations:
● Business (Public Private Partnerships)
● Governments (incl. international)
Introduction:
Wageningen Economic Research
3

Wageningen University & Research

266
researchers
65% male
35% female
Facts
40%
Accepted EU R&D
proposals in
societal challenge
2
Turnover’15
€ 31 mln
Yearly around
100 references
in Dutch
parliament
More than 75
years of
experience

Economic research areas and clients
7
Sustainability ManagementMarket Intelligence
Circular Sourcing
Impact strategy & Review
Metrics & Measure
Monitor & Improve
Market Potential & Outlook
Consumer Behaviour
Marketing Impact
Risk Management
Digital Enabling
Value Chain Design
Research areasPublic sector Private sector
Annually involved in 800 different projects, with socio-economic research in the bio-based
economy, water, energy, climate, sustainable food and food security clusters.
Food System Design
Feeding the cities
Business Services
Peri-urban Farming

Market Intelligence in
Agri & Food Sector
8
Determine Market
Potential
Consumption Behaviour
Studies
Intervention Design & Testing
Marketing Impact
Analysis
Competition Analysis
Scenario Studies
Market focus:
• Fresh Food Trade
• Out of Home & Retail
...with strong focus on
international (year-round)
sourcing, perishable
logistics and B2C marketing.
www.wur.eu/marketintelligence
Routes to
increased
market
impact


Market Impact overview
10
Product Engineering
Menu Engineering
CategoryEngineering
DietEngineering
Out of Home
Health sector
Retail
Food & Beverage
SupplyAnalysis
Agro Inputs
TradeAnalysis
Food Trade
DemandAnalysis
InnovationAnalysis
AgriFoodInvestors
Mark
eting E
ngin
eering
Behavio
ralEconom
ics
Gov’s & NGO’s

Food profiler & shifting consumption
11
Food Profiler: Track consumption patterns
It also tracks gender & age of consumers, and motive of consumption
What interventions and trendsare shifting consumption?
How will the consumer respond?Consequences for the supply chain?
Meatsubstitutes
Productsize?
Flexitarians
Carbontax?
24hrs
We track food consumption, and assess the consequences of trends and interventions

Virtual supermarket
12

-Data
-Research for industry
business
-Applied knowledge
workshops
13

14

15

16
Market
access
Stability Irrigation
Harbours
Global Detector: visualization of open data
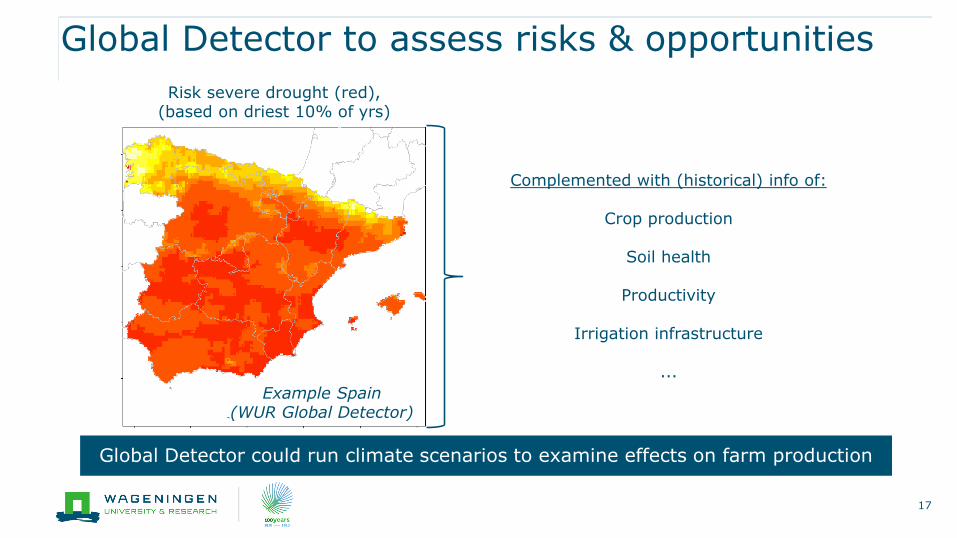
Global Detector to assess risks & opportunities
17
Risk severe drought (red),(based on driest 10% of yrs)
Example Spain(WUR Global Detector)
Complemented with (historical) info of:
Crop production
Soil health
Productivity
Irrigation infrastructure
...
Global Detector could run climate scenarios to examine effects on farm production

18

Why WECR and not OECD? forecasts available for eachcountry of the EU28; tailoredscenario’s
Market Outlooks are available for free from EU website for all commodities, but only at aggregated levels of EU28 (or EU13, EU15)
19

Countries & Time-series
• Countries: 28 countries of the EU (Austria, Belgium, Bulgaria, Croatia, Republic of Cyprus, Czech Republic, Denmark, Estonia, Finland, France, Germany, Greece, Hungary, Ireland, Italy, Latvia, Lithuania, Luxembourg, Malta, Netherlands, Poland, Portugal, Romania, Slovakia, Slovenia, Spain, Sweden and the UK)
• Countries ++: Ukraine, Russia, Kazakhstan, Turkey
• Years: 2000 – 2013 (14 points, historical), 2014-2025 (12 points, forecast) => 26 observations
• Indicators : available for each year (26) x country (28++) x commodity (40++)

• Model
• Commodities
• Countries
• Indicators
• Time period
• Driving factors
• Model documentation
Home AGMEMOD | Studies | Policy issues| Clients| Baseline | Experts | LOGIN
Countries in the model: 28 countries of the EU (Austria, Belgium, Bulgaria, Croatia, Republic of Cyprus, CzechRepublic, Denmark, Estonia, Finland, France, Germany, Greece, Hungary, Ireland, Italy, Latvia, Lithuania, Luxembourg, Malta, Netherlands, Poland, Portugal, Romania, Slovakia, Slovenia, Spain, Sweden and the UK)
Extra Countries: Ukraine, Russia, Kazakhstan, Turkey

• Meat: beef meat, veal meat, pig meat, poultry meat
• Pig sector: pig meat
• Poultry: pultry meat, eggs
• Sheep & Goat: sheep meat, goat meat
• Dairy: drinking milk, butter, cheese, casein, skimmed milk powder, whole milk powder, cream
• Cereals: soft wheat, durum wheat, barley, maize, rye, oats, triticale, rice, other grains
• Oil seeds: rapeseeds, sunflower seeds, soya bean, rapeseed oil, sunflower seed oil, soya oil, rapeseed meal, sunflower meal, soya meal
• Horticulture (in progress): tomato, apples
• Acquaculture: Cephalopods, Crustaceans, Demersal Fish, Freshwater Fish, OtherMarine Fish, Other Molluscs, Pelagic Fish and Plaice Fish
Sectors: commodities
22

Macroeconomic (country-specific): Population growth 2015-2025 (% per year), Real GDP
per capita growth (UNIT), GDP deflator (UNIT), Exchange rate NC/EURO (UNIT), Exchange
rate (EUR/USD)
Other country-specific: Usable agricultural area (ha), population (mln persons), income
per person (euro)
Indicators (commodity-specific): Soft wheat price (euro/100 kg), Production (mln ton),
area (ha), yield (UNIT), Consumption soft wheat total (mln ton), Consumption soft wheat
for food (mln ton), Consumption soft wheat for feed (mln ton), Consumption soft wheat
for processing (mln ton), Consumption soft wheat for bio-energy (mln ton), consumption
soft wheat for food per capita (kg), Net exports (mln ton), Ending stocks (mln ton) ,
Stocks to use ratio (mln ton), EU28total for each indicator, EU28average for each indicator.
Indicators (example for soft wheat) Country x Year
23

RU baseline outlooke.g. Grains and oilseeds
● Outdated results
24
AGMEMOD workshop, Brussels, 13/14 September 2011

Soft wheat: RU price is lower than world and EU
price mostly due to trade tariffs and intervention
system; RU net-exporter
25
AGMEMOD workshop, Brussels, 13/14 September 2011
0,0
5,0
10,0
15,0
20,0
25,0
1999 2001 2003 2005 2007 2009 2011 2013 2015 2017 2019 2021 2023 2025
Russia EU World
Soft wheat price(€/100kg)

Barley: RU price below world and EU price;
RU net-exporter
26
AGMEMOD workshop, Brussels, 13/14 September 2011
0,0
5,0
10,0
15,0
20,0
25,0
1999 2001 2003 2005 2007 2009 2011 2013 2015 2017 2019 2021 2023 2025
Russia EU World
Barley price (€/100kg)

Oats: RU price below to world and EU price;
RU net-exporter
27
AGMEMOD workshop, Brussels, 13/14 September 2011
0,0
2,0
4,0
6,0
8,0
10,0
12,0
14,0
16,0
18,0
1999 2001 2003 2005 2007 2009 2011 2013 2015 2017 2019 2021 2023 2025
Russia EU World
Maize price (€/100 kg)

Sunflower seeds: RU price below world and EU
price;
RU self-sufficient
28
AGMEMOD workshop, Brussels, 13/14 September 2011
0,0
5,0
10,0
15,0
20,0
25,0
30,0
35,0
40,0
45,0
50,0
1999 2001 2003 2005 2007 2009 2011 2013 2015 2017 2019 2021 2023 2025
Russia EU World
Sunflower seeds price(€/100 kg)

Soft wheat: RU net-exporter; production driven by yield growth
-10000
0
10000
20000
30000
40000
50000
60000
29
AGMEMOD workshop, Brussels, 13/14 September 2011
Soft wheat (1000 tons)
Production
Net exports
Non-feed use
Feed use

● Model
● Sectors
● Countries
● Indicators
● Time period
● Assumptions
● Model documentation
Home AGMEMOD Policy issues| Clients| Baseline |Experts | LOGIN
JRC report
Commodity ChartsDairy productsPig and Pig meatPoultrySheep and Sheep meatSoft wheatBarleyRapeseedSugarPotatoes

31

Roel Jongeneel
Myrna van Leeuwen
Team AGMEMOD
32

Implications of a UK exit from the EU for British agriculture
Brexit and Trade-agreements
Increase in Dutch production and export of beef and downward
trend in per capita consumption of pork
Widespread availability of oilseeds contributes to low feed prices
Slow recovery in milk prices and environmental constraints inhibit
milk production down in Netherlands
Good harvests create downward pressure on prices
Further reading (links)
33

Supporting Member States in negotiations
with the EU on Future CAP (Common
Agricultural Policy)
34
Challenge:
Member states are to perform Impact
Assessments of Future CAP by themselves:
- Define MS level targets (approval by EU)
- Identify instruments- Establish control
Approach:
IA project MS & WECR
Existing Model of EU markets (AGMEMOD)
Joint effort to implement new CAP issues for yourcountryin to the model
Results:
WECR: Country specific impact assessment Report
WECR: Assisting in approval of results by the EU
MS: Learning for future assessments
Data, Scenarios Stakeholder consultation
Data and Modelling
Stakeholder consultation
Back up on results of IA
Adjusting the IA Report

2 ideas
35
Market Outlooks : Policy Analysis Instrument (also used by the EU)
- interesting for research units / government
Life Cycle Assessment

About 460 labels providing environmental information

https://www.wur.nl/en/Research
-Results/Research-
Institutes/Economic-
Research/Research-topics-
1/Improving-sustainability-
1/Life-cycle-assessment.htm
Life Cycle Assessment
37

Life cycle assessment

Data was collected from growers in Egypt, Italy and Peru and
information about the supply chain was gathered from an importing
company in the Netherlands. Various scenarios were defined based
on literature, an expert workshop and input from the growers and
importing company (Table 1).
Table 1: Description of the table grapes cases and scenarios
Table grapes: Data collection and modelling
39
Stage Peruvian farm Egyptian farm Italian farm
Cultivation Low efficiency Medium efficiency High efficiency
Packaging Punnets or loose
Transport Maritime or air Maritime/road or air Road or maritime
Distribution/retail With or without cooling (punnets or loose, resp.)
Consumption Reduced or average losses (punnets or loose, resp.)
End-of-life Dutch average disposal

Table Grapes: kg CO2 eq per kg for 4 scenarios
40
Figure 2: climate change impact of table grapes transported by air or sea/ocean

Comparing Italian farm with different
packaging/cooling and transport scenarios
41

Methodolgy PEF
42

THE SUSTAINABILITY CONSORTIUM ® | © 2019 ARIZONA STATE UNIVERSITY AND UNIVERSITY OF ARKANSAS 43
The TSC approach
• Global multi-stakeholder non-profit organization
• Nearly 100 company and NGO members
• Practical and science-based measurement and reporting systems
• One stop shop solution with toolkits for all (128) consumer product categories: Hotspots, improvement opportunities and 10-15 Indicators
• Integral: Full life cycle, all sustainability themes and global
• Stimulating innovation and continuous improvement
• Minimize cost by alignment with leading initiatives and scale
TSC Toolkits
TSC
Database SuppliersKPI Responses
Retailers KPI Responses& Data Analyses Benchmarking

44

More info?
45
Irina Verweij-Novikova, PhD
+31 6 41334956
https://www.wur.nl/en/Research-Results/Research-Institutes/Economic-Research/Research-topics-1/Markets-and-chains-1.htm