vpa quarterly “ howgozit ” and budget update third quarter 2011 1 july 2010 – 31 march 2011...
TRANSCRIPT

VPA Quarterly “Howgozit”And Budget Update
Third Quarter 2011 1 July 2010 – 31 March 2011
Metric Assessments of Key Operating AreasMetric Assessments of Key Operating Areas“If you’re not keeping score, you’re just practicing”…..Vince
Lombardi
2011-14 Budget Game Plan2011-14 Budget Game Plan

33rdrd Quarter Update - 2011 Quarter Update - 2011
• Metrics to assess “how we’re doing”– ‘‘MANAGE’ MANAGE’ the budget crisis….its here!!
• Chancellor’s Budget Brief: Scenarios A, B, C• LRCCD is getting smaller….build back will take a while
– ‘Continuous Process Improvement’, mission accomplishment and institutional effectiveness
– Provide the data assessment for Program Review at year’s end
• Evaluate division level performance, where possible– ‘bean counter’ vs. functional area insight– YOUR assessment should be discussed
• Key Areas: – Classified Staffing—new restrictions on vacancies– Finance/Budget—Update and metric review– Facilities and Support Services– Modernization Program continues per Facilities Master Plan

Good
Classified New Hires Orientation

Classified EvaluationsFY 2011 3rd Quarter
Division / Unit FY 2010
Evals on Time*
# Evals DueFY 11 / 1st
Quarter
# Evals DueFY 11 / 2nd
Quarter
# Evals DueFY 11 / 3rd
Quarter
# Evals DueFY 11 / 4th
Quarter
Number Percentage
President 50% 1 1 100%PIO 100%PRIE 100% 2 2 100%IT 44% 2 1 3 3 50%CCR 100%
VPA 100% 2 2 100%Business Office 83% 1 1 100%Operations 86% 8 6 4 11 61%Bookstore 100% 1 1 100%City Café 0% 3 2 67%
VPI 100%Davis Center 100% 1 1 100%Downtown & W. Sac 100% 3 2 1 4 67%
AVP- Rick Ida 100% 1 1 100%AT 27% 2 2 1 1 20%BSS 89% 2 6 7 88%Business 100% 1 1 1 3 100%LRC 100% 2 1 3 6 100%SAH 78% 2 3 3 60%
AVP- Julia Jolly 100% 2 2 100%HFA 0% 1 2 1 1 25%L&L 100% 1 1 100%MSE 100% 1 1 2 100%P.E., Health & Athletics 100% 1 2 2 5 100%
VPSS 100%Counseling & Student Success 71% 4 1 4 8 89%Matric. & Student Development 29% 2 2 2 4 67%Student Services & Enrollment 68% 10 3 3 8 50%
*On Time= Close-Out + 25 days90-100%= green70-89%= yellow69% or below= red
Evals on Time*

Administrative Services Workshops
48
44 47
34
41
33
49
40
27 28
0
10
20
30
40
50
Sep-06
Mar-07
Aug-07
Dec-07
May-08
Dec-08
Apr-09
Dec-09
Apr-10
Dec-10
Number of Attendees
December 10 Workshop Topics• Budget update• Financial Services• Facilities Master Plan • Fantasy Football Picks• Other topics?? • Q & A
Next Workshop April 14, 2011 Next Workshop April 14, 2011
2-3pm, RHN 2582-3pm, RHN 258• Budget Update• Fiscal Close-Out• Paperwork Processing• Modernization Project Update

Classified Staffing Levels(less Child Development Center)
Year-to-Date 31 Mar 2011
94%96%95%93%91%89%95%93%91%94%
91%91%
0
50
100
150
200
250
300
20%
30%
40%
50%
60%
70%
80%
90%
100%
Authorized FTE Filled FTE % Filled Positions

Scenario OptionA
OptionB
OptionC
Academic Year 10-11 11-12 12-13 10-11 11-12 12-13 10-11 11-12 12-13
Category/Description
Discretionary ReductionsCDF Base: $2.560M
10% 10% 10% 10% 12.5% 15% 10% 20% 20%
STAFF Reductions $M $M $M
- Management (25) [2-yr attrition]
- .08 .162
- .24 .496
- .44 .8911
- Classified Staff (26) [2-yr attrition]
- .19 .3810
- .83 1.744
- 1.7 3.388
- Salary Savings (28) .87 1.8 1.5 .87 1.8 1.5 .87 1.8 1.5
- Faculty Positions Held (27)
.3412
1.2+30
1.7+15
.3412
1.2+30
1.8+20
.3412
1.2+30
1.8+20
Salary Rollback (27)[trombone clause]
- - - - - 3%5.8
- 3%5.8
5.5%10.5

Managing Classified VacanciesManaging Classified Vacancies• Establish 31 March 2011 Baseline for all classified staff
positions (similar approach for Managers?)– Currently 12 Vacancies; 3 pending next Qtr– All positions considered: GENFD and Categorical, but…– Reduction is based on GENFD savings only
• ‘Bogie’ established by DO for GENFD position reductions– SCC: Scenario A/3; B/15; C/25 (Mgt: ~ B/2; C/3)– Phased: ¼ FY12; +1/2 FY13; +1/4FY14– B: ~ 4, 12, 15 ~C: 7, 21, 25
• TASK: identify positions for ‘permanent’ vacancies– Make ‘bogie’ each year; prepare for next year’s bogie– PossiblyPossibly free up ‘salary line’ for temp expenses
• Future: utilize new classified staff process– Reference 31 March 2011 baseline– Adjust for current situation/structure
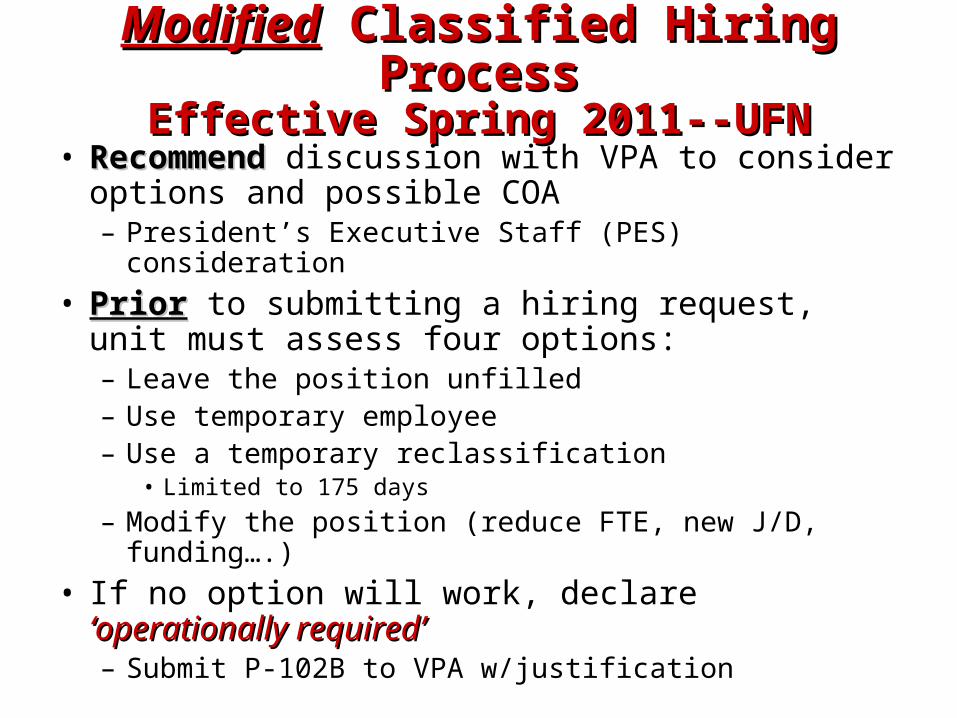
ModifiedModified Classified Hiring Process Classified Hiring ProcessEffective Spring 2011--UFNEffective Spring 2011--UFN
• Recommend Recommend discussion with VPA to consider options and possible COA– President’s Executive Staff (PES) consideration
• PriorPrior to submitting a hiring request, unit must assess four options: – Leave the position unfilled– Use temporary employee– Use a temporary reclassification
• Limited to 175 days
– Modify the position (reduce FTE, new J/D, funding….)
• If no option will work, declare ‘operationally ‘operationally required’required’– Submit P-102B to VPA w/justification

ModifiedModified Classified Hiring Process Classified Hiring Process Effective Spring 2011—UFN Effective Spring 2011—UFN
• Operationally RequiredOperationally Required: – Unit cannot function without the position being filled– Provides ‘one of a kind’ service and only a trained backfill will
work– Unique K,S,A that a temporary employee cannot fulfill– Current staff cannot absorb workload– Other justification
• Consider other alternatives– Shift funding source to categorical / grant
• IF district ‘Bogie’ is achieved, press on with fill action utilizing normal classified hiring procedures– Maximum emphasis on internal hiring– Opportunities for current employees– Minimize new hiring (creates subsequent vacancy)

2010-11 Mid-Year Update2010-11 Mid-Year UpdateSource of FundsSource of Funds
Source of FundsJan 11, 2010 Memo 10-
11 Funding2010-11 Mid Year
Update Change
College Discretionary Fund (CDF) 2,303,820 2,303,820 0 09-10 PDF OTO (214,139/PDF) 74,139 107,070 32,931Instructionally Related (IR) 170,000 170,000 0Out of State Tuition 63,300 63,300 0 09-10 PDF (180,643) 60,643 90,322 29,679SIEF & LM (70,824/PDF) 25,064 35,412 10,348State Lottery Funds 223,730 223,730 0Non-Instructional Equipment 60,342 60,342 0 09-10 PDF (229,730) 77,730 114,865 37,135Partnership for Excellence (PFE) 290,921 395,807 104,886
Subtotal 3,349,689 3,564,668 214,979
Other FundingCategorical Integration 296,000 350,381 54,381Capital Outlay/Bookstore 100,000 100,000 0Carryover 50,000 127,773 77,7732009-10 Unallocated ($270,975) 90,975 135,488 44,513Budget Committee Reserve 0 0 0
Subtotal 536,975 713,642 176,667
Total Funds Available 3,886,664 4,278,310 391,646

Commitments—10-11 UpdateCommitments—10-11 UpdateSummary of Proposed Allocations for 2010-11Summary of Proposed Allocations for 2010-11
10-11 Planned Mid-Year Change
To 2011-12 Plan
• Budget Committee decision to roll $100K to 2011-12
• Conservative approach to work carryover paradox but still ‘carry’ funds to future years
Total Commitments 3,589,420 3,887,709 298,289Total Funds Available 3,886,664 4,278,310 391,646
Balance of Funds Available 297,244 390,601 93,357Budget Committee Allocation 200,000 300,000 100,000Future Year Allocation 97,244 90,601 (6,643)

College Discretionary Fund (CDF) Burn RateYear-to-Date 31 Mar 2011
Division / Unit Appropriations Expenditures PercentageBurn Rate Indicator*
Division Burn Rate
President 39,377 19,763 50% 75%PIO 7,890 6,035 76% 60%PRIE 16,894 11,765 70% 90%IT 22,120 14,490 66% 80%CCR 7,317 3,080 42% 77%
VPA 12,368 2,734 22% 65%Operations 261,272 179,514 69% 73%
VPI 24,556 7,049 29% 60%West Sacramento Ctr 27,953 19,781 71% 75%Davis Center 24,898 8,661 35% 85%
AVP- Rick Ida 20,396 4,735 23% 75%AT 112,346 72,270 64% 50%Business 16,389 5,222 32% 75%LRC 172,093 125,251 73% 65%Allied Health 27,736 15,491 56% 80%Science 69,958 27,582 39% 75%BSS 33,248 7,872 24% 75%
AVP- Julia Jolly 12,210 2,705 22% 75%MSE 28,906 14,666 51% 65%HFA 77,792 45,577 59% 80%L&L 25,042 10,524 42% 60%P.E., Health & Athletics 117,036 113,847 97% 75%
VPS 5,665 5,664 100% 75%
AVP 8,103 29 0% 60%Counseling & Student Success 39,499 22,941 58% 75%Matric. & Student Development - Matric Office 68,651 35,140 51% 70%Matric. & Student Development - Cultural Awareness 11,721 841 7% 50%Matric. & Student Development - Campus Life 9,446 4,404 47% 75%Matric. & Student Development - RISE 500 0 0% 75%Matric. & Student Development - Voter Registration 7,528 3,576 48% 75%Admissions & Records 50,144 33,491 67% 80%Financial Aid 12,841 6,309 49% 75%
*Expected burn rate varies by division+/- 5% = Green > 5% and < 10% = Yellow > 10% = Red < - 5% = Blue

White Paper UsageYear-to-Date 31 Mar 2011
Description Dept ID Budget Total Cost BalancePercentage
SpentDivision Burn
Rate
Admissions & Records SC.VS.ADMR $1,200 $810 $390 67.50%
Allied Health SC.VI.ALHT $5,000 $4,800 $200 96.00%
AVP Student Services SC.VS.AVPS $180 $0 $180 0.00%
Behavioral & Social Sciences SC.VI.BVSS $3,000 $1,680 $1,320 56.00%
Building & Grounds SC.VA.BLDG $1,800 $300 $1,500 16.67%
Business SC.VI.BUSN $2,000 $1,260 $740 63.00%
College & Community Relations SC.CP.CCRO $240 $60 $180 25.00%
Counseling Center SC.VS.COUN $3,000 $450 $2,550 15.00%
Davis Center SC.VI.DAVS $2,330 $1,590 $740 68.24%
Financial Aid Office SC.VS.FAOF $1,000 $1,000 $0 100.00%
Humanities & Fine Arts SC.VI.HFAD $3,000 $1,950 $1,050 65.00%
Language and Literature SC.VI.LLIT $3,000 $2,730 $270 91.00%
Learning Resource Center SC.VI.LRNC $1,500 $150 $1,350 10.00%
Math, Statistics & Engineering SC.VI.MSED $3,000 $3,000 $0 100.00%
Matric, Student Dev SC.VS.MSDO $1,110 $540 $570 48.65%
Microcomputer Service SC.CP.MICR $360 $60 $300 16.67%
Physical Ed & Athletics SC.VI.PEAT $1,815 $1,320 $495 72.73%
Planning, Research & Dev SC.CP.PRDO $240 $60 $180 25.00%
President's Office SC.CP.OFFC $180 $150 $30 83.33%
Public Info Office SC.CP.PIOF $60 $60 $0 100.00%
RISE SC.VS.RISE $250 $0 $250 0.00%
Staff Development SC.VI.STAF $360 $90 $270 25.00%
Technology SC.VI.TECH $2,000 $930 $1,070 46.50%
VP Administration Office SC.VA.OFFC $780 $300 $480 38.46%
VP Instruction Office SC.VI.OFFC $800 $360 $440 45.00%
VP Student Svcs Office SC.VS.OFFC $180 $0 $180 0.00%
West Sac Center SC.VI.WSAC $2,330 $1,080 $1,250 46.35%
< 75% = Green
>75% and < 80% = Yellow
> 75% = Red

SCC Copier UsageMar 09/10 vs Mar 10/11
March 2009 Thru March 2010 April, 2010 Thru March, 2011 Difference % Increase / DecreaseADMISSIONS & REC. 52,711 39,646 -13,065 -24.8%ADV TECH 140,629 123,318 -17,311 -12.3%ALLIED HEALTH- NURS 263,688 265,464 1,776 0.7%ASSESSMENT 39,129 26,549 -12,580 -32.2%ATHLETICS-NORTH 127,508 143,575 16,067 12.6%ATHLETICS-SOUTH 82,097 89,284 7,187 8.8%BEHAV. & SOC SCI 487,025 422,920 -64,105 -13.2%BUSINESS DIVISION 190,319 298,139 107,820 56.7%CITY CAFÉ 1,253 21,367 20,114COLLEGE RELATIONS 6,748 5,335 -1,413 -20.9%COUNSELING 121,767 206,870 85,103 69.9%DAVIS OUTREACH 363,726 345,011 -18,715 -5.1%HUMANITIES-DEAN 476,690 452,079 -24,611 -5.2%LANG & LIT 522,086 681,622 159,536 30.6%LEARNING DISABILITY CTR. 57,707 59,937 2,230 3.9%LEARNING RESOURCE CTR. 54,047 78,350 24,303 45.0%MATH WORKROOM 567,306 578,095 10,789 1.9%MATH/STATS/ENG 197,739 266,013 68,274 34.5%OPERATIONS 30,419 23,501 -6,918 -22.7%SCIENCE & ALLIED HLTH 678,476 847,065 168,589 24.8%STAFF RES. CTR.**B&W 26,918 32,573 5,655STAFF RES. CTR.*COLOR 10,403 24,706 14,303VP ADMIN. SERVICES 8,244 6,543 -1,701 -20.6%WEST SAC CTR. 253,145 355,841 102,696 40.6%
TOTAL 4,759,780 5,393,803 634,023 13.3%
NOTE:City Café, FY2009/10, Feb. & March Totals OnlyStaff Res. Ctr., FY09/10, Dec. thru March Only
March, 2009 thru March, 2010 March, 2010 thru March, 2011 Difference
BUSINESS OFFICE 27,597 20,805 -6,792CDC - FRONT OFFICE 44,802 49,127 4,325CAMPUS POLICE 29,455 28,479 -976 -3.3%DISABILITY RESOURCE CTR. 88,819 28,377 -60,442EOPS 68,992 51,795 -17,197FINANCIAL AID 15,715 14,081 -1,634ONE STOP-CAL WORKS 107,735 75,367 -32,368 -30.0%ORIENTATION**B&W 49,459 31,247 -18,212 -36.8%ORIENTATION**COLOR 189 8 -181 -95.8%DUPLICATING ( 2 Machines) 5,195,785 4,355,860 -839,925 -16.2%STUDENT DEV #1 (B&W) 79,970 100,597 20,627 25.8%STUDENT DEV #1 (COLOR) 3,799 3,003 -796 -21.0%
TOTAL 5,712,317 4,758,746NOTE : Mar, 2009 copy count excluded for Bus Office, CDC, DRC, EOPS, & Fin. Aid. Ops was not track ing readings prior to April.NOTE : CalWorks - Copier Down July, 2010 & Orientation, copier down March 2010 thru Aug., 2010
Institutional Copiers
Non-Institutional Copiers
Green = 0% or less increaseYellow = 0% - 10% increaseRed = > 10% increase

Expenditure ComparisonYear-to-Date—31 Mar 2011
Budget Year Fund 11 Fund 12 Fund 11 Fund 12 Fund 11 Fund 12 Total
%
Change
2011 73,334 56,169 285,545 217,391 287,494 165,340 1,085,273
2010 63,763 87,397 180,869 299,076 289,938 269,143 1,190,187
Increase/(Decrease)
from Prior Year 9,571 -31,228 104,676 -81,685 -2,444 -103,803 -104,914 -9%
Travel Classified Temp Student Help

Expenditure Comparison3rd Qtr 1 July 2009—31 Mar 2010
Budget Year Fund 11 Fund 12 Fund 11 Fund 12 Fund 11 Fund 12 Total
%
Change
2010 63,763 87,397 180,869 299,076 289,938 269,143 1,190,187
2009 184,419 168,211 226,025 400,294 349,162 423,779 1,751,891
Increase/(Decrease) (120,655) (80,814) (45,156) (101,218) (59,224) (154,636) (561,704) -32%
Travel Classified Temp Student Help

Instructionally-Related Fund (IR) Burn RateYear-to-Date 31 Mar 2011
Division/Unit2011
Approp.Prior Year Carryover
2011 Total Budget Expenditures
Expenditure Percentage
Division Burn Rate
Burn Rate Indicator*
Counseling 6,285 0 6,285 2,509 40% 75%
Davis Center 300 0 300 205 68% 60%
Campus Development 2,000 2,942 4,942 0 0% 0%
Financial Aid 434 0 434 1,078 248% 75%
Humanities & Fine Arts 31,834 5,274 37,108 21,918 59% 70%
Language & Literature 16,407 2,155 18,562 5,335 29% 60%
Math Science Engineering 218 156 374 0 0% 75%
Multicultural Activities 23,931 822 24,753 13,198 53% 80%
P.E., Health, & Athletics 80,795 0 80,795 85,537 106% 75%
Student Development 11,696 1,557 13,253 1,265 10% 75%West Sacramento Center 500 30 530 0 0% 80%
Totals 174,400 12,936 187,336 131,046 70% 66%
+/- 5% = Green +/- 10% = Yellow +/- > 10% = Red

Lottery Burn RateYear-to-Date 31 Mar 2011
Division Appropriations Expenditures PercentageBurn Rate Indicator*
Division Burn Rate
AT 37,208 11,165 30% 50%BSS 6,170 3,010 49% 75%HFA 31,273 14,092 45% 75%IT 3,207 2,500 78% 100%L & L 146 0 0% 75%MSE 33 0 0% 75%P.E., Health & Athletics 80,500 51,953 65% 75%Science 61,694 49,826 81% 100%West Sacramento Ctr 1,174 0 0% 75%
*Expected burn rate varies by division+/- 5% = Green > 5% and < 10% = Yellow > 10% = Red < - 5% = Blue

Special Activities Fund Burn RateAs of 3/31/11
Unit Appropriations Expenditures Percentage
President 14,500 8,792 61%
Vice President Administration 7,500 2,481 33%
Vice President Instruction 15,000 4,551 30%
Vice President Student Services 18,000 6,683 37%
TOTAL 55,000 22,507 41%

Categorical Program Burn RateYear-to-Date 31 Mar 2011
CategoricalProject Grant
OPR Appropriations Expenditures PercentageBurn Rate Indicator*
Division Burn Rate
DOL GreenForce Initiative 340A AT 339,531 125,220 37% 24%Basic Skills 09-10 575x AVPI 255,903 94,368 37% 75%Basic Skills 10-11 576x AVPI 154,326 0 0% 75%Regional Cons VTEA IB 334A AVPI 11,715 8,058 69% 75%VTEA 316x AVPI 1,016,213 596,781 59% 75%Local Tech Prep 329A SSE 34,000 1,419 4% 75%Matriculation 597C SSE 680,576 505,165 74% 75%Child Development Instructor Agmt 331A BSS 16,250 6,098 38% 50%Child Development Coordinator Agmt 331E BSS 6,900 3,450 50% 50%CA Early Childhood Mentor Program 332D BSS 775 0 0% 50%ARRA-SETA-HS Career Pathways 365C BSS 37,608 9,393 25% 100%TANF Child Dev Careers Program 381M BSS 16,700 4,228 25% 75%CAHSEE Prep Year 3 454R LR 42,243 42,243 100% 100%MESA/CCP 589A MSE 50,500 25,358 50% 75%MESA/CCP Extension 589D MSE 25,523 25,523 100% 100%Natl Science Fdn - STEM Scholarship 390M MSE 21,150 20,327 96% 75%ARRA - Dental Hygiene 370H SAH 250,017 184,568 74% 75%Health Occup Prep & Ed (HOPE) Yr 2 462B SAH 64,054 64,054 100% 100%Health Occup Prep & Ed (HOPE) Yr 3 462A SAH 275,862 188,308 68% 75%Nursing Enrollment Growth Yr 1 453C SAH 75,437 4,591 6% 75%Nursing Retention Yr 2 453H SAH 43,023 43,023 100% 100%Responsive Training Fund 450X SAH 365,217 247,519 68% 100%BOG BFAP 438A SSE 849,739 655,652 77% 80%BOG BFAP Extension 438B SSE 59,291 59,291 100% 100%CalWORKs 592x SSE 525,320 287,159 55% 75%CARE 411A SSE 156,285 95,335 61% 71%CARE Extension 411D SSE 2,684 2,684 100% 100%DSPS 428A/B/H SSE 930,193 689,808 74% 75%DSPS Extension 428D/E/I SSE 11,722 11,722 100% 100%EOPS 408A/B SSE 942,892 712,016 76% 81%EOPS Extension 408E SSE 21,978 21,978 100% 100%TANF 590A SSE 64,000 11,400 18% 75%WorkAbility 381F SSE 211,465 144,134 68% 75%ARRA - Workability 381H SSE 41,860 15,145 36% 100%
*Expected burn rate varies by division+/- 5% = Green > 5% and < 10% = Yellow > 10% = Red < - 5% = Blue

Categorical Program Burn RateYear-to-Date 31 Mar 2011
Categorical OPR Appropriations Expenditures PercentageBurn Rate Indicator*
Division Burn Rate
Basic Skills 09-10 AVPI 255,903 94,368 37% 75%VTEA AVPI 1,016,213 596,781 59% 75%CalWORKs/TANF SSE 589,320 298,559 51% 75%DSPS SSE 930,193 689,808 74% 75%Matriculation SSE 680,576 505,165 74% 75%BOG BFAP SSE 849,739 655,652 77% 80%CARE SSE 156,285 95,335 61% 71%EOPS SSE 942,892 712,016 76% 81%
*Expected burn rate varies by division+/- 5% = Green > 5% and < 10% = Yellow > 10% = Red < - 5% = Blue

LRCCD Budget ScenariosLRCCD Budget ScenariosFY 2011-13FY 2011-13
• Scenario A: – Governor’s budget: -$400M (CCC)– Reduced workload / fee increase offset: -$290M – LRCCD Portion: -$13.2M
• Scenario B: – Additional $250M for total -$650M– Reduced Workload / fee increase offset: -$540M– LRCCD Portion: -$24.6LRCCD Portion: -$24.6
• Scenario C: Implemented for CDF…..Implemented for CDF…..– Additional $500M for total of $900M– Reduced workload / fee increase offset: -$790M– LRCCD Portion: -$36.0MLRCCD Portion: -$36.0M

Scenario OptionA
OptionB
OptionC
Academic Year 10-11 11-12 12-13 10-11 11-12 12-13 10-11 11-12 12-13
Category/Description $ M $M $M
Gen Purpose Reduction FY 09-10 (1)
8.7 8.7 8.7 8.7 8.7 8.7 8.7 8.7 8.7
Gen Purpose ReductionFY 11-13 (2)
- 13.2 13.2 - 24.6 24.6 - 36.0 36.0
Growth (3) (5.8) 5.8 5.8 (5.8) 5.8 5.8 (5.8) 5.8 5.8
Categorical Reductions(Base: 08-09) [5]
12.3 12.3 12.3 12.3 12.3 12.3 12.3 12.3 12.3
- District Backfill % (31) 40% 40% 40% 40% 25% 25% 40% 25% 25%
Total Reductions (6) 15.2 28.4 28.4 15.2 39.8 39.8 15.2 51.2 51.2
Total w/ DistrictIncrease (12)
23.7 43.9 50.9 23.7 55.3 62.3 23.7 66.8 73.7
District Backfillfrom Reserves (37)
(6.3) 3.3 20.3 (6.3) 10.3 25.3 (6.3) 10.0 25.6
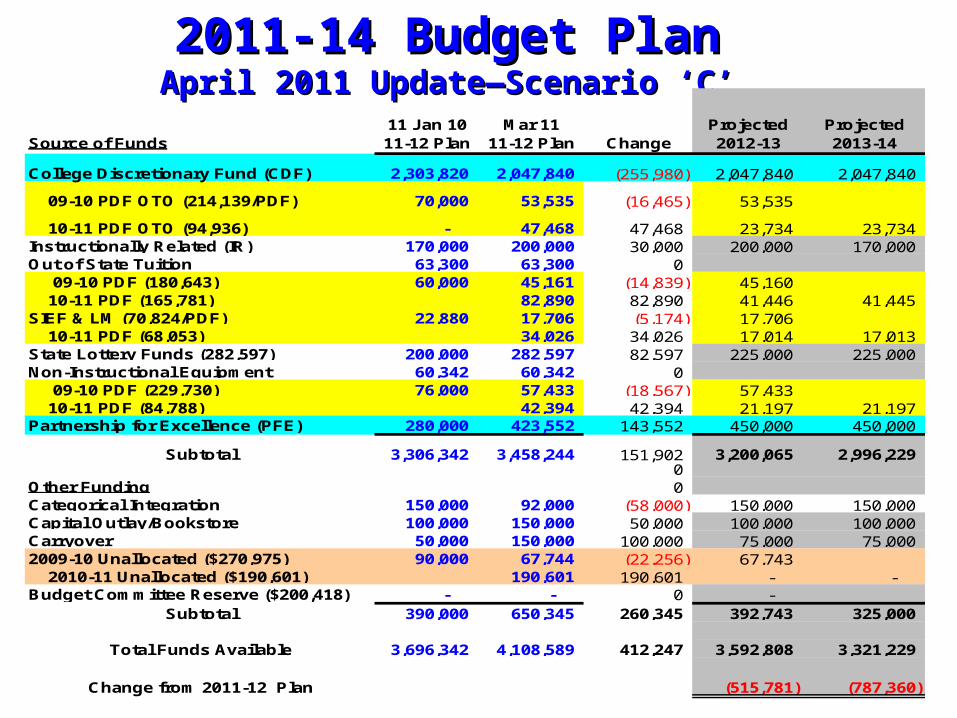
2011-14 Budget Plan2011-14 Budget PlanApril 2011 Update—Scenario ‘C’April 2011 Update—Scenario ‘C’
Source of Funds11 Jan 10 11-12 Plan
Mar 11 11-12 Plan Change
Projected 2012-13
Projected 2013-14
College Discretionary Fund (CDF) 2,303,820 2,047,840 (255,980) 2,047,840 2,047,840
09-10 PDF OTO (214,139/PDF) 70,000 53,535 (16,465) 53,535
10-11 PDF OTO (94,936) - 47,468 47,468 23,734 23,734 Instructionally Related (IR) 170,000 200,000 30,000 200,000 170,000 Out of State Tuition 63,300 63,300 0 09-10 PDF (180,643) 60,000 45,161 (14,839) 45,160 10-11 PDF (165,781) 82,890 82,890 41,446 41,445 SIEF & LM (70,824/PDF) 22,880 17,706 (5,174) 17,706 10-11 PDF (68,053) 34,026 34,026 17,014 17,013 State Lottery Funds (282,597) 200,000 282,597 82,597 225,000 225,000 Non-Instructional Equipment 60,342 60,342 0 09-10 PDF (229,730) 76,000 57,433 (18,567) 57,433 10-11 PDF (84,788) 42,394 42,394 21,197 21,197 Partnership for Excellence (PFE) 280,000 423,552 143,552 450,000 450,000
Subtotal 3,306,342 3,458,244 151,902 3,200,065 2,996,229 0
Other Funding 0Categorical Integration 150,000 92,000 (58,000) 150,000 150,000 Capital Outlay/Bookstore 100,000 150,000 50,000 100,000 100,000 Carryover 50,000 150,000 100,000 75,000 75,000 2009-10 Unallocated ($270,975) 90,000 67,744 (22,256) 67,743 2010-11 Unallocated ($190,601) 190,601 190,601 - - Budget Committee Reserve ($200,418) - - 0 -
Subtotal 390,000 650,345 260,345 392,743 325,000
Total Funds Available 3,696,342 4,108,589 412,247 3,592,808 3,321,229
Change from 2011-12 Plan (515,781) (787,360)

Commitments—11-14 Update April ‘11Commitments—11-14 Update April ‘11Base Budget AllocationsBase Budget Allocations
• Scenario C: 20% Reduction to CDF Base Allocation from DO
• Plan CDF @ -20%; Lottery @ -15%; IR @ -0%
Commitments
10-11 Plan Midyear
Requested 11-12
Allocated 11-12 Change
Projected 2012-13
Projected 2013-14
CDF bases 1,716,708 2,131,755 1,712,201 -20% 1,712,201 1,712,201
Instructionally Related (IR) bases 174,400 200,000 200,000 0% 200,000 170,000
Lottery bases 143,500 175,000 148,750 -15% 148,750 148,750
Subtotal 2,034,608 2,506,755 2,060,951 (445,804) 2,060,951 2,030,951

Commitments—11-14 Update April ‘11Commitments—11-14 Update April ‘11 Institutional AllocationsInstitutional Allocations
10-11 Plan Midyear
Requested 11-12
Allocated 11-12 Change
Projected 2012-13
Projected 2013-14
•
• Child Center changes have been implemented…expect significant savings….no salary savings to cover…RISK
• Swing space a function of modernization schedule….could change
• Consider Classified backfill…..pending DO decision
Institutional
Summer School 0 50,000 45,000 0 40,000 40,000
Accreditation Preparation 0 0 0 0 0 0
Child Development Center Overrun 150,000 150,000 50,000 0 50,000 50,000
Extend Sick Lv Backfill - Mgmt/Staff 40,000 40,000 40,000 0 30,000 30,000
Modernization/Swing Space 15,000 50,000 40,000 0 70,000 20,000
Mgt/Classified Staff Backfill 0 50,000 0 0 0 0
Subtotal 205,000 340,000 175,000 (165,000) 190,000 140,000

Commitments—11-14 Update April ‘11Commitments—11-14 Update April ‘11 Student AllocationsStudent Allocations
• Financial Aid overpayment remains a large ‘variable’…RISK
• Continued emphasis on faculty ‘roster management’
10-11 Plan Midyear
Requested 11-12
Allocated 11-12 Change
Projected 2012-13
Projected 2013-14
Students
Student Access Cards 3,000 3,000 3,000 0 3,000 3,000
International Student Center 30,000 30,000 30,000 0 30,000 30,000
Financial Aid Overpayment/R2T4 400,000 200,000 150,000 -50,000 150,000 150,000
Bus Rent-Field Trips/Athletic Travel 35,000 65,000 60,000 -5,000 60,000 60,000
Post Season Competition 40,000 60,000 55,000 -5,000 55,000 55,000
Event Security 3,000 8,000 5,000 -3,000 5,000 5,000
Subtotal 511,000 366,000 303,000 (63,000) 303,000 303,000

Commitments—11-14 Update April ‘11 Commitments—11-14 Update April ‘11 Program Plan AllocationsProgram Plan Allocations
• Need to scrub….pick up ~$75K
• Planned program needs to be sized to funding plan
• Metric assessment along with outcomes measures needed
10-11 Plan Midyear
Requested 11-12
Allocated 11-12 Change
Projected 2012-13
Projected 2013-14
Program Plans
IT Resource/Replacement 507,000 598,000 598,000 0 500,000 500,000
Continuous Quality Improvement 8,000 17,000 8,000 -9,000 8,000 8,000
Honors .4FTE 18,904 33,079 18,904 -14,175 20,000 20,000
Writing Center 29,100 63,626 37,046 -26,580 60,000 60,000
Staff Development .5 FTE 33,244 50,000 33,244 -16,756 35,000 35,000
Cultural Democracy Initiative (CDI) 1,500 7,500 7,500 0 1,500 1,500
Distance Education 8,500 12,000 8,500 -3,500 8,500 8,500
Safety, Security & Environment 50,500 60,750 50,500 -10,250 50,500 50,500
Non-Instruct Equip & Infrastructure 35,900 71,800 63,300 -8,500 35,900 35,900
Library Materials 67,500 100,000 75,000 -25,000 75,000 75,000
Archive Librarian ( .3 FTE ) 17,648 40,349 18,067 -22,282 17,648 17,648
Tutoring 188,805 188,805 188,805 0 188,805 188,805
Marketing/Outreach Advertising 147,000 161,100 156,100 -5,000 147,000 147,000
AV Media Services 23,500 63,169 63,169 0 65,000 65,000
Articulation 0 5,000 5,000 0 5,000 5,000
Subtotal 1,137,101 1,472,178 1,331,135 (141,043) 1,217,853 1,217,853

Commitments—11-14 Update April ’11Commitments—11-14 Update April ’11Summary of Proposed AllocationsSummary of Proposed Allocations
• Further adjustments required
• Additional ‘tweaks’ needed……Program Plans…. budget committee funding…base allocations, selectively
• Out-years will require additional adjustments
10-11 Plan Midyear
Requested 11-12
Allocated 11-12 Change
Projected 2012-13
Projected 2013-14
Total Commitments 3,887,709 4,684,933 3,870,086 (814,847) 3,771,804 3,691,804
Total Funds Available 4,278,310 4,108,589 4,108,589 0 3,592,808 3,321,229
Balance of Funds Available 390,601 (576,344) 238,503 (178,996) (370,575)
Budget Committee Allocation 300,000 300,000Future Year Allocation 90,601 (576,344) (61,497)

Absence ReportsYear to Date 31 Mar 2011
Division
Submit'd 1st Qtr
Late 2nd Qtr
Late 3rd Qtr
Late 4th Qtr
Late Late Rate
Late Indicator*
President 47 0 0 2 4%PIO 18 0 0 0 0%PRIE 30 0 0 0 0%IT 129 0 0 0 0%CCR 33 0 0 0 0%
President Totals 257 0 0 2 0 1%VPA 51 0 1 0 2% Bookstore 72 0 0 0 0%
Business Office 54 0 0 0 0%Café 67 8 0 0 12%Operations 407 0 1 1 0%
VPA Totals 651 8 2 1 0 2%VPI 45 0 1 0 2%
Davis Center 21 0 0 0 0%West Sacramento 66 0 0 1 2%
AVP- Rick Ida 54 0 0 1 2%AT 76 0 0 1 1%BVSS 132 2 0 1 2%Business 64 0 0 0 0%LRC 217 0 0 0 0%SAH 113 0 1 0 1%
AVP- Julia Jolly 54 0 0 0 0%HFA 71 1 0 1 3%L&L 29 0 0 0 0%MSE 37 0 0 1 3%P.E., Health & Athletics 53 0 2 8 19%
VPI Totals 1032 3 4 14 0 2%VPSS 28 0 1 3 14%AVP 0 0 0 0 0%Student Services & Enrollment 327 20 6 4 9%Counseling & Student Success 140 5 4 1 7%Matriculation & Student Development 216 4 11 1 7%
VPSS Totals 711 29 22 9 0 8%
TOTALS 2,651 40 28 26 0 4%
*Expected error rate =0%+/- 5% = Green+/- 10% = Yellow+/- > 10% = Red

IntentsYear to Date 31 Mar 2011
Division
Submit'd 1st Qtr Errors
2nd Qtr Errors
3rd Qtr Errors
4th Qtr Errors
Error Rate
Error Rate Indicator*
President 1 0 0 0 0%PIO 0 0 0 0 0%PRIE 0 0 0 0 0%IT 1 0 1 0 100%CCR 0 0 0 0 0%
President Totals 2 0 1 0 0 50%VPA 0 0 0 0 0%
Business Office 1 0 0 0 0%Operations 2 0 2 0 100%
VPA Totals 3 0 2 0 0 67%VPI 0 0 0 0 0%
Davis Center 1 1 0 0 100%West Sacramento 0 0 0 0 0%
AVP- Rick Ida 0 0 0 0 0%AT 0 0 0 0 0%BVSS 6 0 0 0 0%Business 0 0 0 0 0%LRC 1 0 0 1 0%SAH 3 0 1 0 33%
AVP- Julia Jolly 0 0 0 0 0%HFA 3 0 0 0 0%L&L 0 0 0 0 0%MSE 1 0 0 0 0%P.E., Health & Athletics 7 2 0 0 29%
AVP- Jim Comins 0 0 0 0 0%VPI Totals 22 3 1 1 0 23%
VPSS 0 0 0 0 0%Student Services & Enrollment 8 0 3 1 50%Counseling & Student Success 2 0 0 0 0%Matriculation & Student Dev. 14 0 3 3 43%
VPSS Totals 24 0 6 4 0 42%
TOTALS 51 3 10 5 0 35%
*Expected error rate = 0%+/- 5% = Green+/- 10% = Yellow+/- > 10% = Red

Travel AuthorizationsYear to Date 31 Mar 2011
Division Submit'd 1st Qtr Errors
2nd Qtr Errors
3rd Qtr Errors
4th Qtr Errors
Error Rate
Error Rate Indicator*
President 14 0 0 2 14%PIO 0 0 0 0 0%PRIE 3 0 0 0 0%IT 5 0 0 0 0%CCR 5 0 0 1 0%
President Totals 27 0 0 3 0 11%VPA 1 0 0 0 0%
Business Office 0 0 0 0 0%Operations 0 0 0 0 0%
VPA Totals 1 0 0 0 0 0%VPI 11 0 0 0 0%
Davis Center 0 0 0 0 0%West Sacramento 6 0 0 0 0%
AVP- Rick Ida 12 0 0 0 0%AT 8 0 0 0 0%BVSS 20 4 2 1 35%Business 15 0 0 0 0%LRC 16 0 4 1 31%SAH 38 0 2 1 8%
AVP- Julia Jolly 15 1 1 1 20%HFA 6 0 0 0 0%L&L 13 0 4 1 38%MSE 33 1 1 0 6%P.E., Health & Athletics 11 0 1 0 9%
AVP- Jim Comins 0 0 0 0 0%VPI Totals 204 6 15 5 0 13%
VPSS 0 0 0 1 0%AVP 0 0 0 0 0%Student Services & Enrollment 70 1 2 2 7%Counseling & Student Success 21 1 0 2 14%Matriculation & Student Dev 3 0 2 0 67%
VPSS Totals 94 2 4 5 0 12%
TOTALS 326 8 19 13 0 12%
*Expected error rate = 0%+/- 5% = Green+/- 10% = Yellow+/- > 10% = Red

Budget EntriesYear to Date 31 Mar 2011
Division Submitted 1st Qtr Errors
2nd Qtr Errors
3rd Qtr Errors
4th Qtr Errors
Error Rate
Error Rate
Indicator
President 2 0 0 0 0%PIO 0 0 0 0 0%PRIE 0 0 0 0 0%IT 5 0 0 0 0%CCR 3 0 0 0 0%
President Totals 10 0 0 0 0 0%VPA 123 0 0 0 0%
Business Office 0 0 0 0 0%Operations 4 0 0 0 0%
VPA Totals 127 0 0 0 0 0.0%VPI 9 0 0 0 0%
Davis Center 2 0 0 0 0%West Sacramento 2 0 0 0 0%
AVP- Rick Ida 6 0 0 0 0%AT 84 1 0 3 5%BVSS 4 0 0 0 0%Business 20 0 0 0 0%LRC 15 0 1 0 7%SAH 22 0 3 1 18%
AVP- Julia Jolly 1 0 0 0 0%HFA 14 0 2 0 14%L&L 1 0 0 0 0%MSE 16 0 0 0 0%P.E., Health & Athletics 21 0 0 0 0%
AVP- Jim Comins 0 0 0 0 0%VPI Totals 217 1 6 4 0 5%
VPSS 2 0 0 0 0%AVP 0 0 0 0 0%Student Services & Enrollment 28 3 0 0 11%Counseling & Student Success 3 1 0 1 67%Matriculation & Student Devel. 12 1 0 0 8%
VPSS Totals 45 5 0 1 0 13%
TOTALS 399 6 6 5 0 4%
*Expected error rate = 0%+/- 5% = Green+/- 10% = Yellow+/- > 10% = Red
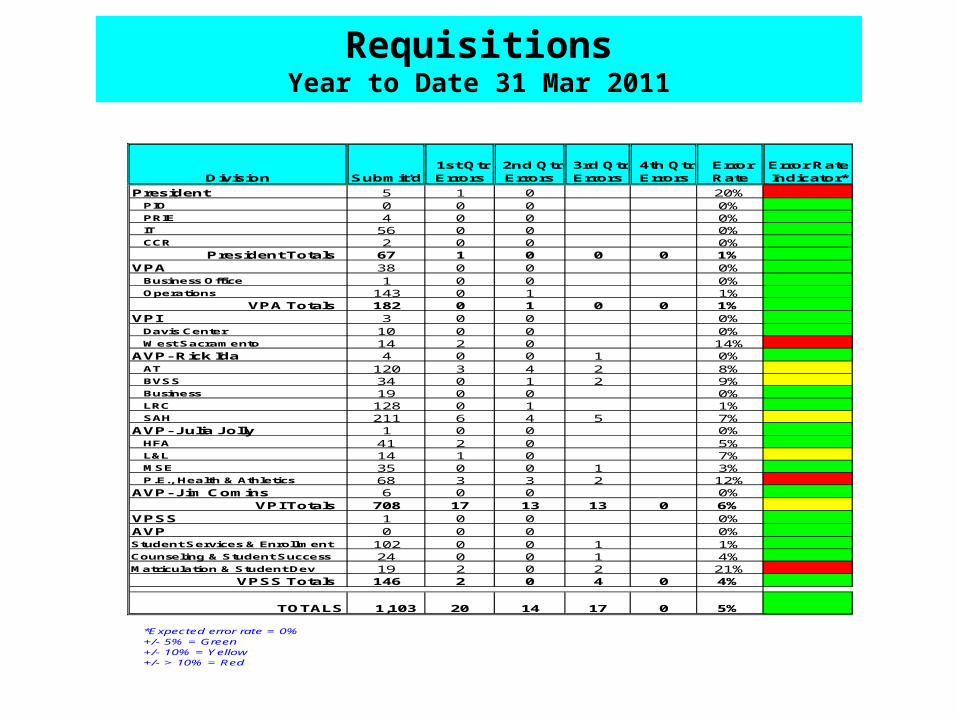
RequisitionsYear to Date 31 Mar 2011
Division
Submit'd 1st Qtr Errors
2nd Qtr Errors
3rd Qtr Errors
4th Qtr Errors
Error Rate
Error Rate Indicator*
President 5 1 0 20%PIO 0 0 0 0%PRIE 4 0 0 0%IT 56 0 0 0%CCR 2 0 0 0%
President Totals 67 1 0 0 0 1%VPA 38 0 0 0%
Business Office 1 0 0 0%Operations 143 0 1 1%
VPA Totals 182 0 1 0 0 1%VPI 3 0 0 0%
Davis Center 10 0 0 0%West Sacramento 14 2 0 14%
AVP- Rick Ida 4 0 0 1 0%AT 120 3 4 2 8%BVSS 34 0 1 2 9%Business 19 0 0 0%LRC 128 0 1 1%SAH 211 6 4 5 7%
AVP- Julia Jolly 1 0 0 0%HFA 41 2 0 5%L&L 14 1 0 7%MSE 35 0 0 1 3%P.E., Health & Athletics 68 3 3 2 12%
AVP- Jim Comins 6 0 0 0%VPI Totals 708 17 13 13 0 6%
VPSS 1 0 0 0%AVP 0 0 0 0%Student Services & Enrollment 102 0 0 1 1%Counseling & Student Success 24 0 0 1 4%Matriculation & Student Dev 19 2 0 2 21%
VPSS Totals 146 2 0 4 0 4%
TOTALS 1,103 20 14 17 0 5%
*Expected error rate = 0%+/- 5% = Green+/- 10% = Yellow+/- > 10% = Red

College TotalsYear to Date 31 Mar 2011
Procedure Submitted 1st Qtr Errors
2nd Qtr
Errors
3rd Qtr
Errors 4th Qtr Errors
Error Rate
Error Rate
Indicator
Absence Reports 2,651 40 28 26 4%
Budget Entries 399 6 6 5 4%
Intents 51 3 8 15 51%
Requisitions 1,103 20 14 17 5%
Travel Authorizations 326 8 19 13 12%
Average all categories 15%

Textbook RequisitionsYear-to-Date Mar 2011
Division Number of Sections Received 03/29/11 Completed
Advanced Technology 139 126 90%
Behavioral and Social Science 490 444 91%
Business 211 204 97%
Counseling 67 60 90%
Humanities and Fine Arts 355 324 91%
Language and Literature 340 320 94%
Learning Resources 14 13 93%
Math and Engineering 175 174 99%
PE, Health & Athletics 32 24 75%
Science and Allied Health 205 198 97%
Total Textbook Requistions 1958 1833 94% _________________________________________________________________________90-100% = Green70-90% = Yellow 0-70% = Red

0
5
10
15
20
25
30
Jan-11 Feb-11 Mar-11 Apr-10 May-10 Jun-10 Jul-10 Aug-10 Sep-10 Oct-10 Nov-10 Dec-10
Tons
0.0%
10.0%
20.0%
30.0%
40.0%
50.0%
60.0%
70.0%
80.0%
90.0%
100.0%
Goal
Mixed Recycle Green Waste Trash % Diversion
SCC Waste Diversion ReportYear-to-Date 3/31/11

SCC Building SummaryYear-to-Date 3/31/11
NameYear
Const.TotalASF 2002 2003 2004 2005 2006 2007 2008 2009 2010 2011 2012 2013 2014 2015
Total Remodel / New ASF
RemainingASF
Rodda Hall North 1975 36,421 1,088 7,995 285 3,023 1,807 2,014 5,623 2,202 280 - - - - - 25,483 10,938Rodda Hall South 1975 34,781 - 8,449 10,240 2,239 2,175 8,903 5,308 819 368 - - - - - 38,501 0
Lillard Hall 1963 27,319 1,125 1,214 1,200 6,250 - - 890 1,125 - - - - - - 14,040 0Mohr Hall 1963 16,694 - - - 693 - 11,848 - - - - - - - 18,238 18,039 0
Learning Resource Center 1998 56,388 - - - - - - 337 - - - - - - - 56,725 0Campus Operations 1966 5,122 - - - - - 5,122 - - - - - - - - 5,122 0
Buisness 1970 29,217 - 628 2,315 1,944 - - 1,397 903 1,215 - - - - 19,286 9,931Union Stadium 1990 5,116 - - - - - - - - - - - - - - 0 5,116
South Gym / Student Center 1969 35,469 692 - - 1,075 316 625 - - 692 - - - - - 7,967 27,502Cafeteria 1939 14,723 - 14,723 - - - - - - - - - - - - 14,723 0
North Gym 1937 29,179 - - - - - - 29,179 - - - - - - - 29,179 0Hoos Pool 1953 17,837 - - 15,869 - - - - - - - - - - - 15,869 1,968
Lusk Aero Center / Bookstore 1938 32,374 - - - 8,175 - - - - 7,025 - - - - - 31,909 465Fine Arts 1939 8,464 - - - - - - - - 10,941 - - - - - 10,941 0
Auditorium 1936 46,429 279 - 10,000 - - - - - - - 54,240 - - - 46,429 0Technology 1957 10,429 - - - 10,429 - - - - - - - - - - 10,429 0
Cosmetology 2005 7,786 - - - - 7,786 - - - - - - - - - 7,786 0Student Services 1957 4,025 - - - - - - - - - - - - 4,025 - 4,025 0Admin of Justice 1957 3,975 - - - - 1,230 3,861 - - - - - - 3,975 - 3,975 0
Temp 11 2005 1,345 - - - - - - - - - - - - Demo 0 0Child Dev Ctr 1992 12,115 - - - 5,729 - 2,114 - - - - - - - - 7,843 4,272
Softball Storage Facility 2002 393 393 - - - - - - - - - - - - - 393 0Temp 3 1965 2,477 - - - - - - - - - - - - - - 0 0Temp 4 2005 907 - - - - - - - - - - - - - - 0 907Temp 5 1995 899 - - - - - - - - - - - - - - 0 899Temp 6 1976 886 - - - - - - - - - - - - - - 0 886
Reprographics 1998 4,361 - - - - - - 96 - - - - - - - 4,457 0Temp 7 1976 883 - - - - - - - - - - - - - - 0 883Temp 1 1980 4,049 - - - 2,666 - - - - - - - - - - 2,666 1,383
Hughes Stadium 1929 42,885 - - - - - - - - - - 42,885 - - - 42,885 0Parking / Police Facility 2007 0 - - - - - 0 - - - - - - - - 0 0
Davis Outreach Ctr 1982 14,000 - - - - - - - - - 14,000 - - - - 14,000 0West Sac Ctr 2010 17,000 - - - - - - - - 17,000 - - - - - 17,000 0
Remodel 533,946 3,577 33,009 39,909 42,223 13,314 34,487 42,830 5,049 37,521 14,000 449,672 65,150New
Demo

Summary & Closing Thoughts• SCC 2011-14 budget plan….a work in progress
– Need your input and insight to further modify– Classified staffing changes will be tough– We MUST consider structural changes
• Metric data provides the feedback loop that lets us target changes and improvements– Your feedback AND INSIGHT are important and
welcomed• Budget challenges remain at least through ‘14
– Unknowns are daunting…..need to be prepared to react/modify to accommodate additional changes
– Management effort evident in controlling costs and Management effort evident in controlling costs and working with the financial constraints—BRAVO!!working with the financial constraints—BRAVO!!
• Keep up the Great Work! Keep up the Great Work!

VTEAAVP
Categorical Program Burn RateYear-to-Date 31 Mar 2011
Division Budgeted Encumbered Expended Total Burn Rate
Advanced Technology 151,457.00 17,831.47 79,858.88 97,690.35 65%
Business 203,669.00 331.24 184,292.50 184,623.74 91%
Behavioral and Social Sciences 38,238.00 0.00 14,365.75 14,365.75 38%
Counseling 71,820.00 528.53 48,752.94 49,281.47 69%
Learning Resources 200,770.00 60.32 122,417.99 122,478.31 61%
Matriculation and Student Development 127,023.00 0.00 84,641.05 84,641.05 67%
Science and Allied Health 103,728.00 1,827.00 41,873.23 43,700.23 42%
Budget Committee/Reserve 119,508.00 0.00 0.00 0.00 0%
Total 1,016,213.00 20,578.56 576,202.34 596,780.90 59%

Basic SkillsAVPI
Categorical Program Burn RateYear-to-Date 31 Mar 2011
Budgeted Expended Burn Rate
Writing Center 57,474.00 19,485.94 34%
Mathematics 28,815.00 13,548.64 47%
Language and Literature 57,250.00 21,942.16 38%
Basic Skills Coordinator 64,653.00 35,088.12 54%
Other Instructional Support 18,405.00 4,303.13 23%
Unallocated 29,306.00 0.00 0%
Total 255,903.00 94,367.99 37%