volume 4 number 6 june 2019 pages 957–1156 reaction
TRANSCRIPT

Reaction Chemistry & Engineering Linking fundamental chemistry and engineering to create scalable, efficient processes
ISSN 2058-9883
rsc.li/reaction-engineering
PAPERJ.-D. Grunwaldt et al.The dynamic nature of Cu sites in Cu-SSZ-13 and the origin of the seagull NO
x conversion profile during NH
3-SCR
Volume 4 Number 6 June 2019 Pages 957–1156

ReactionChemistry &Engineering
PAPER
Cite this: React. Chem. Eng., 2019,
4, 1000
Received 7th November 2018,Accepted 3rd January 2019
DOI: 10.1039/c8re00290h
rsc.li/reaction-engineering
The dynamic nature of Cu sites in Cu-SSZ-13 andthe origin of the seagull NOx conversion profileduring NH3-SCR†
A. R. Fahami,ad T. Günter,a D. E. Doronkin,ab M. Casapu, a D. Zengel,a T. H. Vuong,e
M. Simon,c F. Breher, c A. V. Kucherov,f A. Brückner e and J.-D. Grunwaldt *ab
Cu-Zeolites with chabazite structure show a peculiar dual-maxima NO conversion profile, also known as a
seagull profile, during the selective catalytic reduction by ammonia. In order to understand the origin of this
behavior, systematic catalytic tests and operando spectroscopy were applied to derive structure–performance
relationships for Cu-SSZ-13 catalysts with low and high Cu loading. Operando X-ray absorption, X-ray emis-
sion and in situ electron paramagnetic resonance spectroscopy measurements, including novel photon-in/
photon-out techniques, demonstrated the interconversion of isolated Cu sites and dimeric bisIJμ-oxo) Cu spe-
cies, the former occurring via formation of ammonia Cu2+/Cu+ complexes and the latter in an oxidizing gas
mixture. The formation of dimeric Cu+–O2–Cu+ species by involving Cu sites in close vicinity was linked to the
high activity at low temperatures of the highly loaded Cu-SSZ-13 sample. In contrast, the isolated Cu sites
present at very low Cu loadings are strongly poisoned by adsorbed NH3. The activity decrease around 350 °C
that gives rise to the seagull shaped NO conversion profile could be attributed to a more localized structure of
monoIJμ-oxo)dicopper complexes. Above this temperature, which corresponds to partial NH3 desorption from
Cu sites, the isolated Cu sites migrate to form additional dimeric entities thus recovering the SCR activity.
1. Introduction
Selective catalytic reduction (SCR) of nitrogen oxides (NOx)with NH3 is currently a leading technology to reduce NOx
emissions from diesel engines to nitrogen and water.1,2 Themain part of NOx emissions from a diesel engine is nitric ox-ide (NO), which is mostly removed via the so-called standardSCR reaction that involves equimolar conversion of NO andNH3.
3 If NO2 is present in the gas mixture, e.g. from an up-stream positioned diesel oxidation catalyst, it has been shownthat the catalytic reduction occurs via a different reaction,Fast SCR, where the reduction of NOx by NH3 takes place at arelatively lower temperature and with a higher reaction rate.4
Zeolites and zeotypes with chabazite structure (CHA) likeSSZ-13 or SAPO-34 ion-exchanged with Cu have shown highactivity and resistance to harsh hydrothermal ageing, whichattracted tremendous attention of industry and academia.5–7
Despite commercial applications of Cu-SSZ-13, the natureand location of the active Cu sites, the interaction of the reac-tants in different reaction regimes, and the mechanism ofthe SCR reactions have not yet been fully understood.8 Thereis a general agreement on the redox cycle of Cu in StandardSCR9,10 and several mechanisms for the SCR reactions wereproposed.10–16 The basis of this controversial point of view isthe nature of Cu species and the difficulties of monitoringthe active sites under reaction conditions. Many studies havebeen carried out to observe the active species, suggesting Cudimers (e.g., [Cu–O–Cu]2+),16,17 monomers (e.g., Cu2+),18–20 ormultinuclear clusters (e.g., CuxOy).
11,13,21 Furthermore, theirpreferential location at the six or eight member ring (MR) aswell as the coordination to a single or two adjacent Al sites isnot yet clarified.11,22,23 This scope becomes more complexsince depending on the Cu/Al and Si/Al ratios, and even theutilized method to synthesise the catalyst, different forms ofCu can emerge, which seem to be mobile in the cage of thezeolite under certain conditions.9,16
An atypical phenomenon recognized for Cu-SSZ-13 duringStandard SCR reaction is the decrease followed by the in-crease of the NO conversion, generally between 250–350 °C,7
1000 | React. Chem. Eng., 2019, 4, 1000–1018 This journal is © The Royal Society of Chemistry 2019
a Institute for Chemical Technology and Polymer Chemistry, Karlsruhe Institute of
Technology, 76131 Karlsruhe, Germany. E-mail: [email protected] Institute of Catalysis Research and Technology, Karlsruhe Institute of
Technology, 76344 Eggenstein-Leopoldshafen, Germanyc Institute of Inorganic Chemistry, Karlsruhe Institute of Technology, 76131
Karlsruhe, GermanydDipartimento di Energia, Laboratorio di Catalisi e Processi Catalitici, Politecnico
di Milano, Via La Masa 34, 20133 Milano, Italye Leibniz-Institut für Katalyse e. V. an der Universität Rostock (LIKAT), Albert-
Einstein-Str. 29a, 18059 Rostock, Germanyf N.D. Zelinsky Institute of Organic Chemistry, Leninsky pr. 47, 119991 Moscow,
Russia
† Electronic supplementary information (ESI) available. See DOI: 10.1039/c8re00290h
Ope
n A
cces
s A
rtic
le. P
ublis
hed
on 0
3 Ja
nuar
y 20
19. D
ownl
oade
d on
4/8
/202
2 11
:08:
24 A
M.
Thi
s ar
ticle
is li
cens
ed u
nder
a C
reat
ive
Com
mon
s A
ttrib
utio
n-N
onC
omm
erci
al 3
.0 U
npor
ted
Lic
ence
.
View Article OnlineView Journal | View Issue

React. Chem. Eng., 2019, 4, 1000–1018 | 1001This journal is © The Royal Society of Chemistry 2019
which is referred to as the “seagull” profile. The origin of thiseffect that appears for intermediate Cu loadings (0.5–3wt%)24 is a strongly debated topic.13,25 It was observed thatthe seagull profile is more pronounced when the space veloc-ity is high, O2 content is low, for lower Cu loadings as well aswhen hydrocarbons are present in the feed.7,25–27 Joshiet al.25 claimed that the competition between SCR and NH3
oxidation is the reason of the activity drop, and the contribu-tion of the NO oxidation enables Fast SCR at higher tempera-tures. A different nature of the Cu sites at low and high tem-perature has been also discussed by several authors. Basedon kinetic tests for a catalyst series and DFT calculations,Gao and co-workers13,24 proposed transient Cu-dimers as rel-evant species at low temperature, which are then split tomonomeric sites with lower deNOx activity at higher tempera-ture. Such dimeric Cu intermediates seem to facilitate fastreoxidation of Cu+ sites, which are formed during reaction ofNO and NH3,
12,14 thus, allowing a closed catalytic cycle. Theidea of forming dimeric Cu species was supported by the mo-lecular dynamics (MD) calculations of Paolucci et al.16 Thepresence of different sites at low and high temperature wasalso tackled by Lomachenko et al.,28 who proposed mobileNH3-solvated Cu+/Cu2+ species as active sites up to 200 °Cand the zeolite framework-coordinated Cu2+ (Z-Cu2+) to bethe dominant active species above 250 °C. In the low-temperature range, the standard SCR rate shows a linear de-pendency for intermediate Cu concentrations but a quadraticvariation for very low Cu loadings. For the last case, recentstudies reported that such isolated sites are not able to acti-vate O2 for NO oxidation to NO2,
29 a step still considered nec-essary for the standard SCR reaction. The activation of O2 bytwo [CuIJNH3)2]
+ combined with a facilitated formation ofsuch multinuclear sites were also proposed as mandatory indescribing the SCR mechanism.16
In the present work, we aimed at understanding the sea-gull profile of the SCR conversion for Cu-SSZ-13 by analysingthe dynamic structural and electronic changes of the Cu sitesduring interaction with the SCR and related gas mixtures, atdifferent temperatures below and above the seagull point.Systematic catalytic tests under various reaction conditionswere applied for two Cu-SSZ-13 catalysts with different Culoadings and strong variations in SCR activity around the sea-gull region. By using operando XAS and XES spectroscopy in aspatially resolved manner along the catalyst bed located in aplug-flow reactor, accurate structure–activity correlationscould be derived. This was supplemented by in situ EPRspectroscopy measurements, to uncover variations innuclearity of Cu sites under relevant reaction conditions.
2. Experimental part2.1 Catalyst synthesis
Na-SSZ-13 was prepared by a method similar to Deka19 andZones30 that has been described earlier.12 First, a mixture of0.67 g sodium hydroxide, 41.1 g deionised water, 14.8 g N,N,N-trimethyladamantylammonium hydroxide (TMAdOH, 25
wt%, Sachem) and 0.43 g aluminium hydroxide was stirredfor 30 min. 13.0 g colloidal silica (Ludox® AS-40) was addedand mixed for another 10 min. The as prepared gel was trans-ferred into a 200 ml Teflon-lined autoclave and aged at roomtemperature for 2 h before heating it statically for 4 days at160 °C. The resulting slurry was filtered, washed with 1 Ldeionised water and dried at 80 °C before calcination at 550°C for 2 h. To remove the sodium ions, the as prepared Na-SSZ-13 was ion exchanged with aqueous 1 M NH4NO3 solu-tion (20 mL g−1 zeolite) for 2 h at 75 °C, washed withdeionised water, dried at 80 °C and calcined at 550 °C for 2h. These steps were repeated for further two times withoutcalcination after the final step to receive NH4-SSZ-13. A Cuion exchange was conducted with 2 g NH4-SSZ-13 in 200 ml0.001 M or 0.005 M CuIJOAc)2 solution at room temperaturefor 24 h. The suspension was filtered, washed with 1 Ldeionised water, dried at 80 °C and calcined at 550 °C for8 h. The elemental analysis gave a Si/Al-ratio of 16 and a Cu-loading of 0.5 wt% for the low loaded sample and 1.2 wt%for the higher loaded sample (about 45% ion exchange de-gree). The BET-surface area of the resulting 1.2% Cu-SSZ-13sample is 590 m2 g−1. For the sake of simplicity, 0.5% Cu-SSZ-13 and 1.2% Cu-SSZ-13 are referred to as Cu-0.5 and Cu-1.2 respectively in the rest of the text.
2.2 Catalytic tests
The catalytic measurements were performed in a laboratorysetup with a fixed-bed plug-flow quartz tube reactor (inner di-ameter: 8 mm). 250 mg of the sample (sieve fraction: 125–250 μm) was mixed with 250 mg quartz sand (same sieve frac-tion) and loaded into the reactor to obtain a bed length ofabout 1 cm, which was hold in position by quartz wool plugs.The temperature was measured with thermocouples at thebeginning and end of the catalyst bed. Gases were dosed withindividual mass flow controllers via heated lines to get a mix-ture of 0–1000 ppm NO, 0–1000 ppm NH3, 10 vol% O2, 5vol% H2O and N2 balance. The gas hourly space velocity(GHSV) was kept at 200 000 h−1 during all measurements.The outlet gas was analysed by MKS MultiGas 2030 FTIRanalyser.
To evaluate the extent of the potential ammonia inhibitionthe following experiments have been carried out: standardSCR was evaluated with the NH3 to NO ratio ranging from 0.1to 1.25 (feeding 1000 ppm NO, 100–1250 ppm NH3, 2 vol%H2O and 8 vol% O2 with a GHSV of 200 000 h−1 and N2 as bal-ance) at several temperatures of 190, 235, 285 and 330 °C.The effect of water addition was also investigated by varyingthe water concentration in the standard SCR feed between 0–5 vol%.
2.3 Catalyst characterization
2.3.1 Diffuse reflectance UV-vis spectroscopy. UV-vis spec-tra were acquired on a PerkinElmer Lambda 650 instrumentequipped with a Harrick Praying Mantis diffuse reflectanceaccessory. Spectra were recorded ex situ, without any
Reaction Chemistry & Engineering Paper
Ope
n A
cces
s A
rtic
le. P
ublis
hed
on 0
3 Ja
nuar
y 20
19. D
ownl
oade
d on
4/8
/202
2 11
:08:
24 A
M.
Thi
s ar
ticle
is li
cens
ed u
nder
a C
reat
ive
Com
mon
s A
ttrib
utio
n-N
onC
omm
erci
al 3
.0 U
npor
ted
Lic
ence
.View Article Online

1002 | React. Chem. Eng., 2019, 4, 1000–1018 This journal is © The Royal Society of Chemistry 2019
pretreatment, from pressed and sieved catalysts (sieve frac-tion: 125–250 μm). Spectralon® was used as a reference.
2.3.2 Electron paramagnetic resonance. Ex situ EPR spec-tra of the powdered samples were recorded using a BrukerEMXplus continuous wave (cw) X-band spectrometer, by fill-ing the samples into fused silica glass tubes. In all cases,EPR spectra were analysed and simulated using the EasySpinMATLAB toolbox.31 In situ EPR spectra were recorded by anX-band cw-spectrometer ELEXSYS 500-10/12 (Bruker) using amicrowave power of 6.3 mW, and a modulation frequencyand amplitude of 100 kHz and 5 G, respectively. Spectra sim-ulation was performed using the program EasySpin. In situand operando EPR experiments were performed in a home-made quartz plug-flow reactor connected to a gas-dosing de-vice with mass flow controllers (Bronkhorst) at the inlet anda quadrupole mass spectrometer (Omnistar, Pfeiffer VacuumGmbH) at the outlet for on-line product analysis. This reactorwas filled with 50 mg of catalyst particles (250–350 μm). Theimpact of catalyst dehydration was investigated by treatingthe samples at 300 °C in a 20% O2/Ar flow of 50 ml min−1 for1 h. Next, the reactor was cooled to 250 °C in Ar, where EPRspectra were recorded. For investigating the state of the Cusites in the presence of SCR related gas mixtures, the cata-lysts were exposed at 250 °C at first to 2000 ppm NH3/Ar,followed by 2000 ppm NO in 10% O2/Ar, and finally by theSCR mixture consisting of 2000 ppm NH3, 2000 ppm NO,10% O2 and Ar as balance. The reactor was flushed with Arbetween different reaction conditions. Although the in situEPR investigations were conducted with higher NO and NH3
concentrations (i.e. 2000 ppm vs. 1000 ppm for the catalyticand operando experiments), we do not expect a significant ef-fect on the catalyst structure under the steady-state condi-tions used in this study.
2.3.3 Conventional X-ray absorption spectroscopy.Operando (i.e. measured under reaction conditions with si-multaneous measurements of conversion/kinetics) XAS mea-surements were performed at the SuperXAS beamline (SLS,Villigen, Switzerland) using a fast oscillating Si (111) channel-cut monochromator.32 Measurements were carried out at theCu K edge (8979 eV) in transmission geometry. The catalysts(Cu-0.5: 5.2 mg, Cu-1.2: 6.2 mg) were loaded in 1.5 mm (o.d.)quartz capillary microreactors (wall thickness: 20 μm, catalystbed length of about 7 mm) which served as plug-flow reac-tors33 and placed above a hot gas blower for heating. Differ-ent gas mixtures containing up to 1000 ppm NO and/or NH3
(α = 0–1), 0–10% O2, 0–1.5% H2O and He balance were dosedresulting in a GHSV of 200 000 h−1. Gases were dosed viamass flow controllers, whereas water was fed via a saturator.The temperature was varied from room temperature to 500°C. The gas composition was analysed by a MKS MultiGas2030 FTIR analyser after diluting the resulting gas mixture(50 ml min−1) to the minimum recommended gas flow forthe FTIR instrument (∼350 ml min−1). XAS spectra wererecorded at six and five positions along the catalyst bed forCu-0.5 and Cu-1.2 respectively with a beam size of about 200× 200 μm2, while applying different SCR-related gas mixtures.
For temperature programmed reduction by ammonia com-bined with XANES (TPR-XANES) the catalysts were first pre-treated in flow of 10% O2 in He at 550 °C for 10 min, thencooled down to 30 °C and exposed to a flow of 1000 ppmNH3, 0–1.5% H2O in He (GHSV of 200 000 h−1) while heatingwith 10 K min−1 rate up to 550 °C.
Linear combination analysis (LCA) of the XANES regionfrom −20 eV to +30 eV around the absorption edge was usedto determine the state of Cu in spatially-resolved XAS spec-tra measured during SCR. ATHENA software from theIFFEFIT package was used for data analysis.34 PrincipalComponent Analysis (PCA, as available in the Demeter pack-age) identified the presence of three components in thespectra, one of these components proved to be Cu2+. As ref-erences, the spectra of Cu-0.5 and Cu-1.2 measured in 1000ppm NO, 10% O2, 1.5% H2O in He at the temperature ofthe corresponding experiment were used for representingCu2+. Therefore, any nitrate/nitrite species formed under thegiven conditions were considered in the LCA. Two other ref-erences spectra for Cu+ with and without directly adsorbedammonia could not be measured separately and insteadwere extracted from the set of spectra obtained duringtemperature-programmed reduction of Cu-0.5 by NH3 usingmultivariate curve resolution-alternating least squaresmethod (MCR-ALS).35,36 This mathematical procedure usedin chemometrics allows extraction of a priori unknown spec-tra of reference compounds from a set of spectra of a mix-ture with changing concentrations. The technique is similarto PCA, but it allows setting appropriate physical constraintsto the components which permits obtaining meaningfulspectra. In our case constraint of non-negativity was appliedto the matrix of reference spectra and constraints ofunimodality (i.e., having only one maximum) were appliedto concentration profiles. The obtained reference spectra in-deed demonstrated all the features of Cu+ with and withoutdirectly adsorbed ammonia as previously described in ref. 9and 12 and were assigned correspondently. MCR-ALS wasrequired because the direct use of spectra available in litera-ture as references for the LCA is not possible due to differ-ences in spectral resolution, and Cu-0.5 dataset was chosensince the individual features of the spectra were better re-solved in this case. In the case of Cu-1.2, even at high tem-perature the last spectrum shows the contribution of Cu+
with directly adsorbed ammonia.EXAFS spectra were background subtracted, normalized,
k2-weighted and Fourier transformed in the k range 2–11.5Å−1 using ATHENA and fitting was performed using ARTE-MIS.34 E0 was selected at 8989 eV corresponding to the in-flection point of the rising edge not taking into account theshoulder at 8983 eV related to Cu+ species. The data fittingwas performed in R-space between 1 and 3.5 Å (uncorrectedfor the phase shift) on the k1-, k2-, and k3-weighted data(corresponding to the first Cu–O and Cu–Cu shells). Fromthe fits of reference spectrum of CuO the amplitude reduc-tion factor S0
2 = 0.7 was obtained and used to analyse thecatalyst spectra.
Reaction Chemistry & EngineeringPaper
Ope
n A
cces
s A
rtic
le. P
ublis
hed
on 0
3 Ja
nuar
y 20
19. D
ownl
oade
d on
4/8
/202
2 11
:08:
24 A
M.
Thi
s ar
ticle
is li
cens
ed u
nder
a C
reat
ive
Com
mon
s A
ttrib
utio
n-N
onC
omm
erci
al 3
.0 U
npor
ted
Lic
ence
.View Article Online

React. Chem. Eng., 2019, 4, 1000–1018 | 1003This journal is © The Royal Society of Chemistry 2019
2.3.4 High energy resolution fluorescence detected XASand valence-to-core X-ray emission spectroscopy. High-en-ergy-resolution fluorescence-detected X-ray absorption nearedge structure (HERFD-XANES) and valence-to-core (vtc)X-ray emission spectroscopy (XES) measurements, as novelphoton-in/photon-out techniques, were performed at theID26 beamline of the European Synchrotron Radiation Facil-ity (ESRF, Grenoble, France).37 X-rays were provided by threemechanically independent undulators, higher harmonicswere suppressed by Si coated mirrors operated in total re-flection mode. The incident beam energy was selected by aSi (111) double crystal monochromator and the beam washorizontally and vertically focused by a pair of mirrors.Fluorescence X-rays were collected by an X-ray spectrometerusing the (800) reflection of two spherically bent Ge crystals,the photons were counted by an avalanche photodiode. Themonochromator energy calibration was performed by mea-suring Cu foil in transmission mode. The spectrometer en-ergy calibration was carried out by keeping the spectrometerenergy set at 8903 eV and scanning the energy of the mono-chromator to record the elastic peak.
For the HERFD-XANES measurements the monochroma-tor energy was scanned while the spectrometer was keptfixed at the maximum of the Kβ1,3 emission line (8903.6 eV),the spectra were then normalized based on the edge step. Forthe vtc-XES measurements the incident energy was kept con-stant above the Cu K absorption edge at 9100.0 eV and thespectrometer scanned the X-rays emitted by the sample. Thevalence-to-core spectra were first normalized based on thearea of the Kβ1,3 emission lines. Then, the valence-to-coredata was subtracted from the tail of the Kβ1,3 emission linewith the background approximated by four pseudo Voigtfunctions.38 Gas flow dosing unit and the capillary micro-reactor were identical to the ones used for conventional XAS(section 2.3.3). The X-ray beam size was 0.2 × 1 mm and themeasurements were performed at a distance of approx. 0.5mm from the beginning of the catalyst bed unless statedotherwise.
3. Results3.1 Catalytic tests of two differently loaded Cu-SSZ-13catalysts
Cu-Chabazites with Cu loadings below and above approx. 1wt% typically show markedly different catalytic activity inNH3-SCR, with higher NOx conversion at lower temperaturesover the higher loaded zeolites and also showing the “sea-gull” shape (dual-maxima) conversion profile.7,24,25 In thisstudy two samples were selected as representative for thesetwo categories containing 0.5 and 1.2 wt% Cu, respectively.Although characteristic for the commercial Cu-chabazite cata-lysts, an even higher concentration of Cu was not consideredto avoid the formation of excessive “spectator” Cu species,39
which could attenuate relevant spectroscopic variations. Theactivity profiles recorded for the Cu-1.2 and Cu-0.5 samples(Fig. 1a) illustrate the positive effect of a higher Cu loading,especially for the low temperature region. At 300 °C about90% of NO is reduced over the Cu-1.2 catalyst whereas only23% NOx conversion was obtained with the Cu-0.5 sample. Inaddition, the highly loaded sample shows a better definedseagull profile, with the first conversion maximum at approx.300 °C and the second one above 400 °C. On the contrary,considerable NOx conversion over the low loaded Cu-0.5 isobtained only at higher temperatures (>400 °C), correspond-ing to the second maximum in the activity profile of Cu-1.2catalyst. Even by decreasing the GHSV, to have a similar flowvs. amount of Cu during the activity tests (Fig. S1†), the lowloaded catalyst showed a significantly lower NOx conversion.The consumption of NH3 during the standard SCR reactionis for both catalysts close to the stoichiometric ratio up to350 °C (Fig. 1b), which minimizes any correlation betweenthe decrease of the activity around 350 °C andoverconsumption of NH3 due to parasitic oxidation.
Similar screening of Cu loading was previouslyperformed and comparable results were obtained for CuSSZ-13 catalysts with different Si : Al ratios.18,20,23 This differ-ence in activity was so far related to the presence of
Fig. 1 Conversion of NOx and production of N2O (a), and conversion of NH3 (b) measured during NH3–SCR over the tested Cu-zeolites measuredin the laboratory plug-flow reactor. Conditions: 1000 ppm NO, 1000 ppm NH3, 10% O2, 5% H2O, balance N2, GHSV 200000 h−1.
Reaction Chemistry & Engineering Paper
Ope
n A
cces
s A
rtic
le. P
ublis
hed
on 0
3 Ja
nuar
y 20
19. D
ownl
oade
d on
4/8
/202
2 11
:08:
24 A
M.
Thi
s ar
ticle
is li
cens
ed u
nder
a C
reat
ive
Com
mon
s A
ttrib
utio
n-N
onC
omm
erci
al 3
.0 U
npor
ted
Lic
ence
.View Article Online
1004 | React. Chem. Eng., 2019, 4, 1000–1018 This journal is © The Royal Society of Chemistry 2019
different Cu sites: close to the 6-member-rings of CHAframework (6MR) for low loadings and close to the 8MR forzeolites with an increased Cu content,11 to formation andsplitting of Cu sites of different nuclearity and reactivity,24
or attributed to a change in the rate limiting step.40 In con-trast to the SCR performance, only minor differences wereobserved during oxidation of NH3 and NO (Fig. S2†). Bothcatalysts convert less than 10% NO even at 500 °C. NH3
conversion is significant only above 400 °C, and reaches55% over Cu-1.2 and 30% over Cu-0.5 at 450 °C.
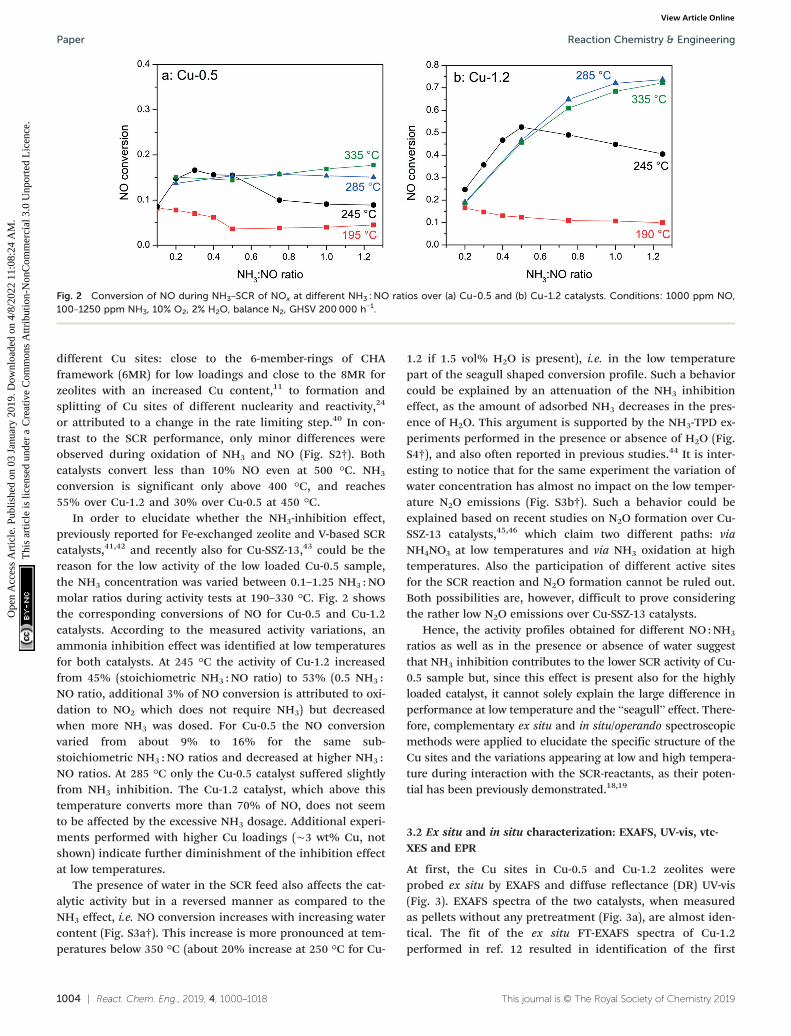
In order to elucidate whether the NH3-inhibition effect,previously reported for Fe-exchanged zeolite and V-based SCRcatalysts,41,42 and recently also for Cu-SSZ-13,43 could be thereason for the low activity of the low loaded Cu-0.5 sample,the NH3 concentration was varied between 0.1–1.25 NH3 : NOmolar ratios during activity tests at 190–330 °C. Fig. 2 showsthe corresponding conversions of NO for Cu-0.5 and Cu-1.2catalysts. According to the measured activity variations, anammonia inhibition effect was identified at low temperaturesfor both catalysts. At 245 °C the activity of Cu-1.2 increasedfrom 45% (stoichiometric NH3 : NO ratio) to 53% (0.5 NH3 :NO ratio, additional 3% of NO conversion is attributed to oxi-dation to NO2 which does not require NH3) but decreasedwhen more NH3 was dosed. For Cu-0.5 the NO conversionvaried from about 9% to 16% for the same sub-stoichiometric NH3 : NO ratios and decreased at higher NH3 :NO ratios. At 285 °C only the Cu-0.5 catalyst suffered slightlyfrom NH3 inhibition. The Cu-1.2 catalyst, which above thistemperature converts more than 70% of NO, does not seemto be affected by the excessive NH3 dosage. Additional experi-ments performed with higher Cu loadings (∼3 wt% Cu, notshown) indicate further diminishment of the inhibition effectat low temperatures.
The presence of water in the SCR feed also affects the cat-alytic activity but in a reversed manner as compared to theNH3 effect, i.e. NO conversion increases with increasing watercontent (Fig. S3a†). This increase is more pronounced at tem-peratures below 350 °C (about 20% increase at 250 °C for Cu-
1.2 if 1.5 vol% H2O is present), i.e. in the low temperaturepart of the seagull shaped conversion profile. Such a behaviorcould be explained by an attenuation of the NH3 inhibitioneffect, as the amount of adsorbed NH3 decreases in the pres-ence of H2O. This argument is supported by the NH3-TPD ex-periments performed in the presence or absence of H2O (Fig.S4†), and also often reported in previous studies.44 It is inter-esting to notice that for the same experiment the variation ofwater concentration has almost no impact on the low temper-ature N2O emissions (Fig. S3b†). Such a behavior could beexplained based on recent studies on N2O formation over Cu-SSZ-13 catalysts,45,46 which claim two different paths: viaNH4NO3 at low temperatures and via NH3 oxidation at hightemperatures. Also the participation of different active sitesfor the SCR reaction and N2O formation cannot be ruled out.Both possibilities are, however, difficult to prove consideringthe rather low N2O emissions over Cu-SSZ-13 catalysts.
Hence, the activity profiles obtained for different NO :NH3
ratios as well as in the presence or absence of water suggestthat NH3 inhibition contributes to the lower SCR activity of Cu-0.5 sample but, since this effect is present also for the highlyloaded catalyst, it cannot solely explain the large difference inperformance at low temperature and the “seagull” effect. There-fore, complementary ex situ and in situ/operando spectroscopicmethods were applied to elucidate the specific structure of theCu sites and the variations appearing at low and high tempera-ture during interaction with the SCR-reactants, as their poten-tial has been previously demonstrated.18,19
3.2 Ex situ and in situ characterization: EXAFS, UV-vis, vtc-XES and EPR
At first, the Cu sites in Cu-0.5 and Cu-1.2 zeolites wereprobed ex situ by EXAFS and diffuse reflectance (DR) UV-vis(Fig. 3). EXAFS spectra of the two catalysts, when measuredas pellets without any pretreatment (Fig. 3a), are almost iden-tical. The fit of the ex situ FT-EXAFS spectra of Cu-1.2performed in ref. 12 resulted in identification of the first
Fig. 2 Conversion of NO during NH3–SCR of NOx at different NH3 :NO ratios over (a) Cu-0.5 and (b) Cu-1.2 catalysts. Conditions: 1000 ppm NO,100–1250 ppm NH3, 10% O2, 2% H2O, balance N2, GHSV 200000 h−1.
Reaction Chemistry & EngineeringPaper
Ope
n A
cces
s A
rtic
le. P
ublis
hed
on 0
3 Ja
nuar
y 20
19. D
ownl
oade
d on
4/8
/202
2 11
:08:
24 A
M.
Thi
s ar
ticle
is li
cens
ed u
nder
a C
reat
ive
Com
mon
s A
ttrib
utio
n-N
onC
omm
erci
al 3
.0 U
npor
ted
Lic
ence
.View Article Online
React. Chem. Eng., 2019, 4, 1000–1018 | 1005This journal is © The Royal Society of Chemistry 2019
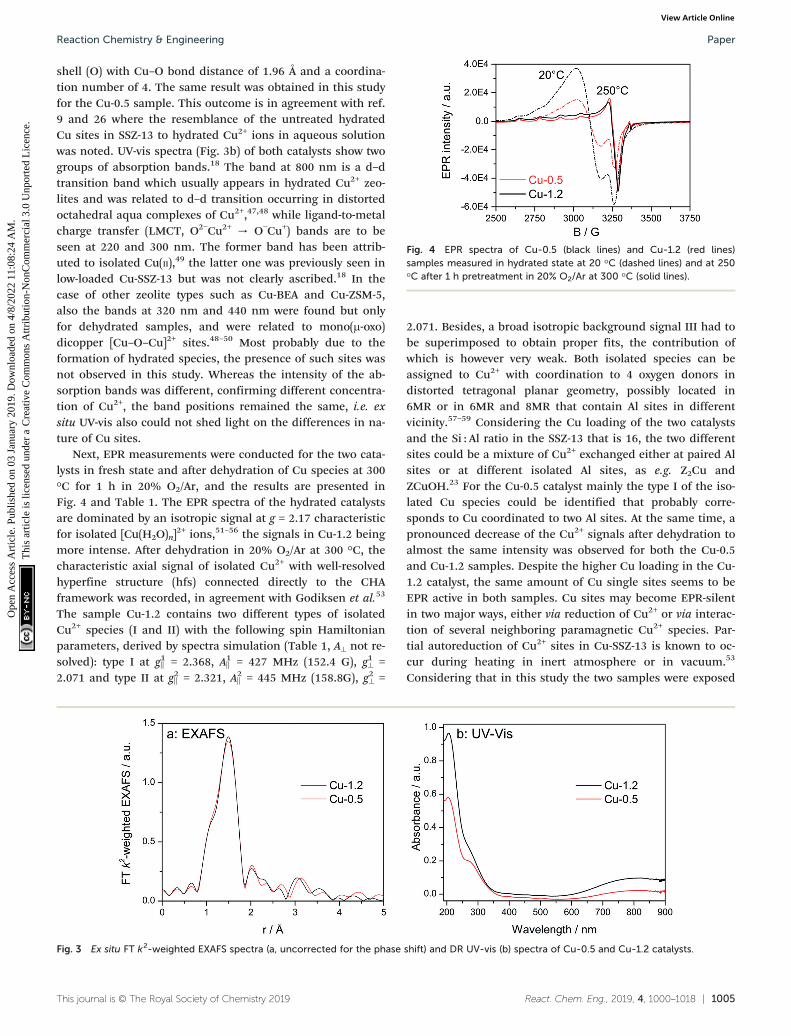
shell (O) with Cu–O bond distance of 1.96 Å and a coordina-tion number of 4. The same result was obtained in this studyfor the Cu-0.5 sample. This outcome is in agreement with ref.9 and 26 where the resemblance of the untreated hydratedCu sites in SSZ-13 to hydrated Cu2+ ions in aqueous solutionwas noted. UV-vis spectra (Fig. 3b) of both catalysts show twogroups of absorption bands.18 The band at 800 nm is a d–dtransition band which usually appears in hydrated Cu2+ zeo-lites and was related to d–d transition occurring in distortedoctahedral aqua complexes of Cu2+,47,48 while ligand-to-metalcharge transfer (LMCT, O2−Cu2+ → O−Cu+) bands are to beseen at 220 and 300 nm. The former band has been attrib-uted to isolated CuIJII),49 the latter one was previously seen inlow-loaded Cu-SSZ-13 but was not clearly ascribed.18 In thecase of other zeolite types such as Cu-BEA and Cu-ZSM-5,also the bands at 320 nm and 440 nm were found but onlyfor dehydrated samples, and were related to monoIJμ-oxo)dicopper [Cu–O–Cu]2+ sites.48–50 Most probably due to theformation of hydrated species, the presence of such sites wasnot observed in this study. Whereas the intensity of the ab-sorption bands was different, confirming different concentra-tion of Cu2+, the band positions remained the same, i.e. exsitu UV-vis also could not shed light on the differences in na-ture of Cu sites.
Next, EPR measurements were conducted for the two cata-lysts in fresh state and after dehydration of Cu species at 300°C for 1 h in 20% O2/Ar, and the results are presented inFig. 4 and Table 1. The EPR spectra of the hydrated catalystsare dominated by an isotropic signal at g = 2.17 characteristicfor isolated [CuIJH2O)n]
2+ ions,51–56 the signals in Cu-1.2 beingmore intense. After dehydration in 20% O2/Ar at 300 °C, thecharacteristic axial signal of isolated Cu2+ with well-resolvedhyperfine structure (hfs) connected directly to the CHAframework was recorded, in agreement with Godiksen et al.53
The sample Cu-1.2 contains two different types of isolatedCu2+ species (I and II) with the following spin Hamiltonianparameters, derived by spectra simulation (Table 1, A⊥ not re-solved): type I at g1∥ = 2.368, A1∥ = 427 MHz (152.4 G), g1⊥ =2.071 and type II at g2∥ = 2.321, A2∥ = 445 MHz (158.8G), g2⊥ =
2.071. Besides, a broad isotropic background signal III had tobe superimposed to obtain proper fits, the contribution ofwhich is however very weak. Both isolated species can beassigned to Cu2+ with coordination to 4 oxygen donors indistorted tetragonal planar geometry, possibly located in6MR or in 6MR and 8MR that contain Al sites in differentvicinity.57–59 Considering the Cu loading of the two catalystsand the Si : Al ratio in the SSZ-13 that is 16, the two differentsites could be a mixture of Cu2+ exchanged either at paired Alsites or at different isolated Al sites, as e.g. Z2Cu andZCuOH.23 For the Cu-0.5 catalyst mainly the type I of the iso-lated Cu species could be identified that probably corre-sponds to Cu coordinated to two Al sites. At the same time, apronounced decrease of the Cu2+ signals after dehydration toalmost the same intensity was observed for both the Cu-0.5and Cu-1.2 samples. Despite the higher Cu loading in the Cu-1.2 catalyst, the same amount of Cu single sites seems to beEPR active in both samples. Cu sites may become EPR-silentin two major ways, either via reduction of Cu2+ or via interac-tion of several neighboring paramagnetic Cu2+ species. Par-tial autoreduction of Cu2+ sites in Cu-SSZ-13 is known to oc-cur during heating in inert atmosphere or in vacuum.53
Considering that in this study the two samples were exposed
Fig. 3 Ex situ FT k2-weighted EXAFS spectra (a, uncorrected for the phase shift) and DR UV-vis (b) spectra of Cu-0.5 and Cu-1.2 catalysts.
Fig. 4 EPR spectra of Cu-0.5 (black lines) and Cu-1.2 (red lines)samples measured in hydrated state at 20 °C (dashed lines) and at 250°C after 1 h pretreatment in 20% O2/Ar at 300 °C (solid lines).
Reaction Chemistry & Engineering Paper
Ope
n A
cces
s A
rtic
le. P
ublis
hed
on 0
3 Ja
nuar
y 20
19. D
ownl
oade
d on
4/8
/202
2 11
:08:
24 A
M.
Thi
s ar
ticle
is li
cens
ed u
nder
a C
reat
ive
Com
mon
s A
ttrib
utio
n-N
onC
omm
erci
al 3
.0 U
npor
ted
Lic
ence
.View Article Online

1006 | React. Chem. Eng., 2019, 4, 1000–1018 This journal is © The Royal Society of Chemistry 2019
to Ar after dehydration in 20% O2/Ar at 300 °C, the auto-reduction of the Cu sites was checked under similar condi-tions by in situ XAS. The results obtained indicate a virtuallyidentical extent of Cu2+ to Cu+ reduction in both catalysts at300 °C (not shown). Therefore, such a process cannot explainthe almost perfect overlap of the EPR spectra for thedehydrated low and highly loaded Cu catalysts. Hence, thebroad isotropic line III (Table 1) might reflect magneticallyinteracting Cu2+ species, e.g. dimeric species or Cu sites lo-cated in close vicinity. Such species bridged by hydroxylgroups or oxygen have been previously claimed in literaturefor Cu-SSZ-13 and other Cu-exchanged zeolites.49,50
Vtc-XES spectra of the dehydrated samples at 350 °C indry air (Fig. 5a) show nearly identical Kβ″ (8958 eV) and Kβ2,5(8970–8980 eV) spectral features, which are typical for oxi-dized Cu species in Cu-SSZ-13 directly linked to oxygen.33,60,61
However, in the high-energy side of the spectra clear differ-ences were observed. All features above 8980 eV are muchmore pronounced for the low-loaded Cu-0.5 sample in com-parison to the highly-loaded Cu-SSZ-13 (note that both spec-tra are normalized by the maximum intensity of Kβ1,3 emis-sion line). This once again suggests alterations in thestructure of Cu due to the presence of another Cu site inclose vicinity. Nonetheless, DFT calculations of the XES spec-tra would be necessary in the future to precisely elucidatetheir nature.
EXAFS of dehydrated catalysts is presented in Fig. 5b andfitting results can be found in the ESI† (Table S1). For bothsamples a coordination number of about three was obtainedfor the first coordination shell corresponding to Cu–O bond-ing. This decrease of the coordination number has been pre-viously assigned to dehydration of Cu2+ coordinated to iso-lated Al sites.23 In the spectrum of Cu-1.2 the second shell oflower intensity but clearly visible could be attributed only toa neighboring Cu atom during EXAFS analysis. However, wecannot exclude that a less defined interaction with the zeoliteframework could be the reason that prevents proving thepresence of Al or Si in the second coordination sphere. Thefit quality of the Cu-0.5 spectrum was worse and only a minorcontribution from Cu in the second shell was foundaccording to the EXAFS fit. Thus, EXAFS data, although ofmedium quality, allows identifying the Cu–O–Cu interaction,particularly in the dehydrated Cu-1.2 sample.
The formation of dimeric or clustered sites is alsosupported by a statistical analysis on a similar metal-exchanged system by Brandenberger et al.62 They have dem-onstrated that the increase of ion exchange degree enhancesthe probability to form dimeric or clustered Fe sites. Analo-gously, at very low concentrations such an interaction be-tween two Cu sites is less favored as they are too far awayfrom each other. In contrast, for higher Cu loadings the for-mation of dimeric Cu–O–Cu entities in addition to the
Table 1 Spin hamiltonian parameters derived by spectra simulation
Sample Site Irel/% g⊥ g|| A||/MHz (G) Treatment
Cu-0.5 I 97 2.071 2.368 427 (152) 1 h in 20% O2/Arat 300 °CIII 3 2.17
Cu-1.2 I 63.9 2.071 3.368 427 (152)II 33.8 2.071 2.321 445 (159)III 2.3 2.17
Cu-0.5 and Cu-1.2 IVa [CuIJNH3)3]2+
or [CuIJNH3)4]2+
2.057 2.263 550 (196) shfs to 14NA⊥ = 35 MHzA|| = 65 MHz
2000 ppm NH3/Ar
a Spectra could only be simulated properly by assuming superhyperfine coupling to 3 or 4 14N nuclei.
Fig. 5 Vtc-XES (a) and FT k2-weighted EXAFS (b) spectra of Cu-0.5 and Cu-1.2 catalysts measured under dry air at 350 °C.
Reaction Chemistry & EngineeringPaper
Ope
n A
cces
s A
rtic
le. P
ublis
hed
on 0
3 Ja
nuar
y 20
19. D
ownl
oade
d on
4/8
/202
2 11
:08:
24 A
M.
Thi
s ar
ticle
is li
cens
ed u
nder
a C
reat
ive
Com
mon
s A
ttrib
utio
n-N
onC
omm
erci
al 3
.0 U
npor
ted
Lic
ence
.View Article Online
React. Chem. Eng., 2019, 4, 1000–1018 | 1007This journal is © The Royal Society of Chemistry 2019
isolated monomeric species for higher Cu-concentrations isplausible. This evolution of the nuclearity directly correlates
with the improved SCR activity, as observed in this study andalso by the similar case of BEA and ZSM-5 zeolites, which
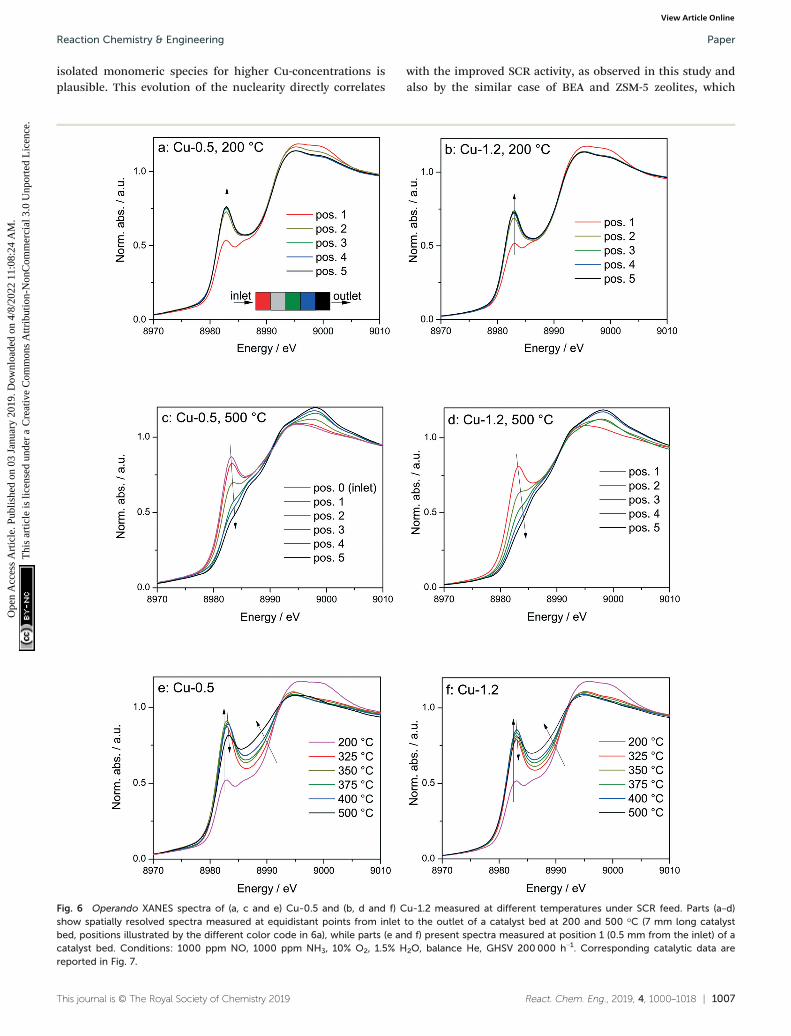
Fig. 6 Operando XANES spectra of (a, c and e) Cu-0.5 and (b, d and f) Cu-1.2 measured at different temperatures under SCR feed. Parts (a–d)show spatially resolved spectra measured at equidistant points from inlet to the outlet of a catalyst bed at 200 and 500 °C (7 mm long catalystbed, positions illustrated by the different color code in 6a), while parts (e and f) present spectra measured at position 1 (0.5 mm from the inlet) of acatalyst bed. Conditions: 1000 ppm NO, 1000 ppm NH3, 10% O2, 1.5% H2O, balance He, GHSV 200000 h−1. Corresponding catalytic data arereported in Fig. 7.
Reaction Chemistry & Engineering Paper
Ope
n A
cces
s A
rtic
le. P
ublis
hed
on 0
3 Ja
nuar
y 20
19. D
ownl
oade
d on
4/8
/202
2 11
:08:
24 A
M.
Thi
s ar
ticle
is li
cens
ed u
nder
a C
reat
ive
Com
mon
s A
ttrib
utio
n-N
onC
omm
erci
al 3
.0 U
npor
ted
Lic
ence
.View Article Online

1008 | React. Chem. Eng., 2019, 4, 1000–1018 This journal is © The Royal Society of Chemistry 2019
start to be more active at higher Cu loadings.63 Furthermore,Guo et al. also observed by Raman spectroscopy the forma-tion of Cu–O–Cu dimers upon dehydration of Cu-chabazite.64
However, since Cu sites seem to be very mobile,50,61,65 onehas to follow their structural dynamics under realistic reac-tion conditions, i.e. operando.
3.3 Comparison of Cu-0.5 and Cu-1.2 by operando XANES
By using a quartz capillary-based catalytic reactor with plugflow geometry that allowed obtaining meaningful activitydata and direct correlations between catalyst structure andcatalytic activity, operando XAS and vtc-XES measurementswere conducted for both catalysts under various SCR-relatedconditions around the seagull lower conversion point. Inboth cases several positions along the catalyst bed were mon-itored with a small X-ray beam (max. 1 × 0.2 mm size) at se-lected temperatures around the seagull point, whilecollecting the corresponding NOx conversion (Fig. 6 and 7).In contrast to the standard SCR activity reported in Fig. 1 forthe laboratory tests, the seagull profile during the operandoexperiment (Fig. 7) is slightly less visible due to the dilutionof the gas mixture before the FTIR instrument, as described
in the experimental section. However, the two characteristiclow- and high-temperature regions can be clearly distin-guished also in this case. Consequently, distinct variations ofthe local structure were noticed under SCR reaction condi-tions at increasing temperatures: (i) inhibition of the SCR re-action due to the high NH3 concentration at the inlet of thecatalyst bed,66 (ii) reduction of the Cu2+ sites during the stan-dard SCR reaction and (iii) reoxidation of the Cu+ sites at theend of the catalyst bed at higher temperatures, when the NOx
conversion occurs mainly at the inlet and mid positions.12,61
In spite of markedly different catalytic activity (Fig. 1 and7) similar spectral dynamics were observed for both Cu-0.5and Cu-1.2 catalysts, especially illustrated by variation of thefeature at 8982.7 eV (Fig. 6), previously attributed by conven-tional and HERFD-XANES studies to linearly coordinated Cu+
species.12,61,66 Only between 325–400 °C the intensity of thisfeature is significantly higher for the Cu-0.5 sample, whichclearly indicates the presence under standard SCR conditionsof a higher number of linearly coordinated Cu+ sites in thelow-loaded sample.
As illustrated for several temperatures in Fig. 6 and S5,†the XANES spectra collected at several positions along thecatalyst bed (the measurement positions are chosen in the
Fig. 7 Conversion of NO and fraction of Cu+ coordinated with NH3 (with linear geometry) and the HT (high temperature) Cu+, both normalized toall Cu species, obtained by LCA of XANES spectra measured during operando XAS studies at SLS. Values reported for (a) Cu-0.5 and (b) Cu-1.2catalysts. XANES data are taken at positions 1 (near the inlet) and 3 (middle) of the catalyst bed. The fractions of Cu+ are reported for the inlet ofthe catalyst bed. The error bars of the LCA are within 10%. Conditions: 1000 ppm NO, 1000 ppm NH3, 10% O2, 1.5% H2O, balance He, GHSV200000 h−1.
Reaction Chemistry & EngineeringPaper
Ope
n A
cces
s A
rtic
le. P
ublis
hed
on 0
3 Ja
nuar
y 20
19. D
ownl
oade
d on
4/8
/202
2 11
:08:
24 A
M.
Thi
s ar
ticle
is li
cens
ed u
nder
a C
reat
ive
Com
mon
s A
ttrib
utio
n-N
onC
omm
erci
al 3
.0 U
npor
ted
Lic
ence
.View Article Online

React. Chem. Eng., 2019, 4, 1000–1018 | 1009This journal is © The Royal Society of Chemistry 2019
same way as in ref. 66) indicate the absence of gradient in ox-idation state/local structure for the low loaded Cu-SSZ-13 upto 400 °C but pronounced differences were observed at500 °C. In contrast, changes in the XANES spectral featuresat several positions along the catalyst bed were noticed forthe highly-loaded Cu-SSZ-13 starting at 325 °C. This evolutionis in line with the SCR activity of the two samples.
In order to see how the Cu+/Cu2+ species evolve during theSCR at different positions in the catalyst bed, we haveconducted a linear combination fit analysis of the XANES re-gion. Unlike the previous work where the edge shape of Cu-SAPO-34 XAS spectra could be modelled with a linear combi-nation of just two species, namely Cu2+ and Cu+ sites fromCuO and Cu2O reference compounds,66 here we noticed notjust changing intensity of the shoulder at 8982.7 eV but alsoan increase in the overall absorbance between 8985 and8990 eV above 350 °C. Principal component analysissuggested that at least three different components need to beused to fit the obtained operando XANES spectral sets. This isin agreement with the recent study of Lomachenko et al.,28
who also observed the evolution of three different Cu speciesduring the SCR process between 150–400 °C. Based on the exsitu and in situ characterization performed in this study wepropose the interchange of the following monomeric or di-meric components, depending on the gas mixture and tem-perature: (ii) Cu2+ species, (ii) Cu+ linearly coordinated toNH3 and (iii) NH3-free Cu+ sites and 3-fold coordinated.67
The presence of Cu+ linearly coordinated alongside with Cu2+
was previously demonstrated12 at low temperatures whereasthe third type of sites appear during the SCR process athigher temperatures.
For fitting the operando XANES spectra linear combinationanalysis with the reference spectra was employed. Thedehydrated Cu2+ reference spectrum was acquired under oxi-dizing conditions at about 200 °C.66 This selection was donebased on a dehydration experiment up to 550 °C and also onprevious published results.12 The Cu+ references wereobtained by recording several series of in situ XANES duringtemperature programmed reduction (TPR) of pre-oxidizedcatalysts with ammonia as a reductant, and applying multi-variate curve resolution-alternating least squares method(MCR-ALS, see section 2.3.3 and Fig. S6†).35,36 The obtainedspectra used for linear combination analysis of operandoXANES are shown in Fig. S7† together with the HERFD-XANES spectra recorded previously12 under model conditionsin order to help the attribution of spectral features. As previ-ously mentioned, the obtained reference spectra wereassigned to Cu+·NH3 complexes with linear geometry (with ei-ther two NH3 ligands or NH3 and H2O)
9 and to Cu+ withoutdirect coordination to ammonia and 3-fold coordinated,12 re-ferred below as Cu+ HT (high temperature). The results of thelinear combination analysis of the XANES spectra(Fig. 7a and b) collected at 0.5 mm from the inlet (pos. 1)and in the middle (pos. 3) of the catalyst bed revealed thatfor both samples the presence of a high portion of Cu+ sitesamong all Cu species even at low temperatures under stan-
dard SCR conditions (as can be seen by the appearance ofthe shoulder at 8982.7 eV in Fig. 6). Although it is expectedthat the reduction of Cu2+ and the formation of Cu+(NH3)xspecies occur mainly due to the SCR reaction, its extent doesnot seem to correlate with the measured performance, e.g.NOx conversion was not observed over Cu-0.5 at temperaturesbelow 350 °C. On the other hand, given the possibility to dis-tinguish between two different Cu+ sites, i.e. coordinated oruncoordinated to NH3, we could also compare their fractiondepending on temperature. Alongside, conversion of NO mea-sured during XAS acquisition is shown. The data obtained forCu-0.5 (Fig. 7a and S8†) suggests a direct correlation of theSCR activity with the amount of NH3-free Cu+ sites or not lin-early coordinated, which appear above 350 °C irrespective ofthe position in the catalyst bed, and an inverse correlationwith the concentration of Cu+·NH3 sites. Since the NH3 inhi-bition at low temperature (<300 °C) was detected for bothcatalysts, the decrease of NH3 amount at the Cu sites seemsto lead to an increase of the SCR activity at higher tempera-tures. This appears to be particularly important for the lowloaded Cu-SSZ-13 sample, predominantly containing isolatedCu sites. Another indication for SCR activity is the formationof Cu2+ especially observed towards the outlet of the catalystbed.
The situation is different for the highly-loaded Cu-1.2 cata-lyst. Its higher SCR activity at low temperatures (Fig. 1 and7b) does not correlate to the amount of NH3-free Cu+ sites inthis catalyst, which appear only in the high temperature re-gion of the seagull-shaped conversion profile. However, theamount of Cu2+ is significantly larger for this sample at allpositions of the catalyst bed and for all investigated tempera-tures, which is also an indicator for less NH3 inhibition atthe Cu sites and, especially, for the occurrence of thereoxidation step of the SCR mechanism. On the one side thispoints out that not the reduction of the Cu sites but ratherthe reoxidation is a rate limiting step for NH3–SCR on Cu-0.5.On the other side, different Cu species seem to be responsi-ble for the low-temperature activity of Cu-SSZ-13 with highCu loading.
3.4 Structure of Cu species analyzed by operando EXAFS
In addition to the differences in the oxidation and reductionof Cu species along the catalyst bed, especially at low temper-atures significant differences were observed during the analy-sis of the corresponding spatially resolved Fourier Trans-formed (FT) EXAFS spectra (Table 2). The appearance of asecond coordination sphere at the uncorrected distance ofabout 2.4 Å around Cu central atom reported by Lomachenkoet al.,28 was also observed during this study under SCR condi-tions for Cu-1.2 catalyst but only at the end of the catalystbed, and starting with 325 °C (Fig. S9†). In line with the EPRand XES measurements of the dehydrated Cu-SSZ-13 sam-ples, this second shell in the FT EXAFS could indicate thebond with the zeolite framework and/or with another Cuatom as a dimeric entity, e.g. mono or bisIJμ-oxo)dicopper
Reaction Chemistry & Engineering Paper
Ope
n A
cces
s A
rtic
le. P
ublis
hed
on 0
3 Ja
nuar
y 20
19. D
ownl
oade
d on
4/8
/202
2 11
:08:
24 A
M.
Thi
s ar
ticle
is li
cens
ed u
nder
a C
reat
ive
Com
mon
s A
ttrib
utio
n-N
onC
omm
erci
al 3
.0 U
npor
ted
Lic
ence
.View Article Online

1010 | React. Chem. Eng., 2019, 4, 1000–1018 This journal is © The Royal Society of Chemistry 2019
species.49 In contrast to the results in ref. 28 we did not ob-serve any variation below this temperature, e.g. 200 °C, mostprobably due to the lower Cu concentration in our sampleand consequently to the extension of the reaction zone overthe whole catalyst bed. It results that the changes in thestructure occur at the positions in the catalyst bed where theNOx conversion is almost complete, which correspond to lowNH3 concentrations. This hypothesis is supported by the FTEXAFS spectra obtained for the low loaded catalyst but onlyat 400 °C, as a second coordination shell emerged at posi-tions towards the end of the catalyst bed.
In order to elucidate whether the appearance of the sec-ond coordination shell is a step of the SCR mechanism andnot only a fingerprint for the dehydrated Cu sites, additionalXAS and XES investigations were performed at different tem-peratures by exposing the catalysts to the NH3-only and NO-only gas mixtures. This allows an easier interpretation by sep-arately identifying the spectral features characteristic for theinteraction of Cu with an oxidizing feed in comparison to thereducing NH3-containing feed, without mixing the corre-sponding spectral features as we have seen earlier that it willlead to an averaged information.12 Catalytic activity of Cu-0.5and Cu-1.2 in oxidation of NO or NH3 is reported in Fig. S2.†As the differences in the XANES spectra under these condi-
tions are very similar to the results reported in a previousstudy,12 here only the EXAFS region is discussed.
Fig. 8 displays the FT EXAFS spectra recorded for Cu-1.2 cat-alyst at low and high temperatures of 200 and 400 °C, i.e. belowand above the seagull shaped NOx conversion minimum. Simi-larly as observed at the end of the catalyst bed during SCR, asecond coordination shell appears in the FT EXAFS spectra ofCu-1.2 under the NO oxidation feed (Fig. 8a). Although the fea-ture is small, it is reproducible and has been seen not only atthe inlet of the reactor but for several points along the catalystbed. In contrast, if NH3 and O2 are dosed at 200 °C only thefirst coordination shell could be detected.
While differences in the spectra of Cu-1.2 in the absence/presence of NH3 are small at low temperatures, they becomemuch more pronounced at temperatures above the seagullpoint (Fig. 8b). The second coordination shell in the FTEXAFS becomes very pronounced at 400 °C for the inlet posi-tion under the NO oxidation gas mixture but disappears inNH3/O2. Therefore, any bonding to another Cu site or to thezeolite framework seems to be lost in the presence of NH3,and the dimeric Cu species are converted to single Cu sitescoordinated to NH3, as for example linearly coordinatedCu+(NH3)2 complexes. However, the data obtained in NO/O2
indicate that the Cu+–O–Cu+ dimers linked to the zeolite
Table 2 Coordination numbers (CN), interatomic distances (d), Debye–Waller factor (σ2), energy shift (δE0), and the absolute misfit between theory andexperiment (ρ) obtained from the analysis of the operando EXAFS spectra of Cu-0.5 and Cu-1.2 under conditions of NH3 oxidation and NO oxidation (inthe presence of water vapor)
CNIJO)/dIJCu–O) CNIJCu)/dIJCu–O–Cu) CNIJAl)/dIJCu–O–Al) σ2 (10−3 Å2) δE0 (eV) ρ (%)
Cu-0.5 NH3 + O2 200 °C 3.2 ± 0.3 1.93 ± 0.01 Å n.a. n.a. 5.8 ± 1.5 −1.2 ± 0.9 0.9Cu-0.5 NO + O2 200 °C 4.5 ± 0.3 1.95 ± 0.01 Å n.a. n.a. 6.2 ± 1.4 −1.2 ± 0.8 0.6Cu-0.5 NH3 + O2 375 °C 2.4 ± 0.2 1.92 ± 0.01 Å n.a. n.a. 5.6 ± 1.3 −1.2 ± 0.8 0.8Cu-0.5 NO + O2 375 °C 3.9 ± 0.4 1.94 ± 0.01 Å 1.3 ± 0.5 3.03 ± 0.02 Å 1.0 ± 0.4 2.74 ± 0.04 Å 6.5 ± 1.5 −0.6 ± 0.9 0.5Cu-1.2 NH3 + O2 200 °C 3.4 ± 0.4 1.94 ± 0.01 Å n.a. n.a. 7.1 ± 1.7 0.2 ± 1.0 1.1Cu-1.2 NO + O2 200 °C 4.6 ± 0.4 1.94 ± 0.01 Å 0.5 ± 0.4 2.92 ± 0.04 Å n.a. 7.4 ± 1.2 −2.0 ± 0.7 0.4Cu-1.2 NH3 + O2 400 °C 2.5 ± 0.1 1.92 ± 0.01 Å n.a. n.a. 6.3 ± 1.2 −1.4 ± 0.6 0.4Cu-1.2 NO + O2 400 °C 4.2 ± 0.4 1.93 ± 0.1 Å 0.85 ± 0.4 2.97 ± 0.03 Å 0.7 ± 0.3 2.72 ± 0.04 Å 9.3 ± 1.6 −1.2 ± 0.8 0.4
Fig. 8 Operando FT k2-weighted EXAFS spectra measured on Cu-1.2 at (a) 200 °C and (b) 400 °C. Conditions: 1000 ppm NO or 1000 ppm NH3,10% O2, 1.5% H2O/He, GHSV 200000 h−1.
Reaction Chemistry & EngineeringPaper
Ope
n A
cces
s A
rtic
le. P
ublis
hed
on 0
3 Ja
nuar
y 20
19. D
ownl
oade
d on
4/8
/202
2 11
:08:
24 A
M.
Thi
s ar
ticle
is li
cens
ed u
nder
a C
reat
ive
Com
mon
s A
ttrib
utio
n-N
onC
omm
erci
al 3
.0 U
npor
ted
Lic
ence
.View Article Online
React. Chem. Eng., 2019, 4, 1000–1018 | 1011This journal is © The Royal Society of Chemistry 2019
framework constantly reappear if NH3 is consumed duringthe SCR process.
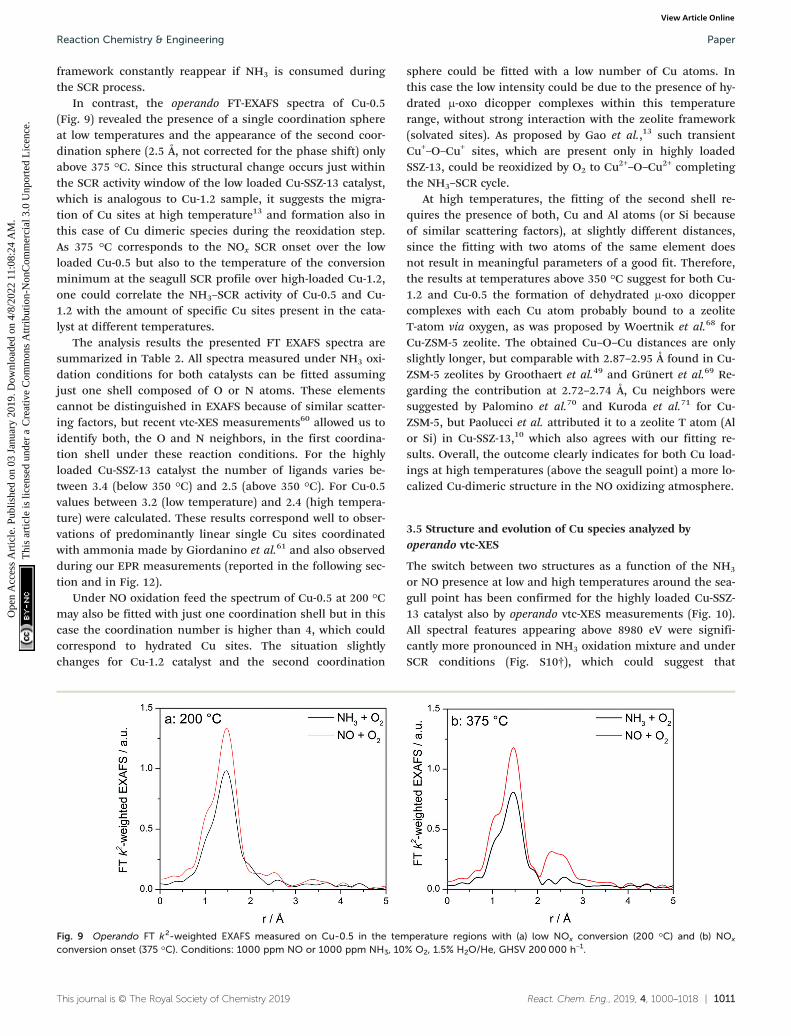
In contrast, the operando FT-EXAFS spectra of Cu-0.5(Fig. 9) revealed the presence of a single coordination sphereat low temperatures and the appearance of the second coor-dination sphere (2.5 Å, not corrected for the phase shift) onlyabove 375 °C. Since this structural change occurs just withinthe SCR activity window of the low loaded Cu-SSZ-13 catalyst,which is analogous to Cu-1.2 sample, it suggests the migra-tion of Cu sites at high temperature13 and formation also inthis case of Cu dimeric species during the reoxidation step.As 375 °C corresponds to the NOx SCR onset over the lowloaded Cu-0.5 but also to the temperature of the conversionminimum at the seagull SCR profile over high-loaded Cu-1.2,one could correlate the NH3–SCR activity of Cu-0.5 and Cu-1.2 with the amount of specific Cu sites present in the cata-lyst at different temperatures.
The analysis results the presented FT EXAFS spectra aresummarized in Table 2. All spectra measured under NH3 oxi-dation conditions for both catalysts can be fitted assumingjust one shell composed of O or N atoms. These elementscannot be distinguished in EXAFS because of similar scatter-ing factors, but recent vtc-XES measurements60 allowed us toidentify both, the O and N neighbors, in the first coordina-tion shell under these reaction conditions. For the highlyloaded Cu-SSZ-13 catalyst the number of ligands varies be-tween 3.4 (below 350 °C) and 2.5 (above 350 °C). For Cu-0.5values between 3.2 (low temperature) and 2.4 (high tempera-ture) were calculated. These results correspond well to obser-vations of predominantly linear single Cu sites coordinatedwith ammonia made by Giordanino et al.61 and also observedduring our EPR measurements (reported in the following sec-tion and in Fig. 12).
Under NO oxidation feed the spectrum of Cu-0.5 at 200 °Cmay also be fitted with just one coordination shell but in thiscase the coordination number is higher than 4, which couldcorrespond to hydrated Cu sites. The situation slightlychanges for Cu-1.2 catalyst and the second coordination
sphere could be fitted with a low number of Cu atoms. Inthis case the low intensity could be due to the presence of hy-drated μ-oxo dicopper complexes within this temperaturerange, without strong interaction with the zeolite framework(solvated sites). As proposed by Gao et al.,13 such transientCu+–O–Cu+ sites, which are present only in highly loadedSSZ-13, could be reoxidized by O2 to Cu2+–O–Cu2+ completingthe NH3–SCR cycle.
At high temperatures, the fitting of the second shell re-quires the presence of both, Cu and Al atoms (or Si becauseof similar scattering factors), at slightly different distances,since the fitting with two atoms of the same element doesnot result in meaningful parameters of a good fit. Therefore,the results at temperatures above 350 °C suggest for both Cu-1.2 and Cu-0.5 the formation of dehydrated μ-oxo dicoppercomplexes with each Cu atom probably bound to a zeoliteT-atom via oxygen, as was proposed by Woertnik et al.68 forCu-ZSM-5 zeolite. The obtained Cu–O–Cu distances are onlyslightly longer, but comparable with 2.87–2.95 Å found in Cu-ZSM-5 zeolites by Groothaert et al.49 and Grünert et al.69 Re-garding the contribution at 2.72–2.74 Å, Cu neighbors weresuggested by Palomino et al.70 and Kuroda et al.71 for Cu-ZSM-5, but Paolucci et al. attributed it to a zeolite T atom (Alor Si) in Cu-SSZ-13,10 which also agrees with our fitting re-sults. Overall, the outcome clearly indicates for both Cu load-ings at high temperatures (above the seagull point) a more lo-calized Cu-dimeric structure in the NO oxidizing atmosphere.
3.5 Structure and evolution of Cu species analyzed byoperando vtc-XES
The switch between two structures as a function of the NH3
or NO presence at low and high temperatures around the sea-gull point has been confirmed for the highly loaded Cu-SSZ-13 catalyst also by operando vtc-XES measurements (Fig. 10).All spectral features appearing above 8980 eV were signifi-cantly more pronounced in NH3 oxidation mixture and underSCR conditions (Fig. S10†), which could suggest that
Fig. 9 Operando FT k2-weighted EXAFS measured on Cu-0.5 in the temperature regions with (a) low NOx conversion (200 °C) and (b) NOx
conversion onset (375 °C). Conditions: 1000 ppm NO or 1000 ppm NH3, 10% O2, 1.5% H2O/He, GHSV 200000 h−1.
Reaction Chemistry & Engineering Paper
Ope
n A
cces
s A
rtic
le. P
ublis
hed
on 0
3 Ja
nuar
y 20
19. D
ownl
oade
d on
4/8
/202
2 11
:08:
24 A
M.
Thi
s ar
ticle
is li
cens
ed u
nder
a C
reat
ive
Com
mon
s A
ttrib
utio
n-N
onC
omm
erci
al 3
.0 U
npor
ted
Lic
ence
.View Article Online

1012 | React. Chem. Eng., 2019, 4, 1000–1018 This journal is © The Royal Society of Chemistry 2019
monomeric linearly coordinated Cu+(NH3)x complexes areformed (Fig. 10 and 11).
The stability of such complexes even in the gas phase hasbeen theoretically and also experimentally demonstrated.72,73
This might lead to their formation and also to the weakeningof the bond with the zeolite framework. Moreover, their mo-bility within the chabazite framework has been often claimedand it seems to be enhanced by the SCR reaction mixtureand temperature increase.65,74 Furthermore, whereas the vari-ations in the Kβ″ and Kβ2,5 regions under different feedswere discussed earlier for very low temperatures (200 °C) andcorrelated for the SCR process with a direct coordination ofNH3 to the Cu sites and of NO via the neighboring Oatom,12,61 significant structural differences could be observedat higher temperatures for both NH3 and NO oxidation feeds.Thus, at 275 °C, below the seagull lower conversion point,the direct coordination of NH3 to the Cu sites is clearly visi-ble in the shift of Kβ″ line towards higher energy (8957.2 eVvs. 8956.9 eV in O2 + H2O mixture). At 425 °C due to NH3 oxi-dation and also desorption, the intensity of the Kβ″ regionalso indicates a decrease of NH3 concentration at the Cu sites
(Fig. 11a), similar as reported in ref. 28, and two features canbe distinguished at 8955.8 eV and at 8958.2 eV.
The fingerprint of the direct NO coordination at the Cusites in the form of nitrites/nitrates, which is not visible dur-ing the low temperature onset of NOx conversion as it isstrongly inhibited by H2O,
12,60 appears clearly at 275 °C. Ashift of the Kβ″ from about 8956.9 eV in 10% O2, 1.5% H2O/N2 (ref. 75) to 8958 eV was observed if 1000 ppm NO wereadded (Fig. 11b). Although slightly broader towards lower en-ergies, the shift was maintained at 350 °C. At 425 °C, abovethe seagull point, two features become visible in the Kβ″ re-gion with maxima around 8956.2 eV and 8959.6 eV. Whereasthe first one is probably due to a neighboring O atom, thesecond feature indicates still some interaction with NOx. Inaddition, a strong decrease of the Kβ2,5 region was observed.Hence, in line with the FT EXAFS data, not only the adsorp-tion/desorption of NH3 and NOx but a different local struc-ture is also indicated by the vtc-XES measurements at highertemperatures. However, further DFT calculations are neces-sary to elucidate all the variations in the XES spectra and todemonstrate this hypothesis.
Fig. 10 In situ vtc-XES measured on Cu-1.2 at (a) 275 °C and (b) 425 °C. Conditions: 1000 ppm NO or 1000 ppm NH3, 10% O2, 1.5% H2O, balanceHe, GHSV 200000 h−1.
Fig. 11 Evolution of vtc-XES spectra Kβ″ region at different temperatures for Cu-1.2 catalyst. Conditions: (a) 1000 ppm NH3, 10% O2, 1.5% H2O,He; (b) 1000 ppm NO, 10% O2, 1.5% H2O, He, GHSV 200000 h−1.
Reaction Chemistry & EngineeringPaper
Ope
n A
cces
s A
rtic
le. P
ublis
hed
on 0
3 Ja
nuar
y 20
19. D
ownl
oade
d on
4/8
/202
2 11
:08:
24 A
M.
Thi
s ar
ticle
is li
cens
ed u
nder
a C
reat
ive
Com
mon
s A
ttrib
utio
n-N
onC
omm
erci
al 3
.0 U
npor
ted
Lic
ence
.View Article Online

React. Chem. Eng., 2019, 4, 1000–1018 | 1013This journal is © The Royal Society of Chemistry 2019
3.6 Structure of Cu species analyzed by in situ EPR
Fig. 12 depicts the EPR spectra collected for the two catalysts at250 °C in the presence of NH3-only, NO + O2 and SCR gas mix-ture. In comparison to the EPR spectra recorded after dehydra-tion in 20% O2/Ar (Fig. 4), exposure to NH3/Ar flow at 250 °Cdecreased the intensity of the isolated Cu2+ species in bothsamples, indicating that Cu2+ is almost completely reduced toEPR silent Cu+ (Fig. 12, red lines). However, the reduction ex-tent of sample Cu-1.2 is slightly lower compared to sample Cu-0.5. After 30 min flushing with NH3, the EPR spectra of bothsamples contain only one type of Cu2+ species, namely type IV(Table 1), with the same spin Hamiltonian parameters. Theyare probably coordinated by NH3 molecules. This confirms theXAS and vtc-XES results presented above, indicating that NH3
is adsorbed at Cu2+ species and reduces them partly to Cu+.The presence of Cu sites in close vicinity, e.g. dimers or
cluster-like CuOx species, at low temperatures in the absenceof NH3 is evident from the EPR spectra acquired at 250 °C(below the seagull point) for the two catalysts in a gas mix-ture containing only NO and O2. As shown in Fig. 12, bothCu2+ species identified for the dehydrated samples (I and IIin Table 1) also appear in the NO + O2 dry gas mixture. How-ever, whereas the hfs signal of species I in sample Cu-0.5 isidentical to that recorded in inert atmosphere, the hfs signalsof both species I and II in the highly loaded Cu-1.2 sampleloose intensity in comparison to their initial state in Ar(Fig. 4), in favor of the broad background signal of magneti-cally interacting Cu2+. Moreover the total intensity of the EPRsignal decreases for sample Cu-1.2 but not for sample Cu-0.5.This points to an antiferromagnetic interaction of neighbor-ing Cu2+ sites in Cu-1.2, which may be dimers. Although thisresult supports the findings of EXAFS, it must be mentionedthat by EPR Cu2+ dimers cannot be discerned from otherCu2+Ox species of small nuclearity just based on a broad iso-tropic line.
Switching from NO/O2 to the SCR feed at 250 °C leads to astrong decrease of the signal intensity in sample Cu-0.5,which is even more pronounced than in the presence of NH3
only. In sample Cu-1.2, this intensity loss is much smallerand the signal under SCR feed is significantly higher thanunder NH3 only, which is opposite to sample Cu-0.5. This isclearly linked to the faster reoxidation of Cu+ species for thecatalyst with a higher Cu loading, as also indicated by theoperando XANES results (Fig. 6).
4. Discussion
Summing up the activity and in situ/operando characteriza-tion data obtained for the 0.5 wt% and 1.2 wt% Cu loadedSSZ-13 catalysts, the following insights were found:
• While Cu sites in both low- and highly-loaded hydratedsamples are at room temperature virtually identical[CuIJH2O)x]
2+ solvated species,76 the in situ XES, XAS and EPRdata as well as the ex situ characterization upon dehydrationshow different species linked to the zeolite framework: iso-lated/monomeric Cu sites, present especially for low Cu-load-ings, and species with higher nuclearity, e.g. Cu mono orbisIJμ-oxo) dimers for higher Cu concentrations.
• A stronger NH3-inhibition effect was identified at lowtemperatures especially for the low loaded Cu-SSZ-13 catalyst,predominantly containing isolated Cu sites. This effect is di-minished above 300 °C, which corresponds to the high-temperature region of the seagull profile.
• By performing the LCA based on the references obtainedby MCR-ALS, the participation to the SCR mechanism ofCu2+, [CuIJNH3)x]
+ and NH3-free Cu+ sites could be demon-strated. A higher concentration of Cu2+ and a lower amountof [CuIJNH3)x]
+ species was found for Cu-1.2 catalysts over theseagull region, which indicates a lower NH3 inhibition andan easier reoxidation of the reduced sites during the SCRmechanism.
Fig. 12 In situ EPR spectra of (a) Cu-0.5 and (b) Cu-1.2 samples measured at 250 °C in: 2000 ppm NH3/Ar (red line); 2000 ppm NO, 10% O2/Ar(blue line) and 2000 ppm NH3, 2000 ppm NO, 10% O2/Ar (green line).
Reaction Chemistry & Engineering Paper
Ope
n A
cces
s A
rtic
le. P
ublis
hed
on 0
3 Ja
nuar
y 20
19. D
ownl
oade
d on
4/8
/202
2 11
:08:
24 A
M.
Thi
s ar
ticle
is li
cens
ed u
nder
a C
reat
ive
Com
mon
s A
ttrib
utio
n-N
onC
omm
erci
al 3
.0 U
npor
ted
Lic
ence
.View Article Online
1014 | React. Chem. Eng., 2019, 4, 1000–1018 This journal is © The Royal Society of Chemistry 2019
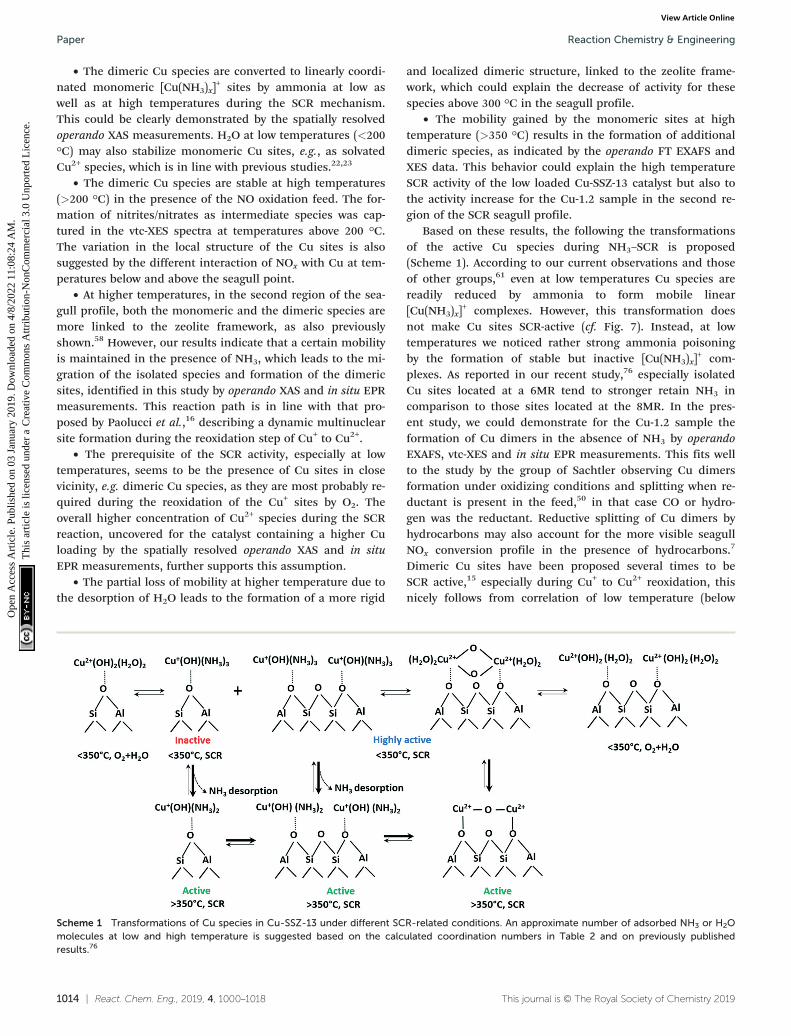
• The dimeric Cu species are converted to linearly coordi-nated monomeric [CuIJNH3)x]
+ sites by ammonia at low aswell as at high temperatures during the SCR mechanism.This could be clearly demonstrated by the spatially resolvedoperando XAS measurements. H2O at low temperatures (<200°C) may also stabilize monomeric Cu sites, e.g., as solvatedCu2+ species, which is in line with previous studies.22,23
• The dimeric Cu species are stable at high temperatures(>200 °C) in the presence of the NO oxidation feed. The for-mation of nitrites/nitrates as intermediate species was cap-tured in the vtc-XES spectra at temperatures above 200 °C.The variation in the local structure of the Cu sites is alsosuggested by the different interaction of NOx with Cu at tem-peratures below and above the seagull point.
• At higher temperatures, in the second region of the sea-gull profile, both the monomeric and the dimeric species aremore linked to the zeolite framework, as also previouslyshown.58 However, our results indicate that a certain mobilityis maintained in the presence of NH3, which leads to the mi-gration of the isolated species and formation of the dimericsites, identified in this study by operando XAS and in situ EPRmeasurements. This reaction path is in line with that pro-posed by Paolucci et al.,16 describing a dynamic multinuclearsite formation during the reoxidation step of Cu+ to Cu2+.
• The prerequisite of the SCR activity, especially at lowtemperatures, seems to be the presence of Cu sites in closevicinity, e.g. dimeric Cu species, as they are most probably re-quired during the reoxidation of the Cu+ sites by O2. Theoverall higher concentration of Cu2+ species during the SCRreaction, uncovered for the catalyst containing a higher Culoading by the spatially resolved operando XAS and in situEPR measurements, further supports this assumption.
• The partial loss of mobility at higher temperature due tothe desorption of H2O leads to the formation of a more rigid
and localized dimeric structure, linked to the zeolite frame-work, which could explain the decrease of activity for thesespecies above 300 °C in the seagull profile.
• The mobility gained by the monomeric sites at hightemperature (>350 °C) results in the formation of additionaldimeric species, as indicated by the operando FT EXAFS andXES data. This behavior could explain the high temperatureSCR activity of the low loaded Cu-SSZ-13 catalyst but also tothe activity increase for the Cu-1.2 sample in the second re-gion of the SCR seagull profile.
Based on these results, the following the transformationsof the active Cu species during NH3–SCR is proposed(Scheme 1). According to our current observations and thoseof other groups,61 even at low temperatures Cu species arereadily reduced by ammonia to form mobile linear[CuIJNH3)x]
+ complexes. However, this transformation doesnot make Cu sites SCR-active (cf. Fig. 7). Instead, at lowtemperatures we noticed rather strong ammonia poisoningby the formation of stable but inactive [CuIJNH3)x]
+ com-plexes. As reported in our recent study,76 especially isolatedCu sites located at a 6MR tend to stronger retain NH3 incomparison to those sites located at the 8MR. In the pres-ent study, we could demonstrate for the Cu-1.2 sample theformation of Cu dimers in the absence of NH3 by operandoEXAFS, vtc-XES and in situ EPR measurements. This fits wellto the study by the group of Sachtler observing Cu dimersformation under oxidizing conditions and splitting when re-ductant is present in the feed,50 in that case CO or hydro-gen was the reductant. Reductive splitting of Cu dimers byhydrocarbons may also account for the more visible seagullNOx conversion profile in the presence of hydrocarbons.7
Dimeric Cu sites have been proposed several times to beSCR active,15 especially during Cu+ to Cu2+ reoxidation, thisnicely follows from correlation of low temperature (below
Scheme 1 Transformations of Cu species in Cu-SSZ-13 under different SCR-related conditions. An approximate number of adsorbed NH3 or H2Omolecules at low and high temperature is suggested based on the calculated coordination numbers in Table 2 and on previously publishedresults.76
Reaction Chemistry & EngineeringPaper
Ope
n A
cces
s A
rtic
le. P
ublis
hed
on 0
3 Ja
nuar
y 20
19. D
ownl
oade
d on
4/8
/202
2 11
:08:
24 A
M.
Thi
s ar
ticle
is li
cens
ed u
nder
a C
reat
ive
Com
mon
s A
ttrib
utio
n-N
onC
omm
erci
al 3
.0 U
npor
ted
Lic
ence
.View Article Online
React. Chem. Eng., 2019, 4, 1000–1018 | 1015This journal is © The Royal Society of Chemistry 2019
250 °C) activity with Cu loading.24 Necessity of Cu dimerformation at lower temperatures might be attributed to thefact that two neighboring Cu sites are required to be oxi-dized from Cu+ to Cu2+ by O2.
15 Poor activity of Cu-0.5 un-der these conditions could be due to the rather large diffu-sion distance to the next neighboring site16 and insufficientmobility to form active dimeric species.
The structure and activity of Cu sites changes at highertemperatures. MD simulations predicted the formation ofcationic OH-bridged Cu dimers.17 In fact, we observed Cu di-mer formation under oxidizing conditions even in the low-loaded Cu-0.5 catalyst (Fig. 9 and Table 2). We also observedthat the SCR activity correlates with the amount of NH3-freeCu+ (Fig. 7), which corresponds to sites that are not poisonedby NH3 and are probably involved in dimeric Cu+–O2–Cu
+
reoxidation intermediates. Furthermore, the operando EXAFS,and vtc-XES results demonstrated a higher probability of Cudimers formation under the oxidizing NO + O2 feed, which isclearly visible even in low-loaded Cu-0.5 catalyst at 375 °C(Fig. 9 and Table 2). Hence, we propose that the mixture ofCu sites in close proximity (able to quickly form dimers) aswell as isolated Cu species coexist at high temperatures andare both SCR active, which boosts the NOx conversion above350 °C. In contrast to Gao et al.,24 who suggest the splittingof Cu dimers at high temperature under oxidizing conditions,we regard this process as an intermediate step of the SCRmechanism taking place especially in the presence of NH3.As a result, while it was previously suggested that the SCR ac-
tivity decrease at 300–350 °C stems from temperature-induced splitting of active Cu dimers,24 we propose that it israther caused by the formation of more localized Cu species.This limited mobility due to the interaction with the zeoliteframework was also suggested in the recent study of Paolucciet al.16 On the other side, Joshi et al. also proposed that theincreased NOx conversion at high temperature can be attrib-uted to the onset of NO oxidation to NO2 that enhances NOx
reduction via fast SCR route.40 According to our XES investi-gations, NO interacts with Cu sites above 200 °C even in thepresence of water (Fig. 11), this interaction being hindered bywater at lower temperatures.12,77 Hence, NO oxidation overbisIJμ-oxo)dicopper species with the formation of nitrates/ni-trite species that contribute to the SCR mechanism is highlyprobable, especially at higher temperature where NH3 par-tially desorbs from Cu sites.
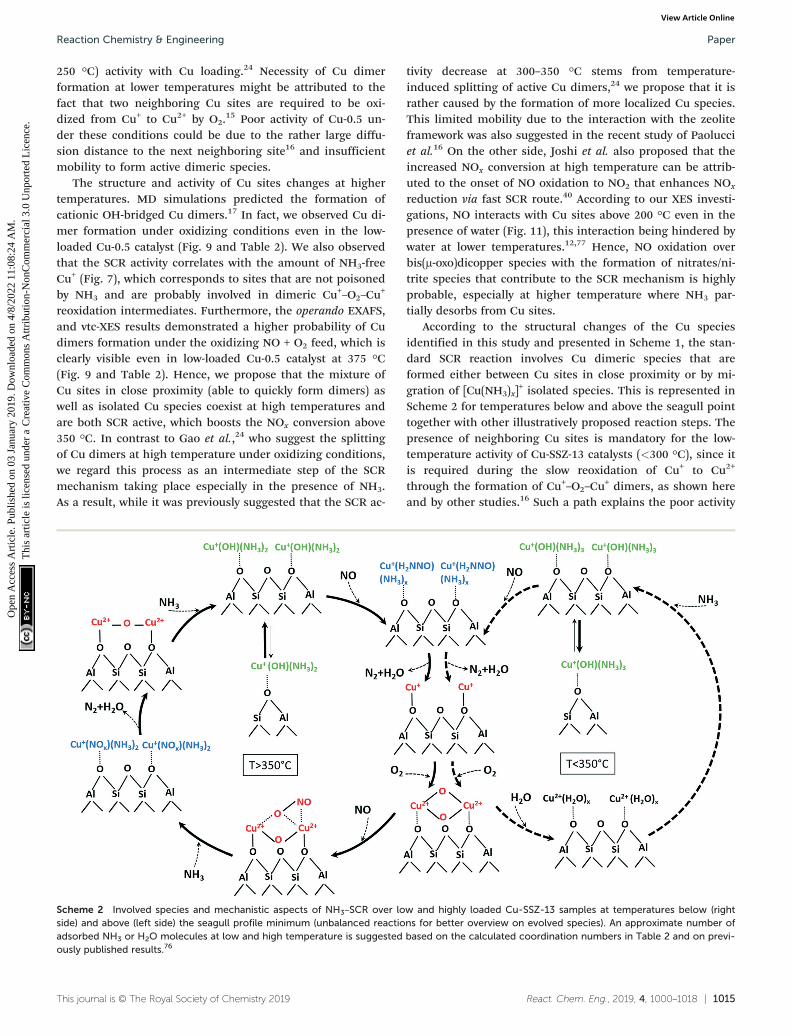
According to the structural changes of the Cu speciesidentified in this study and presented in Scheme 1, the stan-dard SCR reaction involves Cu dimeric species that areformed either between Cu sites in close proximity or by mi-gration of [CuIJNH3)x]
+ isolated species. This is represented inScheme 2 for temperatures below and above the seagull pointtogether with other illustratively proposed reaction steps. Thepresence of neighboring Cu sites is mandatory for the low-temperature activity of Cu-SSZ-13 catalysts (<300 °C), since itis required during the slow reoxidation of Cu+ to Cu2+
through the formation of Cu+–O2–Cu+ dimers, as shown here
and by other studies.16 Such a path explains the poor activity
Scheme 2 Involved species and mechanistic aspects of NH3–SCR over low and highly loaded Cu-SSZ-13 samples at temperatures below (rightside) and above (left side) the seagull profile minimum (unbalanced reactions for better overview on evolved species). An approximate number ofadsorbed NH3 or H2O molecules at low and high temperature is suggested based on the calculated coordination numbers in Table 2 and on previ-ously published results.76
Reaction Chemistry & Engineering Paper
Ope
n A
cces
s A
rtic
le. P
ublis
hed
on 0
3 Ja
nuar
y 20
19. D
ownl
oade
d on
4/8
/202
2 11
:08:
24 A
M.
Thi
s ar
ticle
is li
cens
ed u
nder
a C
reat
ive
Com
mon
s A
ttrib
utio
n-N
onC
omm
erci
al 3
.0 U
npor
ted
Lic
ence
.View Article Online

1016 | React. Chem. Eng., 2019, 4, 1000–1018 This journal is © The Royal Society of Chemistry 2019
at low temperatures of the Cu-0.5 catalyst. In this sample, theisolated Cu sites adsorb NH3 and form [CuIJNH3)x]
+ complexeswith limited mobility, which are not reacting further also dueto NH3 inhibition. In contrast, the formation of dimeric spe-cies is facilitated at higher loadings. Although interacting ina similar manner with NH3, the resulting Cu+(OH)IJNH3)xneighboring species react with NO, probably by formation ofan unstable nitrosamine intermediate that is quicklyconverted to N2 and H2O. In a next step, the resulting Cu+
sites (not represented in Scheme 2) are reoxidized via a di-meric species, closing the SCR cycle.
The reaction steps/species identified at high temperaturesby the different complementary characterization methodsused in this study are reported in a similar illustrative way inScheme 2 (left side) but with some distinct differences. Firstof all, the desorption of NH3 and the increased mobility of[CuIJNH3)x]
+ brings the isolated Cu sites next to each otherand results in the formation of additional Cu dimers duringthe SCR process. At the same time, the lower NH3 solvationdegree leads to more localized and less active structures. Pos-sibly at high temperatures, NH3 is mainly stored on theBrønsted acid sites of the zeolite. Spillover of NH3 from zeo-lite to the reaction site may additionally slow down SCR,which we observe as seagull-shape NOx conversion decreaseat 350 °C. On the contrary, NO adsorbs directly on Cu sitesand is oxidized to NO2 by the activated O2 molecule in thebisIJμ-oxo)dicopper complex, probably via the unstable reac-tion intermediate shown in Scheme 2. In a next step, theresulting nitrate/nitrites quickly react with NH3 producinglocalized Cu2+–O–Cu2+ dimers species. Such a transition froma delocalized bisIJμ-oxo)dicopper structure, e.g. solvated byNH3 or H2O, to monoIJμ-oxo)dicopper species linked to the ze-olite framework is supported also by the study of Alayonet al.,78 which indicates by DFT calculations that rather amonoIJμ-oxo)dicopper structure is favored at the Cu dimericsite in the zeolite.
5. Conclusions
By combining operando XAS, operando vtc-XES and in situ EPRwe could identify structural changes at Cu sites in Cu-SSZ-13zeolites under various conditions related to NH3–SCR of NO,which could be correlated to the seagull profile of the NOx con-version. The formation of oxygen bridged (μ-oxo)dicopper com-plexes was observed for the catalyst containing 1.2 wt% Cu un-der oxidizing conditions at low and high temperatures, whilethese complexes were readily split to monomeric Cu sites whenNH3 was introduced in the feed. The SCR cycle impliesmonomeric [CuIJNH3)x]
+ and dimeric Cu2+–O2–Cu2+ species. For
the low loaded Cu-0.5 sample, which contains mainly mono-meric Cu species, further adsorption of NH3 at low tempera-tures makes the single Cu sites SCR inactive (NH3-inhibition).Moreover, since the reoxidation step seems to require two Cu+
sites in close vicinity, this step is constrained at low Cu load-ings. Upon desorption of NH3 at higher temperatures andgained increased mobility the monomeric Cu sites become
SCR-active, which corresponds to the second maximum of theseagull profile. However, the desorption of NH3 combined withdehydration leads to a more localized structure of the dimericspecies, which could be related to the decrease of the NOx con-version at about 350 °C. Finally, the outcome ratifies X-ray ab-sorption and emission spectroscopy techniques as advanta-geous for the in situ and operando studies due to thepenetration depth of X-rays which allows building in situ cellswith desired geometry, allowing fine tuning of process parame-ters and facilitating easier kinetic measurements.
Conflicts of interest
There are no conflicts to declare.
Acknowledgements
This work has been supported by the DFG (GR 3987/5-1) andthe Federal Ministry of Education and Research (BMBF, pro-jects 05K10VKB and 05K13VK2). A. Fahami is grateful to theErasmus program. T. Günter and D. Zengel thank DBU forprovided scholarships. We thank ESRF for providing thebeamtime at the ID26 beamline and financial support atESRF and Dr. L. Amidani, Dr. P. Glatzel, and C. Lapras for thesupport during measurements. We also thank SLS for provid-ing the beamtime at the SuperXAS beamline and Dr. O.Safonova and Dr. M. Nachtegaal for the support. Finally, Prof.I. Nova and Prof. E. Tronconi (Politecnico di Milano) aregreatly acknowledged for their cooperation, support and fruit-ful discussions in this work.
References
1 M. Koebel, M. Elsener and M. Kleemann, Catal. Today,2000, 59, 335–345.
2 L. Lietti, G. Ramis and F. Berti, Appl. Catal., B, 1998, 18,1–36.
3 T. V. Johnson, Int. J. Engine Res., 2009, 10, 275–285.4 M. P. Ruggeri, A. Grossale, I. Nova, E. Tronconi, H. Jirglova
and Z. Sobalik, Catal. Today, 2012, 184, 107–114.5 P. G. Blakeman, E. M. Burkholder, H.-Y. Chen, J. E. Collier,
J. M. Fedeyko, H. Jobson and R. R. Rajaram, Catal. Today,2014, 231, 56–63.
6 S. J. Schmieg, S. H. Oh, C. H. Kim, D. B. Brown, J. H. Lee, C. H.Peden and D. H. Kim, Catal. Today, 2012, 184, 252–261.
7 Q. Ye, L. Wang and R. T. Yang, Appl. Catal., A, 2012, 427,24–34.
8 J. H. Kwak, H. Zhu, J. H. Lee, C. H. Peden and J. Szanyi,Chem. Commun., 2012, 48, 4758–4760.
9 E. Borfecchia, K. Lomachenko, F. Giordanino, H. Falsig, P.Beato, A. Soldatov, S. Bordiga and C. Lamberti, Chem. Sci.,2015, 6, 548–563.
10 C. Paolucci, A. A. Verma, S. A. Bates, V. F. Kispersky, J. T.Miller, R. Gounder, W. N. Delgass, F. H. Ribeiro and W. F.Schneider, Angew. Chem., Int. Ed., 2014, 53, 11828–11833.
11 F. Gao, J. H. Kwak, J. Szanyi and C. H. Peden, Top. Catal.,2013, 56, 1441–1459.
Reaction Chemistry & EngineeringPaper
Ope
n A
cces
s A
rtic
le. P
ublis
hed
on 0
3 Ja
nuar
y 20
19. D
ownl
oade
d on
4/8
/202
2 11
:08:
24 A
M.
Thi
s ar
ticle
is li
cens
ed u
nder
a C
reat
ive
Com
mon
s A
ttrib
utio
n-N
onC
omm
erci
al 3
.0 U
npor
ted
Lic
ence
.View Article Online
React. Chem. Eng., 2019, 4, 1000–1018 | 1017This journal is © The Royal Society of Chemistry 2019
12 T. Günter, H. W. Carvalho, D. E. Doronkin, T. Sheppard, P.Glatzel, A. J. Atkins, J. Rudolph, C. R. Jacob, M. Casapu andJ.-D. Grunwaldt, Chem. Commun., 2015, 51, 9227–9230.
13 F. Gao, D. Mei, Y. Wang, J. n. Szanyi and C. H. Peden, J. Am.Chem. Soc., 2017, 139, 4935–4942.
14 T. V. Janssens, H. Falsig, L. F. Lundegaard, P. N.Vennestrøm, S. B. Rasmussen, P. G. Moses, F. Giordanino,E. Borfecchia, K. A. Lomachenko and C. Lamberti, ACSCatal., 2015, 5, 2832–2845.
15 M. P. Ruggeri, I. Nova, E. Tronconi, J. A. Pihl, T. J. Toopsand W. P. Partridge, Appl. Catal., B, 2015, 166, 181–192.
16 C. Paolucci, I. Khurana, A. A. Parekh, S. Li, A. J. Shih, H. Li,J. R. Di Iorio, J. D. Albarracin-Caballero, A. Yezerets and J. T.Miller, Science, 2017, 357, 898–903.
17 G. M. Psofogiannakis, J. F. McCleerey, E. Jaramillo and A. C.Van Duin, J. Phys. Chem. C, 2015, 119, 6678–6686.
18 S. A. Bates, A. A. Verma, C. Paolucci, A. A. Parekh, T.Anggara, A. Yezerets, W. F. Schneider, J. T. Miller, W. N.Delgass and F. H. Ribeiro, J. Catal., 2014, 312, 87–97.
19 U. Deka, I. Lezcano-Gonzalez, S. J. Warrender, A. L. Picone,P. A. Wright, B. M. Weckhuysen and A. M. Beale,Microporous Mesoporous Mater., 2013, 166, 144–152.
20 D. Wang, L. Zhang, J. Li, K. Kamasamudram and W. S.Epling, Catal. Today, 2014, 231, 64–74.
21 J. Connerton and R. W. Joyner, in Stud. Surf. Sci. Catal., ed.N. Kruse, A. Frennet and J. M. Bastin, Elsevier, 1998, vol.116, pp. 327–334.
22 F. Gao and C. Peden, Catalysts, 2018, 8, 140.23 C. Paolucci, J. Di Iorio, F. Ribeiro, R. Gounder and
W. Schneider, in Adv. Catal., Elsevier, 2016, vol. 59,pp. 1–107.
24 F. Gao, E. D. Walter, M. Kollar, Y. Wang, J. Szanyi and C. H.Peden, J. Catal., 2014, 319, 1–14.
25 L. Olsson, K. Wijayanti, K. Leistner, A. Kumar, S. Y. Joshi, K.Kamasamudram, N. W. Currier and A. Yezerets, Appl. Catal.,B, 2015, 174, 212–224.
26 J. H. Kwak, T. Varga, C. H. Peden, F. Gao, J. C. Hanson andJ. Szanyi, J. Catal., 2014, 314, 83–93.
27 L. Ma, Y. Cheng, G. Cavataio, R. W. McCabe, L. Fu and J. Li,Chem. Eng. J., 2013, 225, 323–330.
28 K. A. Lomachenko, E. Borfecchia, C. Negri, G. Berlier, C.Lamberti, P. Beato, H. Falsig and S. Bordiga, J. Am. Chem.Soc., 2016, 138, 12025–12028.
29 A. A. Verma, S. A. Bates, T. Anggara, C. Paolucci, A. A.Parekh, K. Kamasamudram, A. Yezerets, J. T. Miller, W. N.Delgass, W. F. Schneider and F. H. Ribeiro, J. Catal.,2014, 312, 179–190.
30 S. I. Zones, US Pat., 06519954, 1983.31 S. Stoll and A. Schweiger, J. Magn. Reson., 2006, 178, 42–55.32 R. Frahm, M. Nachtegaal, J. Stötzel, M. Harfouche, J. A. van
Bokhoven and J.-D. Grunwaldt, AIP Conf. Proc., 2010, 1234,251–255.
33 J.-D. Grunwaldt, M. Caravati, S. Hannemann and A. Baiker,Phys. Chem. Chem. Phys., 2004, 6, 3037–3047.
34 B. Ravel and M. Newville, J. Synchrotron Radiat., 2005, 12,537–541.
35 A. de Juan, J. Jaumot and R. Tauler, Anal. Methods, 2014, 6,4964–4976.
36 J. Jaumot, A. de Juan and R. Tauler, Chemom. Intell. Lab.Syst., 2015, 140, 1–12.
37 P. Glatzel, M. Sikora, G. Smolentsev and M. Fernández-García, Catal. Today, 2009, 145, 294–299.
38 E. Gallo and P. Glatzel, Adv. Mater., 2014, 26, 7730–7746.39 T. Günter, PhD Thesis, Karlsruhe Institute of Technology,
2016.40 S. Y. Joshi, A. Kumar, J. Luo, K. Kamasamudram, N. W.
Currier and A. Yezerets, Appl. Catal., B, 2015, 165, 27–35.41 I. Nova, C. Ciardelli, E. Tronconi, D. Chatterjee and B.
Bandl-Konrad, AIChE J., 2006, 52, 3222–3233.42 I. Nova, M. Colombo, E. Tronconi, V. Schmeisser and M.
Weibel, SAE Int. J. Engines, 2011, 4, 1822–1838.43 A. Marberger, A. W. Petrov, P. Steiger, M. Elsener, O.
Kröcher, M. Nachtegaal and D. Ferri, Nat. Catal., 2018, 1,221–227.
44 M. Niwa and N. Katada, Catal. Surv. Asia, 1997, 1, 215–226.45 H.-Y. Chen, Z. Wei, M. Kollar, F. Gao, Y. Wang, J. Szanyi and
C. H. F. Peden, J. Catal., 2015, 329, 490–498.46 D. Zhang and R. T. Yang, Energy Fuels, 2018, 32,
2170–2182.47 J. Dědeček and B. Wichterlová, J. Phys. Chem. B, 1997, 101,
10233–10240.48 F. Giordanino, P. N. Vennestrøm, L. F. Lundegaard, F. N.
Stappen, S. Mossin, P. Beato, S. Bordiga and C. Lamberti,Dalton Trans., 2013, 42, 12741–12761.
49 M. H. Groothaert, K. Lievens, J. A. van Bokhoven, A. A.Battiston, B. M. Weckhuysen, K. Pierloot and R. A.Schoonheydt, ChemPhysChem, 2003, 4, 626–630.
50 G. Lei, B. Adelman, J. Sarkany and W. Sachtler, Appl. Catal.,B, 1995, 5, 245–256.
51 J. Dedecek, Z. Sobalik, Z. Tvaruazkova, D. Kaucky and B.Wichterlova, J. Phys. Chem., 1995, 99, 16327–16337.
52 F. Gao, E. D. Walter, E. M. Karp, J. Luo, R. G. Tonkyn, J. H.Kwak, J. Szanyi and C. H. Peden, J. Catal., 2013, 300, 20–29.
53 A. Godiksen, F. N. Stappen, P. N. Vennestrøm, F.Giordanino, S. B. Rasmussen, L. F. Lundegaard and S.Mossin, J. Phys. Chem. C, 2014, 118, 23126–23138.
54 A. Kucherov, G. Gerlock, H.-W. Jen and M. Shelef, Catal.Today, 1996, 27, 79–84.
55 A. Kucherov, H. G. Karge and R. Schlögl, MicroporousMesoporous Mater., 1998, 25, 7–14.
56 A. Kucherov, A. Shigapov, A. Ivanov and M. Shelef, J. Catal.,1999, 186, 334–344.
57 A. Godiksen, P. Vennestrom, S. Rasmussen and S. Mossin,Top. Catal., 2017, 60, 13–29.
58 A. Godiksen, F. N. Stappen, P. N. R. Vennestrom, F.Giordanino, S. B. Rasmussen, L. F. Lundegaard and S.Mossin, J. Phys. Chem. C, 2014, 118, 23126–23138.
59 L. Ma, Y. Cheng, G. Cavataio, R. W. McCabe, L. Fu and J. Li,Chem. Eng. J., 2013, 225, 323–330.
60 A. Boubnov, H. W. Carvalho, D. E. Doronkin, T. Günter, E.Gallo, A. J. Atkins, C. R. Jacob and J.-D. Grunwaldt, J. Am.Chem. Soc., 2014, 136, 13006–13015.
Reaction Chemistry & Engineering Paper
Ope
n A
cces
s A
rtic
le. P
ublis
hed
on 0
3 Ja
nuar
y 20
19. D
ownl
oade
d on
4/8
/202
2 11
:08:
24 A
M.
Thi
s ar
ticle
is li
cens
ed u
nder
a C
reat
ive
Com
mon
s A
ttrib
utio
n-N
onC
omm
erci
al 3
.0 U
npor
ted
Lic
ence
.View Article Online

1018 | React. Chem. Eng., 2019, 4, 1000–1018 This journal is © The Royal Society of Chemistry 2019
61 F. Giordanino, E. Borfecchia, K. A. Lomachenko, A. Lazzarini,G. Agostini, E. Gallo, A. V. Soldatov, P. Beato, S. Bordiga and C.Lamberti, J. Phys. Chem. Lett., 2014, 5, 1552–1559.
62 S. Brandenberger, O. Kröcher, A. Tissler and R. Althoff, Appl.Catal., A, 2010, 373, 168–175.
63 C. Henriques, M. Ribeiro, C. Abreu, D. Murphy, F. Poignant,J. Saussey and J. Lavalley, Appl. Catal., B, 1998, 16, 79–95.
64 Q. Guo, F. Fan, D. M. Ligthart, G. Li, Z. Feng, E. J. Hensenand C. Li, ChemCatChem, 2014, 6, 634–639.
65 S. Shwan, M. Skoglundh, L. F. Lundegaard, R. R. Tiruvalam,T. V. Janssens, A. Carlsson and P. N. Vennestrøm, ACSCatal., 2014, 5, 16–19.
66 D. E. Doronkin, M. Casapu, T. Günter, O. Müller, R. Frahmand J.-D. Grunwaldt, J. Phys. Chem. C, 2014, 118,10204–10212.
67 R. Sarangi, Coord. Chem. Rev., 2013, 257, 459–472.68 J. S. Woertink, P. J. Smeets, M. H. Groothaert, M. A. Vance,
B. F. Sels, R. A. Schoonheydt and E. I. Solomon, Proc. Natl.Acad. Sci. U. S. A., 2009, 106, 18908–18913.
69 W. Grünert, N. W. Hayes, R. W. Joyner, E. S. Shpiro, M.Siddiqui and G. Baeva, J. Phys. Chem., 1994, 98,10832–10846.
70 G. Turnes Palomino, P. Fisicaro, S. Bordiga, A. Zecchina, E.Giamello and C. Lamberti, J. Phys. Chem. B, 2000, 104,4064–4073.
71 Y. Kuroda, R. Kumashiro, T. Yoshimoto and M. Nagao, Phys.Chem. Chem. Phys., 1999, 1, 649–656.
72 C. W. Bauschlicher Jr, S. R. Langhoff and H. Partridge,J. Chem. Phys., 1991, 94, 2068–2072.
73 K. Inoue, K. Ohashi, T. Iino, K. Judai, N. Nishi and H.Sekiya, Phys. Chem. Chem. Phys., 2007, 9, 4793–4802.
74 A. Clemens, A. Shishkin, P.-A. Carlsson, M. Skoglundh, F.Martínez-Casado, Z. Matĕj, O. Balmes and H. Harelind, ACSCatal., 2015, 5, 6209–6218.
75 T. Günter, D. E. Doronkin, A. Boubnov, H. W. P. Carvalho, M.Casapu and J.-D. Grunwaldt, Top. Catal., 2016, 59, 866–874.
76 B. Kerkeni, D. Berthout, D. Berthomieu, D. E. Doronkin, M.Casapu, J.-D. Grunwaldt and C. Chizallet, J. Phys. Chem. C,2018, 122, 16741–16755.
77 A. R. Fahami, I. Nova and E. Tronconi, Catal. Today,2017, 297, 10–16.
78 E. M. C. Alayon, M. Nachtegaal, A. Bodi, M. Ranocchiari andJ. A. van Bokhoven, Phys. Chem. Chem. Phys., 2015, 17,7681–7693.
Reaction Chemistry & EngineeringPaper
Ope
n A
cces
s A
rtic
le. P
ublis
hed
on 0
3 Ja
nuar
y 20
19. D
ownl
oade
d on
4/8
/202
2 11
:08:
24 A
M.
Thi
s ar
ticle
is li
cens
ed u
nder
a C
reat
ive
Com
mon
s A
ttrib
utio
n-N
onC
omm
erci
al 3
.0 U
npor
ted
Lic
ence
.View Article Online