visualization of analytical processes
TRANSCRIPT

12/4/2009
1
C
a
r
n
eg
i
e
Me
l
l
1
Visualization of Analytical Processes
Ole J. Mengshoel, Marija Ilic, and Ted Selker
Carnegie Mellon University
C
a
r
n
eg
i
e
Me
l
l2
• Challenges and opportunities:
– Currently a gap between:
– Dramatic improvements in hardware and software for gathering, communicating and storing raw data; versus
– Capacity of humans to act on this data in a meaningful way
– This gap will only continue to widen in the near future
• Goals:
– Emphasis on large-scale, complex systems represented as probabilistic graphical models
– Novel, mathematical, computational and visualization methods
– Analytical processing partly done by the computer, partly by the human
• Research areas:
– Novel feature transformation and data synthesis techniques, based on probabilistic graphical models including Bayesian network
– Strong coupling of these analytical processes, using Bayesian networks, with visualizations
– Domain-independent and scalable techniques, using Electrical Power Systems as one major application
Overview of Visualization of Analytical Processes

12/4/2009
2
C
a
r
n
eg
i
e
Me
l
l3
• Previous research
– Probabilistic graphical models, Bayesian networks and arithmetic circuits
– Electrical power system application
• Research challenge
– Visual analytics for large-scale probabilistic graphical models
• Initial explorations
– Coupling of analytical processes, using Bayesian networks, with visualizations
– Domain-independent and scalable techniques, using Electrical Power Systems as major application
Overview of Talk
C
a
r
n
eg
i
e
Me
l
l
Previous Research
4

12/4/2009
3
C
a
r
n
eg
i
e
Me
l
l
Problem Statement
Diagnosis of complex engineered systems using model-based techniques is complicated by several challenges
Hybrid system behavior
Model construction
Real-time performance
Goal: Develop Bayesian methods for on-line diagnosis of complex engineered systems with real-time performance constraints
Target: Demonstrate solutions to challenges using an electrical power system as an example of a complex hybrid system that is ubiquitous to aircraft, spacecraft, and industrial systems
5
C
a
r
n
eg
i
e
Me
l
l
The Modeling Challenge
Uncertainty in EPSs
Components and sensors may fail
Sensor noise
Load-dependent noise
Many possible modesDue to relays (switches), circuit breakers, certain failures
Need for high diagnostic accuracyAvoid single-fault assumption
Large, complex systems are often Difficult to model
Tedious to extend and update
6

12/4/2009
4
C
a
r
n
eg
i
e
Me
l
l
The Hybrid Systems Challenge
Hybrid systems:
Discrete: Both healthy and faulty modes
Continuous: Both healthy and faulty behavior
Fault types in hybrid systems:
1.abrupt discrete faults
2.abrupt continuous (parametric) faults
a) offset
b) stuck
A sensor or
component may,
in general, get
stuck at any
continuous value.
A sensor or
component may, in
general, see an
arbitrarily small
and faulty drop or
increase in its
value
7
C
a
r
n
eg
i
e
Me
l
l
The Real-Time Reasoning Challenge
Real-time operating system (RTOS) used in current avionics:
Task has: period, deadline, and worst-case execution time (WCET)
Priority-based preemptive scheduling
The challenge of embedding AI into hard real-time system:
Hardness of the computational problems
High expectation and/or variance of a search algorithm’s execution time
The real-time challenge:
Diagnostic processes need to be designed within RTOS resource bounds
“Embedding AI into real-time systems” [Musliner et al., 1995]
8

12/4/2009
5
C
a
r
n
eg
i
e
Me
l
l
On January 28 1968, a faulty electrical switch created a spark which ignited the pure oxygen environment; the fire quickly killed the Apollo 1 crew.
On September 2, 1998, Swissair 111 crashed into the Atlantic Ocean, killing all 229 people onboard. It was determined that wires short-circuited and led to a fire.
A battery failure occurred on the Mars Global Surveyor, which last communicated with Earth on November 2, 2006. A software error oriented the spacecraft to an angle that over-exposed it to sunlight, causing the battery to overheat.
Electrical Power Networks: Aerospace Applications
9
C
a
r
n
eg
i
e
Me
l
l
Electrical Power Systems Testbed
• Electrical power systems (EPSs) are critical
in aerospace
• EPS loads include: avionics, propulsion, life
support, and thermal management
– increased EPS use in air- and spacecraft
• ADAPT EPS testbed at NASA Ames:
– a capability for controlled insertion of faults,
giving repeatable failure scenarios;
– a standard testbed for evaluating diagnostic
algorithms & software; and
– a stepping stone for maturing diagnostic
technologies.
See also http://ti.arc.nasa.gov/projects/adapt/
10

12/4/2009
6
C
a
r
n
eg
i
e
Me
l
l
Probabilistic Diagnosis Approach
Arithmetic
Circuit (AC)
Offline
Compilation
Online
Inference
Diagnosis:
MLV, MPE,
or MAP
Bayesian
Network (BN)
Sensor,
Commands
System
Specification
Offline
Generation
ON-LINE
PHASE
OFF-LINE
PHASE
Battery1 : battery : 0.0005;
Wire1 : wire : 0.0000 : Battery1;
Voltage1 : sensorVoltage : 0.0005 : Wire1;
Current1 : sensorCurrent : 0.0005 : Wire1;
Breaker1 : breaker : 0.0005 : Wire1;
Status1 : sensorTouch : 0.0005 : Breaker1;
Wire2 : wire : 0.0000 : Breaker1;
Relay1 : relay : 0.0005 : Wire2;
Feedback1 : sensorTouch : 0.0005 : Relay1;
Load1 : load : 0.0005 : Relay1;
Temp1 : sensorCurrent : 0.0005 : Load1 ;
Each health variable
has at least two
states (healthy and
faulty), thus enabling
the diagnoses of
zero, one, two, or
more faults.
The
ProDiagnose
algorithm.
Bayesian network Arithmetic circuit
Specification language
Battery1
Voltage1
Current1
Breaker1 Relay1 Load1
Feed-
back1
Wire1 Wire2
Status1 Temp1
See [Mengshoel
et al., 2008] and
[Mengshoel et al.,
2009] for BN
auto-construction.
11
C
a
r
n
eg
i
e
Me
l
l
Probabilistic On-Line Diagnosis
ProDiagnose/
ProADAPTCommands
Health status
Sensor readings
Probabilistic model for a vehicle’s subsystem(s):
It represents health of sensors and subsystem components explicitly
It contains random variables for other parts of the subsystem
A probabilistic approach to:
Diagnosis: health status of system component nodes
Sensor validation: health status of sensor nodes
INPUT:
Observed
Variables
OUTPUT:
Query
Variables
12

12/4/2009
7
C
a
r
n
eg
i
e
Me
l
l
Fault Types Investigated
Independent faults
Abrupt
Permanent
Discrete
Continuous (parametric)
Intermittent
Incipient
Dependent faults
Common cause
Cascading
These are the fault
types considered in
this talk.
See [Kurtoglu et al., 2009a] and
[Kurtoglu et al., 2009b] for
discussion of fault types.
13
C
a
r
n
eg
i
e
Me
l
l
Related Research
• Using Bayesian networks
– hybrid (discrete + continuous) BNs:
• clique tree based [Spiegelhalter & Lauritzen, 1988] using linear Gaussians [Olesen, 1993]
• particle filtering [Koller & Lerner, 2000]
– discrete BNs:
• fault diagnosis in terrestrial EPSs [Yongli et al., 2006], [Chien et al., 2002],
• Not using Bayesian network
– hybrid bond graphs [Narasimhan & Biswas 2007], [Daigle et al., 2008]
– general diagnostic engine [de Kleer & Williams, 1987], [Karin et al., 2006], [Bunus et al., 2009]
– convex optimization [Gorinevsky et al., 2009]
14

12/4/2009
8
C
a
r
n
eg
i
e
Me
l
l
ADAPT Experimental Testbed
Tier 1
Tier 2
Figure from [Kurtoglu et al., 2009b].
Tier 1 experiments were
substantially easier than Tier 2
experiments: • a subset of ADAPT was used
•relays were closed at all times
15
C
a
r
n
eg
i
e
Me
l
l
Bayesian Network Model of ADAPT Tier 2
The Bayesian
network model of
ADAPT Tier 2.
16

12/4/2009
9
C
a
r
n
eg
i
e
Me
l
l
Experiments, ADAPT Data
• Two types of scenarios: • Tier 1 scenarios: nominal or contained one fault
• Tier 2 scenarios: nominal or contained single, double, or triple faults
• The ADAPT EPS was used to generate fault and nominal scenarios: • Faults were injected simultaneously or sequentially
• Fault types were additive parametric (abrupt changes in parameter values) and discrete (unexpected changes in system mode)
• Faults were permanent and included both component faults and sensor faults
9 competitors in Tier 1. 6 competitors in Tier 2.
17
C
a
r
n
eg
i
e
Me
l
l
Experiments, Simulated Data
Comparison between Arithmetic Circuit Evaluation (ACE), Variable Elimination (VE) and Clique Tree Propagation (CTP)
Main conclusions:
All three inference algorithms are quite efficient, thanks to auto-generation algorithm
ACE outperforms VE (for MPE) and CTP (for marginals), both in Mean and St. Dev.
ACE is the
approach
used in
ProADAPT.
18

12/4/2009
10
C
a
r
n
eg
i
e
Me
l
l
19
• Diagnostic challenges in aerospace and at NASA:
– Modeling of large, complex systems
– Hybrid systems – discrete and continuous behavior
– Hard diagnostic problems, real time requirements
• Probabilistic diagnosis approach, ProDiagnose, with application to ADAPT electrical power system:
– Auto-generation of Bayesian network
– Compilation of Bayesian networks to real-time arithmetic circuits
– Handling of abrupt discrete and continuous (parametric) faults using discrete and static Bayesian networks
– Strong performance on electrical power system data from ADAPT testbed
Bayesian Reasoning for
Diagnostics: Operates in a
state space of size > 2500
in time < 1 ms.
Summary: Bayesian Networks for Diagnostics
C
a
r
n
eg
i
e
Me
l
l
Proposed Research
20

12/4/2009
11
C
a
r
n
eg
i
e
Me
l
l
Contributions in learning and reasoning in probabilistic graphical models, including Bayesian networks, that consider their use in visualization and human-computer interaction
Solid mathematical foundation: probabilistic graphical models (Bayesian networks, Markov random fields, factor graphs, …)
Difficulty for humans to reason under uncertainty, especially under time pressure and stress
• Visualization options
– Do not visualize uncertainty (determinism - the traditional stance)
– Visualize uncertainty
• Visualization of uncertainty has recently been shown to improve human performance
Current visualization methods for probabilistic reasoning target domains with “few” random variables – say 1 to 100 range – not in the 100 - 100,000,000 range
Goals and Expected Outcomes
versus
21
C
a
r
n
eg
i
e
Me
l
l
Networks provide opportunities to study visual analytics of large-scale interactions:
Local interactions are relatively well-understood
Inference can, due to sparseness, be made fast
Our main example network: Electric Power Systems (EPSs)
Terrestrial power grid (on a national level)
Micro-grids (vehicle, building, neighborhood, …)
Current analysis typically uses deterministic models at two time scales:
Short (several cycles at 60 Hz): dynamic differential equations
Long: steady-state power flow equations; Monte-Carlo simulation
Robustness and scalability issues because of network-wide interactions:
Blackouts in current EPS, due to cascading failures
An upgraded national EPS – Smart Grid:
Numerous distributed generator plants (wind, solar, etc.)
Their potential large number, intermittency, and unreliability is causing great concern
Background: Physical Networks
22

12/4/2009
12
C
a
r
n
eg
i
e
Me
l
l
Bayesian Network Tool Visual model
Hugin Expert Nodes, Bar charts
BayesBuilder Nodes, Bar charts
WinMine Nodes
BayesianLab Nodes
Netica Nodes, Bar charts
MSBNx Nodes
Analytica Nodes
GeNIe/SMILE Nodes, Bar-charts/pie-chart
Visualizing Bayesian Networks
23
C
a
r
n
eg
i
e
Me
l
l
� Current Bayesian network
visualizations, though useful,
have several limitations:
� Difficulty handling large-
scale domains
� Often no support for time
series data
� Often no displaying of
information (e.g., Bayesian
network) along with the
underlying data (e.g., time
series).
� Need to perform visual
search to locate interesting
information
� …
Problem Statement
Bayesian network for
diagnosis of the ADAPT
electrical power
system: 671 nodes and
790 edges
24

12/4/2009
13
C
a
r
n
eg
i
e
Me
l
l
MacroScope
(Henry
Lieberman)
SamIAm
(Adnan
Darwiche)
TreeMap (Ben
Shneiderman)
Candidate Visualizations
25
C
a
r
n
eg
i
e
Me
l
l
Probabilistic Graphical Models for Diagnosis
Visualization &
Mosaics
Large-Scale Domains
Power Distribution
Power Storage
Power Storage Power Distribution
Visualization of Analytical Processes
?
26

12/4/2009
14
C
a
r
n
eg
i
e
Me
l
l
Visualization Exploration (1)
Bifocal XY with color map and zooming.
27
C
a
r
n
eg
i
e
Me
l
l
Bifocal XY with color map, zooming, and comparison.
Visualization Exploration (2)
28
12/4/2009
15
C
a
r
n
eg
i
e
Me
l
l
Application Areas
• Aerospace: The C-MAPSS software tool is used to simulate nominal and fault engine degradation over a series of flights. In one C-MAPPS data set, 30 engine and flight condition parameters were recorded at 1 Hz for a number of flights; see https://dashlink.arc.nasa.gov/data/c-mapss-aircraft-engine-simulator-data/ for details. Another C-MAPSS data set, see https://dashlink.arc.nasa.gov/data/turbofan-engine-degradation-simulation-data-set/, contains turbofan engine degradation data.
• Engineering: Water distribution networks can be modeled using the EPANET software; see http://www.epa.gov/nrmrl/wswrd/dw/epanet.html. This software has been used to evaluate algorithms for sensor placement, which have as their goal to quickly detect contaminants [Leskovec, 2007].
• Social network data: Add Health is a longitudinal study, consisting of a representative sample, of adolescents in grades 7-12 in the United States during the 1994-95 school year. The data set contains information on the social, economic, psychological and physical health of participants, along with contextual (or network) data on family, community, school, friendships, etc. See http://www.cpc.unc.edu/projects/addhealth and [Hoff, 2007].
• Homeland security: FODAVA data sets.
• Electrical power networks: See other slides.
29
C
a
r
n
eg
i
e
Me
l
l
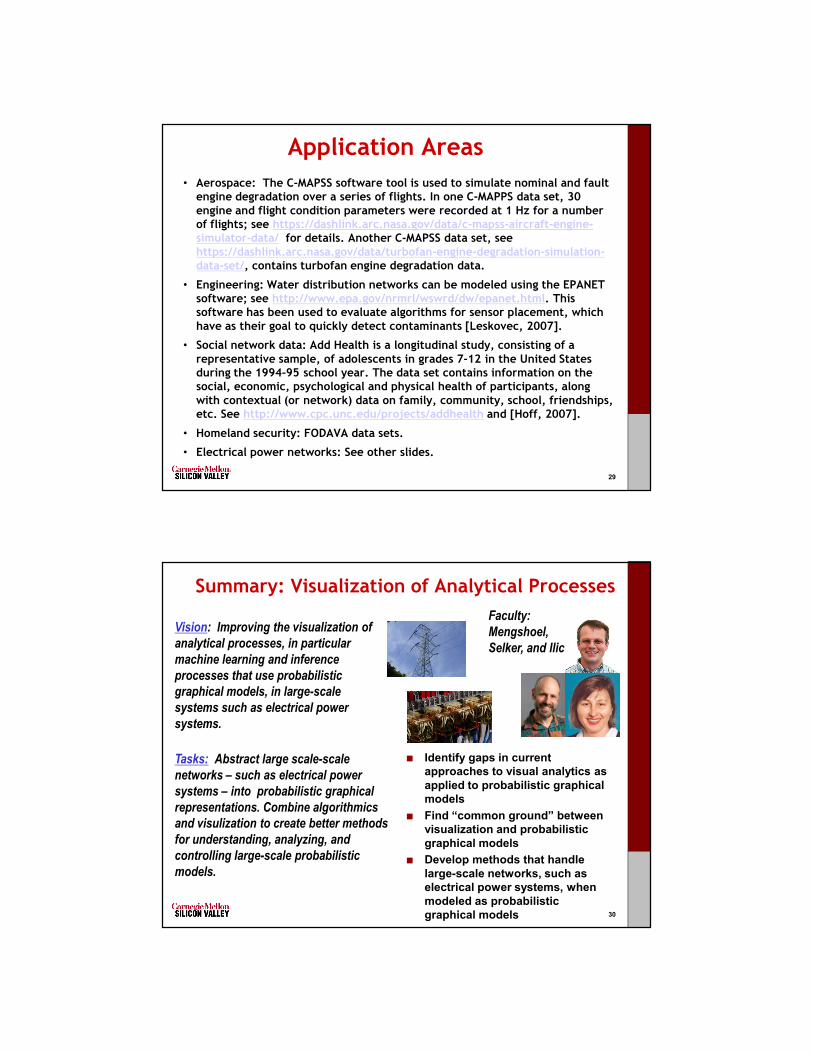
Vision: Improving the visualization of
analytical processes, in particular
machine learning and inference
processes that use probabilistic
graphical models, in large-scale
systems such as electrical power
systems.
Faculty:
Mengshoel,
Selker, and Ilic
� Identify gaps in current
approaches to visual analytics as
applied to probabilistic graphical
models
� Find “common ground” between
visualization and probabilistic
graphical models
� Develop methods that handle
large-scale networks, such as
electrical power systems, when
modeled as probabilistic
graphical models
Tasks:: Abstract large scale-scale
networks – such as electrical power
systems – into probabilistic graphical
representations. Combine algorithmics
and visulization to create better methods
for understanding, analyzing, and
controlling large-scale probabilistic
models.
Summary: Visualization of Analytical Processes
30

12/4/2009
16
C
a
r
n
eg
i
e
Me
l
l
Web and Publications• Further details:
– Intelligent sytems lab: http://mlt.sv.cmu.edu/cis/
– DASHlink - Health management technologies in aeronautics: https://dashlink.arc.nasa.gov/
– ADAPT testbed: http://ti.arc.nasa.gov/projects/adapt/
– Probabilistic diagnostics: http://ti.arc.nasa.gov/project/pca/
– Personal: http://ti.arc.nasa.gov/people/omengshoel
• Publications: – O. J. Mengshoel, M. Chavira, K. Cascio, S. Poll, A. Darwiche, and S. Uckun, “Probabilistic Model-
Based Diagnosis: An Electrical Power System Case Study.” Accepted, IEEE Trans. on Systems, Man
and Cybernetics, Part A, 2009.
– O. J. Mengshoel, S. Poll, and T. Kurtoglu. “Developing Large-Scale Bayesian Networks by
Composition: Fault Diagnosis of Electrical Power Systems in Aircraft and Spacecraft.” In Proc. of the
IJCAI-09 Workshop on Self-* and Autonomous Systems (SAS): Reasoning and Integration
Challenges, 2009.
– B. W. Ricks and O. J. Mengshoel. “Methods for Probabilistic Fault Diagnosis: An Electrical Power
System Case Study.” In Proc. of Annual Conference of the Prognostics and Health Management
Society, 2009
– O. J. Mengshoel, A. Darwiche, K. Cascio, M. Chavira, S. Poll, and S. Uckun, “Diagnosing Faults in
Electrical Power Systems of Spacecraft and Aircraft.” In Proc. of the Twentieth Innovative Applications
of Artificial Intelligence Conference (IAAI-08), Chicago, IL, 2008.
– O. J. Mengshoel, “Macroscopic Models of Clique Tree Growth for Bayesian Networks”. In Proc. of the
22nd National Conference on Artificial Intelligence (AAAI-07). July 2007, Vancouver, Canada, pp.
1256-1262.
– O. J. Mengshoel, “Designing Resource-Bounded Reasoners using Bayesian Networks: System
Health Monitoring and Diagnosis.” In Proc. of the 18th International Workshop on Principles of
Diagnosis (DX-07), Nashville, TN, May 2007.
31