analytical semantics visualization for discovering …. stab et al. / analytical semantics...
TRANSCRIPT

SIGRAD 2012A. Kerren and S. Seipel (Editors)
Analytical Semantics Visualization for Discovering LatentSignals in Large Text Collections
C. Stab, M. Breyer, D. Burkhardt, K. Nazemi, and J. Kohlhammer
Fraunhofer Institute for Computer Graphics Research IGD, Germany
AbstractConsidering the increasing pressure of competition and high dynamics of markets, the early identification andspecific handling of novel developments and trends becomes more and more important for competitive companies.Today, those signals are encoded in large amounts of textual data like competitors’ web sites, news articles, scien-tific publications or blog entries which are freely available in the web. Processing large amounts of textual data isstill a tremendous challenge for current business analysts and strategic decision makers. Although current infor-mation systems are able to process that amount of data and provide a wide range of information retrieval tools,it is almost impossible to keep track of each thread or opportunity. The presented approach combines semanticsearch and data mining techniques with interactive visualizations for analyzing and identifying weak signals inlarge text collections. Beside visual summarization tools, it includes an enhanced trend visualization that supportsanalysts in identifying latent topic-related relations between competitors and their temporal relevance. It includesa graph-based visualization tool for representing relations identified during semantic analysis. The interactiondesign allows analysts to verify their retrieved hypothesis by exploring the documents that are responsible for thecurrent view.
Categories and Subject Descriptors (according to ACM CCS): H.5.2 [Information Interfaces and Presentations]:User Interfaces—Graphical user interfaces (GUI), Interaction styles H.3.1 [Information Storage and Retrieval]:Content Analysis and Indexing—Abstracting methods
1. Introduction
The early detection of novel developments and trends is cru-cially important and confers companies a significant advan-tage over their competitors in global competition. Conceptsknown from the field of strategic management like weaksignals [Ans75] and environmental scanning [Agu67] con-stitute the theoretical foundation for detecting early warn-ings and systematically scanning the environment of an or-ganization for relevant information [Sch05]. Today, differ-ent research areas focus on adopting these concepts in dif-ferent kinds of software systems that aim at (semi-) auto-matically identifying knowledge for facilitating strategic de-cision making. On the one hand, business intelligence plat-forms consider mainly internal data, whereas competitive in-telligence platforms aim at gathering semi- or unstructureddata from the external environment of an organization withthe aim of supporting the optimization of strategic decisionmaking. The latter are also known as Strategic Early Warn-ing Systems (SEWS).
In contrast to SEWS, common information systems usuallyprovide keyword searches that make intensive use of infor-mation retrieval technologies. These search mechanisms areprimarily focused on providing the users with easy access toinformation of their interest and deal with the access to in-formation items and resources [BYRN10]. The underlyingassumption of information retrieval platforms is an initial in-formation need of the user that is usually expressed by a key-word query. In response to the given query the user receivesa sorted list that is often supplemented by Key-Word-In-Context (KWIC) snippets. In contrast to typical search tasks,weak signal discovery rarely starts with an initial intentionexpressed as a set of keywords but rather with the explo-ration of key topics and trends that are latent in an underly-ing collection of text documents. After getting an overview,analysts dive deeper into a specific topic and achieve newhypotheses and impulses by identifying novel knowledge ar-tifacts and recognizing relations between them.In this paper we present an SEWS called Signal Tracing that
83

C. Stab et al. / Analytical Semantics Visualization for Discovering Latent Signals in Large Text Collections
is based on analytical semantics visualizations for discover-ing latent signals in large text collections. The approach uti-lizes a backend system that provides semantic analysis anddata mining tools for summarizing and querying the under-lying document collection. Starting at an initial state, the in-teractions of the analyst are translated into different querieswhose results are visualized in several visualizations. In thefollowing section we briefly introduce the general process ofa SEWS followed by a detailed description of the visualiza-tion and interaction techniques that are used in Signal Trac-ing for discovering latent signals in large text collections.
2. The SEWS Process
Usually a SEWS passes through three general and repeat-ing process steps (Figure 1), namely (1) information gath-ering, (2) analysis & diagnosis and (3) reporting and de-cision making. In the first step, data is gathered and se-
Figure 1: Process of Strategic Early Warning Systems
lected either fully automated or manually by detecting keyissues in the environment of a company. In most cases thecollected data contains mainly text documents like newsfeeds, company websites, newsletters, customer ratings, etc.but it may also contain pictures and video material thatrequires additional preprocessing (e.g. image recognition,speech2text, etc.) for extracting the main content. The gath-ered text collection is analyzed during the second step ofthe process. After some preprocessing steps like stop-wordremoval and stemming, different techniques like documentclustering, classification, key term extraction, topic detec-tion and tracking (TDT) and more domain specific meth-ods like those described in [ZS06, MZ05] can be utilized tosummarize the collection and to extract latent signals. Be-side the described data mining methods, information visu-alizations are increasingly used to communicate and sum-marize the discovered information. In addition to commonvisualization techniques like pie, line and bar charts thereare also a number of more sophisticated methods like topic-based visualizations [LZP∗12, DWCR11], interactive maps[FMG05, PM06] or graph-based methods [ZS06, GM04] forexploring latent knowledge in text collections. Finally, in thethird step the inferred signals are used to evaluate strategicpossibilities, to formulate potential reactions and to assessthe consequences of uncovered trends and topics.
3. Visual Discovery of Latent Signals
The user interface of Signal Tracing is based on several visu-alization tools that cover different analytical aspects. These
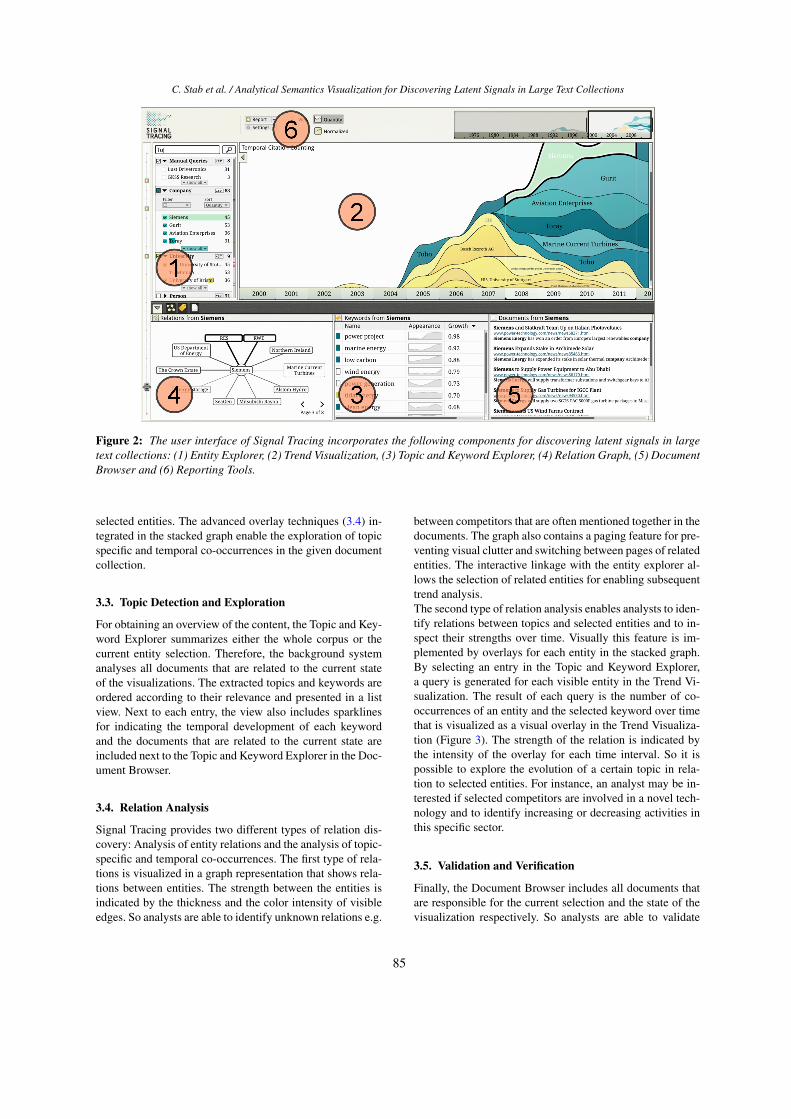
components are connected by brushing and linking tech-niques for providing multiple interactive and aspect-orientedperspectives on the underlying text collection. Altogetherthe user interface (Figure 2) integrates six different compo-nents: (1) Entity Explorer, (2) Trend Visualization, (3) Topicand Keyword Explorer, (4) Relation Graph, (5) DocumentBrowser and (6) Reporting Tools.The actual analysis and diagnosis follows a prolonged in-teractive loop of querying, exploring and refining using thetools provided by the Signal Tracing user interface and theanalytical, semantic backend system. So the analyst is ableto develop new hypotheses and to gain novel insights intothe gathered sources and to infer strategic decisions. Thisinteractive cycle includes the following tasks: (a) Entity Ex-ploration and Selection, (b) Trend Discovery, (c) Topic De-tection and Exploration, (d) Relation Analysis and (e) Vali-dation and Verification. Thanks to the design of the user in-terface and its juxtaposed components, the sequence of theseanalytical tasks is not strictly defined but analysts are able tocombine the tools in different orders. For example it is pos-sible to insert a unknown topic identified in the Topic andKeyword Explorer as a new entity for identifying its tempo-ral correlation with existing entities. Hence, it is possible toconsider new acquired knowledge from the one perspectivein another perspective to visually correlate novel insightswith already existing entities in an iterative loop. A detailedexplanation of how the components of the Signal Tracinguser interface are related to these tasks and how the com-ponents are interactively connected is provided in the nextsubsections.
3.1. Entity Exploration and Selection
The Entity Explorer presents known entities and their corre-sponding categories that are either identified during the in-formation gathering step of the SEWS process or emergedduring the semantic analysis of the given document collec-tion. For each entity the view includes the number of occur-rences for providing an overview of the quantitative distribu-tion. The Entity Explorer is directly connected with the adja-cent Trend Visualization so that the temporal characteristicsof selected entities are also visible. Thus the Entity Exploreralso serves as a kind of filtering instance for selecting enti-ties that are relevant for the further analysis. It also allowsthe definition of custom entities that can be incorporated insubsequent analysis steps.
3.2. Trend Discovery
The awareness of emerging and disappearing trends con-stitutes a decisive factor for evaluating current strategiesand for accurate strategic decisions. The Signal Tracinguser interface includes a Trend Visualization that representsthe temporal occurrence of selected entities in an extendedstacked-graph visualization. By exploring the temporal dis-tribution, analysts are able to identify correlations between
84
C. Stab et al. / Analytical Semantics Visualization for Discovering Latent Signals in Large Text Collections
Figure 2: The user interface of Signal Tracing incorporates the following components for discovering latent signals in largetext collections: (1) Entity Explorer, (2) Trend Visualization, (3) Topic and Keyword Explorer, (4) Relation Graph, (5) DocumentBrowser and (6) Reporting Tools.
selected entities. The advanced overlay techniques (3.4) in-tegrated in the stacked graph enable the exploration of topicspecific and temporal co-occurrences in the given documentcollection.
3.3. Topic Detection and Exploration
For obtaining an overview of the content, the Topic and Key-word Explorer summarizes either the whole corpus or thecurrent entity selection. Therefore, the background systemanalyses all documents that are related to the current stateof the visualizations. The extracted topics and keywords areordered according to their relevance and presented in a listview. Next to each entry, the view also includes sparklinesfor indicating the temporal development of each keywordand the documents that are related to the current state areincluded next to the Topic and Keyword Explorer in the Doc-ument Browser.
3.4. Relation Analysis
Signal Tracing provides two different types of relation dis-covery: Analysis of entity relations and the analysis of topic-specific and temporal co-occurrences. The first type of rela-tions is visualized in a graph representation that shows rela-tions between entities. The strength between the entities isindicated by the thickness and the color intensity of visibleedges. So analysts are able to identify unknown relations e.g.
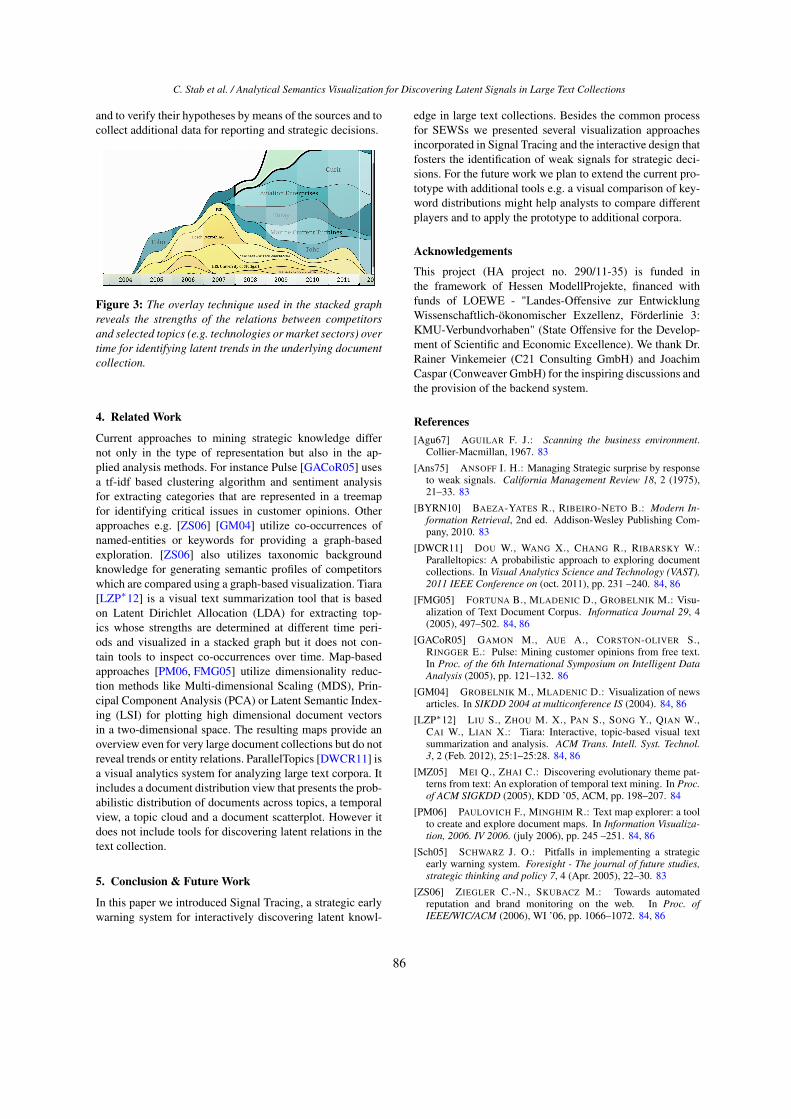
between competitors that are often mentioned together in thedocuments. The graph also contains a paging feature for pre-venting visual clutter and switching between pages of relatedentities. The interactive linkage with the entity explorer al-lows the selection of related entities for enabling subsequenttrend analysis.The second type of relation analysis enables analysts to iden-tify relations between topics and selected entities and to in-spect their strengths over time. Visually this feature is im-plemented by overlays for each entity in the stacked graph.By selecting an entry in the Topic and Keyword Explorer,a query is generated for each visible entity in the Trend Vi-sualization. The result of each query is the number of co-occurrences of an entity and the selected keyword over timethat is visualized as a visual overlay in the Trend Visualiza-tion (Figure 3). The strength of the relation is indicated bythe intensity of the overlay for each time interval. So it ispossible to explore the evolution of a certain topic in rela-tion to selected entities. For instance, an analyst may be in-terested if selected competitors are involved in a novel tech-nology and to identify increasing or decreasing activities inthis specific sector.
3.5. Validation and Verification
Finally, the Document Browser includes all documents thatare responsible for the current selection and the state of thevisualization respectively. So analysts are able to validate
85
C. Stab et al. / Analytical Semantics Visualization for Discovering Latent Signals in Large Text Collections
and to verify their hypotheses by means of the sources and tocollect additional data for reporting and strategic decisions.
Figure 3: The overlay technique used in the stacked graphreveals the strengths of the relations between competitorsand selected topics (e.g. technologies or market sectors) overtime for identifying latent trends in the underlying documentcollection.
4. Related Work
Current approaches to mining strategic knowledge differnot only in the type of representation but also in the ap-plied analysis methods. For instance Pulse [GACoR05] usesa tf-idf based clustering algorithm and sentiment analysisfor extracting categories that are represented in a treemapfor identifying critical issues in customer opinions. Otherapproaches e.g. [ZS06] [GM04] utilize co-occurrences ofnamed-entities or keywords for providing a graph-basedexploration. [ZS06] also utilizes taxonomic backgroundknowledge for generating semantic profiles of competitorswhich are compared using a graph-based visualization. Tiara[LZP∗12] is a visual text summarization tool that is basedon Latent Dirichlet Allocation (LDA) for extracting top-ics whose strengths are determined at different time peri-ods and visualized in a stacked graph but it does not con-tain tools to inspect co-occurrences over time. Map-basedapproaches [PM06, FMG05] utilize dimensionality reduc-tion methods like Multi-dimensional Scaling (MDS), Prin-cipal Component Analysis (PCA) or Latent Semantic Index-ing (LSI) for plotting high dimensional document vectorsin a two-dimensional space. The resulting maps provide anoverview even for very large document collections but do notreveal trends or entity relations. ParallelTopics [DWCR11] isa visual analytics system for analyzing large text corpora. Itincludes a document distribution view that presents the prob-abilistic distribution of documents across topics, a temporalview, a topic cloud and a document scatterplot. However itdoes not include tools for discovering latent relations in thetext collection.
5. Conclusion & Future Work
In this paper we introduced Signal Tracing, a strategic earlywarning system for interactively discovering latent knowl-
edge in large text collections. Besides the common processfor SEWSs we presented several visualization approachesincorporated in Signal Tracing and the interactive design thatfosters the identification of weak signals for strategic deci-sions. For the future work we plan to extend the current pro-totype with additional tools e.g. a visual comparison of key-word distributions might help analysts to compare differentplayers and to apply the prototype to additional corpora.
Acknowledgements
This project (HA project no. 290/11-35) is funded inthe framework of Hessen ModellProjekte, financed withfunds of LOEWE - "Landes-Offensive zur EntwicklungWissenschaftlich-ökonomischer Exzellenz, Förderlinie 3:KMU-Verbundvorhaben" (State Offensive for the Develop-ment of Scientific and Economic Excellence). We thank Dr.Rainer Vinkemeier (C21 Consulting GmbH) and JoachimCaspar (Conweaver GmbH) for the inspiring discussions andthe provision of the backend system.
References[Agu67] AGUILAR F. J.: Scanning the business environment.
Collier-Macmillan, 1967. 83
[Ans75] ANSOFF I. H.: Managing Strategic surprise by responseto weak signals. California Management Review 18, 2 (1975),21–33. 83
[BYRN10] BAEZA-YATES R., RIBEIRO-NETO B.: Modern In-formation Retrieval, 2nd ed. Addison-Wesley Publishing Com-pany, 2010. 83
[DWCR11] DOU W., WANG X., CHANG R., RIBARSKY W.:Paralleltopics: A probabilistic approach to exploring documentcollections. In Visual Analytics Science and Technology (VAST),2011 IEEE Conference on (oct. 2011), pp. 231 –240. 84, 86
[FMG05] FORTUNA B., MLADENIC D., GROBELNIK M.: Visu-alization of Text Document Corpus. Informatica Journal 29, 4(2005), 497–502. 84, 86
[GACoR05] GAMON M., AUE A., CORSTON-OLIVER S.,RINGGER E.: Pulse: Mining customer opinions from free text.In Proc. of the 6th International Symposium on Intelligent DataAnalysis (2005), pp. 121–132. 86
[GM04] GROBELNIK M., MLADENIC D.: Visualization of newsarticles. In SIKDD 2004 at multiconference IS (2004). 84, 86
[LZP∗12] LIU S., ZHOU M. X., PAN S., SONG Y., QIAN W.,CAI W., LIAN X.: Tiara: Interactive, topic-based visual textsummarization and analysis. ACM Trans. Intell. Syst. Technol.3, 2 (Feb. 2012), 25:1–25:28. 84, 86
[MZ05] MEI Q., ZHAI C.: Discovering evolutionary theme pat-terns from text: An exploration of temporal text mining. In Proc.of ACM SIGKDD (2005), KDD ’05, ACM, pp. 198–207. 84
[PM06] PAULOVICH F., MINGHIM R.: Text map explorer: a toolto create and explore document maps. In Information Visualiza-tion, 2006. IV 2006. (july 2006), pp. 245 –251. 84, 86
[Sch05] SCHWARZ J. O.: Pitfalls in implementing a strategicearly warning system. Foresight - The journal of future studies,strategic thinking and policy 7, 4 (Apr. 2005), 22–30. 83
[ZS06] ZIEGLER C.-N., SKUBACZ M.: Towards automatedreputation and brand monitoring on the web. In Proc. ofIEEE/WIC/ACM (2006), WI ’06, pp. 1066–1072. 84, 86
86