visual space-time interactions: effects of adapting to ...p.pdf · effects of adapting to spatial...
TRANSCRIPT

Perception & Psychophysics/990. 48 ~). 488-496
Visual space-time interactions:Effects of adapting to spatial frequencies
on temporal sensitivity
MARISA CARRASCOWesleyan University, Middletown, Connecticut
To study how adaptation to spatial frequency patterns affects temporal sensitivity in vision,observers were selectively adapted for 4 min to either a high- or a low-spatial-frequency sinusoidal grating (12 and 2 cpd, respectively). Their sensitivities to modulation of a blurred patch athigh or low temporal frequencies (12 Hz and 2 Hz, respectively) were measured, before and afterthe adaptation period, by using the yes/no task of signal detection theory. The data consistentlyindicated that spatial adaptation differentially affected the observers' sensitivities to temporalsignals. Specifically, when the observers were adapted to low spatial frequencies, their sensitivity to low temporal frequencies was reduced; when they were adapted to high spatial frequencies, their sensitivity to high temporal frequencies was increased. These results have implications for the psychophysical measurements oftemporal and spatial sensitivity, as well as for theissue of the separability of spatial and temporal properties of individual channels.
With respect to human spatial vision, it is now generally accepted that information undergoes parallel processing by a number of different channels, each tuned fororientation and spatial frequency (see, e.g., R. L.DeValois & K. K. DeValois, 1988; Graham, 1985; Olzak& Thomas, 1986). The human visual system seems alsoto be tuned for the detection of specific temporal frequencies or bands offrequencies (see, e.g., M. Green, 1981;Hess & Plant, 1985; Kelly, 1961). It has been found thatover a wide range of average intensities the temporal contrast sensitivity functions (TCSFs) are generally similarin shape to the spatial contrast sensitivity functions; bothdrop off slowly toward low frequenciesand quickly towardhigh frequencies. Although for the most part the two sensitivities have been studied separately, it has been recentlysuggested that a major task for future vision research willbe the integration of models of spatial sensitivity and temporal sensitivity (Olzak & Thomas, 1986; Watson, 1986).The experiment reported here was designed to contributeto this integration.
Several authors have explored the effects of spatialfactors on TCSFs. More concretely, four distinct aspectsof the spatial configuration of the stimuli have been
I thank Ron Kinchla, my thesis advisor, for guidance and supportthroughout this project. I am also indebted to Bill Prinzmetal, CarlSherrick, and Charlie Gross, members of my dissertation committee.Jim Fernandez, Cathi Best, C. W. Tyler, and two anonymous reviewersmade helpful comments on drafts of the article; the computer programwas written by Derek Gross. This experiment was part of the dissertationsubmitted by the author in partial fulfillment of the requirements forthe PhD degree at Princeton University. Some of the work was presentedat the 12th European Conference on Visual Perception (September 1989).Correspondence should be addressed to Marisa Carrasco, Departmentof Psychology, Wesleyan University, Middletown, CT 06457.
shown to reduce sensitivity at low temporal frequencies:enlarging the size of a target, removing its surround, blurring its edges, or lowering its spatial frequencies (seeWatson, 1986).
The spatiotemporal characteristics of the visual systemhave also been studied by considering the relation of temporal and spatial sensitivities in terms of their separability (see, e.g., Kelly, 1966; Koenderink & van Doom,1979; Robson, 1966). Sensitivity is separable along twodimensions if it is given by the product of their sensitivities along the individual dimensions (see, e.g., Watson,1986). Spatiotemporal separability implies that spatial tuning is altered at most by a scalar multiple with temporalfrequency and vice versa; that is, the shape of the spatialtuning curve remains constant regardless of temporal frequency (Fleet, Hallett, & Jepson, 1985; Watson, 1986;Wilson, 1980). If this condition is met, the responses ofthe underlying mechanisms to spatial and temporal modulation are said to be independent.
As Lehky (1985) has clearly expressed, "whether ornot separability occurs is an important question, forwithout it any experimental determination of spatial(temporal-) tuning curves would hold true only for theparticular temporal (spatial) conditions of that particularexperiment, whereas with separability measurements havea more general validity" (p. 1260). An essential taskwould then be to study specifically how the domains interact, and measurements of the spatial or temporal sensitivities would have to take the other domain intoconsideration.
It is generally accepted that the spatiotemporal surfaceas a whole is not separable. At high temporal frequencies, the effect of modulation on contrast sensitivity is independent of spatial frequency, whereas at low temporal
Copyright 1990 Psychonomic Society, Inc. 488

frequencies, sensitivity to low spatial frequencies is selectively reduced; that is, at low frequencies the two functions are inseparable (see, e.g., Koenderink & van Doom,1979; Olzak & Thomas, 1986; Robson, 1966; Watson,1986). However, there is some controversy regarding thepossibility of describing the system as a collection of channels whose spatial and temporal properties are separable.
Some authors maintain that the response of individualhuman spatiotemporal mechanisms is separable into aproduct of spatial and temporal functions (e.g., Harris,1984; Lehky, 1985; Wilson, 1980). Studies of both simple and complex striate neurons in the cat provide neurophysiological evidence for this position (Tolhurst &Movshon, 1975). Other authors, however, have questioned the separability of these visual mechanisms (e.g.,Fleet et al., 1985). Retinal ganglion cells in the cat showsignificant changes in spatial tuning when measured underdifferent temporal conditions (Enroth-Cugell & Lennie,1975). Furthermore, inseparable behavior has been verified for ganglion x-cells and y-cells in cats (Derrington& Lennie, 1982), and in both the phase and the amplitude components of x-cells' responses (Dawis, Shapley,Kaplan, & Tranchina, 1984). In each case, either the surround mechanism of the receptive field has a slightlylonger delay than the center mechanism, or the signalsfrom the surround undergo somewhat more temporalfiltering than those from the center (Fleet et al., 1985).
A conventional way of looking at the separability issuein individual channels is to use the psychophysical procedure of selective adaptation. By demonstrating thatprolonged exposure to one type of stimulus reduces sensitivity only to certain other stimuli, this procedure hasshown selectivity for spatial frequency, orientation (see,e.g., Blakemore & Campbell, 1969), and temporal frequency (see, e.g., Smith, 1970). In three experiments,selective adaptation effects between the spatial and temporal domains have been found. Two of these show someeffects of adapting to temporal frequencies on the perception of spatial frequencies (M. Green, 1981; Parker,1981). The third shows some effects of adapting to spatial frequencies on the detection of motion (Pantle, 1970).
The present study was carried out to explore whetheradaptation to spatial frequency patterns affects observers'sensitivities to temporal changes in luminance (flicker).Observers' sensitivities to low- or high-frequency temporal stimuli were measured before and after adaptationto spatial gratings of low or high frequency.
GENERAL METHOD
To assess temporal sensitivity, a detection task based on signaldetection theory (SOT) was used, thus allowing the measurementof very small shifts in sensitivity to temporal patterns independentlyof judgmental standards (decision criteria). There were four phases:In Phase 1, the TCSFs of 4 observers were estimated. In Phase 2,stimulus amplitudes were adjusted for each observer to yield similar discriminability values. In Phase 3, the effects of spatial adaptation on temporal sensitivity were explored by using a detection
VISUAL SPACE-TIME INTERACTIONS 489
task based on SOT. And in Phase 4, a receiver operating characteristic (ROC) was generated by manipulating the instructions givento observers in order to determine whether there were additive effects between the visual stimulus and the instructions.
The temporal stimulus was a sinusoidally modulated light-emittingdiode (LED; Hewlett Packard, HLMP-3750) that was blurred witha low-pass spatial filter. The LED was placed behind an opticaldisplay with the spatial frequency filtering properties of paralleldiffusive plates. The diffuser plates, made of frosted glass 0.32 cmthick, were 2.54 em apart. This distance, multiplied by the spatialfrequencies of the LED at the rear diffuser plate, determined thespatial frequencies of the LED visible to the observer. I The ideaof a pure temporal stimulus is an experimental construct; in reality, any presentation of a temporal stimulus will have a spatial component. In this experiment, a low-pass spatial filter was used, sinceit is known that both visually effective edges and high spatial frequencies in the target elevate the sensitivity to low temporal frequencies (Watson, 1986).
In Phase I, the temporal signals, sinusoidal variations in luminance, were controlled by a wave generator (Wavetek Programmable Generator, Model 154). In the other three phases, the signals were generated by an Apple De microcomputer. The sinusoidalvariations in luminance began at a zero-crossing and were embedded in a 2-sec Gaussian envelope.? A photocell unit monitored theLED's light output; its mean luminance was 11.7 fL, and its peakto-trough modulation was 11.24 fL (Lmu 17.32 fL and Lmin6.08 fL). The reference contrast of the LED, given by Michelsoncontrast [(Lmu-Lmin)/(Lmu+Lmin)), was 0.48. In this experiment,contrast is also represented in terms of the amount of attenuationa particular pattern undergoes with respect to this reference contrast; all signals were attenuated on a logarithmic scale (in decibels)with reference to this value.
The circular LED display subtended 10 visual angle andappearedsuperimposed on a wide (15 0 visual angle in diameter) circularhomogeneous field illuminated by wide band ("white") light. Theluminance of this field was 16 fL, measured by a photometer(Soligor Digital Spot Sensor Meter, Model 401). An LED was usedfor two reasons: It has a fast response and thus follows the appliedwaveform closely, and it emits narrow band light whose relativespectral composition is independentof intensity (Moulden, Renshaw,& Mather, 1984). The LED had a primary wavelength of 635 nrnat peak, which essentially affects only red receptors. Had a widespectrum light source been used, the activation of an observer'scolor pathways of different temporal responsiveness could have confounded the results (Nilsson, Richmond, & Nelson, 1975).
In Phase I, observers used an attenuator set equipped with I-dBsteps (Hewlett Packard 350 D), to adjust the amplitude modulation of the sinusoidal variation in luminance of the LED. In theother phases, the observers indicated whether or not they had detected a signal by using pushbuttonsconnected to the microcomputer.Throughout the experiment, the investigator monitored the stimulus presentation and the observers' adjustment settings with anoscilloscope (Tektronix 502 A dual-beam).
The observers sat in a dark room, 200 cm away from a screenonto which slides with the spatial adaptation fields were rearprojected. These patterns consisted of vertical sinusoidal gratingsof high (1O.3-cpd) or low (0.6-cpd) spatial frequencies. 3 The gratings had a wide spectral composition in which the region corresponding to the primary wavelength of the LED was well represented.The slides are of low harmonic distortion at approximately 0.6 contrast. The light bars of the gratings had a luminance, Lmu, of 12 fL,and the dark bars a luminance, Lmin, of 3 fL.
The experiment took place in a dark room. At the beginning ofevery experimental session, the observers first adapted to darknessfor 5 min. They then viewed the temporal stimulus monocularlythrough an artificial pupil with an aperture diameter of 1.8 rnrn,
490 CARRASCO
while the other eye was occluded by an eyepatch. The observers'head movements were restricted by a chinrest.
Phase 1Observers adjusted the modulation amplitude of the
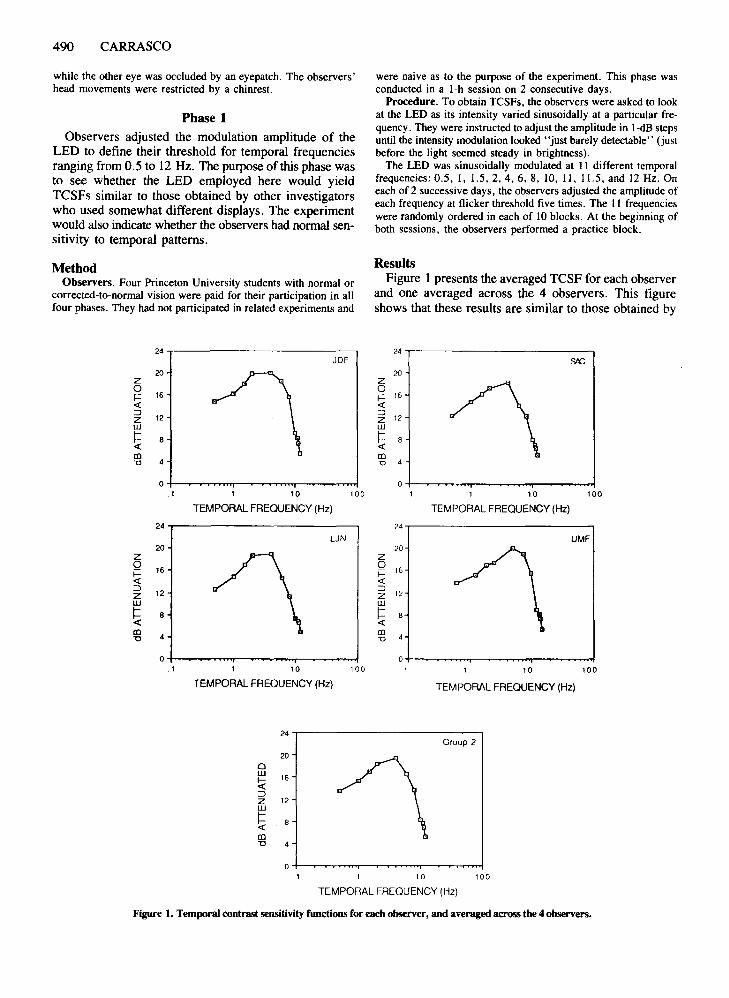
LED to define their threshold for temporal frequenciesranging from 0.5 to 12 Hz. The purpose of this phase wasto see whether the LED employed here would yieldTCSFs similar to those obtained by other investigatorswho used somewhat different displays. The experimentwould also indicatewhether the observers had normal sensitivity to temporal patterns.
were naive as to the purpose of the experiment. This phase wasconducted in a l-h session on 2 consecutive days.
Procedure. To obtain TCSFs, the observers were asked to lookat the LED as its intensity varied sinusoidally at a particular frequency. They were instructed to adjust the amplitude in I-dB stepsuntil the intensity modulation looked "just barely detectable" (justbefore the light seemed steady in brightness).
The LED was sinusoidally modulated at 11 different temporalfrequencies: 0.5, 1, 1.5,2,4,6,8, 10, II, 11.5, and 12 Hz. Oneach of 2 successive days, the observers adjusted the amplitude ofeach frequency at flicker threshold five times. The 11 frequencieswere randomly ordered in each of 10 blocks. At the beginning ofboth sessions, the observers performed a practice block.
MethodObservers. Four Princeton University students with normal or
corrected-to-normal vision were paid for their participation in allfour phases. They had not participated in related experiments and
ResultsFigure I presents the averaged TCSF for each observer
and one averaged across the 4 observers. This figureshows that these results are similar to those obtained by
24 24JDF SIC
20 20Z Z0 0F 16 F 16<l: <l:::>
12::>
12z Zw wt: 8 t: 8<l: <l:CD CD"0 4 "0 4
0 0.1 10 100 10 100
TEMPORALFREQUENCY (Hz) TEMPORALFREQUENCY (Hz)
24 24
UN UMF20 20
Z Z0
160
16F F<l: <l:::>
12::>
12z Zw wt: 8 t: 8-c <l:CD
4CD
"0 "0
0 0.1 10 100 10 100
TEMPORALFREQUENCY (Hz) TEMPORALFREQUENCY (Hz)
24Group 2
200W
16!;(::>z 12W
t: 8<l:CD"0 4
a10 100
TEMPORALFREQUENCY (Hz)
Figure 1. Temporal contrast sensitivity functions for each observer, and averaged across the 4 observers.

VISUAL SPACE-TIME INTERACTIONS 491
EXPERIMENTAL CONDITIONS
Figure 2. Change of the mean d' values before and after adaptation to a Iow-spatial-frequency grating (Ls; 0.6 cpd) or a bigb-spatialfrequency grating (lis; 10.3 cpd), for a low temporal frequency (Lt;2 Hz) and a high temporal frequency (Ht; 12 Hz).
adaptation period. The detection task was identical to that describedin Phase 2. There were also two control conditions, in which observers adapted to a homogeneous field (0 cpd) with the same meanluminance as the adaptation grating and were subsequently testedat each temporal frequency.
Each observer yielded five blocks of 50 trials per session: twopre- and three postadaptation. There were 2 sessions per condition.The order of presentation of the 12 sessions (2 sessions of 2 temporal frequencies per 3 spatial adaptation fields) was counterbalancedamong observers. At the beginning of all sessions, the observersperformed a practice block of 50 trials.
Hs HIHs ItLs HILs It
04
03~z 020i=-c 01f-o,« 000-cf-en -010n,uJ -02a:o,
-0.3
-04
ResultsFor each observer, the average was computed for the
d' values obtained in the two pre- and the three postadaptation blocks for each of the 12 sessions. The d's ofthe two sessions for the same condition were also averaged. The adaptation effect was assessed by comparingthe d's for the two low and two high temporal frequencies, in the pre- and postadaptation conditions, for gratings of high and low spatial frequencies (see Figure 2).
The d's of the four experimental conditions were subjected to a within-subjects, three-way ANOVA: adaptingspatial frequency (low vs. high) X testing temporal frequency (low vs. high) x adaptation (pre- vs. postadaptation). The overall interaction between adaptationand temporal frequency was significant [F(l,3) = 14.89,P < .05], as were the interactions for both the high- andthe low-spatial-frequency gratings [F(1,3) = 110.51,P < .001, andF(l,3) = 5.82,p < .10, respectively).Specifically, there was a significant difference betweenpre- and postadaptation sensitivities to the 2-Hz signalwhen the adaptation stimulus was a low-frequency grating [F(l,3) = 42.61, P < .01], but not when it was ahigh-frequency grating [F(l,3) = 0.29). Conversely,there was a significant difference between pre- and postadaptation sensitivities to the 12-Hz signal when the adaptation stimulus was a high-frequency grating [F(1,3) =13.40, p < .05), but not when it was a low-frequencygrating [F(l,3) = 0.27).
Phase 2The purpose of this phase was to identify the appropri
ate amplitudes of both a 2- and a 12-Hz temporal patternthat would be just discriminable from a steady light source(0 Hz) at d' values ::::: 1.5. Phase 2 took place in eight1-h sessions.
Phase 3In this phase, the effects of adaptation to spatial sinusoi
dal gratings on sensitivity to temporal patterns were investigated, using the yes/no detection task. The observerswere adapted to either a high- or a low-spatial-frequencypattern, and their sensitivity to high or low temporal frequencies was measured and compared with their sensitivity before adaptation. This phase was conducted in 12l-h sessions.
ResultsAt the end of the eight sessions, the percentages of the
waveform amplitude needed to yield the d' ::::: 1.5 valuefor the 2- and 12-Hz signals were as follows, respectively:5.8% and 23% for observer J.D.F., 12% and 45% forS.C.A., 10% and 51% for L.J.N., and 6.5% and 25% forU.M.F.
MethodStimuli and Apparatus. The amplitudes of the high and low tem
poral frequencies (12 and 2 Hz) yielded a comparable d' "" 1.5 foreach observer before adaptation. The spatial patterns were verticalsinusoidal gratings of high (10.3 cpd) or low (0.64 cpd) frequencies, rear-projected onto a screen.
Procedure. A within-subjects factorial design was utilized. Allobservers participated in four types of experimental conditions, oneper session. They adapted to a high- or a low-spatial-frequency grating, and were subsequently tested at both temporal frequencies, highand low. Following the preadaptation block, the observers wereinstructed to scan the adaptation grating slowly and continuouslyback and forth for the duration of its presentation. A postadaptationblock lasted approximately 4 min, immediately following the 4-min
other investigators (e.g., Kelly, 1961); that is, more contrast was required to perceive "flickering" at the lowerand higher frequencies of the curve and less contrast atthe middle frequencies.
MethodAt the beginning of all sessions, the observers were instructed
to perform a practice block of 50 trials of the yes/no detection task.The beginning of each trial was indicated to the observers by thesounding of a 2-sec tone. During this sample interval, the LED display was always modulated to define a signal, a variation in LEDluminance. This both alerted the observers to the onset of the trialand indicated exactly what a signal looked like. One second later,the tone again sounded for 2 sec to define the test interval duringwhich either a signal was again presented or not (in a random 50%of the trials). Two seconds after the yes/no response the computerinitiated the next trial. The observers' responses were self-paced;they typically responded within I sec. They were told that the signal would occur in a random 50% of the trials.
At each of the eight sessions, the observers performed three blocksof 100 trials, consisting of four sessions of 12-Hz signals and foursessions of 2-Hz signals in a counterbalanced order.

492 CARRASCO
Figure 3. Group z scores under conservative, neutral, and liberalinstructions (a) for a low temporal frequency (2 Hz) and (b) for ahigh temporal frequency (12 Hz).
they had in Phases 2 and 3, when they kept in mind that the LEDwould flicker in 50% of the trials.
All observers participated in four I-h sessions, two with the highand two with the low temporal frequency, 12 and 2 Hz, respectively. Each session consisted of a practice block and six blocksof 50 trials; two blocks under each of three instructions. This yielded600 trials on which to base estimates of the probability of a •'yes"response for each temporal frequency. The presentation order ofthe instructional conditions was counterbalanced among observersand experimental sessions.
-iT HIT
-+ FA
-iT HIT
-+ FA
liberal
liberal
INSTRUCTIONS
INSTRUCTIONS
conservative neutral
b) 12 Hz
co uservative neutral
a) 2 Hz
1.0
0.5
00
1.5
-15
-10
-2.0
-05
-20 -'---.----r-----.--
-1.5
-10
1.5
10
0.5
LUa: 000o(J)
-05N
LUa:oo(J)
N
ResultsFor each observer, the average was obtained of the %hit
and %FA yielded under the three instructional conditions-liberal, neutral, or conservative-for both temporalfrequencies, high and low. The results of the two sessionsfor the same condition were also averaged for each observer. The %hit and %FA for 2 and 12 Hz were converted into z scores (Figure 3).
For each temporal frequency, the z scores of the sixexperimental conditions were subjected to a within-
A t test for correlated groups was performed to compare pre- versus postadaptation sensitivities (d') in the control condition (i.e., adaptation to a homogeneous field).The difference in d's was significant for neither the lowtemporal-frequency stimulus [t(3) = 0.81], nor the hightemporal-frequency stimulus [t(3) = -0.07]. Theseresults show that it was the properties of the gratings, andnot merely luminance level, that produced the changesin sensitivity reported above.
SDT has provided a theoretical framework for the analyses conducted so far. The data obtained in this phase,however, were also analyzed in a nontheoretical way: theprobabilities of correct responses (%CR) of the four experimental conditions were subjected to a three-wayANOVA. The results were the same as those obtainedwith d'.
To summarize, the analyses presented here, %CR andd' , as well as preliminary data obtained with the methodof adjustment, all had exactly the same implications.Adaptation to the low-spatial-frequency grating significantly decreased sensitivity to the low-temporal-frequencystimulus; however, it did not affect the observers' sensitivities to the high-temporal-frequency stimulus. Moreover, a surprising result was also found: Adaptation tothe high-spatial-frequency grating significantly increasedsensitivity to the high-temporal-frequency stimulus; it didnot affect sensitivity to the low-temporal-frequency stimulus. None of the control conditions yielded significantadaptation effects.
Phase 4
The purpose of Phase 4 was to determine whether therewere additive effects between the visual stimulus and theinstructions. An ROC was generated by asking observersto perform the yes/no detection task under instructionalconditions designed to induce a "liberal," "neutral," or"conservative" judgmental standard for reporting signals.If the results obtained here would be better described bythe "unequal variance model" than by the "equal variance model" of SDT (see the Discussion section), theywould then be the basis of a theoretical "correction factor" to reanalyze the results of Phase 3.
MethodStimuli and Apparatus. Two temporal frequencies were used,
2 and 12 Hz, at the amplitudes obtained in Phase 2-that is, wherethey yielded similar discrirninability values for each observer ofd' =1.5. The experiment setting was the same as in Phase 2.
Procedure. A 3 X 2 within-subjects factorial design was utilized;all observers participated in three instructional conditions-liberal,neutral, or conservative-and were tested at both temporal frequencies, high (12 Hz) and low (2 Hz), in the yes/no detection task (seePhase 2).
The instructional conditions consisted of informing the observerhow to regard the relative importance of hits [R11 S1] and falsealarms [FA; RII SOl-that is, the typical instructions to manipulatethe criterion to report signals. To induce a liberal or a conservative judgmental standard, the observers were asked to report a signal (SI) when they either had a slight indication or were very certain that the LED had flickered. To induce a neutral judgmentalstandard, the observers were told to maintain the same criterion
subjects, two-way ANOVA: instructional condition xstimulus (%hit vs. %FA). For both temporal frequencies,stimulus and instructions had a significant effect on performance [Stimulus: F(1,3) = 82.10, P < .005, for the lowand F(1,3) = 539.22, P < .001, for the high-temporalfrequency stimulus. Instructions: F(2,6) = 36.78, p <.001, for the low- and F(2,6) = 126.09, P < .001, forthe high-temporal-frequency stimulus].
Instructions and stimulus interacted significantly at bothtemporal frequencies [F(2,6) = 9.33, p < .05, for thelow and F(2,6) = 16.24, P < .005, for the high temporalfrequency], and both factors were significant at all levels :Instructions had a significant effect on hits and FA at bothfrequencies [on hits: F(2,6) = 18.32, P < .005, at thelow and F(2,6) = 76.37, P < .001, at the high temporalfrequency.OnFA:F(2,6) = 45.28,p < .001, at the lowand F(2,6) = 90.78, p < .001, at the high temporal frequency]. Likewise, stimulus had a significant effect onthe three instructions: liberal [F(1,3) = 201.28, p < .001,for the low andF(I,3) = 235.8,p < .001, for the hightemporal frequency]; neutral [F(I,3) = 37.76,p < .01,forthelowandF(1,3) = 165.4I,p < .001, for the hightemporal frequency]; and conservative [F(I,3) = 88.25,p < .005, forthelowandF(1,3) = 445.27,p < .001,for the high temporal frequency].
According to the equal variance model of SDT, a ztransformation of %hits and %FA should reveal an additive effect of stimulus and instructions. Given that a significant interaction was found-there was no additivityeffect-the results obtained in this phase of the experiment were the basis of a theoretical correction factor usedto conduct a post hoc analysis of the results obtained inPhase 3.
Reanalysis of Phase 3 on the Basis of Phase 4It is not totally clear what factors cause certain detec
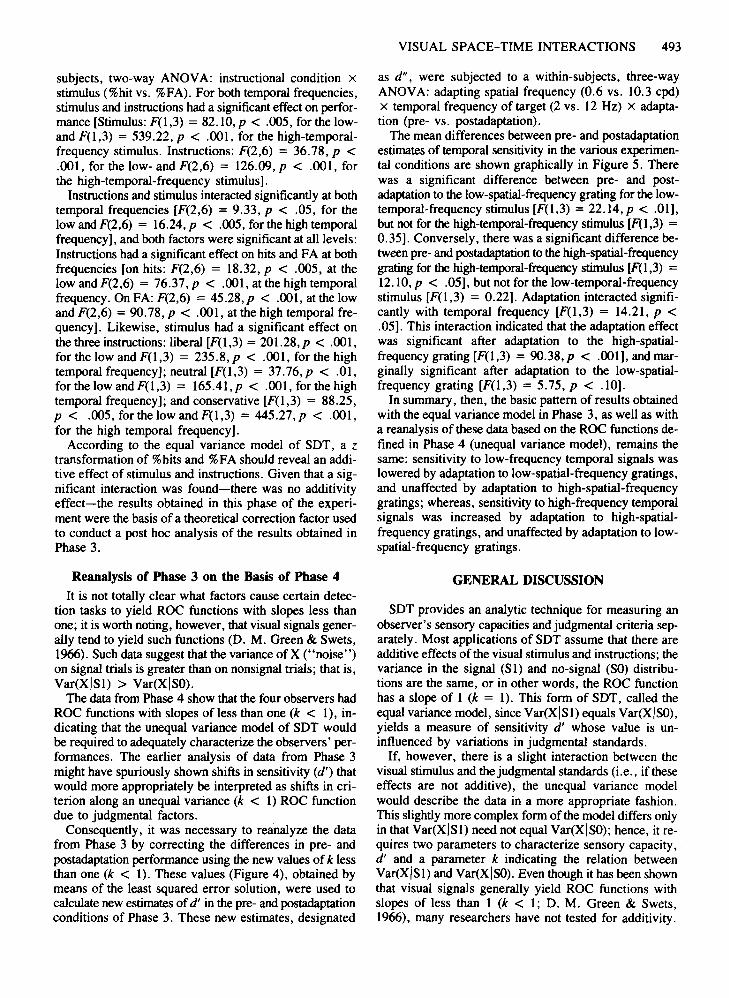
tion tasks to yield ROC functions with slopes less thanone; it is worth noting, however, that visual signals generally tend to yield such functions (D. M. Green & Swets,1966). Such data suggest that the variance of X ("noise")on signal trials is greater than on nonsignal trials; that is,Var(XjSl) > Var(XISO).
The data from Phase 4 show that the four observers hadROC functions with slopes ofless than one (k < I), indicating that the unequal variance model of SDT wouldbe required to adequately characterize the observers' performances. The earlier analysis of data from Phase 3might have spuriously shown shifts in sensitivity (d') thatwould more appropriately be interpreted as shifts in criterion along an unequal variance (k < 1) ROC functiondue to judgmental factors.
Consequently, it was necessary to reanalyze the datafrom Phase 3 by correcting the differences in pre- andpostadaptation performance using the new values of k lessthan one (k < 1). These values (Figure 4), obtained bymeans of the least squared error solution, were used tocalculate new estimates of d' in the pre- and postadaptationconditions of Phase 3. These new estimates, designated
VISUAL SPACE-TIME INTERACTIONS 493
as d", were subjected to a within-subjects, three-wayANOVA: adapting spatial frequency (0.6 vs. 10.3 cpd)x temporal frequency of target (2 vs. 12 Hz) x adaptation (pre- vs. postadaptation).
The mean differences between pre- and postadaptationestimates of temporal sensitivity in the various experimental conditions are shown graphically in Figure 5. Therewas a significant difference between pre- and postadaptation to the low-spatial-frequencygrating for the lowtemporal-frequency stimulus [F(1,3) = 22.14, p < .01],but not for the high-temporal-frequency stimulus [F(I,3) =0.35]. Conversely, there was a significant difference between pre- and postadaptation to the high-spatial-frequencygrating for the high-temporal-frequency stimulus [F(I,3) =12.10,P < .05], but not for the low-temporal-frequencystimulus [F(I,3) = 0.22]. Adaptation interacted significantly with temporal frequency [F(I,3) = 14.21, P <.05]. This interaction indicated that the adaptation effectwas significant after adaptation to the high-spatialfrequency grating [F(1,3) = 90.38, p < .001], and marginally significant after adaptation to the low-spatialfrequency grating [F(I,3) = 5.75,p < .10].
In summary, then, the basic pattern of results obtainedwith the equal variance model in Phase 3, as well as witha reanalysis of these data based on the ROC functions defined in Phase 4 (unequal variance model), remains thesame: sensitivity to low-frequency temporal signals waslowered by adaptation to low-spatial-frequency gratings,and unaffected by adaptation to high-spatial-frequencygratings; whereas, sensitivity to high-frequency temporalsignals was increased by adaptation to high-spatialfrequency gratings, and unaffected by adaptation to lowspatial-frequency gratings.
GENERAL DISCUSSION
SDT provides an analytic technique for measuring anobserver's sensory capacities and judgmental criteria separately. Most applications of SDT assume that there areadditive effects of the visual stimulus and instructions; thevariance in the signal (SI) and no-signal (SO) distributions are the same, or in other words, the ROC functionhas a slope of I (k = I). This form of SDT, called theequal variance model, since Var(XISI) equals Var(XISO),yields a measure of sensitivity d' whose value is uninfluenced by variations in judgmental standards.
If, however, there is a slight interaction between thevisual stimulus and the judgmental standards (i.e., if theseeffects are not additive), the unequal variance modelwould describe the data in a more appropriate fashion.This slightly more complex form of the model differs onlyin that Var(XjSI) need not equal Var(XISO); hence, it requires two parameters to characterize sensory capacity,d' and a parameter k indicating the relation betweenVar(XISI) and Var(X!SO). Even though it has been shownthat visual signals generally yield ROC functions withslopes of less than I (k < I; D. M. Green & Swets,1966), many researchers have not tested for additivity.

494 CARRASCO
a) 2 Hz
100
90
80
70
>- 60
I 50;f.
40
30
20
10
00
/JDF k=.87
'0203040 50 60 70 80 90'00
%FA
'00 100
90 ..: 90
~80 80
70 70
>- 60 60I >-;f.
50I 50
40 ;f. 40
30 30
20 20
'0 SCA k=63 10LJN k=64
0 00 '0 20 30 40 50 60 70 80 90 '00 0 10 20 30 40 50 60 70 80 90 '00
%FA %FA
100
90
80
70 r60
>- 50I;f. 40
30
20
'0 UMF k=.89
100
90
80 .:70
60>-I 50;f. 40
30
20
'0 GROUP, k = 077
b) 12 Hz
0102030405060708090'00
%FA
o +---,-,-,-.,---.--,---,-,-,---jo 10 20 30 40 50 60 70 80 90' 00
%FA
'00 100 '0090 90 -: 90
80 .: 80 80 -:70 70 70
60 60 60>- 50 >- 50 >-I I I 50
;f. 40 ;f. 40 ;f. 40
30 30 30
20 20 20
'0JDF k=84
'0SCA k=65 '0 LJN k=.73
0 000
0 10 20 30 40 50 60 70 80 90100 0 10 20 30 40 50 60 708090 '00 10 20 30 40 50 60 70 80 90'00
%FA %FA %FA
'00 100
90 90
80 r 80 /70 70
60 60
>- 50 >- 50I I;f.
40 ;f. 40
30 30
20 20
'0 UMF, k = 0.92 10GROUP, k = 0.84
00
0 10 20 30 40 50 60 70 80 901000 10 20 30 40 50 60 70 8090 '00
%FA%FA
Figure 4. Unequal variance receiver operating characteristic functions for each observer and averaged across the 4 observers for (a) alow temporal frequency (2 Hz), and (b) a high temporal frequency (12 Hz). Note that slope k < 1.

0.4
03
02
~ 01Cf)Wa: 000oCf) ·01N
-0.2
-03
-0.4
Ls Lt Ls Ht Hs Lt Hs Ht
EXPERIMENTAL CONDITIONS
Figure 5. Change of the mean d" (corrected d') values before andafter adaptation to a low-spatial-frequency grating (Ls; 0.6 cpd) ora high-spatial-frequency grating (lis; 10.3 cpel), for a low temporalfrequency (Lt; 2 Hz) and a high temporal frequency (Ht; 12 Hz).
In the present study, the results of Phase 4 showed thatthe unequal variance model explained the data of Phase 3more accurately than the equal variance model; on thebasis of this finding, a reanalysis of the results was carried out. The same major effects were found. Furthermore, the results obtained with the yes/no detection taskof SDT replicated those obtained in a preliminary studyin which the psychophysical method of adjustment wasemployed.
In general, an interaction is said to occur when the perception of the combination of two or more stimuli orstimulus components differs from what would be expectedif each component were perceived independently of theother. The presence ofan interaction, signaled by a changein threshold, is taken as evidence that the two stimuli shareat least some processing pathways. Conversely, the absence of an interaction is taken as evidence that the stimuliare processed by separate, and in some cases independent, neural pathways (see, e.g., Olzak & Thomas, 1986).In the present study, when observers adapted to a lowspatial-frequency grating, they experienced a decrease insensitivity to low temporal frequencies (i.e., an inhibitory effect was found), whereas when observers adaptedto a high-spatial-frequency grating, they experienced anincrease in sensitivity to high temporal frequencies (i.e.,a facilitatory effect was found).
The inhibitory effect of the low spatial on low temporalfrequencies was expected. The selective adaptation effectis often defined as a reduction in sensitivity to subsequentstimulation of the same sort after prolonged exposure toa particular stimulus. This result supports the inseparability at low frequencies. In contrast, the facilitatory effect of the high spatial on high temporal frequencies,which suggests inseparability at high frequencies, was surprising. There are, however, some instances of adaptation to one stimulus that result in an increase in sensitiv-
VISUAL SPACE-TIME INTERACTIONS 495
ity to other stimuli; lateral interactions among retinalelements are an example. This adaptation effect "disinhibits" a preadaptation inhibition; the net effect is aheightened sensitivity. One possible interpretation of thefacilitatory effect of adaptation to high-spatial-frequencytargets on sensitivity to high-temporal-frequency modulation is that of mutually inhibitory systems. Specifically,activity in the high spatially tuned system might inhibitthe activity of a high temporally tuned system. Adaptingthe high spatially tuned system could weaken its responseand thereby reduce its inhibitory effect on the high temporal system.
Although the explanation above is post hoc, there is evidence for such facilitatory interactions. Contrast sensitivity to frequencies up to two or three octaves away fromthe adaptation frequency may actually be increased by spatial adaptation (K. K. DeValois, 1977). This result suggests that spatial frequency channels are not truly independent, but rather that they may be mutually inhibitory. Theassumption of independence has also been challenged bythe results of some studies in masking (Tolhurst &Barfield, 1978) and in summation (Hirsch, Hylton, &Graham, 1982; Olzak, 1986).
Even though the inhibitory interactions revealed by suchstudies are relatively minor when compared to the largeloss of sensitivity at and around the adaptation frequency,they nonetheless allow us to understand better the physiological and psychophysical interactions and the organization underlying spatial-frequency-specific channels(R. L. DeValois & K. K. DeValois, 1988). Whereas theinhibitory interactions found in these studies have beenreported within the spatial domain, they have not, to myknowledge, been reported either in the temporal domainor between the spatial and the temporal domains.
The evidence on the separability/interaction issue isequivocal and puzzling; nevertheless, some authors assume that the spatial and temporal sensitivities are separable and proceed to report sensitivity measurements or topropose models of spatial vision (e.g., Wilson & Gelb,1984) and motion perception (e.g., Harris, 1986) basedon that assumption. Given the results of the present studyand others supporting inseparability (e.g., Fleet et al.,1985), it seems that: (1) models based on the assumptionof separability should be reviewed; (2) measurements ofeither spatial or temporal sensitivities would have to takethe other domain into account; and (3) care must be takenin generalizing from experiments in spatial vision whenonly a single value of temporal or spatial stimulation hasbeen used-or, at the very least, information about theother factor ought to be reported.
REFERENCES
BLAKEMORE, C., '" CAMPBELL, F. W. (1969). On the existence ofneurons in the human visual system selectively sensitive to the orientation and size of retinal images. Vision Research, 203, 237-260.
CARLSON, C. R., '" HEYMAN, P. M. (1979). A large format optical display for the generation of generalized psychophysical stimuli. VisionResearch, 19, 99-103.

496 CARRASCO
DAWIS, S., SHAPLEY, R., KAPLAN, E., & TRANCHINA, D. (1984). Thereceptive field organization of X cell in the cat: Spatiotemporal couplingand asymmetry. Vision Research, 24, 549-564.
DERRINGTON, A. M., & LENNIE, P. (1982). The influence of temporalfrequency and adaptation level on the receptive field organization ofretinal ganglion cells in the cat. Journal ofPhysiology, 333, 343-366.
DEVALOIS, K. K. (1977). Spatial frequency adaptation can enhance contrast sensitivity. Vision Research, 17, 1057-1066.
DEVALOIS, R. L., & DEVALOIS, K. K. (1988). Spatial vision. New York:Oxford University Press.
ENROTH-CUGELL, C., & LENNIE, P. (1975). The control of retinal ganglion cell discharge by receptive field surround. Journal of Physiology, 247, 551-578.
FLEET, D. T., HALLETT, P. E., & JEPSON, A. D. (1985). Spatiotemporalinseparability in early visual processing. Biological Cybernetics, 52,153-164.
GRAHAM, N. (1985). Detection and identification of near-threshold visualpanerns. Journal ofthe Optical Society ofAmerica A, 2, 1468-1482.
GRAHAM, N., ROBSON, J. G., & NACHMIAS, J. (1978). Grating summation in fovea and periphery. Vision Research, 18, 815-826.
GREEN, D. M., & SWETS, J. A. (1966). Signal detection theory andpsychophysics. New York: Wiley.
GREEN, M. (1981). Psychophysical relationships among mechanismssensitive to pattern, motion and flicker. Vision Research, 21, 971-983.
HARRIS, M. G. (1984). The role of panern and flicker mechanisms indetermining the spatiotemporallimits of velocity perception of uppermovement thresholds. Perception, 13,401-407.
HARRIS, M. G. (1986). The perception of moving stimuli: A modelof spatiotemporal coding in human vision. Vision Research, 26,1281-1287.
HESS, R., & PLANT, G. T. (1985). Temporal frequency discriminationin human vision: Evidence for an additional mechanism in the lowspatial and high temporal frequency region. Vision Research, 25,1493-1500.
HIRSCH, 1., HYLTON, R., & GRAHAM, N. (1982). Simultaneous recognition of two spatial frequency components. Vision Research, 22,365-375.
KELLY, D. H. (1961). Visual responses to time-dependent stimuli: 1. Amplitude sensitivity measurements. Journal of the Optical Society ofAmerica, 51, 422-429.
KELLY, D. H. (1966). Frequency doubling in visual responses. Journal of the Optical Society of America, 56, 1141.
KOENDERlNK, J. J., & VAN DOORN, A. J. (1979). Spatiotemporal contrast detection threshold surface is bimodal. Optics Letters, 4, 32-34.
LEHKY, S. R. (1985). Temporal properties of visual channels measuredby masking. Journal ofthe Optical Society ofAmerica, 2, 1260-1272.
MOULDEN, B., RENSHAW, J., & MATHER, G. (1984). Two channelsfor flicker in the human visual system. Perception, 13, 387-400.
NILSSON, T. H., RICHMOND, C. F., & NELSON, T. M. (1975). Flicker
adaptation shows evidence of many visual channels selectively sensitive to temporal frequency. Vision Research, 15, 621-624.
OLZAK, L. A. (1986). Widely separated spatial frequencies: Mechanism interactions. Vision Research, 26, 1143-1153.
OLZAK, L. A., & THOMAS, J. P. (1986). Seeing spatial patterns. InK. R. Boff, L. Kaufman, & J. Thomas (Eds.), Handbook ofperception andperformance (Vol. I, chap. 7, pp. 1-56). New York: Wiley.
PANTLE, A. (1970). Adaptation to pattern spatial frequency: Effects onvisual movement sensitivity in humans. Journal ofthe Optical Society of America, 60, 1120-1124.
PARKER, A. (1981). Shifts in perceived periodicity induced by temporalmodulation and their influence on the spatial frequency tuning of twoaftereffects. Vision Research, 21, 1739-1747.
ROBSON, J. G. (1966). Spatial and temporal contrast sensitivity functions of the visual system. Journal ofthe Optical Society ofAmerica,56, 1141-1142.
SMITH, R. A. (1970). Adaptation of visual contrast sensitivity to specifictemporal frequencies. Vision Research, 10, 275-279.
TOLHURST, D. J., & BARAELD, L. P. (1978). Interactions between spatialfrequency channels. Vision Research, 18,951-958.
TOLHURST, D. J., & MOVSHON, J. A. (1975). Spatial and temporal contrast sensitivity of striate cortical neurons. Nature, 257, 674-675.
WATSON, A. B. (1986). Temporal sensitivity. In K. R. Boff, L. Kaufman,& J. Thomas (Eds.), Handbook ofperception andperformance (Vol. I,chap. 6, pp. 1-43). New York: Wiley.
WILSON, H. R. (1980). Spatiotemporal characterization of a transientmechanism in the human visual system. Vision Research, 20, 443-452.
WILSON, H. R., & GELB, D. J. (1984). Modified line element theoryfor spatial-frequency and width discrimination. Journal of the Optical Society of America A, 1, 124-131.
NOTES
1. The bandpass characteristics of the device are characterized by xf,where x is the plate spacing and f is the spatial frequency at the reardiffuser plate. The modulation transfer function, R, is represented bythe analytical expression: R = [1.0 + 1.43 (xf)2 + 0.168 (xf)6r(Carlson & Heyman, 1979).
2. According to the formula describing the luminance profile of a sinewave grating truncated by multiplication with a Gaussian function(Graham, Robson, & Nachmias, 1978).
3. A stationary grating is not a purely spatial stimulus. Stabilized retinalimage experiments have shown that spatial discrimination requires temporal illumination changes on the retina. Under unstabilized conditions,these changes are generated by spatial translations of the retinal imageby eye movements, or in this experiment by scanning.
(Manuscript received January 22, 1990;revision accepted for publication July 9, 1990.)