effects-based spatial assessment of contaminated estuarine
TRANSCRIPT

W&M ScholarWorks W&M ScholarWorks
VIMS Articles Virginia Institute of Marine Science
2018
Effects-based spatial assessment of contaminated estuarine Effects-based spatial assessment of contaminated estuarine
sediments from Bear Creek, Baltimore Harbor, MD, USA sediments from Bear Creek, Baltimore Harbor, MD, USA
SE Hartzell
Michael A. Unger Virginia Institute of Marine Science
BL McGee
LT Yonkos
Follow this and additional works at: https://scholarworks.wm.edu/vimsarticles
Part of the Aquaculture and Fisheries Commons
Recommended Citation Recommended Citation Hartzell, SE; Unger, Michael A.; McGee, BL; and Yonkos, LT, "Effects-based spatial assessment of contaminated estuarine sediments from Bear Creek, Baltimore Harbor, MD, USA" (2018). VIMS Articles. 741. https://scholarworks.wm.edu/vimsarticles/741
This Article is brought to you for free and open access by the Virginia Institute of Marine Science at W&M ScholarWorks. It has been accepted for inclusion in VIMS Articles by an authorized administrator of W&M ScholarWorks. For more information, please contact [email protected].

RESEARCH ARTICLE
Effects-based spatial assessment of contaminated estuarinesediments from Bear Creek, Baltimore Harbor, MD, USA
Sharon E. Hartzell1 & Michael A. Unger2 & Beth L. McGee3 & Lance T. Yonkos1
Received: 17 February 2017 /Accepted: 27 June 2017 /Published online: 15 July 2017# Springer-Verlag GmbH Germany 2017
Abstract Estuarine sediments in regions with prolonged his-tories of industrial activity are often laden to significant depthswith complex contaminant mixtures, including trace metalsand persistent organic pollutants. Given the complexity ofassessing risks from multi-contaminant exposures, the directmeasurement of impacts to biological receptors is central tocharacterizing contaminated sediment sites. Though biologi-cal consequences are less commonly assessed at depth,laboratory-based toxicity testing of subsurface sediments canbe used to delineate the scope of contamination at impactedsites. The extent and depth of sediment toxicity in Bear Creek,near Baltimore, Maryland, USA, was delineated using 10-dayacute toxicity tests with the estuarine amphipod Leptocheirusplumulosus, and chemical analysis of trace metals and persis-tent organic pollutants. A gradient of toxicity was demonstrat-ed in surface sediments with 21 of 22 tested sites differingsignificantly from controls. Effects were most pronounced(100% lethality) at sites proximate to a historic industrial com-plex. Sediments from eight of nine core samples to depths of
80 cm were particularly impacted (i.e., caused significant le-thality to L. plumulosus) even in locations overlain with rela-tively non-toxic surface sediments, supporting a conclusionthat toxicity observed at the surface (top 2 cm) does not ade-quately predict toxicity at depth. In seven of nine sites, toxicityof surface sediments differed from toxicity at levels beneathby 28 to 69%, in five instances underestimating toxicity (28 to69%), and in two instances overestimating toxicity (44 to56%). Multiple contaminants exceeded sediment qualityguidelines and correlated positively with toxic responses with-in surface sediments (e.g., chromium, nickel, polycyclic aro-matic hydrocarbon (PAH), total petroleum hydrocarbon). Useof an antibody-based PAH biosensor revealed that porewaterPAH concentrations also increased with depth at most sites.This study informs future management decisions concerningthe extent of impact to Bear Creek sediments, and demon-strates the benefits of a spatial approach, relying primarilyon toxicity testing to assess sediment quality in a system withcomplex contaminant mixtures.
Keywords Sediment toxicity . Sediment chemistry .
Leptocheirus plumulosus . Tracemetals . Persistent organicpollutants . Pore water
Introduction
Sediments, particularly those of harbors and other urban estu-arine systems surrounded by myriad point and nonpointsources of chemical pollutants, are the principal repositoryfor persistent environmental contaminants (Burton 2002;Ridgway and Shimmield 2002; Wang et al. 2015). As such,sediments in regions with prolonged histories of industrialactivity are often laden to significant depths with complexmixtures of legacy contaminants, including trace metals and
Responsible editor: Ester Heath
Electronic supplementary material The online version of this article(doi:10.1007/s11356-017-9667-0) contains supplementary material,which is available to authorized users.
* Lance T. [email protected]
1 Environmental Science and Technology Department, University ofMaryland, 1451 Animal Science Bldg, CollegePark, MD 20742-2315, USA
2 Virginia Institute of Marine Science, College of William & Mary,1208 Greate Road, Gloucester Point, VA 23062, USA
3 Chesapeake Bay Foundation, Philip Merrill Environmental Center, 6Herndon Avenue, Annapolis, MD 21403, USA
Environ Sci Pollut Res (2017) 24:22158–22172DOI 10.1007/s11356-017-9667-0

persistent organic pollutants (POPs), which can be disturbedand reintroduced to surface waters, allowing for exposure,uptake, and accumulation in resident biota (Garcia et al.2011; Palma et al. 2014). To address the complexity inassessing contaminated sediment risks, researchers have reliedon integrated Bweight-of-evidence^ approaches that pairchemical analysis with laboratory and field-based biologicaleffects data (Burton 2002). This is the underlying strategy ofthe sediment quality triad approach which combines sedimentchemistry, laboratory-based sediment toxicity testing, andbenthic community structure to determine the relative risk ofa particular site (Chapman 1990). Given the complexity ofcause-and-effect relationships between multi-contaminant ex-posures and biological consequences, toxicity evaluationsplay a central role in sediment quality monitoring, by provid-ing realistic insight into the potential of sediments to elicitdeleterious biological effects (Wang et al. 2015).
Progressive improvements in analytical capabilities haveled risk assessment efforts to increasingly rely on sedimentquality guidelines to predict impacts to biological receptors.However, biological effects cannot easily be extrapolatedfrom chemical measures, especially in instances where multi-ple contaminants are present. In cases of complex contamina-tion, the inability to identify specific causative agents shouldnot be a barrier for delineation of regions of possible concern.Integrative assessments of chemical characteristics and bio-logical responses within a spatial framework can, at a mini-mum, identify those regions requiring more intense investiga-tion (Palma et al. 2014). Laboratory-based toxicity tests havebeen widely used to establish the toxicity of field-collectedsurface sediments (United States Environmental ProtectionAgency 1994). However, using toxicity testing of subsurfacesediments to delineate the depth of contamination is a relative-ly uncommon technique. Most assessments of toxicity atdepth rely exclusively on comparing chemical data from coresegments to sediment quality guidelines (Xu et al. 2014; Chenet al. 2016). Exceptions include Wang et al. (2015) whoemployed laboratory toxicity tests of sediments from variousdepths within field-collected cores from the Yangtze Riverestuary, Shanghai, China; Ingersoll et al. (2009) who usedsimilar methods to investigate toxicity at depth in sedimentfrom the Ashtabula River in Northeastern Ohio, USA; andBorgmann and Norwood (2002) who analyzedmetal bioavail-ability and toxicity to Hyalella azteca in sediment cores fromRichard Lake in Ontario, Canada.
In the present study, laboratory-based toxicity testing wasused as a tool for delineating not only the horizontal but alsothe vertical extent of sediment contamination at a historicallyimpacted site. Bear Creek in Baltimore, Maryland, was select-ed as the study site (Fig. 1). The sediments at this site havebeen extensively studied and found to contain a complex mix-ture of inorganic (e.g., zinc, chromium, copper, nickel, andlead) and organic (e.g., polycyclic aromatic hydrocarbons
(PAHs), polychlorinated biphenyls (PCBs), and organochlo-rine pesticides) contaminants (Baker et al. 1997; Ashley andBaker 1999; Hartwell and Hameedi 2007; Graham et al.2009). Studies of surface sediment toxicity, performed overthe past two decades, have also demonstrated persistent acutelethality to benthic organisms (McGee et al. 1999, 2004;Klosterhaus et al. 2006). However, attempts to assign causallinks between particular contaminants and observed toxicity,either in laboratory-based toxicity tests or assessments of ben-thic community structure, have been largely unsuccessful(McGee et al. 1999, 2004).
Bear Creek, like many historically contaminated sites, is inthe vicinity of residential and recreational areas; therefore, thepotential exists for contaminant-related human health impacts(see supplemental material Fig. S1). In regions such as this,where site remediation is a priority and redevelopment is alikely future scenario, a thorough understanding of the spatialextent of contaminant-induced toxicity is necessary to guidemanagement decisions. Absent an individual causative agentor clear understanding of multi-contaminant interactions, de-lineation of impacted regions based solely on chemical data isinadequate (Chapman 2002; Fleeger et al. 2007; Kwok et al.2014; Pourabadehei and Mulligan 2016). The first objectiveof the present study was to demonstrate the usefulness oftoxicity testing as a tool for delineating contaminant effects,particularly the unconventional use of toxicity tests on subsur-face sediments from cores. Two hypotheses related to the dis-tribution of chemical contaminants and toxicity were tested:first, that contaminant loads and toxicity of sediments woulddecrease with distance from legacy sources and second, thatcontaminant loads and toxicity within sediment cores wouldcorrespond with temporal trends of contaminant release fromindustrial sources. An additional objective of the study was tocompare toxicity results at surface and at depth to variouscontaminant classes, particularly the bioavailable fraction ofPAHs found in porewater. In pursuing this objective, conven-tional analytical techniques were used to measure variouswhole-sediment metal and POP concentrations, whereas anantibody-based PAH biosensor was used to measureporewater PAH concentrations (Li et al. 2016). The field-portable device required minimal sample volumes (≤10 mL)allowing measurement of total PAHs within the limitedporewater available from sediment core segments, demon-strating the value of the technique for low-cost pollution map-ping at contaminated sites.
Materials and methods
Site description and sample collection
The area of investigation within Bear Creek was bordered onthe east by the Sparrows Point Industrial Complex and on the
Environ Sci Pollut Res (2017) 24:22158–22172 22159

northwest by the community of Dundalk, MD (Fig. 1).Twenty two stations for sediment toxicity testing and chemicalanalysis were established in a grid comprised of roughly east-west oriented transects (Fig. 2). Sites were located in areas ofpreviously established and/or suspected toxicity, and at in-creasing distances from the shoreline (McGee et al. 1999,2004). Sites were also constrained to depositional areas dom-inated by fine-grained sediments (supplemental materialTable S2), reflecting expectations that contaminants wouldsorb to and deposit with sediments, and that fine-grained sed-iments hold more contaminants than coarse-grained sedimentsdue to their greater surface area (Forstner 1989).
Surface sediments from 20 stations were collected by boat-mounted Ponar® grab sampler on 3–4 June 2015, according
to standard protocols (American Society for Testing andMaterials 1994). On 11 June 2015, surface sediments fromtwo more sites were sampled (H2 and J1, Fig. 2). Referencesurface sediment was collected from Bigwood Cove, a tribu-tary to theWye River on the eastern shore ofMaryland. An in-system reference sample was also collected from a historicallynon-toxic location within Bear Creek approximately 2 kmnortheast of the region of investigation. Sediments from thein-system reference site have similar characteristics to those ofthe impacted sediments in Bear Creek (Table 2). While notpristine, sediments from the reference site have been shown inprevious investigations to have lower contaminant loads thanother sediments in Bear Creek (Baker et al. 1997), and to notexhibit significant toxicity to benthic organisms during 10-day
Dundalk, MD
Grey’sLandfill
Tin MillCanal
Coke Point Peninsula
WashingtonDC
Bal�more MD
Bal�more Harbor/
Patapsco River
00 400 800 16001200meter
BearCreek
Sparrows Point Industrial Complex
Shipyard
Fig. 1 Bear Creek, a tributary tothe Chesapeake Bay near themouth of the Patapsco River andBaltimore Harbor, MD, USA(inset, circle); bordered to the eastby the Sparrows Point IndustrialComplex and the northwest by thecommunity of Dundalk, MD;hashed region indicates area ofinvestigation; star indicateslocation of in-system referencesite
22160 Environ Sci Pollut Res (2017) 24:22158–22172

sediment toxicity testing (unpublished data). Each surfacesample was generated by combining the oxic layer (approxi-mately the top 2 cm of sediment) from five replicate grabsamples and homogenizing in a stainless steel bowl. Surfacesediment samples were meant to reflect conditions in the welloxygenated layer where most benthic organisms would reside.Subsamples for chemical analysis were placed into 250-mLcertified-clean amber wide-mouth jars (×2) and pre-cleaned 1-L Mason jars. Remaining sediments for toxicity testing wereplaced in pre-cleaned 2.5-L HDPE containers. All materialwas held on ice while in the field, then stored at 4 °C (toxicitysamples) or −20 °C (chemistry samples) before processing fortesting or analysis.
Core samples (10 cm diameter × 80 cm depth) were col-lected from a subset of six sites (B1, C1, F1, F2, F3, and F4)
on 28 July, 2015, and from another three sites (B2, B3, andC2) on 17 September, 2015. Core sites were selected based onresults from toxicity tests performed on surface sediments.Sediment cores were collected using an in-house fabricatedcoring device that employed single-use PVC core housingsand a vacuum piston to displace water and retain samples.Sediment cores were capped for transport to the UniversityofMaryland, and then stored vertically at 4 °C until processed.Before the initiation of sediment tests, PVC core housingswere split lengthwise with electric sheet-metal shears andcores were segmented by depth, at 10 cm increments from 0to 40 cm and 20 cm increments from 40 to 80 cm. Theresulting volume of sediment in the 10 cm segments was785 mL. Core segments were thoroughly homogenized,100 mL subsamples were centrifuged (3500g × 15 min), and
% Survival
0 – 20
21 – 40
41 – 60
61 – 80
81 – 100
A283%
B169%
A176%
B391% B2
67%
C128%C2
54%
D18%
D242%
D367%
E10%E3
5%
E22%
F11%
F445%
F3 29%
F29%
G113%
H261%
H130%
G249%
J142%
Tin Mill Canal
REF≥90%
Sparrows Point Industrial Complex
Shipyard
Grey’sLandfill
Tin MillCanal
Dundalk, MD
0 240 480 720 960 1200
meter
Fig. 2 Spatial display ofamphipod Leptocheirusplumulosus survival (color-codedin 20% increments) in 10-daytoxicity tests of surface sedimentscollected from Bear Creek,Baltimore, MD, USA, June 2015;star indicates in-system referencesite
Environ Sci Pollut Res (2017) 24:22158–22172 22161

supernatant (porewater) was stored in 60-mL pre-cleaned am-ber glass jars for PAH analysis. Remaining sediments werestored in re-sealable plastic zipper bags at 4 °C before process-ing for toxicity testing or analysis.
Sediment toxicity tests
Toxicity of sediment samples was investigated using the ben-thic estuarine amphipod Leptocheirus plumulosus followingmethods described in theMethods for Assessing the Toxicity ofSediment-associated Contaminants with Estuarine andMarine Amphipods (United States Environmental ProtectionAgency 1994), with any deviations noted. Test organisms (2to 4 mm length) were provided by Chesapeake Cultures, Inc.,Hayes, VA. Chambers used for the tests were glass 1-LMasonjars, which were pre-cleaned with soap and water, 50% nitricacid, and acetone, and triple rinsed with deionized water. Oneday prior to test initiation (i.e., day −1), aged and aerateddechlorinated municipal water was temperature (23 °C) andsalinity (15 ppt; Crystal Sea® Bioassay Formula Marinemix)adjusted to approximate estuarine conditions, and was addedto test chambers containing 175 mL of sediment to a finalvolume of 1.0 L. Overlying water was siphoned from cham-bers and replaced after 24 h before initiating exposures byloading test organisms on day 0. Water quality parameters(pH, DO, temperature, salinity, NH3) were measured in over-lying water from all test chambers prior to and after removal ofwater on day 0 and daily from one replicate/treatment until theconclusion of the test. Two rounds of toxicity bioassays wereperformed with surface sediments. These bioassays used fivereplicate chambers with 20 amphipods loaded in each testchamber. Organisms were not fed during 10-day static tests.The first exposure round began 9 June 2015 and the secondbegan 23 June 2015. An additional test chamber was preparedfor each treatment on day −1 for the purpose of determiningporewater ammonia. On day 0, water was decanted from thesechambers, sediment was centrifuged at 3000g for 15 min, andsupernatant was collected for porewater ammonia analysis bythe Nesslerization method (United States EnvironmentalProtection Agency 1983) using a LaMotte Smart3Colorimeter (LaMotte, Chestertown, MD).
Toxicity tests for sediment core samples were conductedunder the same protocols as surface sample tests (UnitedStates Environmental Protection Agency 1994) with severalnecessary modifications. Given space limitations of the testingtable, cores were tested in groups of three, with exposuresinitiated 4 August 2015 for cores B1, C1, and F1; 28 August2015 for cores F2, F3, and F4; and 8 October 2015 for coresB2, B3, and C2. Core segments only provided sufficient sed-iment volume to run four replicate chambers at volumes of150 mL/chamber. Reference sediments were accordingly pre-pared with only 150 mL of sediment/chamber but were stilltested using five replicate chambers. Limited material also
precluded setup of an additional beaker for the sole purposeof porewater ammonia analysis. Instead, ammonia was mea-sured in the porewater from the subsample collected for PAHanalysis. Because this material was not allowed to sit in testchambers containing overlying water for 24-h before analysis,porewater values for core segment samples potentially over-estimate the ammonia concentrations that were present in bea-kers at the time that organisms were loaded.
Sediment chemical analysis
Whole sediments from surface samples were transported onice to the University of Maryland Chesapeake BiologicalLaboratory, Solomons, MD, for trace metal analysis.Following acid digestion (HNO3) as described in USEnvironmental Protection Agency Method 3052, concentra-tions of chromium (Cr), zinc (Zn), Copper (Cu), nickel (Ni),lead (Pb), vanadium (V), and arsenic (As) were determined byinductively coupled plasma-mass spectrometry (ICP-MS;Hewlett-Packard 4500) using USEPA Method 6020 (UnitedStates Environmental Protection Agency 1995, 2014). Wholesediments from all surface samples were analyzed for PAHsand total petroleum hydrocarbon (TPH) and a subset of 10samples were also analyzed for PCBs. Persistent organic pol-lutant analyses were performed by the Geochemical andEnvironmental Research Group (GERG) at Texas A&MUniversity using methods described previously by Kirmanet al. (2016). Analysis was by GC/MS with TPH and PAHsmeasured using a flame ionization detector and PCBs mea-sured in selected ion mode (SIM). Total sediment PAH(PAHsed) was calculated as the sum of 46 targeted PAH con-geners and total PCB was calculated as the sum of 175targeted PCB congeners.
Porewater PAH analysis
Aqueously available PAH (PAHpw) was determined by ana-lyzing porewater fractions from all surface sediment samplesand from all segments of sediment cores using an antibody-based PAH biosensor. The antibody used was 2G8, an anti-pyrene-butyric acid monoclonal antibody produced in mice,which is sensitive to all 3- to 5-ring PAHs (Li et al. 2016).Sediment samples were centrifuged (3500g × 15 min) to ex-tract porewater, which was then glass-fiber filtered to 0.7 μm.Spier et al. (2011) describe the automated sample-handlingprogram of the KinExA Inline Sensor. Phenanthrene standardswere used to create a standard curve to estimate final concen-trations in porewater samples. Analysis of PAHpw was con-ducted according to methods in Li et al. (2016). PAHpw wasused as a proxy for other chemicals in sediment cores, givencost, and sediment volume constraints which limited the anal-ysis that could be performed on toxicity-tested sediments.
22162 Environ Sci Pollut Res (2017) 24:22158–22172

Statistical analysis
Survival data (the only toxicological endpoint for theLeptocheirus plumulosus test) were arcsine square root trans-formed and tested by one-way analysis of variance (ANOVA)followed by Dunnett’s multiple comparison. Data not satisfyingnormality or homogeneity of variance requirements for paramet-ric statistics were tested using Kruskal-Wallis one-way ANOVAon ranks followed by Dunn’s multiple comparison. Treatmentmeans were compared to both in-system and out-of-system ref-erence sediments. Pearson product moment correlation coeffi-cients were computed to measure the strength of associationbetween variables including toxicity test survival and eachchemical parameter. Statistical analyses were carried out usingSigma-Stat version 12.0 (Systat Software, Inc., San Jose, CA)with significance set at a minimum probability level of p = 0.05.
Results
Toxicity tests—surface sediments
Water quality parameters in overlying water were monitoredthroughout the surface sediment toxicity tests and all valuesremained within acceptable parameters (water quality provid-ed in supplemental material Table S3). Survival in the 22 BearCreek surface sediment toxicity tests ranged from 0 to 91%(Table 1; individual replicate survival data provided in supple-mental material Table S4). Of the 11 test sites included in thefirst toxicity test series, all but 1 (B3) were found to differsignificantly from the Bigwood Cove reference sediment,which had 98% survival. Eight of 11 sediments also differedsignificantly from the in-system reference sediment (90% sur-vival), exceptions were A1, A2, and B3. All 11 test sites in-cluded in the second toxicity test series were found to differsignificantly from Bigwood Cove and in-system referencesediments which had survivals of 99 and 98%, respectively.Observed toxicity was greatest in surface sediments from sitesmost proximate to Tin Mill Canal, a drainage swaledischarging surface runoff and groundwater leachate frommuch of the industrial site (Fig. 1), and diminished with in-creasing distance from this location. Survival of amphipods in10-day toxicity tests was strongly correlated with distancefrom the location of the Tin Mill Canal discharge (r2 = 0.77)(Fig. 3).More generally, survival data indicated an east to westgradient along longitudinal transects, with locations nearestthe industrial complex causing the most lethality and locationsfurther from the complex causing the least.
Trace metals analyses—surface sediments
Surface sediment metal concentrations are reported in Table 1with effects range median (ERM) values (indicating the
concentration at which biological effects were observed 50%of the time in other studies; Long and Morgan 1991) includedfor comparative purposes. Zinc concentrations ranged from605 to 2295 μg/g and exceeded the ERM (410 μg/g) through-out the entire system (Table 1; Fig. 4a). Chromium concentra-tions ranged from 467 to 3196 μg/g and also exceeded theERM (370 μg/g) throughout the system (Table 1; Fig. 4b).Sediment samples from 14 sites exceeded the 52 μg/g NiERM (Table 1, Fig. 4c). Nine sites exceeded the 220 μg/gPb ERM, four exceeded the 9.6 μg/g Cd ERM, two exceededthe 270 μg/g Cu ERM, and none exceeded the 70 μg/g AsERM (Table 1). In general, within east-west transects, metalconcentrations were highest in proximity to the industrialcomplex and diminished with increasing distance. A notableexception was transect B where most metals concentrationswere highest at B3, the westernmost sample site.
Persistent organic pollutants analyses—surface sediments
Total PAH, total PCB, and TPH in surface sediments are re-ported in Table 1 with sediment reference guidelines providedfor comparative purposes (Long and Morgan 1991; Inouye2014). Individual PAH and PCB congener results are providedin supplemental material (Tables S5 and S6, respectively). Forall contaminant classes, several sites within Bear Creekexceeded sediment quality guidelines. Sediment PAH concen-trations (PAHsed) ranged from 12.3 to 98.4 μg/g, exceedingthe 35.0 μg/g ERM at 7 of the 22 sites. Sites bordering thesouthern portion of the industrial complex (E1, F1, G1, H1,J1) had the highest concentrations (Fig. 4d). Concentrations ofTPH ranged from 1547 to 54,684 μg/g with 17 of the 22 sitesexceeding the 3600 μg/g screening level sediment qualitystandard (SL-SQS) and highest concentrations at F1 and E1(>15-fold exceedance and >7-fold exceedance, respectively;Fig. 4e). Concentrations of total PCB (only tested in 10 sam-ples) ranged from 0.37 to 1.16 μg/g with 7 of 10 sites exceed-ing the 0.40 μg/g ERM (highest concentrations again at F1and E1).
Porewater PAH concentrations from surface sediment sam-ples, measured by antibody-based PAH biosensor, rangedfrom 0.30 to 6.72μg/L (Table 1; Fig. 4f). Concentrations wereagain highest along the southern margin of the industrial fa-cility (E1, F1, G1) and tended to diminish with increasingdistance. Currently, no established screening guideline existsfor PAH contamination of sediment porewater. Only a smallfraction of the total PAH measured in whole sediments wasfound in porewater, reflecting the dominant partitioning of thehydrophobic compounds to the solid phase. Ratios of PAHsed
(measured by GC/MS) to PAHpw (measured by PAH biosen-sor) for the 22 surface sediment samples were on the order of104 to 105, closely reflecting the range of KOC values for 3- to5-ring PAHs (Chiou et al. 1998).
Environ Sci Pollut Res (2017) 24:22158–22172 22163

Relationship of surface sediment toxicity to contaminantclasses
For both inorganic and organic contaminants, sediments inBear Creek frequently exceeded reference values for sedimentquality, indicating the potential of these contaminants, individ-ually or collectively, to cause toxicity within the system(Table 1). Relationships between specific contaminant classesand observed mortality were explored through a PearsonProduct Moment Correlation, summarized in Table 2.Mortality had significant positive correlations with Cr, Ni,
PAHsed, PAHpw, and TPH, whereas correlations with Zn andCu were only weakly positive and not statistically significant.Contaminants tended to covary with one another such thatsediments that caused the greatest toxicity also carried thegreatest loads of virtually all contaminant categories(Table 2). Curiously, PAHpw had significant positive correla-tions with Cr, Cu, and Ni (but not Zn), while PAHsed did nothave a significant correlation with any of the measured metals(Table 2). This suggests, at least within the Bear Creek system,that PAHpw may be a better proxy for estimating trends inconcentrations of metals than PAHsed. Porewater ammonia
Table 1 Results of sediment toxicity tests (% survival ± standard deviation) and chemical analysis of surface sediments collected from Bear Creek,Baltimore MD, June 2015
Site Survival(%)
Whole sediment (dry wt) Porewater
Zn(μg/g)
Cr(μg/g)
Cu(μg/g)
Ni(μg/g)
Pb(μg/g)
As(μg/g)
Cd(μg/g)
PAH(μg/g)
PCB(μg/g)
TPH(μg/g)
PAH(μg/L)
Ammonia(mg/L)
Reference 99 ± 2.2a – – – – – – – – – – – 4.398 ± 2.7b
In-systemreference
98 ± 2.7a 1018 455 132 45 134 17 5.1 8.9 – 2485 0.49 4.690 ± 17.3b
A1 76 ± 16.7b 1363 913 164 58 203 29 7.6 12.3 0.4 5779 0.47 2.3
A2 83 ± 9.8b 1525 966 196 48 231 30 13.0 15.3 – 12,358 0.41 2.3
B1 69 ± 14.8b 1514 987 156 66 194 34 12.7 13.8 0.5 7504 0.51 1.5
B2 67 ± 9.1b 1586 1066 183 60 239 30 7.4 16.3 – 6204 0.39 1.6
B3 91 ± 8.2b 2230 1220 316 83 352 44 10.3 16.1 0.39 4206 0.39 1.9
C1 28 ± 13.0b 2295 2686 229 118 225 51 9.3 15.3 0.63 11,745 0.51 2.4
C2 54 ± 17.1b 1390 932 171 22 240 12 2.6 20.6 – 4436 0.50 2.2
D1 8 ± 8.4b 1569 1153 164 63 177 28 6.6 16.2 0.76 19,254 0.80 3.4
D2 42 ± 12.0b 1168 853 148 53 190 22 5.0 18.4 0.37 5680 0.83 2.7
D3 67 ± 14.8b 920 547 79 33 184 36 4.1 26.0 – 1908 0.38 2.1
E1 0a 2295 2686 229 118 225 51 9.3 45.0 1.16 25,794 2.32 9.7
E2 2 ± 2.7a 1451 1282 176 72 179 28 5.5 15.7 0.44 22,479 0.51 9.5
E3 5 ± 5a 1146 882 138 48 184 31 6.4 34.9 – 4517 0.30 6.6
F1 1 ± 2.2a 1416 3196 213 128 96 25 5.0 49.9 1.09 54,684 4.37 11.8
F2 9 ± 8.9a 1655 1240 177 76 189 34 6.9 39.6 – 15,258 0.90 6.8
F3 29 ± 17.8a 983 720 140 59 175 27 5.3 23.2 0.38 5759 0.46 9.9
F4 50 ± 14.1a 1379 800 187 44 485 62 4.8 42.2 – 2504 0.55 8.6
G1 13 ± 11.1a 2001 1721 343 69 384 45 13.2 98.4 – 12,680 6.72 4.6
G2 49 ± 21.6a 986 857 114 37 259 56 2.5 34.9 – 1557 0.43 11.1
H1 34 ± 12.5b 706 601 144 62 146 30 4.9 44.4 – 4457 0.62 2.6
H2 61 ± 13.9a 605 467 98 39 151 25 2.2 27.3 – 1742 0.42 9.5
J1 42 ± 29.1a 775 615 142 44 190 28 2.6 57.7 – 1547 0.64 6.2
Sediment referenceguidelinec
410 370 270 52 220 70 9.6 35.0 0.4 3600 – 60
PAH polycyclic aromatic hydrocarbons, PCB polychlorinated biphenyls, TPH total petroleum hydrocarbona Exposure assay begun June 9, 2015b Exposure assay begun June 23, 2015c Reference guidelines: effects range-median (ERM) for metals, PAH and PCB (Long and Morgan 1991); proposed screening level sediment qualitystandards (SL-SQS; Inouye 2014) for TPH; water quality standard for ammonia (USEPA 1994); concentrations in italics exceed guidelines; bold survivalvalued differ significantly from reference treatment (Kruskal-Wallis one-way ANOVA; p = 0.05)
22164 Environ Sci Pollut Res (2017) 24:22158–22172

(NH3) also correlated positively with mortality. However, be-cause concentrations were <12 mg/L, well below the 60 mg/Ltest threshold (United States Environmental ProtectionAgency 1994), NH3 likely was not a significant contributorto observed mortality in surface sediments.
Generally, the region of greatest toxicity and greatestcontamination was arrayed in proximity to the central por-tion of the industrial complex (i.e., E1, F1 near the Tin MillCanal discharge; Fig. 2) with POP concentrations compar-atively high to the south and metal concentrations morevariable and high to the north (Fig. 4a–f). The spatial rela-tionship between toxicity and contamination was particu-larly evident for Cr, Ni, PAHsed, PAHpw, and TPH.Concentrations of other trace metals also co-occurred withsubstantial toxicity in proximity to the Tin Mill Canal dis-charge; however, several sites exhibiting minimal toxicity(e.g., A2, B3) had disproportionately high metals (e.g., Znat site B3; Fig. 4a).
Core sediment toxicity, ammonia, and porewater PAHs
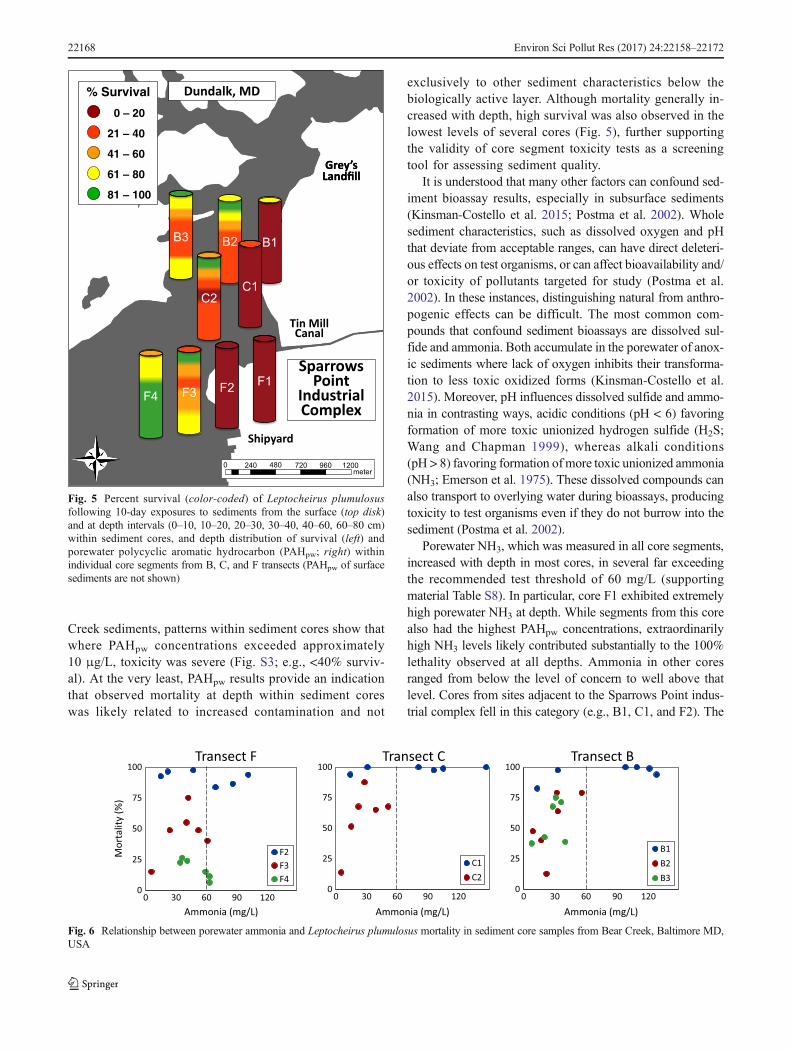
Water quality parameters in overlying water were moni-tored throughout the 10-day core segment toxicity tests(supplemental material Table S7). Dissolved oxygen(DO) remained above the acceptable minimum (≥60 satu-ration) in all treatments. However, pH decreased over timein the overlying water of several treatments; most notably,segments from the B3 core, and to a lesser extent, segmentsfrom the B2 and C2 cores. Ammonia in sedimentporewater increased with depth in most cores, exceedingthe recommended test level of 60 mg NH3/L in six of ninecores at lower depths (supplemental material Table S8).Test chambers holding sediments with high porewater
ammonia levels saw progressive increases in ammonia inoverlying water during 10-day amphipod exposures. Mostnotable was the F1 core which had porewater NH3 concen-trations substantially in exceedance of 60 mg/L at alldepths, causing ammonia in overlying water to reach con-centrations as high 65 mg/L.
Bear Creek sediment cores revealed a variety of verticaland horizontal patterns with respect to organism survival(Fig. 5; replicated survival results in supplemental materialTable S9). Cores from B1, C1, F1, and F2, all near theindustrial complex shoreline, showed substantial mortalitythroughout entire column depths from surface to 80 cm.Compared to toxicity results from surface grab samples(comprised of the top 2 cm of multiple grabs), cores fromB1 and C1 were substantially more toxic below the surface(i.e., homogenized sediment from the top 10 cm). Coresfrom B2 and C2 had a different pattern with a moderatelytoxic surface layer underlain by a relatively non-toxic top10 cm, but with increasing toxicity at depth. Toxicity ofsediments from B3 and F3 were relatively non-toxic nearthe surface, with mortality peaking in middle sections andsurvival improving with increased depth. The F4 coreshowed the greatest survival at depth, with only the top20 cm exhibiting toxicity. Spatially, cores taken proximateto the industrial complex (B1, C1, F1, and F2) were in-tensely toxic from the surface to 80 cm. At virtually alldepths severity of toxicity decreased with increasing hori-zontal distance from the industrial complex (Fig. 5).
This study also used PAHpw as a proxy for total contam-inant loads at depth and found that concentrations followeda similar pattern to mortality. In eight of nine sedimentcores, PAHpw concentrations increased with depth, with60–80 cm segments exceeding 0–10 cm segments by upto 37-fold (Fig. 5). This was most apparent in the F1 core(adjacent to the Tin Mill Canal discharge) which had pro-gressively increasing PAHpw concentrations from13.6 μg/L in the 0–10 cm segment to 40.1 μg/L in the60–80 cm segment. In comparison, the PAHpw concentra-tion in the F1 surface sediment sample (top 2 cm) was only4.4 μg/L. The only exception to this pattern was the F4core, which had modestly higher PAHpw concentrations at10–40 cm depths (maximum 6.7 μg/L) than 40–80 cmdepths (2.1 μg/L). In several cores, PAHpw concentrationsalso differed considerably between the surface (top 2 cm)and the homogenized top 10 cm. Cores from B1 and C1,which caused greater mortality in top 10 cm segments thansurface samples, also had 1.5-fold and 3.6-fold higherPAHpw concentrations, respectively, in top 10 cm segmentsthan surface sediments. Other cores had similarly largedisparities between PAHpw concentrations in the surfacelayer and the top 10 cm. For example, PAHpw concentra-
R² = 0.7706
0
25
50
75
100
0 500 1000 1500 2000
Surv
ival
(%)
Distance from Tin Mill Canal Discharge (m)Fig. 3 Linear relationship between Leptocheirus plumulosus survival in10-day sediment toxicity tests and the distance of the Bear Creek surfacesediment source from the point of discharge of Tin Mill Canal
Environ Sci Pollut Res (2017) 24:22158–22172 22165

tions in the top 10 cm of cores from F1, F2, and F4 were3.1-fold, 4.3-fold, and 1.9-fold higher, respectively, than insurface sediments.
Discussion
Results of the current study confirm those of previousinvestigations in the region, which show that surface sed-iments are severely toxic and that they contain a spatiallyvariable mixture of trace metals and persistent organiccontaminants (McGee et al. 1999, 2004; Baker et al.1997; Ashley and Baker 1999; Hartwell and Hameedi2007). Results of surface sediment tests also demonstratethe spatial relationship between observed toxicities andterrestrial features of the Sparrows Point industrial com-plex, including the Tin Mill Canal drainage feature (Figs.
2 and 3). Results of core sediment tests provide usefulinformation for delineating the area of historical impactwithin Bear Creek. Specifically, core results support aconclusion that toxicity observed at the surface (top2 cm) does not adequately predict toxicity at depth. Inseven of nine cores, surface toxicity differed from toxicityin the top 10 cm by 20 to 56%, in three instancesoverestimating toxicity (B2: +20%; F3: +56%; F4:+23%), and in four instances underestimating (C1:−28%; C2: −54%; B1: −54%; B3: −28%). Only in coresF1 and F2 in the immediate vicinity of the Tin Mill Canaldischarge, where toxicity was nearly 100% over entiredepths of sediment columns, were surface results consis-tent with subsurface results. This suggests management ormitigation decisions should not be based on results ofsurface sediment toxicity tests alone, and that an appreci-ation of toxicity and contaminant loads in sediments at
A B C
D E F
Fig. 4 Spatial relationship of contaminant concentrations in surfacesediments (top 2 cm): a zinc, b chromium, c nickel, d total sedimentPAH (PAHsed), e total petroleum hydrocarbon (TPHsed), and f
porewater PAH (PAHpw); marker size indicates relative contaminantconcentration (top legend); marker color indicates observed toxicity(bottom legend)
22166 Environ Sci Pollut Res (2017) 24:22158–22172

depth is also important. This also raises concerns thatredevelopment of the region could lead to resuspensionand distribution of contaminated sediments at depth as aconsequence of increased marine construction and boatingactivity.
In the present study, multiple contaminants were shownto correlate positively with toxicity, and most contaminantclasses also correlated significantly with one another(Table 2). As previous studies show, finding a causativeagent for toxicity in the Bear Creek system has provendifficult (Ashley and Baker 1999; Baker et al. 1997;Hansen et al. 1996; Klosterhaus et al. 2006; McGeeet al. 1999, 2004). In actuality, numerous compoundslikely contribute to observed effects on test organisms, acommon phenomenon at sites with complex contaminantmixtures (Hagopian-Schlekat et al. 2001). Given the highdegree of collinearity of measured contaminants, the pres-ent study did not attempt to elucidate the proportionalcontribution of particular chemicals to observed toxicity.Instead, contaminant analysis of surface sediments wasdirected toward determining the usefulness of PAHpw, asmeasured by the antibody-based biosensor, to serve as aproxy for other contaminants within the Bear Creek sys-tem. PAHpw was selected to measure in core segmentsbecause the biosensor required a small sample volume(≤10 mL) for analysis, and sediment material for chemicalanalysis was limited after removal of material for toxicitytesting. The biosensor, a comparatively new technology,
has been used effectively to produce near real-time, on-site, quantitative analysis of PAHs in the aqueous envi-ronment (Spier et al. 2011). A recent study by Li et al.(2016) compared measurements of PAHs in sedimentporewater by gas chromatography-mass spectroscopy(GC-MS) and the antibody-based biosensor and demon-strated a very strong positive correlation between themethods (r2 = 0.98; supplemental material Fig. S2). Thebiosensor typically yields higher total PAH values thandoes GC-MS analysis. This is because biosensor resultsreflect the cumulative contribution of all 3- to 5-ringPAHs, including analytes not targeted or below detectionin GC analyses. While the majority of PAHs in sedimentsare sorbed to particles, the comparatively small fractiondissolved within porewater represents the portion mostbioavailable to benthic organisms (ter Laak et al. 2006).Therefore, concentrations of PAHs within sedimentporewater may more accurately predict PAH-related tox-icity without the need to correct for the influences of grainsize and organic carbon content on bioavailability (terLaak et al. 2006).
Within Bear Creek surface sediments, PAHpw showedsignificant positive correlations with mortality as well aswith most other contaminants (Table 2), making it a goodchoice as a proxy for screening sediment contamination.At present, there is no sediment criteria for PAHpw, so it isdifficult to assess its role in observed toxicity. Even ifPAHpw was not a primary contributor to toxicity in Bear
Table 2 Pearson productmoment correlation coefficientsfor mortality and trace metal andpersistent organic pollutantconcentrations
Coefficient (probability) Mortalitya Zn Cr Cu Ni PAHpw PAHsed
Zn r 0.18
(p value) 0.434
Cr r 0.56 0.68
(p value) 0.007 0.000
Cu r 0.12 0.82 0.57
(p value) 0.600 0.000 0.006
Ni r 0.51 0.66 0.91 0.55
(p value) 0.015 0.001 0.000 0.008
PAHpwb r 0.46 0.34 0.57 0.62 0.43
(p value) 0.032 0.108 0.005 0.002 0.044
PAHsedc r 0.42 0.01 0.26 0.38 0.12 0.79
(p value) 0.051 0.955 0.312 0.083 0.581 0.000
TPHsedd r 0.64 0.35 0.82 0.32 0.75 0.55 0.18
(p value) 0.001 0.108 0.000 0.144 0.000 0.008 0.414
A positive Pearson coefficient indicates a positive correlation; the larger the value the stronger the correlation;values in italics are statistically significant (p < 0.05)aMortality data arcsine square root transformedb PAHpw: porewater polycyclic aromatic hydrocarbon (PAH)c PAHsed: total PAH in whole sedimentd TPHsed: total petroleum hydrocarbon in whole sediment
Environ Sci Pollut Res (2017) 24:22158–22172 22167
Creek sediments, patterns within sediment cores show thatwhere PAHpw concentrations exceeded approximately10 μg/L, toxicity was severe (Fig. S3; e.g., <40% surviv-al). At the very least, PAHpw results provide an indicationthat observed mortality at depth within sediment coreswas likely related to increased contamination and not
exclusively to other sediment characteristics below thebiologically active layer. Although mortality generally in-creased with depth, high survival was also observed in thelowest levels of several cores (Fig. 5), further supportingthe validity of core segment toxicity tests as a screeningtool for assessing sediment quality.
It is understood that many other factors can confound sed-iment bioassay results, especially in subsurface sediments(Kinsman-Costello et al. 2015; Postma et al. 2002). Wholesediment characteristics, such as dissolved oxygen and pHthat deviate from acceptable ranges, can have direct deleteri-ous effects on test organisms, or can affect bioavailability and/or toxicity of pollutants targeted for study (Postma et al.2002). In these instances, distinguishing natural from anthro-pogenic effects can be difficult. The most common com-pounds that confound sediment bioassays are dissolved sul-fide and ammonia. Both accumulate in the porewater of anox-ic sediments where lack of oxygen inhibits their transforma-tion to less toxic oxidized forms (Kinsman-Costello et al.2015). Moreover, pH influences dissolved sulfide and ammo-nia in contrasting ways, acidic conditions (pH < 6) favoringformation of more toxic unionized hydrogen sulfide (H2S;Wang and Chapman 1999), whereas alkali conditions(pH > 8) favoring formation ofmore toxic unionized ammonia(NH3; Emerson et al. 1975). These dissolved compounds canalso transport to overlying water during bioassays, producingtoxicity to test organisms even if they do not burrow into thesediment (Postma et al. 2002).
Porewater NH3, which was measured in all core segments,increased with depth in most cores, in several far exceedingthe recommended test threshold of 60 mg/L (supportingmaterial Table S8). In particular, core F1 exhibited extremelyhigh porewater NH3 at depth. While segments from this corealso had the highest PAHpw concentrations, extraordinarilyhigh NH3 levels likely contributed substantially to the 100%lethality observed at all depths. Ammonia in other coresranged from below the level of concern to well above thatlevel. Cores from sites adjacent to the Sparrows Point indus-trial complex fell in this category (e.g., B1, C1, and F2). The
Sparrows Point
Industrial Complex
Shipyard
Grey’sLandfill
Dundalk, MD
0 240 480 720 960 1200
meter
% Survival
0 – 20
21 – 40
41 – 60
61 – 80
81 – 100
Grey’sLandfill
Tin MillCanal
B3B2 B1
F1F2
F3F4
C1
C2
Fig. 5 Percent survival (color-coded) of Leptocheirus plumulosusfollowing 10-day exposures to sediments from the surface (top disk)and at depth intervals (0–10, 10–20, 20–30, 30–40, 40–60, 60–80 cm)within sediment cores, and depth distribution of survival (left) andporewater polycyclic aromatic hydrocarbon (PAHpw; right) withinindividual core segments from B, C, and F transects (PAHpw of surfacesediments are not shown)
0
25
50
75
100
0 30 60 90 120
Ammonia (mg/L)
Transect B
B1B2B3
0
25
50
75
100
0 30 60 90 120
Ammonia (mg/L)
Transect C
C1C2
0
25
50
75
100
0 30 60 90 120
Mor
talit
y (%
)
Ammonia (mg/L)
Transect F
F2F3F4
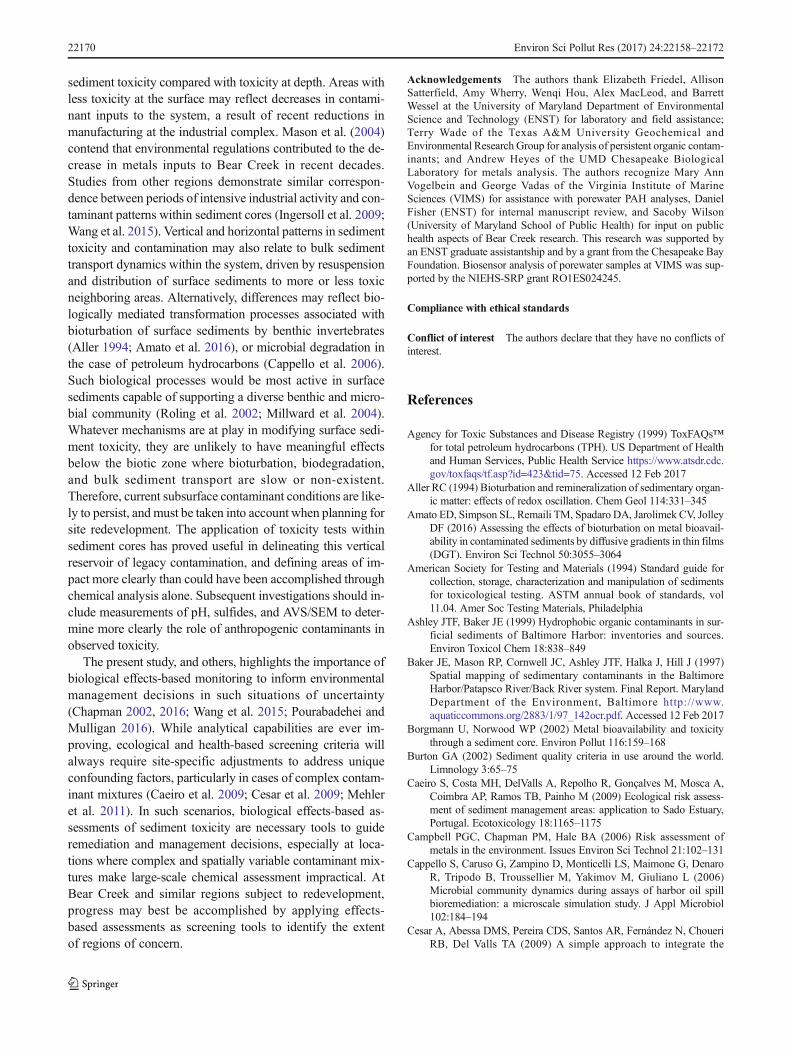
Fig. 6 Relationship between porewater ammonia and Leptocheirus plumulosus mortality in sediment core samples from Bear Creek, Baltimore MD,USA
22168 Environ Sci Pollut Res (2017) 24:22158–22172

consistent feature in these cores was very high mortality at alldepths with no apparent dose-response relationship to NH3
(Fig. 6). Despite porewater NH3 levels ranging from <15 to>100 mg/L in sediments from these cores, all segments pro-duced 90–100% lethality. Cores collected from locations moredistant from the shore of the industrial complex (e.g., B2, B3,C2, F3, and F4) all demonstrated lower and more variablelevels of toxicity. Ammonia in these cores only approachedor marginally exceeded the 60 mg/L threshold at the lowestdepths, and in only one instance (B2) did the highestporewater NH3 concentration coincide with the greatest levelof mortality. Conversely, many segments with NH3 concen-trations below 30 mg/L produced substantial mortality (Fig.6). Collectively, these data suggest that NH3 at shallow depthsplayed, at most, a limited role in observed toxicity, and thatother contaminants, including possibly sulfides, were moresignificant factors.
Neither sulfides nor pH were measured in Bear Creek sed-iments or porewater. However, the decrease in pH over time inoverlying water during bioassay testing of several core seg-ments indicates that sediment pH was very low. Under thiscondition, H2S would be in abundance and would likely havecontributed to observed toxicity. Whereas sulfides in sedi-ments can be directly toxic to benthic organisms, they alsoserve to reduce metal toxicity by binding toxic metals to formless bioavailable metal-sulfide complexes (Wang andChapman 1999). As such, the ratio or relative abundance ofsimultaneously extractable metals to acid volatile sulfide(SEM/AVS or SEM-AVS, respectively) is used as a predictorof metal-related sediment toxicity (Borgmann and Norwood2002; Di Toro et al. 1991, 1992, 2005). Numerous studiesindicate a more complicated relationship between AVS andmetals availability that necessitates correction for organic car-bon content (Di Toro et al. 2005). Others cite particle ingestionas an alternative route of metal exposure (Lee et al. 2000), orcreation of oxic microenvironments by benthic macroinverte-brates as confounding factors when predicting toxicity basedon assumptions of anoxic geochemistry (Campbell et al.2006). In the present study, surface and core sediments werenot analyzed for SEM/AVS. However, information from sev-eral previous assessments of Bear Creek sediments (near sitesA1, A2, B3, D1, and the in-system reference) indicate AVS isconsistently high (≥130 μmol/g) and that SEM/AVS ratioswithin the system are on the order of 0.10–0.28 (Table S2;Baker et al. 1997; Mason et al. 2004; McGee et al. 2004).Although not all of the sample locations in the present studywere analyzed, conditions related to SEM/AVS were found tobe reasonably consistent within depositional regions of BearCreek, suggesting AVS predominates in sediments throughoutthe system. Sulfides also tend to increase with increasingdepth below the oxic surface layer suggesting AVS wouldpredominate in subsurface sediments as well (Wang andChapman 1999).
Further chemical data, particularly on sulfide concentra-tions, are necessary to rule out the possibility of confoundingfactors causing observed toxicity in sediments at depth withincores. However, survival in deeper segments of some BearCreek cores, and the spatial patterns observed that link toxicityat the surface and at depth to on-land features, suggest anthro-pogenic causes contribute to observed toxicity in Bear Creeksediments. Although uncommon, other studies have investi-gated toxicity at depth within sediments. Borgmann andNorwood (2002) sectioned sediment cores from RichardLake near Sudbury, Ontario, and analyzed them for metalcontent, metal bioavailability, and toxicity to Hyalella azteca.They found that metal bioavailability varied with depth, andnoted that toxicity was influenced by the inherent toxic con-tent of the sediments, as well as by geochemical processes thatchanged contaminant availability (Borgmann and Norwood2002). This study followed earlier work, including Rosiuet al. (1989) who measured toxicity in core segments fromthe Detroit River, Stemmer et al. (1990) who observed highermortality to cladocerans exposed to deeper sediments, andSwartz et al. (1991) who observed greater toxicity of subsur-face sediments to amphipods. Most studies of sediments atdepth demonstrated toxicity correlating with contaminant con-centrations, although Harkey et al. (1995) observed less PAHbioaccumulation in Lumbriculus variegatus in sediments withsimilar total PAH concentrations, indicating reduced PAH bio-availability in surficial sediments.
Despite more than two decades of study, establishing caus-al relationships between contaminant classes and toxic out-comes in Bear Creek sediments has proved elusive (Hansenet al. 1996; Klosterhaus et al. 2006; McGee et al. 1999, 2004).Metals, although exceeding ERMs in sediments from mostsites, are presumed to be unavailable and therefore not con-tributing to observed toxicity because of the substantial abun-dance of AVS (United States Environmental ProtectionAgency 2005a). Likewise, PAHs and PCBs are below toxiclevels based on bioavailability models (United StatesEnvironmental Protection Agency 2005b) in most surfacesediments, despite substantial mortality in benthic test organ-isms (McGee et al. 2004). TPH exceeded screening guidelinesin 17 of 22 samples and showed a strong correlation withamphipod mortality (Tables 1 and 2), so may have contributedto sediment toxicity. The suite of PAH compounds form atoxic subset of the larger TPH category, but other unidentifiedorganic contaminants contained within the TPH categorymay be contributing to the observed toxicity (Agency forToxic Substances and Disease Registry 1999). Although notmeasured in core samples, TPH had a strong correlation withPAHpw in surface sediments, and this correlation maycontinue within sediments at depth.
Regardless of what contaminant or contaminants drive tox-icity in Bear Creek, the most compelling pattern observed inthe present study was the contradictory nature of surface
Environ Sci Pollut Res (2017) 24:22158–22172 22169
sediment toxicity compared with toxicity at depth. Areas withless toxicity at the surface may reflect decreases in contami-nant inputs to the system, a result of recent reductions inmanufacturing at the industrial complex. Mason et al. (2004)contend that environmental regulations contributed to the de-crease in metals inputs to Bear Creek in recent decades.Studies from other regions demonstrate similar correspon-dence between periods of intensive industrial activity and con-taminant patterns within sediment cores (Ingersoll et al. 2009;Wang et al. 2015). Vertical and horizontal patterns in sedimenttoxicity and contamination may also relate to bulk sedimenttransport dynamics within the system, driven by resuspensionand distribution of surface sediments to more or less toxicneighboring areas. Alternatively, differences may reflect bio-logically mediated transformation processes associated withbioturbation of surface sediments by benthic invertebrates(Aller 1994; Amato et al. 2016), or microbial degradation inthe case of petroleum hydrocarbons (Cappello et al. 2006).Such biological processes would be most active in surfacesediments capable of supporting a diverse benthic and micro-bial community (Roling et al. 2002; Millward et al. 2004).Whatever mechanisms are at play in modifying surface sedi-ment toxicity, they are unlikely to have meaningful effectsbelow the biotic zone where bioturbation, biodegradation,and bulk sediment transport are slow or non-existent.Therefore, current subsurface contaminant conditions are like-ly to persist, and must be taken into account when planning forsite redevelopment. The application of toxicity tests withinsediment cores has proved useful in delineating this verticalreservoir of legacy contamination, and defining areas of im-pact more clearly than could have been accomplished throughchemical analysis alone. Subsequent investigations should in-clude measurements of pH, sulfides, and AVS/SEM to deter-mine more clearly the role of anthropogenic contaminants inobserved toxicity.
The present study, and others, highlights the importance ofbiological effects-based monitoring to inform environmentalmanagement decisions in such situations of uncertainty(Chapman 2002, 2016; Wang et al. 2015; Pourabadehei andMulligan 2016). While analytical capabilities are ever im-proving, ecological and health-based screening criteria willalways require site-specific adjustments to address uniqueconfounding factors, particularly in cases of complex contam-inant mixtures (Caeiro et al. 2009; Cesar et al. 2009; Mehleret al. 2011). In such scenarios, biological effects-based as-sessments of sediment toxicity are necessary tools to guideremediation and management decisions, especially at loca-tions where complex and spatially variable contaminant mix-tures make large-scale chemical assessment impractical. AtBear Creek and similar regions subject to redevelopment,progress may best be accomplished by applying effects-based assessments as screening tools to identify the extentof regions of concern.
Acknowledgements The authors thank Elizabeth Friedel, AllisonSatterfield, Amy Wherry, Wenqi Hou, Alex MacLeod, and BarrettWessel at the University of Maryland Department of EnvironmentalScience and Technology (ENST) for laboratory and field assistance;Terry Wade of the Texas A&M University Geochemical andEnvironmental Research Group for analysis of persistent organic contam-inants; and Andrew Heyes of the UMD Chesapeake BiologicalLaboratory for metals analysis. The authors recognize Mary AnnVogelbein and George Vadas of the Virginia Institute of MarineSciences (VIMS) for assistance with porewater PAH analyses, DanielFisher (ENST) for internal manuscript review, and Sacoby Wilson(University of Maryland School of Public Health) for input on publichealth aspects of Bear Creek research. This research was supported byan ENST graduate assistantship and by a grant from the Chesapeake BayFoundation. Biosensor analysis of porewater samples at VIMS was sup-ported by the NIEHS-SRP grant RO1ES024245.
Compliance with ethical standards
Conflict of interest The authors declare that they have no conflicts ofinterest.
References
Agency for Toxic Substances and Disease Registry (1999) ToxFAQs™for total petroleum hydrocarbons (TPH). US Department of Healthand Human Services, Public Health Service https://www.atsdr.cdc.gov/toxfaqs/tf.asp?id=423&tid=75. Accessed 12 Feb 2017
Aller RC (1994) Bioturbation and remineralization of sedimentary organ-ic matter: effects of redox oscillation. Chem Geol 114:331–345
Amato ED, Simpson SL, Remaili TM, Spadaro DA, Jarolimek CV, JolleyDF (2016) Assessing the effects of bioturbation on metal bioavail-ability in contaminated sediments by diffusive gradients in thin films(DGT). Environ Sci Technol 50:3055–3064
American Society for Testing and Materials (1994) Standard guide forcollection, storage, characterization and manipulation of sedimentsfor toxicological testing. ASTM annual book of standards, vol11.04. Amer Soc Testing Materials, Philadelphia
Ashley JTF, Baker JE (1999) Hydrophobic organic contaminants in sur-ficial sediments of Baltimore Harbor: inventories and sources.Environ Toxicol Chem 18:838–849
Baker JE, Mason RP, Cornwell JC, Ashley JTF, Halka J, Hill J (1997)Spatial mapping of sedimentary contaminants in the BaltimoreHarbor/Patapsco River/Back River system. Final Report. MarylandDepartment of the Environment, Baltimore http://www.aquaticcommons.org/2883/1/97_142ocr.pdf. Accessed 12 Feb 2017
Borgmann U, Norwood WP (2002) Metal bioavailability and toxicitythrough a sediment core. Environ Pollut 116:159–168
Burton GA (2002) Sediment quality criteria in use around the world.Limnology 3:65–75
Caeiro S, Costa MH, DelValls A, Repolho R, Gonçalves M, Mosca A,Coimbra AP, Ramos TB, Painho M (2009) Ecological risk assess-ment of sediment management areas: application to Sado Estuary,Portugal. Ecotoxicology 18:1165–1175
Campbell PGC, Chapman PM, Hale BA (2006) Risk assessment ofmetals in the environment. Issues Environ Sci Technol 21:102–131
Cappello S, Caruso G, Zampino D, Monticelli LS, Maimone G, DenaroR, Tripodo B, Troussellier M, Yakimov M, Giuliano L (2006)Microbial community dynamics during assays of harbor oil spillbioremediation: a microscale simulation study. J Appl Microbiol102:184–194
Cesar A, Abessa DMS, Pereira CDS, Santos AR, Fernández N, ChoueriRB, Del Valls TA (2009) A simple approach to integrate the
22170 Environ Sci Pollut Res (2017) 24:22158–22172
ecotoxicological and chemical data for the establishment of environ-mental risk levels. Braz Arch Biol Technol 52:233–240
Chapman PM (1990) The sediment quality triad approach to determiningpollution-induced degradation. Sci Total Environ 97/98:815–825
Chapman PM (2002) Integrating toxicology and benthic ecology: puttingthe eco back into ecotoxicology. Mar Pollut Bull 44:7–15
Chapman PM (2016) Environmental quality benchmarks—the good, thebad, and the ugly. Environ Sci Pollut Res. doi:10.1007/s11356-016-7924-2
Chen C, Chen C, Ju Y, Dong C (2016) Vertical profile, source apportion-ment, and toxicity of PAHs in sediment cores of a wharf near thecoal-based steel refining industrial zone in Kaohsiung, Taiwan.Environ Sci Pollut Res 23:4786–4796
Chiou CT, McGroddy SE, Kile DE (1998) Partition characteristics ofpolycyclic aromatic hydrocarbons on soils and sediments. EnvironSci Technol 32:264–269
Di Toro DM, Mahony JD, Hansen DJ, Scott KJ, Carlson AR, Ankley GT(1992) Acid volatile sulfide predicts the acute toxicity of cadmiumand nickel in sediments. Environ Sci Technol 26:96–101
Di Toro DM,McGrath JA, Hansen DJ, BerryWJ, Paquin PR,Mathew R,WuKB, Santore RC (2005) Predicting sediment metal toxicity usinga sediment biotic ligand model: methodology and initial application.Environ Toxicol Chem 24:2410–2427
Di Toro DM, Zarba CS, Hansen DJ, Berry WJ, Swartz RC, Cowan CE,Pavlou SP, Allen HE, Thomas NA, Paquin PR (1991) Technicalbasis for establishing sediment quality criteria for nonionic organicchemicals by using equilibrium partitioning. Environ Toxicol Chem10:1541–1583
Emerson K, Russo RC, Lund RE, Thurston RV (1975) Aqueous ammo-nia equilibrium calculations: effect of pH and temperature. J FishRes Board Can 32:2379–2383
Fleeger JW, Gust KA, Marlborough SJ, Tita G (2007) Mixtures of metalsand polynuclear aromatic hydrocarbons elicit complex, nonadditivetoxicological interactions inmeiobenthic copepods. Environ ToxicolChem 26:1677–1685
Forstner U (1989) Contaminated sediments: lectures on environmentalaspects of particle-associated chemicals in aquatic systems. In:Bhattacharji S, Fridman GM, Neugebauer HJ, Seilacher A (eds)Lecture notes in earth sciences, vol 21. Springer-Verlag, Berlin, pp1–157
Garcia CA, Passos EA, Alves JP (2011) Assessment of trace metalspollution in estuarine sediments using SEM-AVS and ERM-ERLpredictions. Environ Monit Assess 181:385–397
Graham AM, Wadhawan AR, Bouwer EJ (2009) Chromium occurrenceand speciation in Baltimore Harbor sediments and porewater,Baltimore, Maryland, USA. Environ Toxicol Chem 28:471–480
Hagopian-Schlekat T, Chandler GT, Shaw TJ (2001) Acute toxicity offive sediment-associated metals, individually and in a mixture, to theestuarine meiobenthic harpacticoid copepod Amphiascustenuiremis. Mar Environ Res 51:247–264
Hansen DJ, BerryWJ,Mahony JD, BoothmanWS, Di Toro DM, RobsonDL, Ankley GT, Ma D, Yan Q, Pesch CE (1996) Predicting thetoxicity of metal-contaminated field sediment using interstitial con-centrations of metals and acid-volatile sulfide normalizations.Environ Toxicol Chem 15:2067–2079
Harkey GA, Van Hoof PL, Landrum PF (1995) Bioavailability of poly-cyclic aromatic hydrocarbons from a historically contaminated sed-iment core. Environ Toxicol Chem 14:1551–1560
Hartwell IS, Hameedi J (2007) Magnitude and extent of contaminatedsediment and toxicity in Chesapeake Bay. NOAA technical memo-randum NOS NCCOS, 47. NOAA/NOS/National Centers forCoastal Ocean Science/Center for Coastal Monitoring andAssessment, Silver Spring
Ingersoll CG, Kemble NE, Kunz JL, Brumbaugh WG, MacDonald DD,Smorong D (2009) Toxicity of sediment cores collected from the
Ashtabula River in northeastern Ohio, USA, to the amphipodHyalella azteca. Arch Environ Contam Toxicol 57:315–329
Inouye L (2014) DMMP issue paper: implementation of revised freshwa-ter sediment screening values. Public review draft. WashingtonDepartment of Ecology, for the DMMP and RSET agencies, Laceyhttp://www.nws.usace.army.mil/Portals/27/docs/civilworks/dredging/Updates/2003-BCOC_with_alphaBHC_comments.pdf.Accessed 11 May 2017
Kinsman-Costello LE, O'Brien JM, Hamilton SK (2015)Natural stressorsin uncontaminated sediments of shallow freshwaters: the prevalenceof sulfide, ammonia, and reduced iron. Environ Toxicol Chem 34:467–479
Kirman DZ, Sericano JL, Wade TL, Bianchi TS, Marcantonio F, KolkerAS (2016) Composition and depth distribution of hydrocarbons inBarataria Bay marsh sediments after the Deepwater Horizon oilspill. Environ Pollut 214:101–113
Klosterhaus S, Baker J, Ziegler G, Fisher D (2006) Toxicity identificationand evaluation and long-term contaminant trends in the BaltimoreHarbor. Final Report. Technical and regulatory services administra-tion. Maryland Department of the Environment, Baltimore
Kwok KW, Batley GE, Wenning RJ, Zhu L, VangheluweM, Lee S (2014)Sediment quality guidelines: challenges and opportunities for improv-ing sediment management. Environ Sci Pollut Res Int 21:17–27
Lee B, GriscomSB, Lee J, Choi HJ, Koh C, Luoma SN, Fisher NS (2000)Influences of dietary uptake and reactive sulfides on metal bioavail-ability from aquatic sediments. Science 287:282–284
Li X, Kaattari SL, VogelbeinMA, Vadas GG, UngerMA (2016) A highlysensitive monoclonal antibody based biosensor for quantifying 3–5ring polycyclic aromatic hydrocarbons (PAHs) in aqueous environ-mental samples. Sens Biosensing Res 7:115–120
Long ER, Morgan LG (1991) The potential for biological effects ofsediment-sorbed contaminants tested in the National Status andTrends Program. NOAA technical memorandum NOS OMA 52.Second printing. Seattle, WA, USA. https://docs.lib.noaa.gov/noaa_documents/NOS/OMA/TM_NOS_OMA/nos_oma_52.pdf.Accessed 11 May 2017
Mason RP, Kim E, Cornwell J (2004) Metal accumulation in BaltimoreHarbor: current and past inputs. Appl Geochem 19:1801–1825
McGee BL, Fisher DJ, Wright DA, Yonkos LT, Ziegler GP, Turley SD,Farrar JD, Moore DW, Bridges TS (2004) A field test and compar-ison of acute and chronic sediment toxicity tests with the estuarineamphipod Leptocheirus plumulosus in Chesapeake Bay, USA.Environ Toxicol Chem 23:1751–1761
McGee BL, Fisher DJ, Yonkos LT, Ziegler GP, Turley S (1999)Assessment of sediment contamination, acute toxicity, and popula-tion viability of the estuarine amphipod Leptocheirus plumulosus inBaltimore Harbor, Maryland, USA. Environ Toxicol Chem 18:2151–2160
Mehler WT, Li H, Lydy MJ, You J (2011) Identifying the causes ofsediment associated toxicity in urban waterways of the Pearl RiverDelta, China. Environ Sci Technol 45:1812–1819
Millward RN, Carman KR, Fleeger JW, Gambrell RP (2004) Mixtures ofmetals and hydrocarbons elicit complex responses by a benthic in-vertebrate community. J Exp Mar Biol Ecol 310:115–130
Palma P, Ledo L, Soares S, Barbosa IR, Alvarenga P (2014) Integratedenvironmental assessment of freshwater sediments: a chemical andecotoxicological approach at the Alqueva reservoir. EnvironGeochem Health 36:209–223
Postma JF, De Valk S, DubbeldamM,Maas JL, Tonkes M, Schipper CA,Kater BJ (2002) Confounding factors in bioassays with freshwaterand marine organisms. Ecotoxicol Environ Saf 53:226–237
Pourabadehei M, Mulligan CN (2016) Selection of an appropriate man-agement strategy for contaminated sediment: a case study at a shal-low contaminated harbor in Quebec, Canada. Environ Pollut 219:846–857
Environ Sci Pollut Res (2017) 24:22158–22172 22171

Ridgway J, Shimmield G (2002) Estuaries as repositories of historicalcontamination and their impact on shelf seas. Estuar Coast ShelfSci 55:903–928
Roling WFM, Milner MG, Jones DM, Lee K, Daniel F, Swannell RJP,Head IM (2002) Robust hydrocarbon degradation and dynamics ofbacterial communities during nutrient-enhanced oil spill bioremedi-ation. Appl Environ Microbiol 68:5537–5548
Rosiu CJ, Giesy JP, Kreis RG Jr (1989) Toxicity of vertical sediments inthe Trenton Channel, Detroit River, Michigan, to Chironomustentans (Insecta: Chironomidae). J Great Lakes Res 15:570–580
Spier CR, Vadas GG, Kaattari SL, Unger MA (2011) Near real-time, on-site, quantitative analysis of PAHs in the aqueous environment usingan antibody-based biosensor. Environ Toxicol Chem 30:1557–1563
Stemmer BL, Burton GA, Sasson-Brickson G (1990) Effect of sedimentspatial variance and collection method on cladoceran toxicity andindigenous microbial activity determinations. Environ ToxicolChem 9:1035–1044
Swartz RC, Schults DW, Lamberson JO, Ozretich RJ, Stull JK (1991)Vertical profiles of toxicity, organic carbon, and chemical contami-nants in sediment cores from the Palos Verdes Shelf and SantaMonica Bay, California. Mar Environ Res 31:215–225
ter Laak TL, Barendregt A, Hermens JLM (2006) Freely dissolved porewater concentrations and sorption coefficients of PAHs in spiked,aged, and field-contaminated coils. Environ Sci Technol 40:2184–2190
United States Environmental Protection Agency (1983) Methods ofChemical Analysis of Water and Waste (MCAWW). EPA/600/4-79/020. Office of Research and Development, Washington
United States Environmental Protection Agency (1994) Methods forassessing the toxicity of sediment-associated contaminants with
estuarine and marine amphipods. EPA/600/R-94/025. Report. USEnvironmental Protection Agency, Office of Water, Washington
United States Environmental Protection Agency (1995) Method 3052:microwave assisted acid digestion of siliceous and organically basedmatrices. Test methods for evaluating solid waste. USEnvironmental Protection Agency, Washington
United States Environmental Protection Agency (2005a) Procedures forthe derivation of equilibrium partitioning sediment benchmarks(ESBs) for the protection of benthic organisms: metal mixtures (cad-mium, copper, lead, nickle, silver, zinc). EPA/600/R-02/011. USEnvironmental Protection Agency, Office of Research andDevelopment, Washington
United States Environmental Protection Agency (2005b) Predicting tox-icity to amphipods from sediment chemistry. EPA/600/R-04/030.US Environmental Protection Agency, Office of Research andDevelopment, Washington
United States Environmental Protection Agency (2014) Method 6020B:inductively coupled plasma-mass spectrometry. Test methods forevaluating solid waste. US Environmental Protection Agency,Washington
Wang F, Chapman PM (1999) Biological implications of sulfide in sed-iment—a review focusing on sediment toxicity. Environ ToxicolChem 18:2526–2532
Wang P, Zhang L, Liu L, Chen L, Gao H, Wu L (2015) Toxicity ofsediment cores from Yangtze River estuary to zebrafish (Daniorerio) embryos. Environ Sci Pollut Res 22:16423–16433
Xu J, Guo J, Liu G, Shi G, Guo C, Zhang Y, Feng Y (2014) Historicaltrends of concentrations, source contributions and toxicities forPAHs in dated sediment cores from five lakes in western China.Sci Total Environ 470(471):519–526
22172 Environ Sci Pollut Res (2017) 24:22158–22172