visionary - google analytics
TRANSCRIPT


Why you needGoogle AnalyticsMake sure your website is meeting your goals

Why you need Google Analytics
1. How many people visit my website?
2. How are people finding my website?
3. Do I need a mobile-friendly site?
4. What websites send visitors to my site?
5. Where do my visitors live?
6. Which pages on my website are the most popular?
7. What marketing tactics drive the most traffic to my site?
8. How many visitors have I converted into leads or customers?
Have you ever wondered if your website is actually benefitting your company?What questions do you want answered?

Google AnalyticsQuick GlossaryCommon terms you’l l see often

Quick Glossary - Measurements
•DimensionsCharacteristics of your users, their sessions, and actions.Browser, Exit Page, Screen Resolution
•MetricsQuantitative measurements of users, sessions, and actions. Numerical data.Users, Pageviews, Sessions

Common metrics
• SessionsNumber of visits to your site within a defined date range
• UsersNumber of visitors with one or more sessions to your site
• PageviewsTotal number of pages viewed (repeated views of a single page are counted)
• Pages/SessionAverage number of pages viewed during a session
• Bounce RatePercentage of single-page visits (person left without interacting)

NavigatingGoogle AnalyticsThe Google analytics report page

Google Analytics Navigation
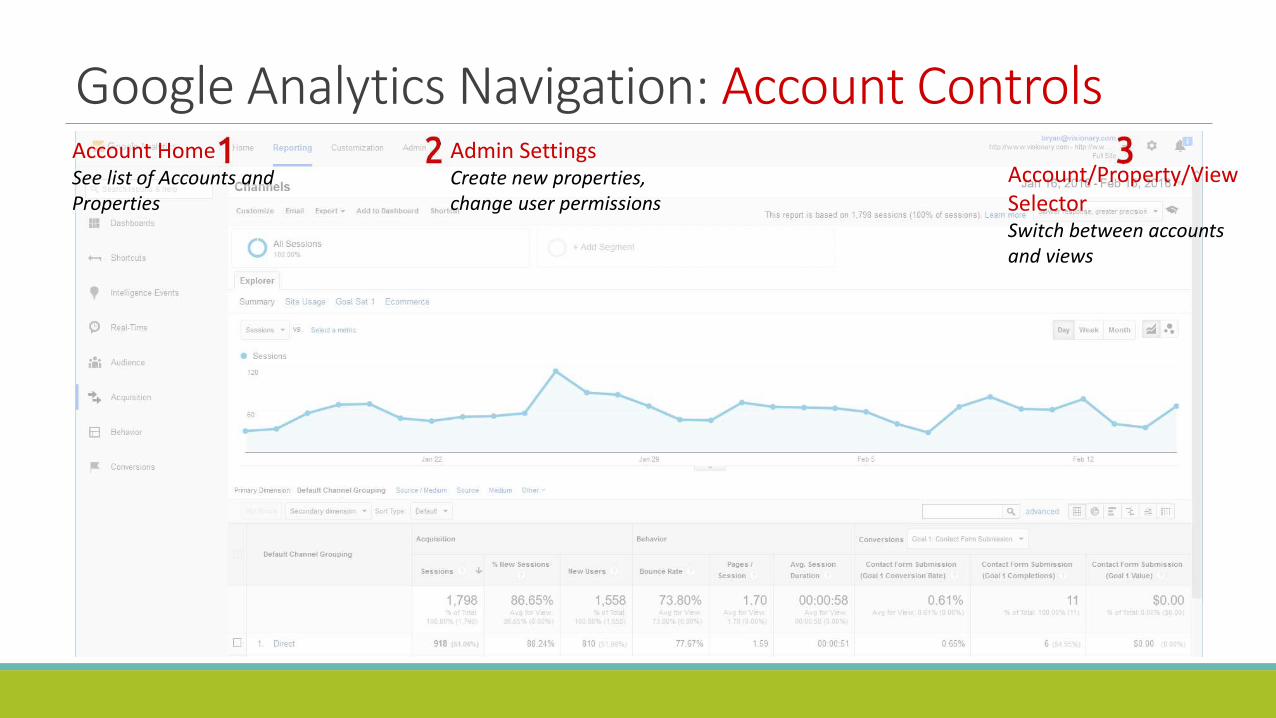
Google Analytics Navigation: Account ControlsAccount HomeSee list of Accounts and Properties
Admin SettingsCreate new properties, change user permissions
Account/Property/View SelectorSwitch between accounts and views

Google Analytics Navigation: Report Navigation
All ReportsList of all available reports, links to Dashboards, Shortcuts, and Intelligence reports

Google Analytics Navigation: Data Inclusion
Add SegmentsChoose which segments are included in report
Metric Group SelectorSee data organized into a group (metric)
Date SelectorChange the date range in the report
Primary Dimension SelectorChoose the main dimension show in the report
Secondary Dimension SelectorAdd a second dimension to the report
Table FilterSearch and show only certain results

Google Analytics Navigation: Graph & Visualization
Time Graph SelectorChange the time-scale within the graph (hour, day, week, month)
Metric SelectorAdd another metric to the graph
Graph SelectorChoose the type of graph to display (line, pic chart, motion charts)

Google Analytics Navigation: Report Customization
Saving and Sharing ReportsCreate shortcuts, add reports to your dashboard, email reports, and export data in available formats
Report CustomizationsCreate and manage custom reports
AnnotationsMake notes directly on the report

Google Analytics Navigation: Help Resources
In-Product HelpResources specific to the Google Analytics reports/tools you are currently using
User Settings
How to viewGoogle Analytics dataQuick summary of the standard reporting sections

Audience reportsEverything you want to know about your visitors.
• Demographics: age, gender
• Interests: general interests
• Geo: where the come from (location) and what language they speak
• Behavior: how often they visit your website
• Technology and Mobile: browser, device (desktop, tablet, phone)

Audience: Geo > LocationFind out where your visitors are coming from.
• Drill down from country- to city-level geographic locations
• Use data table to view location-specific details (bounce rate, pages/session, etc)

Acquisition reportsWhat drove visitors to your website.
• All Traffic: general breakdown of sources
• AdWords: connect your paid advertisements for better tracking
• Search Engine Optimization: learn more about search traffic
• Social: traffic from social networks
• Campaigns: track custom sources or advertising campaigns

Behavior reportsEverything you want to know about your content.
• Behavior Flow: follow users as they navigate your website
• Site Content: top pages on your website
• Site Speed: how fast individual pages load and suggestions to make your site faster
• Site Search: see what terms are searched for (if applicable)
• Events: track custom actions taken on your website (e.g. view a map, click a button)

ConversionsSee how many conversions your website has received and how visitors complete your goals.
• Must predefine specific goals
• Can apply monetary value to individual goals

Real-TimeIn-the-moment statistics and tracking.
• Check the status of your website right now
• Not useful for finding trends, but may help detect issues quickly
• Measure success of time-sensitive marketing events

Intelligence EventsAutomatic alerts triggered by Google Analytics based off your website’s past statistics and performance.
Alerts can be triggered daily, weekly, or monthly.
• Large changes in users or sessions
• Bounce rate increase or decrease
• Significant conversion rate changes

Shortcuts & emails• Bookmark the tools you use often
• Use the email button to have reports emailed on a regular basis

Account organization:Properties & ViewsHow Google Analytics Organizes Data

Account > Property > View

What is a Property?Data repository for a project
Does not include any reports, can contain multiple websites or applications

What is a View?Subset of a Property – way to actually view data collected within a property
Every property has one or more views (default view contains all data in the property)
Often has filters applied to allow only certain types of data to be shown• Specific website/domain (www.visionary.com, not static.visionary.com)
• Mobile vs. Non-mobile
• Other segments of traffic (tons of possibilities - visits from a specific country, Bing search results, “About Us” section of the website)

Defining and creating Conversion GoalsTrack Common Events that have value to your site

What are Goals?A Conversion Goal is a defined event (or series of events) that a user performs that has value to the website• Purchased completed
• Submitted registration, contact form
• Printed a coupon
• Viewed a specific page
• More!
Monetary values can be applied to successful goals (optional)• You may know that a new user equates to an average worth of $50
• Average sales contact form submission results in $1000 sale

Creating GoalsGoals are created through the Admin tools and applied to Views
Goals can be one of four types• Destination (thanks.html)
• Duration (5 minutes or more)
• Pages/Screens per visit (3 pages)
• Event (played a video)
Destination goals can include funnels• Must view additional pages before viewing the final destination
• Great example is a shopping cart – view cart, billing, shipping, and finally, receipt
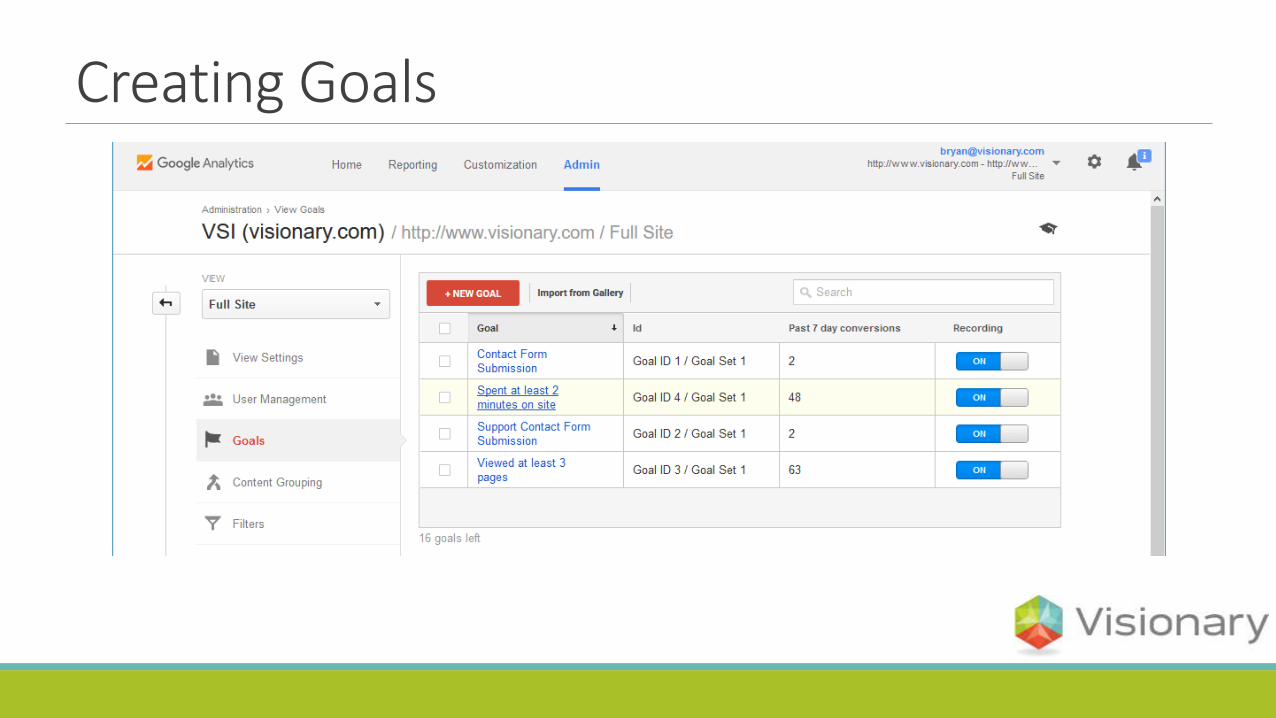
Creating Goals

Creating Goals

Creating custom reportsto meet your needsLet ’s Build A Report For Visionary.com

What do we want in our Custom Report?
Requirements for traffic to be included• Visits originating from a search engine (organic/unpaid)
• Search keyword must contain the phrase “Des Moines”
What statistics (metrics) do we want to see in the report?• Sessions, pageviews
• Average visit duration
• Bounce rate
• Keywords

Let’s make the Custom Report
General Information• Title: Organic Search “Des Moines” Traffic
Report Content• Report Tab Name: Basic Stats
• Type: Explorer
• Metrics Groups: Pageviews, Visits, Bounce Rate, Avg. Visit Duration
• Dimension Drilldowns: Keyword
Filters• Include Medium, Exact organic
• Include Keyword, Regex (des moines)

Custom report view

Additional resources forGoogle AnalyticsLearn More On Your Own

Additional Google Analytics resourcesGoogle Analytics Academy (https://analyticsacademy.withgoogle.com/explorer)• Free courses with short quizzes and exercises, learning community
Google Analytics IQ (https://goo.gl/9GMtCy)• IQ (Individual Qualification) is an industry recognized certification (now free)
Google Analytics Training & Certification (http://www.google.com/analytics/learn/)• Includes links to sample custom reports and other solutions
Google Analytics Help Center (https://support.google.com/analytics/?hl=en#topic=3544906)• Lots of short articles on everything from setup to data imports to reporting
