vimpelcom ltd. - veon · consolidated financial position of vimpelcom ltd. at december ......
TRANSCRIPT

Consolidated financial statements VimpelCom Ltd. As of 31 December 2012 and 2011 and for the three years ended 31 December 2012

2
Table of contents
CONSOLIDATED INCOME STATEMENT ...........................................................................4
CONSOLIDATED STATEMENT OF COMPREHENSIVE INCOME .....................................5
CONSOLIDATED STATEMENT OF FINANCIAL POSITION ...............................................6
CONSOLIDATED STATEMENT OF CHANGES IN EQUITY ...............................................7
CONSOLIDATED STATEMENT OF CASH FLOWS .......................................................... 10
NOTES TO CONSOLIDATED FINANCIAL STATEMENTS ............................................... 11
1 GENERAL INFORMATION ....................................................................................... 11
2 BASIS OF PREPARATION OF THE CONSOLIDATED FINANCIAL STATEMENTS 12
3 SIGNIFICANT ACCOUNTING POLICIES ................................................................. 13
4 SIGNIFICANT ACCOUNTING JUDGEMENTS, ESTIMATES AND ASSUMPTIONS 30
5 FINANCIAL RISK MANAGEMENT ........................................................................... 34
6 BUSINESS COMBINATIONS AND OTHER SIGNIFICANT TRANSACTIONS ......... 41
7 SEGMENT INFORMATION ...................................................................................... 43
8 OTHER REVENUE ................................................................................................... 45
9 EMPLOYEE BENEFITS............................................................................................ 46
10 IMPAIRMENT ........................................................................................................... 47
11 OTHER NON-OPERATING LOSSES/(GAINS) ......................................................... 52
12 INVESTMENTS IN ASSOCIATES AND JOINT VENTURES .................................... 53
13 INCOME TAXES ...................................................................................................... 55
14 EARNINGS PER SHARE ......................................................................................... 60
15 PROPERTY AND EQUIPMENT ............................................................................... 61
16 INTANGIBLE ASSETS ............................................................................................. 63
17 FINANCIAL ASSETS AND LIABILITIES ................................................................... 64
18 OTHER NON FINANCIAL ASSETS AND LIABILITIES ............................................. 76
19 INVENTORIES ......................................................................................................... 77
20 TRADE AND OTHER RECEIVABLES ...................................................................... 78
21 CASH AND CASH EQUIVALENTS .......................................................................... 79
22 ISSUED CAPITAL AND RESERVES ........................................................................ 80
23 DIVIDENDS PAID AND PROPOSED ....................................................................... 82
24 SHARE-BASED PAYMENTS ................................................................................... 83
25 PROVISIONS ........................................................................................................... 88
26 RELATED PARTIES ................................................................................................. 89
27 COMMITMENTS, CONTINGENCIES AND UNCERTAINTIES ................................. 92
28 EVENTS AFTER THE REPORTING PERIOD ........................................................ 105

3
Report of Independent Registered Public Accounting Firm
To the Supervisory Board and Shareholders of VimpelCom Ltd.
We have audited the accompanying consolidated statement of financial position of VimpelCom Ltd. as of
December 31, 2012 and 2011, and the related consolidated income statements, statements of comprehensive
income, changes in equity, and cash flows for each of the three years in the period ended December 31, 2012.
These financial statements are the responsibility of VimpelCom Ltd.’s management. Our responsibility is to
express an opinion on these financial statements based on our audits.
We conducted our audits in accordance with the standards of the Public Company Accounting Oversight
Board (United States). Those standards require that we plan and perform the audit to obtain reasonable
assurance about whether the financial statements are free of material misstatement. An audit includes examining,
on a test basis, evidence supporting the amounts and disclosures in the financial statements. An audit also
includes assessing the accounting principles used and significant estimates made by management, as well as
evaluating the overall financial statement presentation. We believe that our audits provide a reasonable basis for
our opinion.
In our opinion, the financial statements referred to above present fairly, in all material respects, the
consolidated financial position of VimpelCom Ltd. at December 31, 2012 and 2011, and the consolidated results
of its operations and its cash flows for each of the three years in the period ended December 31, 2012, in
conformity with International Financial Reporting Standards as issued by the International Accounting Standards
Board.
We also have audited, in accordance with the standards of the Public Company Accounting Oversight Board
(United States), VimpelCom Ltd.’s internal control over financial reporting as of December 31, 2012, based on
criteria established in Internal Control-Integrated Framework issued by the Committee of Sponsoring
Organizations of the Treadway Commission and our report dated March 22, 2013 expressed an unqualified
opinion thereon.
/s/ Ernst & Young Accountants LLP
Amsterdam, The Netherlands
March 22, 2013

VimpelCom Ltd.
4
Consolidated income statements for the years ended 31 December 2012, 2011 and 2010
Years ended 31 December
Note 2012 2011 2010
(In millions of US dollars, except per share amounts) Service revenues 22,122 19,579 10,291
Sale of equipment and accessories 677 516 194
Other revenues 8 262 167 37
Total operating revenues 7 23,061 20,262 10,522
Operating expenses
Service costs 5,439 4,962 2,251
Cost of equipment and accessories 693 663 217
Selling, general and administrative expenses 9 7,161 6,381 3,198
Depreciation 15 2,926 2,726 1,403
Amortization 16 2,080 2,059 610
Impairment loss 10 386 527 -
Loss on disposals of non-current assets 205 90 49
Total operating expenses 18,890 17,408 7,728
Operating profit 4,171 2,854 2,794
Finance costs 2,029 1,587 536
Finance income (154) (120) (69)
Revaluation of retained interest in Euroset 6 (606) - -
Other non-operating losses/(gains) 11 75 308 (35)
Shares of loss/(profit) of associates and joint ventures accounted for using the equity method 12 9 35 (90)
Net foreign exchange (gain)/loss (70) 190 5
Profit before tax 2,888 854 2,447
Income tax expense 13 906 585 574
Profit for the year 1,982 269 1,873
Attributable to:
The owners of the parent 2,145 543 1,806
Non-controlling interest (163) (274) 67
1,982 269 1,873
Earnings per share
Basic, profit for the year attributable to ordinary equity holders of the parent 14 $1.33 $0.36 $1.50
Diluted, profit for the year attributable to ordinary equity holders of the parent 14 $1.32 $0.36 $1.50

VimpelCom Ltd.
5
Consolidated statements of comprehensive income for the years ended 31 December 2012, 2011 and 2010
Year ended 31 December
Note 2012 2011 2010
(In millions of US dollars)
Profit for the year 1,982 269 1,873
Other comprehensive income
Share of foreign currency translation of associates and joint ventures accounted for using the equity method (net of tax in 2012 of USD nil, 2011 of USD nil and 2010 of USD nil)
17 (65) (18) Net movement on cash flow hedges (net of tax in 2012 of USD 15, 2011 of USD 22 and 2010 of USD nil) 17 (76) (279) - Foreign currency translation
(63) (703) (73)
Recycling of accumulated foreign currency translation on translation for equity interest in acquiree in business combination achieved in stages (net of tax in 2012 of USD nil and 2011 of USD nil) 6 17 43 -
Other comprehensive loss for the year, net of tax (105) (1,004) (91)
Total comprehensive income / (loss) for the year, net of tax 1,877 (735) 1,782
Attributable to: The owners of the parent 2,142 (336) 1,725
Non-controlling interests (265) (399) 57
1,877 (735) 1,782

VimpelCom Ltd.
The accompanying notes are an integral part of these consolidated financial statements.
6
Consolidated statements of financial position As of 31 December 2012 and 2011
Note
As of 31 December 2012
As of 31 December 2011
(In millions of US dollars)
Assets
Non-current assets Property and equipment 15 15,666 15,165 Intangible assets 16 10,601 11,825 Goodwill 10 16,964 16,776 Investments in associates and joint ventures 12 1,168 388 Deferred tax assets 13 312 386 Other financial assets 17 1,091 1,536 Other non-financial assets 18 18 92
Total non-current assets 45,820 46,168
Current assets Inventories 19 167 227 Trade and other receivables 17, 20 2,495 2,711 Other non-financial assets 18 1,290 1,320 Current income tax asset 13 292 293 Other financial assets 17 270 345 Cash and cash equivalents 21 4,949 2,325
Total current assets 9,463 7,221
Assets classified as held for sale 6 77 650
Total assets 55,360 54,039
Equity and liabilities Equity Equity attributable to equity owners of the parent 22,23,24 14,869 14,037 Non-controlling interests 503 865
Total equity 15,372 14,902
Non-current liabilities Financial liabilities 17 25,693 25,724 Provisions 25 548 402 Other non-financial liabilities 18 410 442 Deferred tax liability 13 1,416 1,624
Total non-current liabilities 28,067 28,192
Current liabilities Trade and other payables 17 4,585 4,566 Dividends payable 23 1,274 - Other non-financial liabilities 18 2,243 2,030 Other financial liabilities 17 3,388 3,118 Current income tax payable 13 202 399 Provisions 25 192 182
Total current liabilities 11,884 10,295
Liabilities associated with assets held for sale 6 37 650
Total equity and liabilities 55,360 54,039

VimpelCom Ltd.
The accompanying notes are an integral part of these consolidated financial statements.
7
Consolidated statements of changes in equity for the years ended 31 December 2012, 2011 and 2010
(In millions of US dollars)
Number of shares outstanding
Issued capital
Capital Surplus
Treasury shares
Other capital reserves
Retained earnings
Foreign currency translation
Total Non-controlling interest
Total equity
As at 1 January 2010 1,014,291,577 1 1,432 (224) (30) 3,370 (384) 4,165 37 4,202
Profit for the period
- - - - 1,806 - 1,806 67 1,873 Other comprehensive income
- - - - - (81) (81) (10) (91)
Total comprehensive income
- - - - 1,806 (81) 1,725 57 1,782
Dividends
- - - - (594) - (594) (73) (667) Issuance of shares for KyivStar acquisition 301,653,080 - 5,595 - - - - 5,595 - 5,595 Effect of exchange offer (24,764,218) - (501) - - - - (501) - (501) Issuance of shares 50,000 - 1 - - - - 1 - 1 Repurchase of noncontrolling interest in OJSC
- 30 - - - - 30 - 30
Acquisition of non-controlling interest
- - - (4) - - (3) (6) (10) Changes in a parent's ownership interest in a subsidiary that do not result in a loss of control
- - - (11) - - (11) (24) (35)
Exercise of options 820,261 - - 8 - - - 8 - 8 Share-based payment transactions
- - - 7 - - 7 - 7
As at 31 December 2010
1,292,050,700 1 6,557 (216) (38) 4,582 (467) 10,421 (9) 10,412

VimpelCom Ltd.
The accompanying notes are an integral part of these consolidated financial statements.
8
Consolidated statements of changes in equity (continued)
(In millions of US dollars)
Note Number of shares outstanding
Issued capital
Capital Surplus
Treasury shares
Other capital reserves
Retained earnings
Foreign currency translation
Total Non-controlling interest
Total equity
As of 1 January 2011 1,292,050,700 1 6,557 (216) (38) 4,582 (467) 10,421 (9) 10,412
Profit for the period - - - - 543 - 543 (274) 269
Total other comprehensive income - - - (276)
(603) (879) (125) (1,004)
Total comprehensive income - - - (276) 543 (603) (336) (399) (735)
Dividends - - - - (1,216) -
(1,216) - (1,216)
Issuance of shares 1 325,639,827 1 4,988 - - - -
4,989 - 4,989
Acquisition of treasury shares (50,000) - - (1) - - - (1) - (1) Non-controlling interest arising on a business combination 6 - - - (13) - - (13) 2,124 2,111
Restructuring of shareholding in consolidated subsidiaries 6 - - - 268 - (5) 263 (37) 226
Changes in a parent's ownership interest in a subsidiary that do not result in a loss of control
- - - (54) - - (54) (49) (103)
Effect of deconsolidation OTH spin-off assets 6 - - - - - - (765) (765) Exercise of options 24 480,000 - - 4 (3) - - 1 - 1
Share-based compensation 24 - - - (17) - - (17) - (17)
As of 31 December 2011 1,618,120,527 2 11,545 (213) (133) 3,909 (1,073) 14,037 865 14,902
VimpelCom Ltd.
The accompanying notes are an integral part of these consolidated financial statements.
9
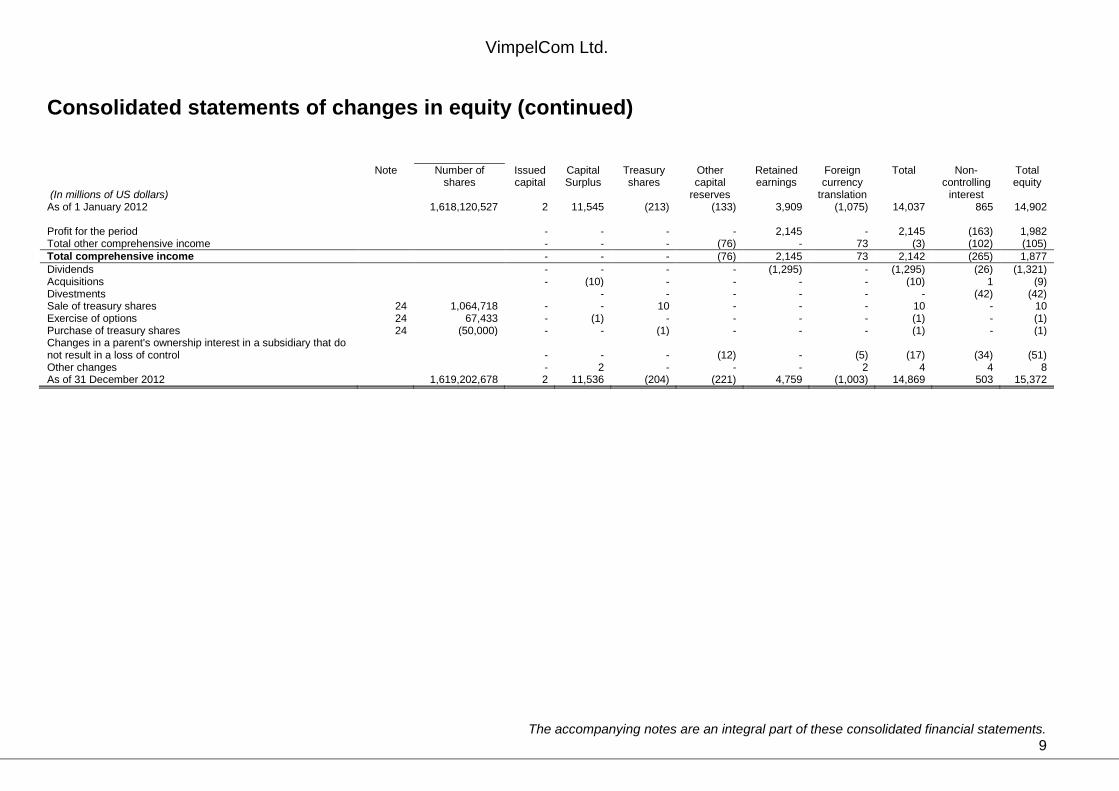
Consolidated statements of changes in equity (continued)
(In millions of US dollars)
Note Number of shares
Issued capital
Capital Surplus
Treasury shares
Other capital
reserves
Retained earnings
Foreign currency
translation
Total Non-controlling
interest
Total equity
As of 1 January 2012 1,618,120,527 2 11,545 (213) (133) 3,909 (1,075) 14,037 865 14,902
Profit for the period
- - - - 2,145 - 2,145 (163) 1,982 Total other comprehensive income
- - - (76) - 73 (3) (102) (105)
Total comprehensive income
- - - (76) 2,145 73 2,142 (265) 1,877
Dividends
- - - - (1,295) - (1,295) (26) (1,321) Acquisitions - (10) - - - - (10) 1 (9) Divestments - - - - - - (42) (42) Sale of treasury shares 24 1,064,718 - - 10 - - - 10 - 10 Exercise of options 24 67,433 - (1) - - - - (1) - (1) Purchase of treasury shares 24 (50,000) - - (1) - - - (1) - (1) Changes in a parent's ownership interest in a subsidiary that do not result in a loss of control
- - - (12) - (5) (17) (34) (51)
Other changes
- 2 - - - 2 4 4 8 As of 31 December 2012 1,619,202,678 2 11,536 (204) (221) 4,759 (1,003) 14,869 503 15,372
VimpelCom Ltd. (Amounts presented are in millions of US dollars unless otherwise indicated)
The accompanying notes are an integral part of these consolidated financial statements. 10
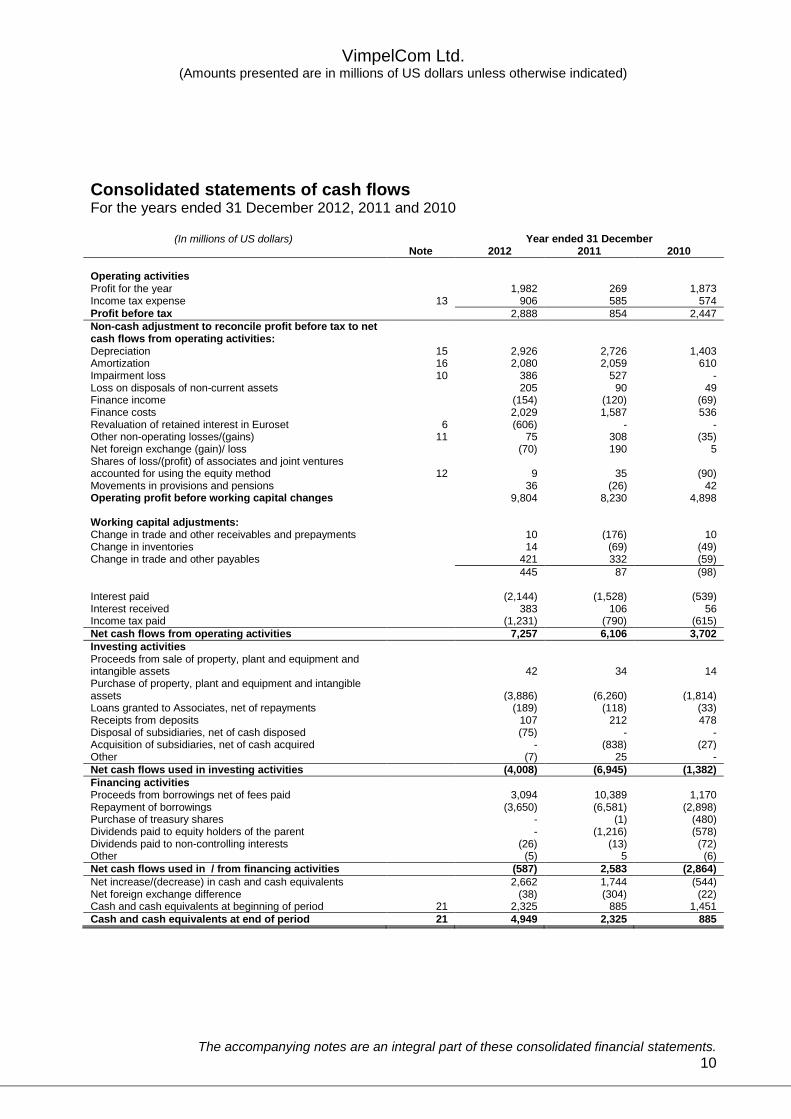
Consolidated statements of cash flows For the years ended 31 December 2012, 2011 and 2010
(In millions of US dollars) Year ended 31 December Note 2012 2011 2010
Operating activities Profit for the year 1,982 269 1,873 Income tax expense 13 906 585 574
Profit before tax
2,888 854 2,447
Non-cash adjustment to reconcile profit before tax to net cash flows from operating activities:
Depreciation 15 2,926 2,726 1,403 Amortization 16 2,080 2,059 610 Impairment loss 10 386 527 - Loss on disposals of non-current assets
205 90 49
Finance income
(154) (120) (69) Finance costs
2,029 1,587 536
Revaluation of retained interest in Euroset 6 (606) - - Other non-operating losses/(gains) 11 75 308 (35) Net foreign exchange (gain)/ loss
(70) 190 5
Shares of loss/(profit) of associates and joint ventures accounted for using the equity method 12 9 35 (90) Movements in provisions and pensions 36 (26) 42 Operating profit before working capital changes 9,804 8,230 4,898
Working capital adjustments: Change in trade and other receivables and prepayments 10 (176) 10 Change in inventories 14 (69) (49) Change in trade and other payables 421 332 (59)
445 87 (98)
Interest paid (2,144) (1,528) (539) Interest received 383 106 56 Income tax paid (1,231) (790) (615)
Net cash flows from operating activities 7,257 6,106 3,702
Investing activities Proceeds from sale of property, plant and equipment and intangible assets 42 34 14 Purchase of property, plant and equipment and intangible assets (3,886) (6,260) (1,814) Loans granted to Associates, net of repayments (189) (118) (33) Receipts from deposits 107 212 478 Disposal of subsidiaries, net of cash disposed
(75) - -
Acquisition of subsidiaries, net of cash acquired
- (838) (27) Other (7) 25 -
Net cash flows used in investing activities (4,008) (6,945) (1,382)
Financing activities Proceeds from borrowings net of fees paid 3,094 10,389 1,170 Repayment of borrowings (3,650) (6,581) (2,898) Purchase of treasury shares - (1) (480) Dividends paid to equity holders of the parent - (1,216) (578) Dividends paid to non-controlling interests (26) (13) (72) Other
(5) 5 (6)
Net cash flows used in / from financing activities (587) 2,583 (2,864)
Net increase/(decrease) in cash and cash equivalents 2,662 1,744 (544) Net foreign exchange difference (38) (304) (22) Cash and cash equivalents at beginning of period 21 2,325 885 1,451
Cash and cash equivalents at end of period 21 4,949 2,325 885

Notes to consolidated financial statements
1 General information
VimpelCom Ltd. (“VimpelCom”, the “Company”, and together with its consolidated subsidiaries
the “Group” or “we”) was incorporated in Bermuda on 5 June 2009. The registered office of
VimpelCom Ltd. is Victoria Place, 31 Victoria Street, Hamilton HM 10, Bermuda. VimpelCom
Ltd.’s headquarters and principal place of business are located at Claude Debussylaan 88, 1082
MD Amsterdam, the Netherlands.
The consolidated financial statements are presented in United States dollars (“U.S. dollar” or
USD). In these notes, U.S. dollar amounts are presented in millions, except for share and per
share (or ADS) amounts and as otherwise indicated.
On 15 April 2011, VimpelCom successfully completed the acquisition of 51.9% of Orascom Telecom Holding S.A.E. (“Orascom Telecom”, or “OTH”) and 100% of Wind Telecomunicazioni S.p.A. (“Wind Italy”) through the acquisition of Wind Telecom S.p.A. (“Wind Telecom”, formerly Weather) (Note 6).
VimpelCom earns revenues by providing voice, data and other telecommunication services
through a range of wireless, fixed and broadband internet services, as well as selling equipment
and accessories. As of 31 December 2012, the Company operated telecommunications services
in Russia, Italy, Algeria, Kazakhstan, Ukraine, Pakistan, Bangladesh, Armenia, Tajikistan,
Uzbekistan, Georgia, Kyrgyzstan, Laos, Central African Republic, Burundi, and Cambodia. The
Company also holds equity shareholdings in companies operating in Canada and Zimbabwe.
The consolidated financial statements of the Company for the year ended 31 December 2012
were authorized for issue in accordance with a resolution of the Audit Committee of the
Supervisory Board on 22 March 2013, acting under authority delegated to the Audit Committee
from the Supervisory Board on 5 March 2013.

12
2 Basis of preparation of the consolidated financial statements
Basis of preparation
These consolidated financial statements have been prepared in accordance with International
Financial Reporting Standards (“IFRS”) as issued by the International Accounting Standards
Board (“IASB”), effective at the time of preparing the consolidated financial statements and
applied by VimpelCom. The consolidated financial statements have been prepared on a
historical cost basis, unless disclosed otherwise.
The preparation of these consolidated financial statements have required management to apply
accounting policies and methodologies based on complex and subjective judgments, estimates
based on past experience and assumptions determined to be reasonable and realistic based on
the related circumstances. The use of these estimates and assumptions affects the amounts
reported in the statement of financial position and the income statement, as well as the notes.
The final amounts for items for which estimates and assumptions were made in the consolidated
financial statements may differ from those reported in these statements due to the uncertainties
that characterize the assumptions and conditions on which the estimates are based.
Application of certain accounting principles requires a higher degree of subjectivity when making
judgments and changes in the underlying conditions could significantly affect the consolidated
financial statements. Note 4 below includes further discussion of certain critical accounting
estimates.
Basis of consolidation
The consolidated financial statements comprise the financial statements of the Company and its
subsidiaries. Subsidiaries are fully consolidated from the date of acquisition, which is the date
on which the Company obtains control, and continue to be consolidated until the date when such
control ceases. The financial statements of subsidiaries are prepared for the same reporting
period as the parent company, using consistent accounting policies.
All intercompany accounts and transactions within the Group have been eliminated.
Non-controlling interests are reported in the consolidated statement of financial position as a
separate component of equity. Non-controlling interests represent the equity in subsidiaries not
attributable, directly or indirectly, to the Company. We refer to Note 17 for the effect of options
over non-controlling interests.

13
3 Significant accounting policies
New accounting pronouncements not yet adopted
VimpelCom adopts new IFRSs by following the transitional requirements of each new standard.
The following new or revised IFRSs which are relevant to the Group have not yet been adopted
by VimpelCom:
IAS 1 Presentation of Items of Other Comprehensive Income – Amendments to IAS 1. The
amendments to IAS 1 change the grouping of items presented in other comprehensive
income (OCI). Items that could be reclassified (or ‘recycled’) to profit or loss at a future point
in time (for example, net gain on hedge of net investment, exchange differences on
translation of foreign operations, net movement on cash flow hedges and net loss or gain on
available-for-sale financial assets) would be presented separately from items that will never
be reclassified (for example, actuarial gains and losses on defined benefit plans and
revaluation of land and buildings). The amendment affects presentation only and will have no
impact on the Group’s financial position or reported performance. The amendment becomes
effective for annual periods beginning on or after 1 July 2012.
IAS 19 Employee Benefits (Revised). This standard contains numerous amendments to IAS
19. These range from fundamental changes such as removing the corridor mechanism and
the concept of expected returns on plan assets to simple clarifications and re-wording. The
amended standard will impact the net benefit expense, as the new standard requires that the
expected return on plan assets will be calculated using the same interest rate as applied for
the purpose of discounting the benefit obligation. The Group does not expect that the
changes from the new standard will materially impact the Group’s financial position or
reported performance. The amendment becomes effective for annual periods beginning on or
after 1 January 2013.
IAS 28 Investments in Associates and Joint Ventures (as revised in 2011). As a consequence
of the new IFRS 11 Joint Arrangements and IFRS 12 Disclosure of Interests in Other Entities,
IAS 28 Investments in Associates, has been renamed IAS 28 Investments in Associates and
Joint Ventures, and describes the application of the equity method to investments in joint
ventures, in addition to associates. The application of the equity method will not change as a
result of this amendment and therefore this standard will have no impact on the Group’s
financial position or reported performance. The revised standard becomes effective for
annual periods beginning on or after 1 January 2013.
IAS 32 Offsetting Financial Assets and Financial Liabilities — Amendments to IAS 32. These amendments permit financial assets and liabilities to be offset against each other for balance sheet presentation only where a currently existing, legally enforceable, unconditional right of offset applies to all counterparties of the financial instruments in all situations, including both normal operations and insolvency. The amendments also clarify the application of the IAS 32 offsetting criteria to settlement systems (such as central clearing house systems) which apply gross settlement mechanisms that are not simultaneous. These amendments are not expected to impact the Group’s financial position or reported performance and become effective for annual periods beginning on or after 1 January 2014.

14
IFRS 7 Disclosures — Offsetting Financial Assets and Financial Liabilities — Amendments to IFRS 7. These amendments require an entity to disclose information about rights to set-off and related arrangements (e.g., collateral agreements). The disclosures would provide users with information that is useful in evaluating the effect of netting arrangements on an entity’s financial position. The new disclosures are required for all recognised financial instruments that are set off in accordance with IAS 32 Financial Instruments: Presentation. The disclosures also apply to recognised financial instruments that are subject to an enforceable master netting arrangement or similar agreement, irrespective of whether they are set off in accordance with IAS 32. The amendment affects disclosures only and will have no impact on the Group’s financial position or result of operations. The amendment becomes effective for annual periods beginning on or after 1 January 2013.
IFRS 9 Financial Instruments: Classification and Measurement. IFRS 9, as issued, reflects the first phase of the IASB’s work on the replacement of IAS 39 and applies to classification and measurement of financial assets and financial liabilities as defined in IAS 39. The standard was initially effective for annual periods beginning on or after 1 January 2013, but Amendments to IFRS 9 Mandatory Effective Date of IFRS 9 and Transition Disclosures, issued in December 2011, moved the mandatory effective date to 1 January 2015. In subsequent phases, the IASB will address hedge accounting and impairment of financial assets. The Group will quantify the effect in conjunction with the other phases, when the final standard including all phases is issued.
IFRS 10 Consolidated Financial Statements. IFRS 10 replaces the portion of IAS 27 Consolidated and Separate Financial Statements that addresses the accounting for consolidated financial statements. It also addresses the issues raised in SIC-12 Consolidation — Special Purpose Entities. IFRS 10 establishes a single control model that applies to all entities including special purpose entities and defines that control is an investor’s ability to use its power over another entity, to affect the variable returns derived from its involvement with that entity. The changes introduced by IFRS 10 will require management to exercise significant judgment to determine which entities are controlled and therefore are required to be consolidated by a parent, compared with the requirements that were in IAS 27. Based on the analyses performed, IFRS 10 will have no impact on the Group’s financial position or reported performance. This standard becomes effective for annual periods beginning on or after 1 January 2013.
IFRS 11 Joint Arrangements. IFRS 11 replaces IAS 31 Interests in Joint Ventures and SIC-13 Jointly-controlled Entities — Non-monetary Contributions by Venturers. IFRS 11 removes the option to account for jointly controlled entities (JCEs) using proportionate consolidation. Instead, JCEs that meet the definition of a joint venture must be accounted for using the equity method. In 2012, VimpelCom was required to re-measure its 49.9% stake in Euroset Holding N.V. (“Euroset”) due to the creation of a joint venture with Lefbord Investments Limited, a company owned by OJSC MegaFon, one of our competitors in Russia, and its affiliate Garsdale Services Investment Ltd (together “Megafon”) and the acquisition of an additional 0.1% interest. The re-measurement amounted to USD 606, following the requirements of IAS 28 to fair value the original interest held prior to the transaction. Aside from the Euroset remeasurement that will be restated in 2013 through Other Comprehensive Income, the changes from IFRS 11 will not impact the Group’s financial position or reported performance. IFRS 11 becomes effective for annual periods beginning on or after 1 January 2013.

15
IFRS 12 Disclosure of Interests in Other Entities. IFRS 12 includes all of the disclosures that were previously in IAS 27 related to consolidated financial statements, as well as all of the disclosures that were previously included in IAS 31 and IAS 28. These disclosures relate to an entity’s interests in subsidiaries, joint arrangements, associates and structured entities. A number of new disclosures are also required. VimpelCom is currently assessing the impact IFRS 12 may have on the disclosures in its consolidated financial statements. This standard becomes effective for annual periods beginning on or after 1 January 2013.
IFRS 13 Fair Value Measurement. IFRS 13 establishes a single source of guidance under IFRS for all fair value measurements. IFRS 13 does not change when an entity is required to use fair value, but rather provides guidance on how to measure fair value under IFRS when fair value is required or permitted. Based on the Group’s assessment, the new standard will have no impact on VimpelCom’s financial position or reported performance. This standard becomes effective for annual periods beginning on or after 1 January 2013.
Business combinations
Business combinations are accounted for in accordance with IFRS 3 (revised January 2008), using the acquisition method. Under IFRS 3, the cost of the acquisition, or the total consideration transferred, is measured at the aggregate of the fair values at the date of exchange, of assets given, liabilities incurred or assumed, contingent consideration given and equity instruments issued by the Group in exchange for control of the acquiree and the amount of any non-controlling interest in the acquiree. The aggregate consideration transferred is allocated to the underlying assets acquired, including any intangible assets identified, and liabilities assumed based on their respective estimated fair values. Determining the fair value of assets acquired and liabilities assumed requires the use of significant estimates and assumptions, including assumptions with respect to future cash inflows and outflows, discount rates, licenses and other assets’ lives and market multiples, among other items. The results of operations of acquired businesses are included in the consolidated financial statements from the date of acquisition. For each business combination, VimpelCom elects whether to measure the non-controlling interest in the acquiree at fair value or at the proportionate share in the recognized amounts of the acquiree’s identifiable net assets. Acquisition costs are expensed as incurred in the income statement If the business combination is achieved in stages, the acquisition date fair value of the Group’s previously held equity interest in the acquiree is remeasured to fair value at the acquisition date and the difference is recognized through profit or loss. Furthermore, goodwill is only recognized at the time when the Group obtains control over the entity. Goodwill is initially measured at cost, being the excess of the sum of the consideration transferred, the amount of any non-controlling interests in the acquiree and the fair value of the Group’s previously held equity interest in the acquiree, if any, over the fair value of the net amounts of identifiable assets acquired and liabilities assumed at the acquisition date. After initial recognition, goodwill is carried at cost less any accumulated impairment losses. If the consideration is lower than the fair value of the net assets of the subsidiary acquired, the difference is recognized in profit or loss.

16
Goodwill is not amortised, but is tested for impairment on at least an annual basis or when impairment indicators are observed. The Group may enter into business combinations which include options (call, put, or a combination of both) over the shares of the non-controlling interest. The Group considers such options to assess possible implications on control, if any. Once the Group has acquired control of a business, any further transaction that changes the Group’s ownership interest, but does not result in the Group losing control, is accounted for as a transaction between shareholders. Any difference between the amount received for the change in ownership interest and the corresponding share of the carrying amount of the net assets is charged or credited to shareholders’ equity.
Investment in associates
An associate is an entity over which the Group has significant influence and that is neither a subsidiary nor an interest in a joint venture. Significant influence is the power to participate in the financial and operating policy decisions of the investee without control or joint control over those policies, and significant influence is assumed if the Group holds, directly or indirectly, 20 percent or more but less than 50 percent of the voting power of the investee, unless it can be clearly demonstrated that it does not have significant influence. Investments in associates are incorporated in the financial statements of the Group using the equity method of accounting. Under the equity method, the investment in associate is initially recognized at cost and is adjusted in subsequent periods for the post acquisition changes in the Group’s share of the net assets of the associate less any impairment in the value of the investment. Losses of an associate in excess of the Groups’ interest in that associate are recognized only to the extent that the Group has incurred a legal or constructive obligation or made payments on behalf of the associate. Goodwill upon acquisition is recorded as part of the investment value. Financial statements of associates are prepared for the same reporting period as the Group. Where necessary, adjustments are made to bring the accounting policies in line with those of the Group. Upon loss of significant influence, the Group measures and recognises its remaining investment at its fair value. Any difference between the carrying amount of the retained interest and the fair value thereof and any proceeds from a disposal is recognised in profit or loss.
Interest in joint ventures
The Group has interests in joint ventures which are jointly controlled entities, whereby the venturers have a contractual arrangement that establishes joint control over the economic activities of the entity, requiring unanimous agreement for financial and operating decisions among the venturers. VimpelCom recognises its interests in joint ventures using the equity method, as described above. The financial statements of the joint ventures are prepared for the same reporting period as the Group. Adjustments are made where necessary to bring the accounting policies in line with those of the Group.

17
Upon loss of joint control, VimpelCom measures and recognises its remaining investment at its fair value unless the investment should be accounted for as an investment in associate. Any difference between the carrying amount of the former jointly controlled entities upon loss of joint control and the fair value of the remaining investment and proceeds from disposal is recognised in profit or loss. Goodwill upon acquisition is recorded as part of the investment value.
Foreign currency translation
The consolidated financial statements of the Group are presented in US dollars. Each entity in the Group determines its own functional currency and amounts included in the financial statements of each entity are measured using that functional currency. Transactions denominated in foreign currencies are initially recognized at the functional currency rate prevailing on the date of the transaction. At period end, monetary assets and liabilities are translated to the functional currency using the closing rate with differences taken to profit and loss. Non-monetary items carried at historical cost that are denominated in foreign currencies are translated to the functional currency at the rate prevailing on the initial transaction dates. Non-monetary items carried at fair value are translated to the functional currency at the date when the fair value was determined. Upon consolidation, the assets and liabilities of foreign operations are translated into US dollars at the rate of exchange prevailing at the reporting date and their income statements are translated at the weighted average exchange rate for the period. The exchange rate differences arising on consolidation translation are recognized in other comprehensive income. On disposal or loss of control of a foreign operation, the component of other comprehensive income relating to that particular foreign operation is recognized in profit and loss.
Revenue recognition
VimpelCom generates revenues from providing voice, data and other telecommunication services through a range of wireless, fixed and broadband Internet services, as well as selling equipment and accessories. Products and services may be sold separately or in bundled packages. Revenue is recognized to the extent the Group has delivered goods or rendered services under an agreement, the amount of the revenue can be measured reliably and it is probable that the economic benefits associated with the transaction will flow to the Group. Revenue is measured at the fair value of the consideration received, subject to the considerations described below, and is stated net of value-added-tax and sales tax charged to customers.
Wireless services
Service revenues include revenues from airtime charges from contract and prepaid subscribers, monthly contract fees, interconnect revenues, roaming charges and charges for value added services (“VAS”). VAS includes short messages (“SMS”), multimedia messages (“MMS”), caller number identification, call waiting, data transmission, mobile Internet, downloadable content and other services. The content revenue relating to VAS is presented net of related costs when the Company acts as an agent of the content providers and gross when the Company acts as the

18
primary obligor of the transaction. More specifically, the accounting for revenue sharing agreements and delivery of content depends on the analysis of the facts and circumstances surrounding these transactions, which will determine if the revenue is recognised gross or net. VimpelCom charges subscribers a fixed monthly fee for the use of certain services. Such fees are recognized as revenue in the respective month. Service revenue is generally recognized when the services (including VAS and roaming revenue) are rendered. Sales of prepaid cards, used as a method of cash collection, is accounted for as customer advances for future services and the respective revenue is deferred until the customer uses the airtime. Prepaid cards might not have expiration dates but are subject to statutory expiration periods, and unused prepaid balances are added to service revenue based on an estimate of the expected balance that will expire unused.
Sales of equipment
Revenues from mobile equipment sales, such as handsets, are recognized in the period in which the equipment is sold to either a network customer or, if sold via an intermediary, when the significant risks and rewards associated with the device have passed to the intermediary and the intermediary has no general right of return or if a right of return exists, when such right has expired.
Interconnect and roaming revenue
Interconnect revenue (transit traffic) is generated when the Group receives traffic from mobile or fixed subscribers of other operators and that traffic terminates on VimpelCom’s network. Revenue is recognized on a gross or net basis depending on the amount of control over the traffic routing and hence exposure to risks and rewards. The Group recognizes mobile usage and roaming service revenues based on minutes of traffic processed or contracted fee schedules when the services are rendered. Roaming revenues include both revenues from VimpelCom customers who roam outside of their home country network and revenues from other wireless carriers for roaming by their customers on VimpelCom’s network. Revenues due from foreign carriers for international roaming calls are recognized in the period in which the call occurs.
Fixed-line services
Revenue from traditional voice services and other service contracts is accounted for when the services are provided. Revenue from Internet services is measured primarily by monthly fees and internet-traffic volume which has not been included in monthly fees. Payments from customers for fixed-line equipment are not recognized as revenue until installation and testing of such equipment are completed and accepted by the customer. Domestic Long Distance/International Long Distance (“DLD/ILD”) and zonal revenues are recorded gross or net depending on the contractual arrangements with the end-users.
Connection fees
VimpelCom defers upfront telecommunications connection fees. The deferral of revenue is recognized over the estimated average subscriber life or the minimum contractual term,

19
whichever is shorter. The Company also defers direct incremental costs related to connection fees for fixed line subscribers, in an amount not exceeding the revenue deferred.
Multiple elements agreements (“MEA”)
MEA are agreements under which VimpelCom provides more than one service. Services/ products may be provided or ‘bundled’ under different agreements or in groups of agreements which are interrelated to such an extent that, in substance, they are elements of one agreement. In the event of an MEA, each element is accounted for separately if it can be distinguished from the other elements and has a fair value on a standalone basis. The customer’s perspective is important in determining whether the transaction contains multiple elements or is just a single element arrangement. The relative fair value method is applied in determining the value to be allocated to each element of an MEA. Fair value is determined as the selling price of the individual item. If an item has not been sold separately by the Group yet, but is sold by other suppliers, the fair value is the price at which the items are sold by the other suppliers. Some tariffs include bundle rollovers which effectively allow customers to rollover unused minutes from one month to the following month. For these tariffs, the portion of the access fee representing the fair value of the rolled over minutes is deferred until the service is delivered.
Classification of non-operating items
The Company distinguishes results of operations between operating and non-operating depending on the nature of the transaction. Results that directly relate to operations are classified as operating items regardless of whether they involve cash, occur irregularly, infrequently, or are unusual in amount. Results that do not directly relate to operations such as sale of investments, changes in fair value of investments and other financial instruments are classified as non-operating.
Interest income/expense
For financial instruments measured at amortized cost, interest income or expense is recorded using the effective interest rate, which is the rate that discounts the estimated future cash payments or receipts based on the expected life of the financial instrument or a shorter period, where appropriate, to the net carrying amount of the financial asset or liability. Interest income or expense is included in finance income/costs in the consolidated income statement.
Taxation
Income tax expense represents the aggregate amount determined on the profit for the period based on current tax and deferred tax. In cases when the tax relates to items that are charged to other comprehensive income or directly to equity, the tax is also charged respectively to other comprehensive income or directly to equity.
Current income tax
Current tax is the expected tax payable on the taxable income for the year and any adjustments to tax payable in respect of previous years. Current tax, for the current and prior periods, to the extent unpaid, is recognized as a liability. If the amount already paid in respect of current and prior period exceeds the amount due for those periods, the excess is recognized as an asset.

20
Current tax liabilities (assets) for the current and prior periods is measured at the amount expected to be paid to (recovered from) the taxation authorities, using the tax rates (and tax laws) that have been enacted or substantially enacted by the end of the reporting period.
Uncertain tax positions
VimpelCom’s policy is to comply fully with applicable tax regulations in the jurisdictions in which
its operations are subject to income taxes. VimpelCom’s estimates of current income tax
expense and liabilities are calculated assuming that all tax computations filed by VimpelCom’s
subsidiaries will be subject to a review or audit by the relevant tax authorities. VimpelCom and
the relevant tax authorities may have different interpretations of how regulations should be
applied to actual transactions. Such uncertain tax positions are accounted for in accordance with
IAS 12 Income Taxes or IAS 37 Provisions, Contingent Liabilities and Contingent Assets
depending on the type of tax in question.
VimpelCom records provisions for income taxes it estimates will ultimately be payable when the
review or audits have been completed, including allowances for any interest and penalties which
may become payable.
For provisions for taxes other than income tax, the Company follows the general policy on
provisions.
Deferred taxation
Deferred taxes are recognized using the liability method and thus are computed as the taxes recoverable or payable in future periods in respect of deductible or taxable temporary differences. A temporary difference arises where the carrying amount of an asset or liability is different from its corresponding tax base. Deferred tax assets and liabilities are generally recognized for all taxable temporary differences, except to the extent that they arise from: a) the initial recognition of non tax deductible goodwill; or b) the initial recognition of an asset or liability in a transaction which
is not a business combination; and
at the time of the transaction, affects neither accounting profit nor taxable profit (tax loss).
Deferred tax assets are recognized for all deductible temporary differences to the extent that it is probable that future taxable profit will be available against which the deductible temporary differences can be utilized. Deferred tax assets are also recognized for the carryforward of unused tax losses and unused tax credits to the extent that it is probable that future taxable profits will be available to offset unused tax losses and unused tax credits. The carrying amount of deferred tax assets is reviewed at each reporting period date and adjusted to reflect changes in probability that sufficient taxable profits will be available to allow all or part of the assets to be recovered.

21
Deferred tax assets and liabilities are measured at the tax rates that are expected to apply to the period when the asset is realized or the liability is settled, based on tax rates (and tax laws) that have been enacted or substantially enacted by the end of the reporting period. Deferred tax is recognized for all taxable temporary differences associated with investments in subsidiaries, branches and associates, and interests in joint ventures except to the extent that the parent, investor or venturer is able to control the timing of the reversal of the temporary difference, and it is probable that the temporary difference will not reverse in the foreseeable future. Deferred tax assets and liabilities are offset when the entity has a legally enforceable right to offset current tax assets against current tax liabilities, and when they relate to income taxes levied by the same taxation authority on either the same taxable entity, or different taxable entities which intend either to settle current tax liabilities and assets on a net basis.
Property and equipment
Property and equipment (P&E) are stated at cost, net of accumulated depreciation and accumulated impairment losses, if any. The costs of an item of P&E include:
its purchase price, including import duties and non-refundable purchase taxes, after deducting trade discounts and rebates;
any costs directly attributable to bringing the asset to the location and condition necessary for it to be capable of operating in the manner intended by management. This includes capitalizing the internal labour cost of technical departments involved in the network development, and when applicable the borrowing costs under IAS 23;
initial cost estimations of dismantling and removing the item and restoring the site to which it is located, with an equal obligation recognized;
costs of installation and assembly of a connection line between the client and the Company’s network;
costs of site preparation, e.g. creating a foundation for the installation of connections; and
professional fees, e.g. for engineers. Depreciation is calculated on a straight-line basis over the estimated useful lives of the assets as follows:
Telecommunication equipment 7 – 20 years
Buildings and constructions 10 – 50 years
Office and measuring equipment 3 – 10 years
Other equipment 3 – 10 years Equipment acquired under a finance lease arrangement is depreciated on a straight-line basis over its estimated useful life or the lease term, whichever is shorter. Repair and maintenance costs which do not meet capitalization requirements are expensed as incurred. The carrying amount of an item in P&E is derecognized on disposal or when no future economic benefits are expected from its use or disposal. The gain or loss from derecognition of an item in

22
P&E is calculated as the difference between the net proceeds from disposal, if any, and the carrying amount of the item, and is included in the income statement when derecognized. Each asset’s residual value, useful life and method of depreciation is reviewed at the end of each financial year, and adjusted prospectively if necessary.
Borrowing costs
Borrowing costs directly attributable to the acquisition, construction or production of a qualifying asset, that necessarily takes a substantial period of time (longer than six months) to get ready for its intended use, are capitalized as part of the cost of the respective assets. All other borrowing costs are expensed in the period incurred. Borrowing costs consist of interest and other costs that VimpelCom incurs in connection with the borrowing of funds in order to produce qualifying assets.
Leases
Leases are classified as finance leases whenever the terms of the lease transfer substantially all the risks and rewards associated with ownership of the leased asset to VimpelCom. All other leases are classified as operating leases. The determination of whether an arrangement is, or contains, a lease is based on the substance of the arrangement at the inception date.
Finance leases
At the commencement of a finance lease term, VimpelCom recognizes the assets and liabilities in its statement of financial position at amounts equal to the fair value of the leased property or, if lower, the present value of the minimum lease payments as determined at the inception of the lease. The corresponding liability to the lessor is included in the statement of financial position as a finance lease obligation. The discount rate used in calculating the present value of the minimum lease payments is the interest rate implicit in the lease. If there is no interest rate in the lease, the Company’s incremental borrowing rate is used. Any initial direct costs of VimpelCom related to the lease are added to the amount recognized as an asset.
Operating leases
The rental payable under operating leases is recognized as operating lease expenses in the income statement on a straight-line basis over the lease term unless another systematic basis is more representative of the time pattern of VimpelCom’s benefit. No asset is capitalized. If the periodic payments or part of the periodic payments has been prepaid, the Company recognizes these prepayments in the statement of financial position as other non-financial assets.
Intangible assets (excluding Goodwill)
Intangible assets acquired separately are measured initially at cost. Following initial recognition, intangible assets are carried at cost less accumulated amortization and accumulated impairment losses, if any. Internally generated intangible assets (excluding eligible development costs) are expensed in the income statement as incurred. The cost basis of intangible assets acquired as part of a business combination is the fair value of the assets at acquisition date.

23
Intangible assets with a finite useful life are amortized over the assigned life on a systematic basis starting from the date the asset is ready for use. The amortization method reflects the pattern in which the asset's future economic benefits are expected to be consumed by the Group. The useful lives for licenses and other significant intangibles depend on details and terms of the license or other agreements. If that pattern cannot be determined reliably, the straight-line method is used. For intangible assets associated with customer relationships, the Company uses a declining balance amortization pattern based on the value contribution brought by customers. For other intangible assets, the straight-line method is used. The amortization charge for each period is recognized in profit or loss. The amortization period and the amortization method for an intangible asset with a finite useful life are reviewed at least annually. Gains or losses arising from derecognition of an intangible asset are measured as the difference between the net disposal proceeds and the carrying amount of the asset and are recognized in the income statement when the asset is derecognized.
Goodwill Goodwill is recognised for the future economic benefits arising from net assets acquired that are not individually identified and separately recognised. Goodwill is the difference between the considerations transferred, the amount of any non-controlling interest in the acquiree and the acquisition-date fair value of any previous equity interest in the acquiree over the fair value of the identifiable net assets acquired. If the non-controlling interest is measured at its fair value, goodwill includes amounts attributable to the non-controlling interest. If the non-controlling interest is measured at its proportionate share of identifiable net assets, goodwill includes only amounts attributable to the controlling interest – that is the parent. Goodwill is initially recognized as an asset at cost and is subsequently measured at cost less any accumulated impairment losses. Goodwill is not subject to amortization but is tested for impairment annually as of October 1 and as necessary when circumstances indicate that the carrying value may be impaired. Goodwill impairment is identified by assessing the recoverable amount, being the higher of Value in Use and Fair Value less Cost of Disposal, of each cash generating unit (“CGU”) (or group of CGUs) as more fully described below. Where the recoverable amount of the cash-generating unit is less than the carrying amount, an impairment loss is recognized for the difference. Impairment losses relating to goodwill cannot be reversed in future periods.
Impairment of assets
Property and equipment, intangible assets and investments in associates and joint ventures are tested for impairment in accordance with IAS 36 ‘Impairment of Assets’, unless classified as held for sale. Pursuant to IAS 36, the Company assesses, at the end of each reporting period, whether there are any indicators that an asset may be impaired. If there are such indicators, the Company estimates the recoverable amount of the asset. An asset’s recoverable amount is the higher of an asset’s or CGU’s fair value less costs to sell and its value in use. Where the carrying amount of an asset or CGU exceeds its recoverable amount, the asset is considered impaired and is written down to its recoverable amount. In assessing value in use, the estimated future cash flows are discounted to their present value using a pre-tax discount rate that reflects current market assessments of the time value of money and the risks specific to the asset. In determining fair value less costs to sell, recent market transactions are taken into account, if

24
available. If no such transactions can be identified, an appropriate valuation model is used. These calculations are corroborated by valuation multiples, quoted share prices for publicly traded subsidiaries or other available fair value indicators. Unless otherwise disclosed, recoverable amount represents value in use.
The Company bases its impairment calculation on detailed budgets and forecast calculations which are prepared separately for each of the Company’s CGUs. These budgets and forecast calculations are available for a period of five years. For longer periods, a long term growth rate is calculated and applied in order to project future cash flows after the fifth year. Impairment losses of continuing operations are recognized in the income statement in a separate line item. For assets other than goodwill, an assessment is made at each reporting date whether there is any indication that previously recognized impairment losses may no longer exist or may have decreased. If such indication exists, the Company estimates the asset’s or CGU’s recoverable amount. A previously recognized impairment loss is reversed only if there has been a change in the assumptions used to determine the asset’s recoverable amount since the last impairment loss was recognized. The reversal is limited so that the carrying amount of the asset does not exceed its recoverable amount, nor exceed the carrying amount that would have been determined, net of depreciation, had no impairment loss been recognized for the asset in prior years. Such reversal is recognized in the income statement unless the asset is carried at a revalued amount, in which case the reversal is treated as a revaluation increase.
Financial instruments
Financial assets or liabilities
Initial recognition and measurement When a financial asset or financial liability in the scope of IAS 39 ‘Financial Instruments: Recognition and Measurement’ is initially recognized, it is measured at fair value plus transaction costs that are directly attributable to the acquisition or issue of the financial asset or financial liability, except for a financial asset or financial liability at fair value through profit or loss, in which case transaction costs are expensed. Subsequent measurement of financial assets Financial assets can be categorized into the following categories that are relevant to the Group:
- Fair value through profit and loss
- Loans and receivables
- Derivatives designated as hedging instruments in an effective hedge The Company determines the classification of its financial assets at initial recognition. The subsequent measurement of financial assets depends on their classification as follows:
Fair value through profit and loss (“FVTPL”) Derivatives, including separated embedded derivatives, are classified as held for trading unless they are designated as effective hedging instruments as defined by IAS 39. Financial assets at fair value through profit and loss are carried in the statement of financial position at fair value with changes in fair value recognized in the income statement.

25
Loans and receivables Loans and receivables are non-derivative financial assets with fixed or determinable payments that are not quoted in an active market. After initial measurement, loans and receivables with maturity longer than one year are subsequently measured at amortized cost using the effective interest rate (“EIR”) method, less impairment. Amortized cost is calculated by taking into account any discount or premium on acquisition and fees or costs that are an integral part of the EIR. The amortization based on EIR is included in the income statement. After initial measurement, receivables with a maturity shorter than one year are subsequently measured at historical cost less allowance for uncollectible amounts.
Derecognition of financial assets A financial asset is derecognized when: a) the contractual rights to the cash flows from the financial asset have expired; or
b) the Company has transferred its rights to receive cash flows from the asset or has assumed an obligation to pay the received cash flows in full without material delay to a third party under a ‘pass-through’ arrangement; and either (a) the Group has transferred substantially all the risks and rewards of the asset, or (b) the Group has neither transferred nor retained substantially all the risks and rewards of
the asset, but has transferred control of the asset.
Impairment of financial assets A financial asset or a group of financial assets is impaired and impairment losses are incurred if there is objective evidence of impairment as a result of a past event that occurred subsequent to the initial recognition of the asset. The Company assesses at each balance sheet date whether there is objective evidence that a financial asset or group of assets may be impaired. For assets carried at amortized cost, the impairment loss is the difference between the asset’s carrying amount and the present value of estimated future cash flows at the original EIR (excluding future expected credit losses that have not yet been incurred). The carrying amount of the asset is reduced through the use of an allowance account and the amount of the loss is recognised in the income statement. Financial assets together with the associated allowance are written off when there is no realistic prospect of future recovery and all collateral has been realised or has been transferred to the Company.
Subsequent measurement of financial liabilities
Financial liabilities are classified as liabilities at fair value through profit or loss (including held for trading liabilities), derivatives designated as hedging instruments and other (i.e. accounts payable, notes payable). Financial liabilities are classified as held for trading if they are acquired for the purpose of repurchase in the near term. This category includes derivative financial instruments entered into by the Group that are not designated as effective hedging instruments in hedge relationships as defined by IAS 39. Separated embedded derivatives are also classified as held for trading unless they are designated as effective hedging instruments. Held for trading liabilities (including derivatives when they have negative fair values) are measured at fair value. The changes in fair value are included in the net profit or loss for the period. All other (not held for trading) financial liabilities are carried at amortized cost (i.e. loan payables).

26
Derecognition of financial liabilities The Company removes a financial liability (or a part of a financial liability) from its statement of financial position when it is extinguished, i.e. when the obligation specified in the contract is discharged, cancelled or expires.
Offsetting of financial instruments
A financial asset or liability is only offset when the Company:
1 has a current enforceable legal right to offset the recognized amounts; and
2 intends to either settle on a net basis or realize the asset and sell the liability
simultaneously.
Fair value of financial instruments
The fair value is the amount for which an asset could be exchanged, or a liability settled, between knowledgeable, willing parties in an arm's length transaction. The best evidence of fair value is a quoted price in an active market. If the market for a financial instrument is not active, the fair value could be determined by using an appropriate valuation technique, such as recent arm's length market transactions between knowledgeable, willing parties, of another instrument that is substantially the same. Other valuation techniques include the discounted cash flow analysis and option pricing models. The Company uses the following hierarchy for determining and disclosing the fair value of financial instruments by valuation technique: Level 1: quoted (unadjusted) prices in active markets for identical assets or liabilities Level 2: other techniques for which all inputs which have a significant effect on the recorded
fair value are observable, either directly or indirectly Level 3: techniques which use inputs that have a significant effect on the recorded fair value
that are not based on observable market data
Derivative financial instruments and hedge accounting
Initial recognition and subsequent measurement The Company uses derivative instruments such as forwards, interest rate swaps and forward rate agreements, futures, options and others. Such derivative instruments are initially recognized at fair value on the date on which a derivative contract is entered into and are subsequently remeasured at fair value. Derivatives are carried as financial assets when the fair value is positive and as financial liabilities when the fair value is negative. When a contract is entered into, the instrument is initially recognized at fair value, with subsequent changes in fair value being recognized as a financial component of income. Where a hedge relationship is identified and the derivative financial instrument is designated as a hedge, subsequent changes in fair value are accounted for in accordance with the specific criteria discussed below. The relationship between each derivative qualifying as a hedging instrument and the hedged item is documented to include the risk management objective, the strategy for covering the hedge and the means by which the hedging instrument’s effectiveness will be assessed. An assessment of the effectiveness of each hedge is made when each derivative financial instrument becomes active and throughout the hedge term. When the hedge refers to changes in the fair value of a recognized asset or liability (a fair value hedge), the changes in the fair value of the hedging instrument and those of the hedged item are

27
both recognized in profit or loss. If the hedge is not fully effective, the non-effective portion is treated as finance income or expense for the year in the income statement. The Company has designated certain interest-rate swaps to qualify as a fair value hedge of certain financial liabilities. For a cash flow hedge, the fair value changes of the derivative are subsequently recognized, limited to the effective portion, in other comprehensive income (cash flow hedge reserve). A hedge is normally considered highly effective if from the beginning and throughout its life the changes in the expected cash flows for the hedged item are substantially offset by the changes in the fair value of the hedging instrument. When the economic effects deriving from the hedged item are realized, the reserve is reclassified to the income statement together with the economic effects of the hedged item. Whenever the hedge is not highly effective, the non-effective portion of the change in fair value of the hedging instrument is immediately recognized as a financial component of the profit or loss for the year. The Company designated cash flow hedges with respect to certain obligations denominated in USD for the entities which functional currency is EUR or RUB and with respect to floating rate debt which was swapped to fixed rate. These obligations are translated at the year-end exchange rate and any resulting exchange gains and losses are offset in the income statement against the change in the fair value of the hedging instrument. When hedged forecasted cash flows are no longer considered highly probable during the term of a derivative, the portion of the cash flow hedge reserve relating to that instrument is reclassified as a financial component of the profit or loss for the year. If instead the derivative is sold or no longer qualifies as an effective hedging instrument, the “cash flow hedge reserve” recognized to date remains as a component of equity and is reclassified to profit or loss for the year in accordance with the criteria of classification described above when the originally hedged transaction affects profit or loss.
Inventories
Inventories are valued at the lower of cost and net realizable value. The cost of inventories is comprised of all costs of purchase, costs of conversion and other costs incurred in bringing the inventories to their present location and condition. Inventories are expensed by applying the weighted-average cost method.
Trade and other receivables
Trade and other receivables include invoiced amounts less appropriate allowances for estimated uncollectible amounts. Estimated uncollectible amounts are based on the ageing of the receivable balances, payment history and other evidence of collectability. Receivable balances are written off when management deems them not to be collectible.
Cash and cash equivalents
Cash and cash equivalents in the statement of financial position is comprised of cash at banks and on hand and highly liquid investments that are readily convertible to known amounts of cash, are subject to only an insignificant risk of changes in value and have an original maturity of less than 92 days.

28
Convertible preference shares (“CPS”)
Both a liability and an equity component are recorded for CPS. The value of the liability is equal to the present value of the redemption amount, which represents the value of USD 0.001 per share. The equity value is the residual amount after deducting the debt value from the fair value of the entire instrument.
Provisions
Provisions are recognized when the Company has a present obligation (legal or constructive) as a result of a past event, it is probable that the Group will be required to settle the obligation and a reliable estimate can be made of the amount of the obligation. No provision is made where the legal procedures are at too early a stage. The amount recognized as a provision is the best estimate of the expenditure required to settle the obligation at the balance sheet date. Provisions are discounted to their present value if the effect of the time value of money is material. In order to calculate the present value, a pre-tax risk free rate that reflects current market assessments of the time value of money and the risks specific to the liability is used. In some cases, a part or all of the expenditure required to settle a provision is expected to be reimbursed by another party. The reimbursement is recognized only if it is virtually certain that the reimbursement will be received when the obligation is settled. The reimbursement is treated as a separate asset. Contingent liabilities and assets are not recognized on the statement of financial position.
Share-based payments
Certain of the Group’s employees are entitled to equity-settled share-based payments. These payments are measured at fair value (excluding the effect of non market-based vesting conditions) at the grant date. The fair value determined at the grant date is recognized as a compensation expense, and as a corresponding increase in equity. Compensation expense is recorded on a straight-line basis over the vesting period, based on the Group’s estimate of the shares that will eventually vest and adjusted for the effect of non market-based vesting conditions. The income statement expense or credit for a period represents the movement in cumulative expense recognized as of the beginning and end of that period. No expense is recognized for awards that do not ultimately vest, except for equity-settled transactions for which vesting are conditional upon a market or non-vesting condition. These are treated as vesting irrespective of whether or not the market or non-vesting condition is satisfied, provided that all other performance and/or service conditions are satisfied. VimpelCom uses the Black-Scholes model and Monte-Carlo simulation for determining the fair value at the grant date. The Company also has share-based compensation in the form of cash settled stock appreciation rights (“SARs”) and Phantom plans which it offers to a selected group of directors and senior management. The cost of these instruments is recorded as a liability on the basis that settlement will be cash based. The cost of these share plans is remeasured based on fair value of the instruments on each reporting date and is required to be recognized over the period during which the employees are required to provide services in exchange for the equity-based

29
compensation. Any changes in fair value at the date of settlement are recognized in the income statement.
30
4 Significant accounting judgments, estimates and assumptions
Accounting judgments
Accounting for investment in Globalive Investment Holding (“GIHC”)
As part of the Wind Telecom acquisition, VimpelCom acquired OTH’s investment in GIHC, which
is the 100% parent company of Globalive Wireless Management Corporation (“GWMC”), a
telecommunications operator in Canada. The two main shareholders of GIHC are OTH and AAL Holdings Corporation (“AAL”). As of 31 December 2012 OTH owns 32% of voting equity but
65% of total equity of GIHC whereas AAL owns 67% of voting equity and 34% of total equity of
GIHC (Note 28). VimpelCom has performed an analysis under IAS 27 and SIC 12 Consolidation
– Special Purpose Entities and the definition of control under IAS 27 to assess whether the
company has control over GWMC. This assessment is considered a judgmental area. As a
result of the analysis, we made a significant judgment that we do not have an ability to control
the activities of GWMC’s since we do not control the actions of the Board of Directors of GWMC.
The GWMC Board of Directors makes all significant decisions and is the main governing body to
decide on day-to-day and strategic operational decisions of GWMC. As such VimpelCom does
not consolidate GWMC (refer to the Note 12).
Critical accounting estimates A critical accounting estimate is an estimate that is both important to the presentation of the
Group’s financial position and requires management’s most difficult, subjective or complex
judgments, often as a result of the need to determine estimates and develop assumptions about
the outcome of matters that are inherently uncertain. Management evaluates such estimates on
an ongoing basis, based upon historical results, historical experience, trends, consultations with
experts, forecasts of the future, and other methods which management considers reasonable
under the circumstances. Management considers the accounting estimates discussed below to
be its critical accounting estimates, and, accordingly, provides an explanation of each.
Revenue Recognition
The Group’s revenues primarily consist of revenues from sale of services and periodic
subscriptions. The Group offers subscribers, via multiple element arrangements (‘bundles’) or
otherwise, a number of different services with different price plans, and provides discounts in
various types and forms, often in connection with different campaigns, over the contractual or
average customer relationship period. Determining the fair value of each deliverable can require
complex estimates due to the nature of the goods and services provided. The Group also sells
wholesale products to other operators and vendors in different countries and across borders.
Management has to make estimates related to revenue recognition, relying to some extent, on
information from other operators regarding values of services delivered. Management also
makes estimates for the final outcome in instances where the other parties dispute the amounts
charged. Furthermore, management has to estimate the average customer relationship for
revenue that is initially recognised as deferred revenue in the statement of financial position and
is thereafter recognised in the income statement over a future period, e.g. connection fees.
Management also applies judgment in evaluating gross or net presentation of revenue and
associated fees. In this case, among others, the main factor is whether the Company is
considered as the primary obligor in the transactions.

31
Business combinations
We have entered into certain acquisitions in the past and may make additional acquisitions in
the future. For the larger acquisitions, third-party valuation experts are engaged to assist in
determining and allocating the fair values of the assets acquired and liabilities assumed. Our
financial statements are impacted by the manner in which we allocate the purchase price in a
business combination, as assets that are considered to be subject to depreciation will reduce
future operating results, whereas goodwill and certain other intangible assets are of a non-
amortizing nature, therefore there is no income statement impact. As part of our purchase price
allocation, it is necessary to determine the purchase price paid, which includes the fair value of
securities issued and an estimate for any contingent consideration.
After the purchase price is established, we allocate it to the underlying assets acquired and
liabilities assumed, therefore assets and liabilities that are not originally reflected in the acquired
entity need to be assessed and valued. This process requires significant judgment on our part as
to what those assets and liabilities are and how they should be valued. Significant acquired
intangible assets that have been recognised by the Group in connection with business
combinations include customer bases, customer contracts, brands, licenses, service concession
rights, roaming agreements and software. The significant tangible assets primarily include
networks. The valuation of the individual assets, in particular intangible assets, such as
customer intangibles, brands, and so forth requires us to make significant assumptions,
including, among others, the expected future cash flows, the appropriate interest rate to value
those cash flows and expected future customer churn rates. All of these factors, which are
generally developed in conjunction with the guidance and input of professional valuation
specialists, require judgment and estimates. A change in any of these estimates or judgments
could change the amount of the purchase price to be allocated to the particular asset or liability.
The resulting change in the purchase price allocation to a non-goodwill asset or liability has a
direct impact on the residual amount of the purchase price that cannot be allocated, referred to
as “goodwill.” See below Note 6 for further information about significant business combinations.
Impairment of non-current assets
The Group has made significant investments in property and equipment, intangible assets,
goodwill and other investments.
Pursuant to IFRS, goodwill and other intangible assets with indefinite useful lives and intangible
assets not yet brought into use must be tested for impairment annually or more often if indicators
of impairment exist. Other assets are tested for impairment when circumstances indicate there
may be a potential impairment.
Estimating recoverable amounts of assets and CGUs must, in part, be based on management’s
evaluations, including the determination of the appropriate CGUs, the discount rate, estimates of
future performance, the revenue generating capacity of the assets, timing and amount of future
purchases of property and equipment, assumptions of the future market conditions and the long-
term growth rate into perpetuity (terminal value). Changing the assumptions selected by
management, in particular, the discount rate and growth rate assumptions used to estimate the

32
recoverable amounts of assets, could significantly impact the Group’s impairment evaluation and
hence results.
A significant part of the Group’s operations is in countries with emerging markets. The political
and economic situation in these countries may change rapidly and global financial turmoil and
recession may potentially have a significant impact on these countries. Recessionary effects and
the debt crisis in Europe in 2011 and 2012, as well as increased macroeconomic risks, impacted
our assessment of cash flow forecasts and the discount rates applied.
There are significant variations between different markets with respect to growth, mobile
penetration, ARPU, market share and similar parameters, resulting in differences in earnings before interest, tax, depreciation and amortization (“Adjusted EBITDA”) margins. The future
developments of Adjusted EBITDA margins are important in the Group’s impairment
assessments, and the long-term estimates of Adjusted EBITDA margins are highly uncertain. In
particular, this is the case for emerging markets that are still not in a mature phase.
See below Note 10 for further information about goodwill and other non-current assets
impairment test.
Depreciation and amortization of non-current assets
Depreciation and amortization expenses are based on management estimates of useful life,
residual value and amortization method of property and equipment and intangible assets.
Estimates may change due to technological developments, competition, changes in market
conditions and other factors and may result in changes in the estimated useful life and in the
amortization or depreciation charges. Technological developments are difficult to predict and our
views on the trends and pace of development may change over time. Some of the assets and
technologies, in which the Group invested several years ago, are still in use and provide the
basis for the new technologies. Critical estimates in the evaluations of useful lives for intangible
assets include, but are not limited to, the estimated average customer relationship based on
churn, the remaining license or concession period and the expected developments in technology
and markets. The useful lives of property and equipment and intangible assets are reviewed at
least annually, taking into consideration the factors mentioned above and all other important
relevant factors. Estimated useful lives for similar types of assets may vary between different
entities in the Group due to local factors such as growth rate, maturity of the market, history and
expectations for replacements or transfer of assets, climate and quality of components used.
The actual economic lives of intangible assets may be different than our estimated useful lives,
thereby resulting in a different carrying value of our intangible assets with finite lives. We
continue to evaluate the amortization period for intangible assets with finite lives to determine
whether events or circumstances warrant revised amortization periods. A change in estimated
useful lives is a change in accounting estimate, and depreciation and amortization charges are
adjusted prospectively. See Note 15 and 16 for further information.
Deferred tax assets and uncertain tax positions
Deferred tax assets are recognised to the extent that it is probable that the assets will be
realised. Significant judgment is required to determine the amount that can be recognised and
depends foremost on the expected timing, level of taxable profits, tax planning strategies and the
existence of taxable temporary differences. The judgments relate primarily to losses carried

33
forward in some of the Group’s foreign operations. When an entity has a history of recent losses
the deferred tax asset arising from unused tax losses is recognised only to the extent that there
is convincing evidence that sufficient future taxable profit will be generated. Estimated future
taxable profit is not considered such evidence unless that entity has demonstrated the ability by
generating significant taxable profit for this year or there are certain other events providing
sufficient evidence of future taxable profit. New transactions and the introduction of new tax rules
may also affect the judgments due to uncertainty concerning the interpretation of the rules and
any transitional rules.
Provisions for uncertain tax positions are recognized when it is probable that a tax position will
not be sustained and the amount can be reliably measured. The expected resolution of uncertain
tax positions is based upon managements’ judgment of the likelihood of sustaining a position
taken through tax audits, tax courts and/or arbitration, if necessary. Circumstances and
interpretations of the amount or likelihood of sustaining a position may change through the
settlement process. Furthermore, the resolution of uncertain tax positions is not always within
the control of the Group and it is often dependent on the efficiency of the legal processes in the
relevant taxing jurisdictions in which the Group operates. Issues can, and often do, take many
years to resolve. See Note 13 and Note 25 for further information.
Fair value of financial instruments
Where the fair value of financial assets and financial liabilities recorded in the statement of financial position cannot be derived from active markets, their fair value is determined using valuation techniques, including discounted cash flow models. The inputs to these models are taken from observable markets where possible, but when this is not feasible, a degree of judgment is required in establishing fair values. The judgments include considerations of inputs such as liquidity risk, credit risk and volatility. Changes in assumptions about these factors could affect the reported fair value of financial instruments. See Note 17 for further information.
Provisions
The Group is subject to various legal proceedings, disputes and claims, including regulatory
discussions related to the Group’s business, licenses, tax positions and investments and the
outcomes are subject to significant uncertainty. Management evaluates, among other factors,
the degree of probability of an unfavourable outcome and the ability to make a reasonable
estimate of the amount of loss. Unanticipated events or changes in these factors may require the
Group to increase or decrease the amount recorded or to be recorded for a matter that has not
been previously recorded because it was not considered probable or a reasonable estimate
could not be made.
For certain operations in emerging markets, the Group is involved in legal proceedings and
regulatory discussions. Management’s estimates relating to legal proceedings and regulatory
discussions in these countries involve a high level of uncertainty. See Note 25 for further
information.

34
5 Financial risk management The Company’s principal financial liabilities, other than derivatives, comprise of loans and borrowings and trade and other payables. The main purpose of these financial liabilities is to finance the Company’s operations. The Company has loans given and other receivables, trade and other receivables, and cash and short-term deposits that derive directly from its operations. The Company views derivative instruments as risk management tools and does not use them for trading or speculative purposes. The Company is exposed to market risk, credit risk and liquidity risk.
The Company’s senior management oversees the management of these risks. The Company’s
senior management is supported by the Treasury department that advises on financial risks and
the appropriate financial risk governance framework for the Company. The Financial Committee
provides assurance to the Company’s senior management that the Company’s financial risk-
taking activities are governed by appropriate policies and procedures and that financial risks are
identified, measured and managed in accordance with Group policies and Group risk appetite.
All derivative activities for risk management purposes are carried out by specialist teams that
have the appropriate skills, experience and supervision. It is the Company’s policy that no
trading in derivatives for speculative purposes shall be undertaken.
The Board reviews and agrees policies for managing each of these risks which are summarized
below.
Market risk
Market risk is the risk that the fair value of future cash flows of a financial instrument will
fluctuate because of changes in market prices. Market prices comprise four types of risk: interest
rate risk, currency risk, such as equity price risk. Financial instruments affected by market risk
include loans and borrowings, deposits, and derivative financial instruments. The sensitivity
analyses in the following sections relate to the position as of 31 December in 2012 and 2011.
The sensitivity analyses have been prepared on the basis that the amount of net debt, the ratio
of fixed to floating interest rates of the debt and derivatives and the proportion of financial
instruments in foreign currencies are all constant and on the basis of the hedge designations in
place at 31 December 2012 and 2011 respectively. The analyses exclude the impact of
movements in market variables on the carrying value of pension and other post-retirement
obligations (insignificant for the Company), provisions and on the non-financial assets and the
translation risk of liabilities of foreign operations. The analyses of sensitivity with respect to the
derivatives over non-controlling interests in subsidiaries are described in Note 17.
Interest rate risk
Interest rate risk is the risk that the fair value or future cash flows of a financial instrument will
fluctuate because of changes in market interest rates. The Company’s exposure to the risk of
changes in market interest rates relates primarily to the Company long-term debt obligations with
floating interest rates. The Company manages its interest rate risk by having a balanced portfolio
of fixed and variable rate loans and borrowings. To further manage this, the Company enters
into interest rate swaps, in which the Company agrees to exchange, at specified intervals, the
difference between fixed and variable rate interest amounts calculated by reference to an

35
agreed-upon notional principal amount. These swaps are designated to hedge underlying debt
obligations.
At 31 December 2012, after taking into account the effect of interest rate swaps, approximately
93% of the Company’s borrowings are at a fixed rate of interest (2011: 82%).
Interest rate sensitivity
The following table demonstrates the sensitivity to a reasonably possible change in interest rates
on loans and borrowings. With all other variables held constant, the Company’s profit before tax
is affected through the impact on floating rate borrowings and cash and the Company’s equity is
affected through the impact of a parallel shift of the yield curve on the fair value of derivatives to
which cash flow hedge accounting is applied as follows:
Increase/decrease in basis points
Effect on profit before tax
Effect on equity
2012
Euro +100 (3) 283 US Dollar +100 15 (215) Algerian Dinar +100 18 - Pakistani Rupee +100 (3) - Other currencies +100 4 -
Euro -100 3 (296) US Dollar -100 (15) 226 Algerian Dinar -100 (18) - Pakistani Rupee -100 3 - Other currencies -100 (4) -
2011
Euro +100 (4) 352 US Dollar +100 (17) (236) Algerian Dinar +100 10 – Other currencies +100 (4) – Euro -100 4 (370) US Dollar -100 17 250 Algerian Dinar -100 (10) – Other currencies -100 4 –
Foreign currency risk
Foreign currency risk is the risk that the fair value or future cash flows of a financial instrument
will fluctuate because of changes in foreign exchange rates. The Company’s exposure to the risk
of changes in foreign exchange rates relates primarily to the debt at subsidiary level
denominated in currencies other than the functional currency, the Company’s operating activities
(predominantly capital expenditures at subsidiary level denominated in a different currency from
the subsidiary’s functional currency) and the Company’s net investments in foreign subsidiaries.
The Company manages its foreign currency risk by selectively hedging cash flow exposures that
are expected to occur within a maximum 18-month period.

36
The Company hedges part of its exposure to fluctuations on the translation into US dollar of its
foreign operations by holding net borrowings in foreign currencies and can use foreign currency
swaps and forwards for this purpose as well.
Foreign currency sensitivity
The following table demonstrates the sensitivity to a reasonably possible change in the RUB,
EUR and BDT exchange rates against the USD with all other variables held constant. In 2011,
the sensitivity table also included the impact of a reasonable possible change in the EGP
exchange rate against the USD and the CAD. The functional currency of one of our subsidiaries
was adjusted from EGP to USD in 2012. The table shows the effect on the Company’s profit
before tax (due to changes in the value of monetary assets and liabilities, including non-
designated foreign currency derivatives) and equity. The Company’s exposure to foreign
currency changes for all other currencies is not material.
Change in foreign exchange rate
Effect on profit before tax
Effect on equity
2012 10% depreciation currencies against USD
(226) 183
10% appreciation currencies against USD
244 (244)
2011 10% depreciation currencies against USD
(468) 155
10% appreciation currencies against USD
426 (170)
10% depreciation EGP
against CAD 124 -
10% appreciation EGP
against CAD (113) -
The movement on the profit before tax is a result of a change in the fair value of derivative
financial instruments not designated in a hedging relationship and monetary assets and liabilities
denominated in currencies other than the functional currency of the entity. Although the
derivatives have not been designated in a hedge relationship, they act as a commercial hedge
and will offset the underlying transactions when they occur.
Credit risk
Credit risk is the risk that counterparty will not meet its obligations under a financial instrument or
customer contract, leading to a financial loss. The Company is exposed to credit risk from its
operating activities (primarily for trade receivables) and from its financing activities, including
deposits with banks and financial institutions, foreign exchange transactions and other financial
instruments. See Note 21 for further information on restriction on cash balances.
Trade accounts receivable consist of amounts due from subscribers for airtime usage and
amounts due from dealers and subscribers for equipment sales. In certain circumstances,
VimpelCom requires deposits as collateral for airtime usage. In addition, VimpelCom has

37
introduced a prepaid service GSM network. Equipment sales are typically paid in advance of
delivery, except for equipment sold to dealers on credit terms. VimpelCom’s credit risk arising
from its trade accounts receivable from subscribers is mitigated due to the large number of its
active subscribers (subscribers in the registered subscriber base who were a party to a revenue
generating activity in the past three months and remain in the base at the end of the reported
period), of which approximately 96% subscribed to a prepaid service as of 31 December 2012
(2011: 95%) and, accordingly, do not give rise to credit risk.
VimpelCom’s credit risk arising from its trade accounts receivable from dealers is mitigated due
to the large number of dealers. Management periodically reviews the history of payments and
credit worthiness of the dealers. The Company also has receivables from other local and
international operators from interconnect and roaming services provided to their customers, as
well as receivables from customers using fixed-line services, such as business services,
wholesale services and services to residents. Receivables from other operators for roaming
services are settled through clearing houses and, accordingly, do not give rise to credit risk.
VimpelCom holds available cash in bank accounts as well as other financial assets with financial
institutions in countries of its operations. To manage credit risk associated with such asset
holdings, VimpelCom allocates its available cash to a variety of local banks and local affiliates of
international banks within the limits set forth by its treasury policy. Management periodically
reviews the credit worthiness of the banks with which it holds assets. In respect of financial
instruments used by the Company’s treasury function, the aggregate credit risk the Group may
have with one counterparty is limited by reference to amongst others the long-term credit ratings
assigned for that counterparty by Moody’s, Fitch Ratings and Standard & Poor’s and CDS
spreads of that counterparty.
VAT is recoverable from the tax authorities via offset against VAT payable to the tax authorities
on VimpelCom’s revenue or direct cash receipts from the tax authorities. Management
periodically reviews the recoverability of the balance of input value added tax and believes it is
fully recoverable.
VimpelCom issues advances to a variety of vendors of property and equipment for its network
development. The contractual arrangements with the most significant vendors provide for
equipment financing in respect of certain deliveries of equipment. VimpelCom periodically
reviews the financial position of vendors and their compliance with the contract terms.
Trade receivables Customer credit risk is managed by each business unit subject to the Company’s established policy, procedures and control relating to customer or other counterparty credit risk management. Credit quality of the customer or other telecommunication and roaming providers is assessed based on an extensive credit rating scorecard and individual credit limits are defined in accordance with this assessment. Outstanding trade and other receivables are regularly monitored and any shipments to major customers are generally covered by letters of credit or other forms of credit insurance. The requirement for impairment is analysed at each reporting date on an individual basis for major clients. Additionally, a large number of minor receivables are grouped into homogenous groups and assessed for impairment collectively. The calculation is based on actually incurred

38
historical data. The maximum exposure to credit risk at the reporting date is the carrying value of each class of financial assets disclosed in Note 17. The Company does not hold collateral as security. The Company evaluates the concentration of risk with respect to trade receivables as low, as its customers are located in several jurisdictions and industries and operate in largely independent markets. Concentrations of credit risk with respect to trade receivables are limited given that the Group’s customer base is large and unrelated. Due to this management believes there is no further credit risk provision required in excess of the normal provision for bad and doubtful receivables.
Financial instruments and cash deposits
Credit risk from financial assets held with banks and financial institutions is managed by the
Company’s treasury department in accordance with the Company’s policy. Investments of
surplus funds are made only with approved counterparties and within credit limits assigned to
each counterparty, which have been set as a function of the current banking relationship, the
credit rating of the counterparty and the legal group it belongs to and the balance sheet total of
the counterparty. Counterparty credit limits are reviewed and approved by the Company’s CFO.
The limits are set to minimise the concentration of risks and therefore mitigate financial loss
through potential counterparty’s failure.
The Company’s maximum exposure to credit risk for the components of the statement of
financial position at 31 December 2012 and 2011 is the carrying amounts as illustrated in
Note 17, and for derivative financial instruments the carrying amounts as noted in Note 17.
Liquidity risk
The Company monitors its risk to a shortage of funds using a recurring liquidity planning tool.
The Company’s objective is to maintain a balance between continuity of funding and flexibility
through the use of bank overdrafts, bank loans, debentures, preference shares, financial and
operating leases. The Company’s policy is that not more than 35% of borrowings should mature
in a single year. 10% of the Company’s debt will mature in less than one year at 31 December
2012 (2011: 9%) based on the carrying value of bank loans, equipment financing and loans from
others reflected in the financial statements. The Company assessed the concentration of risk
with respect to refinancing its debt and concluded it to be low. Access to sources of funding is
sufficiently available and the Company’s policy is to diversify the funding sources where
possible.
At 31 December 2012, the Company has Revolving Credit Facilities and Vendor Financing
Facilities of which the availability is maturing in the period from November through December
2014. The facilities are for the amounts of USD 725 (2011: USD 225), EUR 205 (2011: EUR
205) and RUB 15,000 (2011: RUB 15,000), or an aggregate of USD 1,489 (2011: USD 956)
equivalent and are not utilized at 31 December 2012 (at 31 December 2011 utilized for RUB
4,500 equivalent to USD 140). Wind Italy has a Revolving Credit Facility available, which
matures in November 2016. The facility is for the amount of EUR 400 (2011: 400), of which EUR
100 (2011: nil) is utilized, resulting in USD equivalent 396 (2011: 518) not being utilized.
The table below summarises the maturity profile of the Company’s financial liabilities based on
contractual undiscounted payments. The total amounts in the table differ from the carrying
amounts as stated in Note 17 as the below table includes both notional amounts and interest

39
while the carrying amounts are based on amongst others notional amounts, fair value
adjustments and unamortized fees.
Less than
1 year 1-3
years 3-5
years
More than
5 years Total
At 31 December 2012 Bank loans and bonds 4,210 8,184 14,366 8,989 35,750 Equipment financing 228 264 140 48 681 Loans from others 134 147 65 58 404 Derivatives over non-controlling interest 297 - 330 - 627 Derivative financial instruments - Gross cash inflows (358) (717) (2,718) (1,731) (5,523) - Gross cash outflows 451 787 2,623 1,702 5,562 Trade and other payables and dividend payables 5,859 - - - 5,859
10,821 8,665 14,806 9,066 43,360
Less than
1 year 1-3
years 3-5
years
More than
5 years Total
At 31 December 2011 Bank loans and bonds 3,558 6,859 7,022 18,772 36,211 Equipment financing 208 260 102 28 598 Loans from others 282 500 362 24 1,168 Derivatives over non-controlling interest − 297 − 330 627 Derivative financial instruments
- Gross cash inflows (539) (939) (792) (3,677) (5,947) ‘- Gross cash outflows 510 929 751 3,491 5,681 Trade and other payables 4,566 − − − 4,566
8,585 7,906 7,445 18,968 42,904
Capital management
The primary objective of the Company’s capital management is to ensure that it maintains at
least a BB/Ba3 credit rating with an aim to improve this and healthy capital ratios in order to
secure access to debt and capital markets at all times and maximise shareholder value. The
Company manages its capital structure and makes adjustments to it in light of changes in
economic conditions. To maintain or adjust the capital structure, the Company may adjust the
dividend payment to shareholders, return capital to shareholders or issue new shares.
No changes were made in the objectives, policies or processes for managing capital during the
years ended 31 December 2012 and 31 December 2011.
The Net debt to Adjusted EBITDA ratio is an important measure to assess the capital structure in
light of maintaining a strong credit rating. Net Indebtedness represents the nominal amount of
interest-bearing debt and guarantees given less cash and cash equivalents and current and non-
current bank deposits. Net Debt represents the amount of interest-bearing debt at amortized
costs and guarantees given less cash and cash equivalents and current and non-current bank
deposits adjusted for derivatives designated as hedges. Adjusted EBITDA is defined as earnings
before interest, tax, depreciation, amortization and impairment.
40
The Net debt to Adjusted EBITDA ratio relevant to OJSC VimpelCom, which holds and/or
guarantees a major part of the debt of the Company, per 31 December 2012 and 2011 was 2.4x
and 2.6x respectively. The required ratio is <3.5x (2011: <3.5x) for some of the debt. The ratio is
calculated based on consolidated financial statements of OJSC VimpelCom prepared under
IFRS. In case this ratio is breached OJSC VimpelCom will have an Event of Default.
Another major part of the debt of the Company is held and/or guaranteed by WIND
Telecommunicazioni S.p.A. (“Wind Italy”), to which the Net debt to Adjusted EBITDA ratio of
4.44x (2011:4.48x) is relevant. The required ratio is 4.95x (2011:< 4.8x). The ratio is calculated
based on consolidated financial statements of Wind Italy prepared under IFRS. In case this ratio
is breached Wind Italy will have an Event of Default.
Collateral The Company provides security for some lenders of the funds which is described for individual loans in Note 27.

41
6 Business combinations and other significant transactions
There were no significant business combinations during 2012. Other significant transactions in
2012 are discussed below.
Other transactions in 2012
Joint venture arrangement with Megafon
On 7 December 2012, VimpelCom acquired 0.1% of the shares of Euroset to increase its
ownership interest from 49.9% to 50%. The shares were issued by Euroset to the Company
simultaneous with the acquisition of the other 50% of the shares of Euroset by Megafon. Euroset
is a strategic partner for VimpelCom and a significant distribution and customer service channel.
As a result of the transaction, VimpelCom and Megafon each own 50% of Euroset, effectively
establishing a joint venture with equal shareholder rights. The investment in Euroset is classified
as a joint venture under IAS 31 and, accordingly, is accounted for using the equity method. As a
result of obtaining joint control, the previously held 49.9% interest in Euroset was re-measured to
fair value, based on the price paid by Megafon, and reported as a USD 606 non-operating gain
in the accompanying income statement, which is comprised of the fair value of USD 623, offset
by the related accumulated translation difference of USD 17. The overall impact will be reversed
in 2013 following the application of IFRS 11, which becomes effective as of 1 January 2013
(Note 3 – Recent accounting pronouncements).
OTH spin-off
On 16 February 2012, VimpelCom completed the spin-off of certain OTH assets with a carrying
value of USD 650 to Weather Investment II S.a.r.l. (“Weather II”), the 72.65% shareholder of
Wind Telecom prior to completion of the acquisition of Wind Telecom. The principal spin-off
assets included OTH’s investments in ECMS and Mobinil in Egypt and Koryolink in North Korea.
The completion of this transaction fulfils VimpelCom’s spin-off obligations in connection with its
acquisition of Wind Telecom from Weather II. No gain or loss was recorded as a result of this
transaction.
GTEL-Mobile
On 23 April 2012, VimpelCom completed the sale of its entire indirect 49.9% stake in GTEL Mobile to GTEL Transmit and Infrastructure Service One Member Company Limited, or “GTEL Transmit,” a related party of our former Vietnamese local partner, Global Telecommunications Corporation, or “GTEL,” for cash consideration of USD 45 resulting in an immaterial loss on sale. VimpelCom has no further obligations or liabilities to GTEL or GTEL Mobile as a result of the completion of the sale.
Sotelco
VimpelCom intends to dispose its entire indirect 90.0% stake in Sotelco Ltd. (“Sotelco”), its Cambodian operator. As of 31 December 2012, sale negotiations with a potential buyer were in progress. Assets and liabilities of Sotelco qualify as a disposal group under IFRS 5 Non-current assets held for sale and discontinued operations and therefore are reclassified in the statement

42
of financial position to ‘Assets classified as held for sale’ and ‘Liabilities associated with assets held for sale’, respectively. As of 31 December 2012 Sotelco’s (100%) carrying values are as follows: Property and equipment 23 Intangible assets 20 Other non-current assets 15 Other current assets 6 Non-current liabilities 17 Current liabilities 20 In addition to Sotelco, additional assets qualifying as a disposal group of USD 13 are also included in ‘Assets classified as held for sale’.
Wind Telecom acquisition in 2011
On 15 April 2011, VimpelCom successfully completed the acquisition of 100% shares of Wind Telecom (the “Transaction”). As a result of the Transaction, VimpelCom owns, through Wind Telecom, 51.9% of Orascom Telecom and 100% of Wind Italy.

43
7 Segment information
Management analyzes operating segment information on a geographical basis because of
different economic environments and stages of development in geographical areas, which
require different investment and marketing strategies. Management does not analyze assets by
reportable segments separately. The segment data for acquired operations are reflected herein
from the date of their acquisitions.
The Management Board of VimpelCom utilizes multiple views of data to measure segment
performance. However, the dominant measurements are consistent with the Group’s
consolidated financial statements and, accordingly, are reported on the same basis herein.
Intersegment revenues are eliminated in consolidation and may be accounted for at amounts
different from sales to unaffiliated companies. The accounting policies of the segments are the
same as those of the Group.
Management evaluates the performance of its segments, primarily based on Adjusted EBITDA.

44
Financial information by reportable segment for 2012, 2011 and 2010 is presented in the following tables. Year ended 31 December 2012
Russia
Europe and North America
Asia and Africa Ukraine CIS Total
HQ, adjustments and eliminations Group
Revenue External customers 9,102 6,977 3,723 1,595 1,664 23,061 - 23,061 Inter-segment 88 5 - 81 91 265 (265) -
Total revenue 9,190 6,982 3,723 1,676 1,755 23,326 (265) 23,061
Adjusted EBITDA 3,878 2,658 1,738 859 813 9,946 (178) 9,768
Other disclosures
Capital expenditures 1,853 1,287 400 232 384 4,156 - 4,156
Year ended 31 December 2011
Russia
Europe and North America
Asia and Africa Ukraine CIS Total
HQ, adjustments and eliminations Group
Revenue External customers 8,982 5,584 2,684 1,548 1,470 20,268 (6) 20,262 Inter-segment 82 - 4 93 119 298 (298) -
Total revenue 9,064 5,584 2,688 1,641 1,589 20,566 (304) 20,262
Adjusted EBITDA 3,641 2,312 1,087 873 703 8,616 (318) 8,298
Other disclosures Capital expenditures 2,007 2,673 760 284 626 6,350 - 6,350
Year ended 31 December 2010
Russia
Europe and North America
Asia and Africa Ukraine CIS Total
HQ, adjustments and eliminations Group
Revenue External customers 8,115 - 22 1,109 1,267 10,513 9 10,522
Inter-segment 47 - - 76 87 210 (210) -
Total revenue 8,162 - 22 1,185 1,354 10,723 (201) 10,522
Adjusted EBITDA 3,775 - (35) 629 615 4,984 (78) 4,906
Other disclosures
Capital expenditures 1,558 - 40 189 437 2,224 - 2,224

45
The following table provides the reconciliation of consolidated Adjusted EBITDA to consolidated profit for the years ended 31 December:
2012 2011 2010
Adjusted EBITDA 9,768 8,298 4,906
Reconciliation adjustment - (42) (50)
Depreciation (2,926) (2,726) (1,403)
Amortization (2,080) (2,059) (610)
Impairment loss (386) (527) -
Loss on disposals of non-current assets (205) (90) (49)
Finance costs (2,029) (1,587) (536)
Finance income 154 120 69
Revaluation of previously held interest in Euroset 606 - -
Other non-operating losses/(gains) (75) (308) 35 Shares of loss/(profit) of associates and joint ventures accounted for using the equity method (9) (35) 90
Net foreign exchange (gain)/ loss 70 (190) (5)
Income tax expense (906) (585) (574)
Profit for the period 1,982 269 1,873
The following table provides the breakdown of net operating revenues from external customers by mobile and fixed line services for the years ended 31 December:
2012 2011 2010
Mobile 19,442 17,073 9,048
Fixed line 3,619 3,189 1,474
Total 23,061 20,262 10,522
These business activities include the following operations: mobile primarily includes providing wireless telecommunication services to the Company's subscribers and other operators, fixed line primarily includes all activities for providing wireline telecommunication services, broadband and consumer Internet. VimpelCom provides both mobile and fixed line services in Russia, Italy, Ukraine, CIS, Pakistan, Laos, Burundi and the Central African Republic. The Company’s management does not review total assets, total liabilities, depreciation, nor amortization per segment, and therefore this information has not been presented in these financial statements.
8 Other revenue Other revenue of USD 262 for of the year ended 31 December 2012 (2011: USD 167) includes the amounts received for the settlement of agreements reached between Wind Italy and certain vendors, together with the release of the universal service contribution.

46
9 Employee benefits Selling, general and administrative expenses include the following amounts of employee benefits for the years ended 31 December:
2012 2011 2010
Salaries and wages including bonus payments 1,725 1,614 634
Share based payments (Note 24) 12 15 3
Other employee benefits 32 40 29
Employee benefits 1,769 1,669 666
The following table sets forth the number of our employees at 31 December 2012, 2011 and 2010: As of 31 December
2012 2011 2010
Russia 24,400 31,471 30,059 Europe and North America 6,890 7,979 17 Asia and Africa 13,818 13,129 359 Ukraine 5,001 6,134 4,224 CIS 8,075 7,631 7,366
Total 58,184 66,344 42,025

47
10 Impairment
Carrying amount of goodwill and cash-generating units
Goodwill acquired through business combinations has been allocated to CGUs for impairment testing as follows:
CGU
2012 2011
Italy 5,301 5,189
Russia 4,590 4,334
Ukraine 3,460 3,462
Algeria 1,935 2,057
Pakistan 493 525
Kazakhstan 391 404
Kyrgyzstan 278 278
Uzbekistan 257 257
Armenia 141 150
Other 118 120
Total 16,964 16,776
There were no changes to the methodology of goodwill allocation to CGUs in 2012. There were
no material changes to Goodwill during the year ended 31 December 2012 other than foreign
currency translation differences.
The Company performed its annual goodwill impairment test as of 1 October. The Company
considers the relationship between market capitalization and its book value, among other
factors, when reviewing for indicators of impairment. As of the impairment test date the market
capitalization of the Group was not below the book value of its equity. As a result of reviewing all
relevant indicators, no additional impairment testing was performed at the respective year-ends.
The recoverable amounts of the CGUs, except for Algeria, have been determined based on a
value in use calculation using cash flow projections from business plans covering three years
and extrapolated for another two years approved by the Group senior management. The key
assumptions and outcome of the impairment test for is discussed separately below.
Key assumptions
The key assumptions and inputs used by the Company in undertaking the impairment test are
the discount rate, average revenue growth rate, terminal growth rate and average operating
margin. Operating margin is defined as a ration of operating income to revenue.
The discount rates used in the impairment test were initially determined in USD based on the
risk free rate for 20-year maturity bonds of the United States Treasury adjusted for a risk
premium to reflect both the increased risk of investing in equities and the systematic risk of the
specific operating company. The equity market risk premium used was 6.75% (2011: 5.0%) and
the systematic risk, beta, represents the median of the raw betas of the entities comparable in

48
size and geographic footprint with the ones of the Company (“Peer Group”). The debt risk
premium is the median of Standard&Poors long term credit rating of the Peer Group. The
weighted average cost of capital is determined based on forward-looking debt-to-equity ratios
representing the median historical five-year capital structure for each entity from the Peer Group.
The discount rate in functional currency is adjusted for the long-term inflation forecast of the
respective country in which the business operates.
The Company estimates revenue growth rates and operating income margin calculated based
on Adjusted EBITDA less Amortization, Depreciation and Impairment divided by Total Operating
Revenue for each reporting unit and each future year. The revenue growth rates vary based on
numerous factors, including size of market, GDP (Gross Domestic Product), foreign currency
projections, traffic growth, market share and others. Terminal growth rate is estimated based on
long-term inflation forecast.
The forecast of operating income margin is based on the budget of the following year and
assumes cost optimization initiatives which are part of ongoing operations, as well as, regulatory
and technological changes known to date, such as telecommunication license issues and price
regulation among others.
CGU 2012 2011
Discount rate (functional currency)
Italy 11.9% 11.0%
Russia 12.1% 15.0%
Ukraine 16.9% 16.8%
Algeria
n.a. n.a.
Pakistan 23.5% 21.6%
Kazakhstan 14.5% 14.9%
Kyrgyzstan 16.0% 21.4%
Uzbekistan 11.4% 12.0%
Armenia 14.0% 13.4%
Average revenue growth rate during forecasted period
Italy 1.0% 0.3%
Russia 4.9% 5.0%
Ukraine 4.1% 4.7%
Algeria
n.a. n.a
Pakistan 12.1% 9.0%
Kazakhstan 4.4% 6.1%
Kyrgyzstan 10.0% 10.8%
Uzbekistan 1.9% 9.6%
Armenia -0.8% 1.0% Terminal growth rate
Italy 1.0% 1.0%

49
Russia 4.4% 3.5%
Ukraine 5.0% 5.0%
Algeria
n.a. n.a.
Pakistan 8.0% 7.0%
Kazakhstan 3.0% 3.0%
Kyrgyzstan 3.0% 3.0%
Uzbekistan 2.0% 2.0%
Armenia 4.0% 4.0%
Average operating margin
Italy 19.5% 19.0%
Russia 25.5% 27.2%
Ukraine 35.7% 33.4%
Algeria n.a. n.a.
Pakistan 23.0% 17.6%
Kazakhstan 29.9% 27.9%
Kyrgyzstan 37.4% 37.8%
Uzbekistan 14.8% 14.2%
Armenia 7.5% 12.1%
Sensitivity to changes in assumptions
Other than as disclosed below, there is no reasonably possible change in any of the above key
assumptions, which would cause the carrying value of any CGU to exceed its recoverable
amount.
2012
The following table illustrates, for Italy and Ukraine, the headroom derived from the impairment
test using the assumptions disclosed above, and, for reasonably possible changes, the amount
by which each key assumption must change in isolation in order for the estimated recoverable
amount to equal its carrying value.
Headroom Increase of WACC by
Decrease in Average Revenue
Growth by
CGU
Italy 2,679 2.1 p.p. 0.7 p.p.
Ukraine 470 1.2 p.p
0.5 p.p.
There are no other reasonably possible assumption changes that could result in impairment.
2011
The following table illustrates, for Pakistan, Kyrgyzstan and Armenia, the headroom derived from
the impairment test using the assumptions disclosed above, and, for reasonably possible

50
changes, the amount by which each key assumption must change in isolation in order for the
estimated recoverable amount to equal its carrying value.
Headroom Increase of WACC by
Decrease in Average Revenue
Growth by
CGU
Italy 1,661 1.2 p.p. 0.4 p.p.
Ukraine 638 1.5 p.p. 0.7 p.p.
Pakistan 672 5.1 p.p. 1.7 p.p.
Kyrgyzstan 40 1.6 p.p. 0.7 p.p.
Armenia 44 1.0 p.p. 0.4 p.p.
There are no other reasonably possible assumption changes that could result in impairment.
Algeria business
FVLCS was chosen to assess the recoverability of the Algeria business, since, as more fully
discussed in Note 27, the Company is engaged in without prejudice settlement discussions with
the Algerian Government, including the exploration of a possible sale of an interest in OTA to an
Algerian state entity. Costs to sell are immaterial in the context of this valuation. Although the
settlement discussions are ongoing and the terms of any settlement are uncertain, the Company
determined that the valuation placed on the business by the Company and the Algerian
Government, pursuant to the settlement discussions, was the best available evidence of FVLCS.
This valuationexceeded the Algeria CGU's book value.
Impairment losses
2012
The results of the impairment test in 2012 indicated an impairment of goodwill and other assets
of CGUs belonging to the “Africa and Asia” operating segment in the amount of USD 21.
2011
The results of the impairment test in 2011 indicated an impairment in the Vietnam and Cambodia
CGUs, which are part of the “Africa and Asia” operating segment, as the value in use for these
CGUs was negative. As a result, for these CGUs, the Company recorded a goodwill impairment
of USD 126, an impairment of property and equipment of USD 225, an impairment of
telecommunication licenses of USD 128, and an impairment of other assets of USD 48.
GWMC Impairment (Investment in Associate)
GWMC is accounted for by the Group as an investment in associate in accordance with IAS 28.
The investment and loans to GWMC belong to the operating segment “Europe and North
America”.
Pursuant to its annual business plan cycle, in the fourth quarter, management reassessed the
long term business plan of GWMC. Subsequently, an impairment test was deemed necessary,
given the change in GWMCs business plan resulting from the reassessment.

51
The recoverable amount for GWMC was determined based on a value in use calculation using cash flow projections covering 10 years. A 10 year period was deemed appropriate since the business will be in a start-up phase for several years, while it purchases and implements the additional spectrum necessary to accommodate current and future handset technologies. Based on the impairment test, the recoverable amount was lower than the book value of the investment in GWMC (Note 12). The resulting impairment charge amounted to USD 344. In determining the recoverable amount for the investment in GWMC, a discount rate of 11.4% was used.

52
11 Other non-operating losses/(gains)
Other non-operating losses/(gains) consisted of the following for the years ended 31 December:
2012 2011 2010
Change in fair value of derivatives over non-controlling interests (see Note 17) 9 (2) (38)
Change in fair value of embedded derivatives (see Note 17) (31) 249 -
Reclassification to profit or loss of exchange differences on translation of foreign operations for equity interest in acquiree in business combination achieved in stages - 43 -
Remeasurement of previously held investment in GTEL-Mobile - 40 -
Tax provisions other than for income tax (Note 25) 70 - -
Other gains/losses 27 (22) 3
75 308 (35)
Refer to Note 17 for further details on the changes in the fair value of embedded derivatives
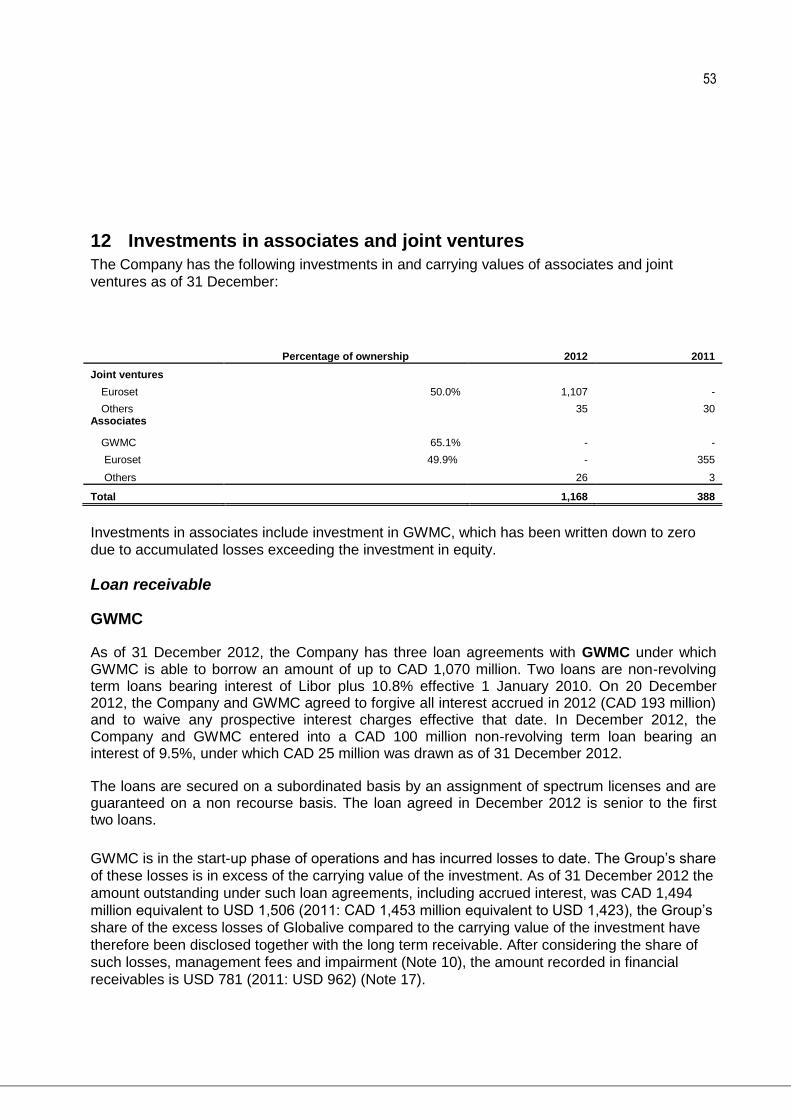
53
12 Investments in associates and joint ventures
The Company has the following investments in and carrying values of associates and joint
ventures as of 31 December:
Percentage of ownership 2012 2011
Joint ventures
Euroset 50.0% 1,107 -
Others 35 30 Associates
GWMC 65.1% - -
Euroset 49.9% - 355
Others 26 3
Total 1,168 388
Investments in associates include investment in GWMC, which has been written down to zero
due to accumulated losses exceeding the investment in equity.
Loan receivable
GWMC
As of 31 December 2012, the Company has three loan agreements with GWMC under which GWMC is able to borrow an amount of up to CAD 1,070 million. Two loans are non-revolving term loans bearing interest of Libor plus 10.8% effective 1 January 2010. On 20 December 2012, the Company and GWMC agreed to forgive all interest accrued in 2012 (CAD 193 million) and to waive any prospective interest charges effective that date. In December 2012, the Company and GWMC entered into a CAD 100 million non-revolving term loan bearing an interest of 9.5%, under which CAD 25 million was drawn as of 31 December 2012.
The loans are secured on a subordinated basis by an assignment of spectrum licenses and are guaranteed on a non recourse basis. The loan agreed in December 2012 is senior to the first two loans.
GWMC is in the start-up phase of operations and has incurred losses to date. The Group’s share
of these losses is in excess of the carrying value of the investment. As of 31 December 2012 the
amount outstanding under such loan agreements, including accrued interest, was CAD 1,494
million equivalent to USD 1,506 (2011: CAD 1,453 million equivalent to USD 1,423), the Group’s
share of the excess losses of Globalive compared to the carrying value of the investment have
therefore been disclosed together with the long term receivable. After considering the share of
such losses, management fees and impairment (Note 10), the amount recorded in financial
receivables is USD 781 (2011: USD 962) (Note 17).

54
On 7 December 2012, VimpelCom acquired 0.1% of the shares of Euroset to increase its
ownership interest from 49.9% to 50% (Note 6). The shares were issued by Euroset to the
Company simultaneous with the acquisition of the other 50% of the shares of Euroset by
Megafon. As a result of the transaction, the investment in Euroset is classified as a joint venture
under IAS 31 and, accordingly, is accounted for using the equity method as of 31 December
2012.
The following table includes summarized consolidated financial information of the investments in the most significant associates and joint venture, being Euroset and GWMC which are held by the Company as of and for the years:
31-Dec-12 31-Dec-11 31-Dec-10
Share of the associate’s statement of financial position: Current assets 549 405 273 Non-current assets 838 674 319 Current liabilities 678 614 514 Non-current liabilities 1,083 1,017 42
Equity Goodwill from acquisition 1,043 448 500 Losses allocated to loans receivable 438 459 -
Carrying amount of the investments 1,107 355 536
2012 2011 2010 Share of the associate’s revenue and profit: Revenue 1,517 1,212 1,006 Losses/ (Profits) for the year 146 103 (90) Elimination of intercompany transactions (132) (79) - (Profits)/ Losses of other associates (5) 11 - Shares of loss/(profit) of associates reported 9 35 (90)
Losses allocated to loans receivable include the proportionate share of losses of GWMC in excess of initial investment. The accumulated amount of these losses as of 31 December 2012 includes the amounts accumulated before acquisition of Wind Telecom on 15 April 2011.

55
13 Income taxes Income tax expense consisted of the following for the years ended 31 December: Current tax 2012 2011
2010
Current year 1,099 876 765
Adjustments of previous year (67) 34 0
1,032 910 765
Deferred tax
Origination / (reversal) of temporary difference (346) (548) (214)
Changes in tax rates (8) 7
Current year tax losses unrecognized 319 86 23
Recognition and utilization of previously unrecognized tax loss/ tax credit (21) (21)
-
Expiration of tax losses 11 14 -
Non recognized tax losses that were recognized in previous year 12 -
-
Write off / (reversal of write off) of deferred tax asset temporary differences (155) 142
-
Adjustments of previous years 5 (20) -
Unrecognized other carry forwards 57 36 -
Other deferred tax effects - (21) -
(126) (325) (191)
Income tax expense 906 585 574

56
In the table below, we show the reconciliation between the statutory tax rate in the Netherlands and effective corporate income tax rates for the group, together with the corresponding amounts.
Reconciliation between statutory and effective income tax:
Year ended 31 December
2012 %
Year ended 31 December
2011 %
Year ended 31 December
2010 %
Profit before taxes 2,888 854 2,447 Income tax expense computed on profit before taxes at statutory tax rate 722 25.0% 213 25.0% 612 25.0%
Difference due to the effects of:
Different tax rates in different jurisdictions (198) (6.8)% (99) (11.6)% (123) (5.0)% Non-deductible expenses 242 8.4% 177 20.7% 27 1.1% Non-taxable income (197) (6.8)% (42) (4.9)% 0 0.0% Prior year adjustments (62) (2.1)% 14 1.6% 0 0.0% Change in recognition of deferred tax assets 224 7.7% 257 30.1% 23 0.9% Withholding taxes 97 3.4% 63 7.4% 84 3.4% Tax claims 85 2.9% (4) (0.5)% (12) (0.5)% Change in Income tax rate (8) (0.3)% 7 0.8% (66) (2.7)% Group restructuring (Golden Telecom) - - - - 47 1.9% Other 1 0.0% (1) (0.1)% (18) (0.7)%
Income tax for the period (income) / charge and effective tax rate 906 31.4% 585 68.5% 574 23.5%
The effective tax rate amounts to 31.4% in 2012 (2011: 68.5% and 2010: 23.5%). The effective tax rate in 2012 decreased compared to previous year due to a decrease of the nominal tax rate in the Ukraine. The decrease of the tax rate is primarily due to increase of non taxable income reported in 2012 (-6.8%). A significant part relates to the fair value gain on Euroset that is non taxable in Russia (-4.8%). The non-deductible expenses (8.4%) have an increasing effect on the effective tax rate. A significant part of this increase relates to subnational income taxes that use a different calculation basis resulting in non-deductible expenses having a tax effect of 2,7% (USD 78). The effective tax rate increased by 7.7% (USD 224) due to a change in the profitability of the countries where VimpelCom operates. The impact is due to the effect of expiration of tax loss carry forwards (0.3% or USD 10), tax losses not recognized (6.0% or USD 175), utilization of previously non recognized losses (-0.6% or USD -20), carry forward of temporary non deductible interest for which no deferred tax asset not recognized (1.9% or USD 56), other deferred tax effects (0.1% or USD 3). The effect of withholding taxes on undistributed earnings resulted in tax charge of 3.4%. The effect of prior year adjustments of -2.1% (USD -62) mainly relates to prior year adjustments of income tax in Italy (USD 24 tax benefit due to change of local income tax law) and Russia due to filing of amended tax returns (USD 14 tax benefit).
The amount of current and deferred taxes reported outside the profit and loss account amounts
to USD (10) (USD 6 current tax; USD (17) deferred tax).

57
Deferred taxes Deferred corporate income tax assets in respect of deductible temporary differences, for tax losses and other tax credits carried forward (mainly carry forward of non-deductible interest) are recognized to the extent that the realization of the related tax benefit through future taxable profits is probable. Deferred corporate income tax assets in respect of deductible temporary differences are recognized to the extent that the realization of the related tax benefit through future taxable profit is probable. Management’s projections support the assumption that it is probable that the results of future operations will generate sufficient taxable income to utilize these deferred tax assets. Deferred tax assets (and liabilities) are measured based on the expected manner of recovery or settlement and the tax rate expected to apply when the underlying asset (liability) is recovered based on rates that are enacted or substantively enacted at the reporting date. As per 31 December 2012 and 31 December 2011, the company reported the following deferred tax assets and liabilities on the balance sheet.
31 December
2012
31 December
2011
31 December
2010
Deferred tax assets as of 31 December 312 386 0
Deferred tax liabilities as of 31 December (1,416) (1,624) (590)
The following table shows the movements of the deferred tax assets and liabilities in 2012:
Opening balance
Movements in Deferred taxes
Tax rate
chang es
Ending balance
P/L
moveme nt
Acquisition/ Divestment
Other compre hensive
income & Other
Currenc y
translati on
Property, plant and equipment, net (645) (26) (1) - (11) - (683)
Other intangible assets, net (1,400) 119 - (2) 13 15 (1,255)
Trade accounts receivable 169 15 - - 3 - 187
Other assets 158 (127) - 28 - - 59
Provisions 38 28 - - 1 - 67
Long-term debt 201 (9) - (17) - - 175
Accounts payable 125 22 - 4 4 (1) 154
Other liabilities 132 (53) - - 1 (1) 79
Other movements and temporary differences (6) 39 - - (5) (2) 26
Deferred subnational income taxes and other (96) (32) - 5 (2) 1 (124)
Withholding tax on undistributed earnings (59) (59) - (2) - - (120)
(1,383) (83) (1) 16 4 12 (1,435)
Tax losses and other carry forwards 1,289 400 1 1 (12) (4) 1,675
Non recognized deferred tax assets on losses and credits
(984) (348) -
(1,332)

58
Non recognized deferred tax assets on temporary differences
(160) 148 -
(12)
Net deferred tax position (1,238) 117 - 17 -8 8 (1,104)
The following table shows the movements of the deferred tax assets and liabilities in 2011:
Opening
balance
Movements in Deferred taxes
Tax rate
changes
Ending balance
P/L
movement
Acquisition/Divestment
Affecting other comprehensive income
Currency
translation
Property, plant and equipment, net (397) (6) (282) - 40 - (645) Licenses (61) 87 (19) - 14 1 22 Other intangible assets, net (243) 360 (1,639) - 98 2 (1,422) Trade accounts receivable 7 17 157 - (12) - 169 Other assets 2 64 139 (32) (15) - 158 Provisions 1 (15) 55 - (3) - 38 Long-term debt - (63) 274 - (10) - 201 Accounts payable 51 65 17 - (7) (1) 125 Other liabilities 92 (17) 54 7 (3) (1) 132 Other movements and temporary differences - 10 (18) - 2 - (6) Deferred subnational income taxes and other (6) 17 (124) - 17 - (96) Withholding tax on undistributed earnings (50) (9) - - - - (59)
(604) 510 (1,386) (25) 121 1 (1,383) Tax losses and other carry forwards 168 65 1,148 (1) (83) (8) 1,289 Non recognized deferred tax assets on losses and credits (156) (102) (790) 4 60 - (984) Non recognized deferred tax assets on temporary differences 2 (142) (3) - (17) - (160)
Net deferred tax position (590) 331 (1,031) (22) 81 (7) (1,238)
VimpelCom recognizes a deferred tax asset for the carry forward of unused tax losses and other carry forwards to the extent that it is probable that the deferred tax asset will be utilized. The amount and expire date of deductible temporary differences, unused tax losses and other carry forwards for which no deferred tax asset is recognized are separately disclosed (IAS 12.81.e):
Tax losses year of expiration
recognized losses 2012
recognized DTA 2012
non recognized losses 2012
non recognized DTA 2012
0 - 5 years (299) 75 (1,246) 308
6 - 10 years (7) 1 (787) 175
> 10 years - - - -
Indefinitely (679) 267 (2,074) 526
total (985) 343 (4,107) 1,009
Other carry forwards year of expiration
recognized credits 2012
recognized DTA 2012
non recognized credits 2012
non recognized DTA 2012
0 - 5 years - - - -
6 - 10 years - - - -
> 10 years - - - -

59
Indefinitely - - (1,196) 323
Total - - (1,196) 323
These other carry forwards mainly relate to non deductible interest in Italy that is carried forward to future years. As of 31 December 2012, the amount of deductible temporary differences for which no deferred tax asset is recognized amounts to USD 62 (non recognized deferred tax asset of USD 12). The following tables show the recognized and not recognized deferred income tax assets as per December 2011 for comparison purposes:
Tax losses year of expiration
recognized losses 2011
recognized DTA 2011
non recognized losses 2011
non recognized DTA 2011
0 - 5 years - - 263 67
6 - 10 years - - 572 125
> 10 years - - - -
Indefinitely 774 305 2,180 554
total 774 305 3,015 746
Other carry forwards year of expiration
recognized credits 2011
recognized DTA 2011
non recognized credits 2011
non recognized DTA 2011
0 - 5 years - - - -
6 - 10 years - - - -
> 10 years - - - -
Indefinitely - - 886 239
Total - - 886 239
VimpelCom is reporting the tax effect of the existence of undistributed profits that will be
distributed in the foreseeable future. In 2012, the company reported a deferred tax liability of
USD 120 that is reflecting the tax effect of the undistributed profits that will be distributed in the
foreseeable future. At 31 December 2012 undistributed earnings of VimpelCom’s foreign
subsidiaries (outside the Netherlands) which are indefinitely invested and that will not be
distributed in the foreseeable future, amounted to approximately USD 7.693 (2011: USD 7,464;
2010: USD 10,561). Accordingly, no deferred tax liability is recognized for this amount of
undistributed profits.

60
14 Earnings per share Earnings per common share for all periods presented has been determined in accordance with IAS 33, Earnings per Share, by dividing profit available to common shareholders by the weighted average number of common shares outstanding during the period.
The following table sets forth the computation of basic and diluted earnings per share:
Year ended 31 December
2012 2011 2010
(In millions of US dollars, except share amounts)
Numerator:
Profit for the period attributable to VimpelCom 2,145 543 1,806
Denominator:
Denominator for basic earnings per share – weighted average common shares outstanding (millions) 1,618 1,524 1,207
Effect of dilutive securities: Employee stock options (millions) 1 - -
Denominator for diluted earnings per share – assumed conversions (millions) 1,619 1,524 1,207
Basic earnings per share $1.33 $0.36 $1.50
Diluted earnings per share $1.32 $0.36 $1.50
Employee stock options (representing 3,358,895 shares) that are out of the money as of 31 December 2012, but that could potentially dilute basic EPS in the future, were excluded in the computation of diluted EPS because inclusion of the options would have been antidilutive for the periods presented.

61
15 Property and equipment Property and equipment, at cost, consisted of the following:
Telecommunications
equipment
Land, buildings and constructions
Office and measuring equipment
Other Equipment
Equipment not installed and assets
under construction
Total
Cost At 1 January 2011 9,567 622 948 506 1,266 12,909 Additions 962 (2) 31 64 3,203 4,258 Acquisition of a subsidiary (Note 6) 6,275 126 38 181 847 7,467 Disposals (466) (7) (43) (29) 79 (466) Transfer 2,189 27 125 47 (2,388) - Translation adjustment (882) (16) (49) (4) (169) (1,120)
At 31 December 2011 17,645 750 1,050 765 2,838 23,048
Acquisition of a subsidiary 20 - - - - 20 Divestments of a subsidiary (142) (29) (14) (24) (19) (228) Reclassification to AHFS (113) (3) (5) (15) (2) (138) Additions 1,271 53 57 26 2,115 3,522 Disposals (920) (45) (69) (94) (83) (1,211) Transfer 2,108 25 291 (111) (2,313) - Translation adjustment 367 20 66 26 74 553
At 31 December 2012 20,236 771 1,376 573 2,610 25,566
Depreciation and impairment At 1 January 2011 (4,720) (124) (520) (246) - (5,610)
Depreciation charge for the year (2,370) (56) (164) (137) - (2,727) Disposals 242 5 38 19 - 304 Impairment (Note 10) (136) (26) (10) (24) (28) (224) Translation adjustment 326 4 31 13 - 374
At 31 December 2011 (6,658) (197) (625) (375) (28) (7,883) Divestments of a subsidiary 109 33 11 20 19 192 Reclassification to AHFS 103 3 3 12 - 121 Depreciation charge for the year (2,601) (48) (226) (51) - (2,926) Disposals 846 8 19 41 - 914 Impairment (Note 10) (30) - (2) - (17) (49) Translation adjustment (257) (1) (11) (4) 4 (269)
At 31 December 2012 (8,488) (202) (831) (357) (22) (9,900)
Net book value At 31 December 2011 10,987 553 425 390 2,810 15,165
At 31 December 2012 11,748 569 545 216 2,588 15,666
None of the assets were used as collateral and no assets have restrictions on title. The Company is not party to significant finance leases.

62
Capitalized borrowing costs
During 2012 VimpelCom capitalized interest in the cost of property and equipment in the amount of USD 191 (2011: USD 62). During 2012 the interest rates applicable to capitalized borrowing costs is ranging from 4.6% to 13.1% (2011: 8.0%).

63
16 Intangible assets The total gross carrying value and accumulated amortization of VimpelCom’s intangible assets consisted of the following:
Telecommunications licenses,
frequencies and
permissions
Goodwill Software Brands and
trademarks
Customer relationships
Telephone line
capacity
Other intangible
assets
Total
Cost At 1 January 2011 1,600 6,722 1,148 193 1,430 159 261 11,513 Additions 331 - 137 - 1 10 1,891 2,370 Acquisition of a subsidiaries (Note 6) 3,330 11,331 9 2,308 2,937 1 1,390 21,306 Disposals (80) - (33) - - (1) (28) (142) Transfer 2 - 3 - (14) (10) 12 (7) Other 10 - 15 (4) (25) (14) 47 29 Translation adjustment (277) (1,151) (43) (174) (242) (2) (261) (2,150)
At 31 December 2011 4,916 16,902 1,236 2,323 4,087 143 3,312 32,919
Acquisition of a subsidiary 9 17 1 - - - - 27 Divestments of a subsidiaries (146) (126) (7) - - (1) - (280) Reclassification to AHFS (43) - (5) - - - - (48) Additions 67 - 199 3 - 1 492 762 Disposals (31) - (27) - - (13) (85) (156) Translation adjustment 82 180 76 51 169 48 108 714
At 31 December 2012 4,854 16,973 1,473 2,377 4,256 178 3,827 33,938
Amortization and
impairment At 1 January 2011 (933) - (726) (19) (346) (56) (216) (2,296)
Amortization charge for the year (387) - (183) (118) (1,083) (43) (246) (2,060) Disposals 71 - 30 5 - - 25 131 Impairment (Note 10) (128) (126) (4) - - - - (258) Other (1) - (9) 2 11 8 (7) 4 Translation adjustment 7 - 35 7 83 3 26 161
At 31 December, 2011 (1,371) (126) (857) (123) (1,335) (88) (418) (4,318)
Divestments of a subsidiary 144 126 6 - - - - 276 Reclassification to AHFS 20 - 2 - - - - 22 Amortization charge for the year (406) - (155) (132) (983) (18) (386) (2,080) Disposals 2 - 80 1 - 3 30 116 Impairment (Note 10) - (9) - - - - - (9) Translation adjustment (11) - (97) (21) (165) (27) (59) (380)
At 31 December, 2012 (1,622) (9) (1,021) (275) (2,483) (130) (833) (6,373)
Net book value At 1 January 2011 667 6,722 422 174 1,084 103 45 9,217
At 31 December 2011 3,545 16,776 379 2,200 2,752 55 2,894 28,601 At 31 December 2012 3,232 16,964 452 2,102 1,773 48 2,994 27,565
As of 31 December 2012 other intangible assets primarily include LTE telecommunication licenses in Italy and Russia, for which the business operations have not yet commenced in the amount of USD 1,660 (2011: USD 1,513 in Italy and Uzbekistan), industrial patents and intellectual property rights with the book value of USD 394 (2011: 364). None of the assets were used as collateral and no assets have restrictions on title.

64
During 2012 VimpelCom capitalized interest in the cost of intangible assets in the amount of USD 150 (2011: nil). During 2012 the interest rates applicable to capitalized borrowing costs is ranging from 4.6% to 13.1%.
17 Financial assets and liabilities
Financial assets
The Company has the following financial assets as of 31 December:
2012 2011
Financial instruments at fair value through profit or loss
Derivatives not designated as hedges
Cross-currency and Interest rate exchange contracts 58 -
Foreign exchange contracts 4 4
Embedded derivatives on senior secured notes 77 41
Derivatives over non-controlling interest 81 73
Derivatives designated as fair value hedges
Interest rate exchange contracts - 161
Financial instruments at fair value
Derivatives designated as cash flow hedges
Cross-currency and Interest rate exchange contracts 110 257
Total financial Instruments at fair value 330 536
Loans granted, deposits and other financial assets at amortized cost
Loans granted to GWMC (Note 12) 781 962
Short term deposits 66 176
Interest receivable 8 154
Other investment 62 43
Other loans granted 114 10
Total loans granted, deposits and other financial assets 1,031 1,345
Total other financial assets 1,361 1,881
Total current 270 345
Total non-current 1,091 1,536

65
Financial liabilities The Company has the following financial liabilities as of 31 December:
2012 2011
Financial instruments at fair value through profit or loss
Bank loans and bonds, equipment financing at fair value
Bank loans and bonds, principle - 2,116
Equipment financing, principle - 94
Fair value adjustment to bank loans and bonds, principle - 184
Interest accrued related to financial liabilities at fair value - 75
Discounts, unamortized fees related to financial liabilities at fair value - (33)
Derivatives not designated as hedges
Derivatives over non-controlling interest 442 391
Foreign exchange contracts 12 -
Financial instruments at fair value
Derivatives designated as cash flow hedges
Foreign exchange contracts 20 2
Cross-currency and Interest rate exchange contracts 36 -
Interest rate exchange contracts 181 143
Total financial Instruments at fair value 691 2,972
Other financial liabilities at amortised cost
Bank loans and bonds
Bank loans and bonds, principle 25,643 23,360
Unamortised fair value adjustment under acquisition method of accounting 794 910
Interest accrued 526 391
Discounts, unamortized fees 73 (69)
Equipment financing 591 341
Loans from others
Loans from others, principle 754 917
Interest accrued 9 20
Total other financial liabilities at amortised cost 28,390 25,870
Total other financial liabilities 29,081 28,842
Total current 3,388 3,118
Total non-current 25,693 25,724
The unamortized fair value adjustment under the acquisition method of accounting relates to the
fair value remeasurement of listed debt acquired in the business combination with Wind Telecom
(Note 6). This adjustment will be amortized on a straight-line basis over six years by reducing
interest expenses.
66
Description of derivative financial instruments
VimpelCom uses derivative instruments, including swaps, forward contracts and options to
manage certain foreign currency and interest rate exposures. The Company views derivative
instruments as risk management tools and does not use them for trading or speculative
purposes. The Company has designated the majority of its derivative contracts, which mainly
relate to hedging the interest and foreign exchange risk of external debt, as formal hedges and
applies hedge accounting on these derivative contracts.
All derivatives are accounted for on a fair value basis and the changes in fair value are recorded
in profit or loss, except for put options over non-controlling interests not providing a present
ownership interest in the outstanding shares, and derivative instruments which are accounted for
using cash flow hedge accounting. Cash flows from derivative instruments are reported in the
statement of cash flows in the same line where the underlying cash flows are recorded.
Foreign exchange contracts As from August 2012, OJSC VimpelCom entered into short-term forward and zero-cost collar
agreements with several banks for a total notional amount of USD 1,336 in order to protect cash
flows of its short-term financial and non-financial obligations denominated in USD from adverse
USD-RUB movement. As of 31 December 2012 the notional amount outstanding of the
derivative contracts (only zero-cost collars) was USD 1,105 with an average cap rate of 34.52
and an average floor rate of 31.08.
Derivatives over non-controlling interest – Put and call options
Limnotex
On 24 August 2011 the Company entered into put and call agreements representing up to 28.5% of the shares in its indirect subsidiary Limnotex, which owns 100% of KaR-Tel, the Kazakhstan operator. Based on the agreement, Crowell, the noncontrolling shareholder of Limnotex, holds two put options for Limnotex shares: the first put option for 13.5% is exercisable during 2013 at a fixed price of USD 297 and the second put option for 15% is exercisable during 2017 at a fixed price of USD 330. The put option granted to Crowell give rise to a financial liability which is initially measured at the present value of the redemption amount. Therefore the Company accounted for a liability regarding these arrangements of USD 442 and USD 391 as of 31 December 2012 and 2011, respectively, representing the fair value of the underlying redemption amount. The change in fair value of the put option is recorded in equity since VimpelCom does not have present access to benefits over the shares held by Crowell. The outcome of the fair value measurement is dependent on the discount rate at the time of measurement – in case the rate increases by 1 pp the liability will decrease for USD 10, in case the rate decreases for 1 pp the liability will increase for USD 11. The discount rate used at 31 December 2012 was 13.0% (2011: 13.0%). The call options allow the Company to acquire the total of 28.5% of Limnotex shares held by Crowell at a multiple of Adjusted EBITDA. Both options are exercisable during the period between April 2012 and May 2018. The call option does not give the Company present ownership rights. Therefore the option is accounted for as a financial asset at fair value through profit or loss and accounted for as an asset of USD 81 and USD 73 as of 31 December 2012 and 2011, respectively. The fair value of the options was determined based on the expected
67
exercise period in May 2018 and an estimated exercise price of USD 1,453. The outcome is influenced by changes in exercise period and exercise price, but variations in these variables are not expected to have a material impact on the results of operations.
Cross currency and interest rate exchange contracts
In 2009, Wind Acquisition Finance S.A. (“WAF”) has entered into 10 Cross-Currency Interest Rate Swap agreements with several banks to reduce the volatility of cash flows on USD denominated debt in the amount of USD 2,000 and related interest from 13 July 2009 to 15 July 2017. Pursuant to these agreements, WAF pays a fixed EUR rate equal to on average 11.73% and receives a fixed USD rate of 11.75%.
In November 2010, WAF has entered into a further 11 Cross-Currency Interest Rate Swap agreements with several banks to reduce the volatility of cash flows on USD denominated debt in the amount of USD 1,300 and related interest from 26 November 2010 to 15 February 2018. Pursuant to these agreements, WAF pays a fixed EUR rate equal to on average 7.46% and receives a fixed USD rate of 7.25%.
In April 2012, WAF has entered into four Cross-Currency Interest Rate Swap agreements with several banks to reduce the volatility of cash flows on USD denominated debt in the amount of USD 400 and related interest from 13 April 2012 to 15 February 2018. Pursuant to these agreements, WAF pays a fixed EUR rate equal to on average 7.33% and receives a fixed USD rate of 7.25%.
The Company’s Pakistan subsidiary has entered into several Cross-Currency Interest Rate
Swap Agreements to reduce the volatility of cash flows on USD and EUR denominated debt with
current outstanding balances of USD 129 and EUR 17 (2011: USD 144 and EUR 51), and
related interest with maturities until 28 February 2014. Pursuant to these agreements, the
Company’s Pakistan subsidiary pays floating 6 months KIBOR rates plus a spread between
0.72% and 4.49%.
Interest rate exchange contracts
In November and December 2010, WIND Telecommunicazioni S.p.A. entered into Interest Rate Swap agreements to reduce the volatility of cash flows on interest payments for variable-rate debt. In September 2012, the majority of these Interest Rate Swaps were restructured for the upcoming 12-18 months and additionally two basis swaps have been added to the portfolio. This restructuring was done to benefit from the basis swap spread between EURIBOR 1 month and EURIBOR 6 month floating rates. Pursuant to these agreements, WIND Telecommunicazioni S.p.A. pays a fixed rate equal to on average 2.13% and receives EURIBOR 1 month floating rate on a notional amount of EUR 2,915 until 26 September 2013/26 March 2014 and pays a fixed rate equal to on average 2.47% and received EURIBOR 6 month floating rate on a notional amount of EUR 2,240 from 26 September 2013 until maturity (between 26 March 2014 and 26 September 2017).
In August and November 2012, the Company has unwound its interest rate swaps related to its USD 500 6.2546% notes due March 2017 and its interest rate swaps related to its USD 1,500

68
7.5043% notes due March 2022. As a result of the unwind, the Company will pay interest at the fixed rates of the previously mentioned notes. With the unwind, the Company has locked in the current low USD interest rates, resulting in a reduction of the effective interest rate on the notes due March 2017 of approximately 1.5% and on the notes due March 2022 of approximately 2.0%. As a result of the unwind, the Company has received a cash amount of USD 253, which is included within Interest Received in the Statement of Cash Flows, representing the approximate fair value of the derivatives when they were unwound.

69
Interest-bearing bank loans and bonds
The Company has the following principle amounts outstanding for interest-bearing loans and
bonds as of 31 December:
Lender Interest rate Maturity Currency 2012 2011
Senior Secured Notes 2018 7.3-7.4% 2018 EUR/USD 4,273 3,564
Eurobonds 6.5-9.1% 2013-2021 USD 3,901 3,901
Senior Facility Agreement 1m Euribor + 4.0-
4.5% 2016-2017 EUR 3,865 4,438
Senior Notes 2017 11.8% 2017 EUR/USD 3,649 3,617
Sberbank 8.8-9.3% 2013-2015 RUB 2,805 3,460
Ruble Bonds 7.4-9.3% 2013-2015 RUB 2,469 1,243
June Bonds 3m Libor + 4.0%;
6.3-7.5% 2014-2022 USD 2,200 2,200
PIK Proceeds Loan Agreement 12.3% 2017 EUR/USD 1,432 1,261
Bridge loan facility 3m Euribor + 7.5% 2012 EUR - 647
Other loans 1,049 1,145
Total bank loans and bonds 25,643 25,476
Less current portion (2,218) (2,304)
Long-term portion of bank loans and bonds 23,425 23,172
Loans from others
The Company has the following principle amounts outstanding for loans from other parties as of
31 December: Interest rate Maturity Currency 2012 2011
Debt to Italian Government (LTE license) Rendistato+1% 2016 EUR 427 524 Annuity loans 1.1-7.7% 2016 EUR 214 321 Other loans 113 72 Total loans from others 754 917
Less current portion (221) (221) Long-term loans from others 533 696

70
Hedging activities and derivatives
Derivatives under hedge accounting
The Company uses cross currency interest rate swaps, interest rate swaps, foreign exchange
forwards/swaps and zero cost collars to manage its transaction exposures and/or interest
exposure related to loans and borrowings. Most of these derivative contracts are either
designated as cash flow or fair value hedges and are entered into for periods up to the maturity
date of the hedged loans and borrowings.
The company uses the following types of hedge accounting:
Cash flow hedge accounting used to hedge the risk on future foreign currency cash flows and floating interest rate cash flows;
Fair value hedge accounting used to convert the USD fixed interest rate on financial liabilities into USD floating interest rate.
Below is a summary with further details on the Company’s hedges:
Risk being hedged
Nominal value Fair value assets
Fair value liabilities
At 31 December 2012 Cash flow hedge accounting Cross currency and interest rate exchange contracts
Currency 3,700 110 36
Interest rate exchange contracts Interest 3,846 181 Foreign exchange contracts Currency 980 20 No hedge accounting Cross currency and interest rate exchange contracts
Currency 152 58
Foreign exchange contracts Currency 170 4 12 The following table shows the periods in which the cash flows of the derivatives, to which cash flow hedge accounting applies, are expected to occur:
Less than
1 year 1-3
years 3-5
years
More than
5 years Total
At 31 December 2012
Cash flows (92) (71) (21) (1) (185)
Cash flow hedge reserve - - - - (313)
Derivatives not designated as hedging instruments
The Company uses foreign currency denominated borrowings and forward currency contracts to
manage its transaction exposures. These currency forward contracts are not designated as cash
flow, fair value or net investment hedges and are entered into for periods consistent with
currency transaction exposures, generally from one to six months. Although the derivatives have

71
not been designated in a hedge relationship, they act as a commercial hedge andoffsets the
underlying transaction when they occur.
Fair values
Set out below is a comparison by class of the carrying amounts and fair value of the Company’s financial instruments that are carried in the consolidated financial statements as of 31 December (based on future cash flows discounted at current market rates): Carrying value Fair value 2012 2011 2012 2011
Financial assets Financial instruments at fair value through profit or loss Derivatives not designated as hedges Cross-currency and Interest rate exchange contracts 58 - 58 - Foreign exchange contracts 4 4 4 4 Embedded derivatives on senior secured notes 77 41 77 41 Derivatives over non-controlling interest 81 73 81 73 Derivatives designated as fair value hedges Interest rate exchange contracts - 161 - 161 Financial instruments at fair value Derivatives designated as cash-flow hedges Cross-currency and Interest rate exchange contracts 110 257 110 257
Total financial Instruments at fair value, assets 330 536 330 536
Loans granted, deposits and other financial assets Long term-loans granted to GWMC 781 962 781 1,407 Bank deposits 67 178 67 178 Interest receivable 8 154 8 154 Other investment 62 43 62 43 Other loans granted 113 8 113 7
Total loans granted, deposits and other financial assets 1,031 1,345 1,031 1,789
Trade and other receivables 2,495 2,711 2,495 2,711 Cash and cash equivalents 4,949 2,325 4,949 2,325
Total financial assets 8,805 6,917 8,805 7,361
Financial instruments at fair value through profit or loss Bank loans and bonds at fair value - 2,436 - 1,923 Derivatives not designated as hedges Derivatives of non-controlling interest 442 391 442 391 Foreign exchange contracts 12 - 12 - Derivatives designated as hedges Foreign exchange contracts 20 2 20 2 Cross-currency and Interest rate exchange contracts 36
36
Interest rate exchange contracts 181 143 181 143
Total financial Instruments at fair value, liabilities 691 2,972 691 2,459

72
Total other financial liabilities at amortised cost 28,390 25,870 29.302 22,868
Trade and other payables 5,859 4,566 5,859 4,566
Total financial liabilities 34,940 33,408 35,852 29,893
The fair value of the financial assets and liabilities are included at the amount at which the
instrument could be exchanged in a current transaction between willing parties, other than in a
forced or liquidation sale. The fair values were estimated based on quoted market prices of our
bonds, derived from market prices or by using discounted cash flows under the agreement at the
rate applicable for the instruments with similar maturity and risk profile.
Fair value hierarchy
As of 31 December 2012 and 2011 the Company held financial instruments carried at fair value
on the statement of financial position in accordance with IAS 39.
The Company measures the fair value of derivatives except for options over non-controlling
interests on a recurring basis, using observable inputs (Level 2), such as LIBOR, EURIBOR and
swap curves, basis swap spreads and foreign exchange rates, floating rates for USD using
income approach with present value techniques.
The Company measures the fair value of options over non-controlling interests on a recurring
basis, using unobservable inputs (Level 3), such as projected redemption amounts, volatility, fair
value of underlying shares using income approach with present value techniques and Black-
Scholes model.
The following table provides the disclosure of fair value measurements separately for each major
class of assets and liabilities measured at fair value.
As of 31 December 2012
Description (Level 1) (Level 2) (Level 3)
Financial instruments at fair value through profit or loss
Derivatives not designated as hedges
Cross-currency and Interest rate exchange contracts - 58 -
Foreign exchange contracts - 4 -
Embedded derivatives on senior secured notes - - 77
Derivatives of non-controlling interest - - 81
Financial instruments at fair value
Derivatives designated as cash-flow hedges
Cross-currency and Interest rate exchange contracts - 110 -
Total financial Instruments at fair value, assets - 172 158
Financial instruments at fair value through profit or loss
Derivatives not designated as hedges

73
Derivatives over non-controlling interest
- - 442
Foreign exchange contracts
- 12 -
Derivatives designated as hedges Foreign exchange contracts - 20 -
Cross-currency and Interest rate exchange contracts
- 36 -
Interest rate exchange contracts - 181 -
Total financial Instruments at fair value, liabilities - 249 442
As of 31 December 2011
Description (Level 1) (Level 2) (Level 3)
Financial instruments at fair value through profit or loss
Derivatives not designated as hedges
Foreign exchange contracts - 4 -
Embedded derivatives on senior secured notes - - 41
Derivatives of non-controlling interest - - 73
Derivatives designated as fair value hedges
Interest rate exchange contracts 161
Financial instruments at fair value
Derivatives designated as cash flow hedges
Cross-currency and Interest rate exchange contracts - 257 -
Total financial Instruments at fair value, assets - 422 114
Financial instruments at fair value through profit or loss
Bank loans and bonds at fair value - 2,300 -
Equipment financing at fair value 94
Interest accrued related to financial liabilities at fair value 75
Discounts, unamortized fees related to financial liabilities at fair value (33)
Derivatives over non-controlling interest - - 391
Financial instruments at fair value
Derivatives designated as cash-flow hedges
Foreign exchange contracts - 2 -
Interest rate exchange contracts - 143 -
Total financial Instruments at fair value, liabilities - 2,580 391
The movement of financial instruments measured at the fair value using unobservable inputs (Level 3) is presented below:

74
As of 31 Dec. 2011
Currency transla tion adjust ment
Accrual of noncont rolling interest
Change in fair value reported in earnings
Change in fair value reported in equity
Acquired in business combinations Purchased
Sold/ Settled
As of 31 Dec. 2012
Financial instruments at fair value through profit or loss Derivatives not designated as hedges Embedded derivatives on senior secured notes 41 36 77 Derivatives of
non-controlling interest 73 8 81
Total financial Instruments at fair value, assets 114 44 158
Financial instruments at fair value through profit or loss Derivatives of non-controlling interest 391 51 442
Total financial Instruments at fair value, liabilities 391 51 442
As of 31 Dec. 2010
Currency transla tion adjust ment
Accrual of noncont rolling interest
Change in fair value reported in earnings
Change in fair value reported in equity
Acquired in business combinations Purchased
Sold/ Settled
As of 31 Dec. 2011
Financial instruments at fair value through profit or loss Derivatives not designated as hedges Embedded derivatives on senior secured notes - 19 (249) - 271 - - 41 Derivatives of non-controlling interest 14 - - (2) - - 69 (8) 73
Total financial Instruments at fair value, assets 14 19 - (251) - 271 69 (8) 114
Financial instruments at fair value through profit or loss Derivatives of non-controlling interest 690 - 18 (1) 53 - 375 (744) 391
Total financial Instruments at fair value, 690 - 18 (1) 53 - 375 (744) 391

75
liabilities

76
18 Current-other and non-current other financial assets and liabilities
Other non-current non-financial assets consisted of the following as of:
31 December 2012 31 December 2011
Deferred costs related to connection fees 4 80
Long-term input VAT 14 -
Other long-term assets - 12
18 92
Other current non-financial assets consisted of the following as of:
31 December 2012 31 December 2011
Advances to suppliers 368 362
Input value added tax 126 162
Prepaid taxes 739 743
Deferred costs related to connection fees 24 39
Others 33 14
1,290 1,320
Prepaid taxes include the OTA tax receivable discussed further under ‘Algerian tax claims’ (Note
27).
Other non-current non-financial liabilities consisted of the following as of:
31 December 2012 31 December 2011
Long-term deferred revenue 172 146
Provision for pensions and other post-employment benefits 109 99
Governmental grants 45 43
Payables for intangibles 60 109
Other non-current liabilities 24 45
410 442

77
Other current non-financial liabilities consisted of the following as of:
31 December 2012 31 December 2011
Customer advances, net of VAT 878 874
Customer deposits 96 97
Other taxes payable 664 549
Other payments to authorities 110 167
Due to employees 261 263
Short-term deferred revenue 89 80
Other liabilities 145 -
2,243 2,030
19 Inventories Inventory consisted of the following as of:
31 December 2012 31 December 2011
Telephone handsets and accessories for sale 128 145
SIM-Cards 16 19
Scratch cards 15 23
Info materials 4 4
Equipment for sale - 2
Other inventory 4 34
Total 167 227
Write-off of inventories for the years ended 31 December 2012, 2011 and 2010 were not
significant.

78
20 Trade and other receivables Trade and other receivables consisted of the following as of 31 December:
2012 2011
Trade accounts receivable, gross 3,147 3,445
Allowance for doubtful accounts (717) (780)
Trade accounts receivable, net 2,430 2,665
Roaming discounts 65 46
2,495 2,711
As of 31 December 2012, trade receivables with an initial value of USD 717 (2011: USD 780) were impaired and, thus, fully provided for. See below the movements in the provision for the impairment of receivables:
2012 2011
Balance as of 1 January 780 70
Acquisition of subsidiaries 7 693
Provision for bad debts 279 153
Accounts receivable written off (350) (75)
Foreign currency translation adjustment 1 (63)
Balance as of 31 December 717 780
As of 31 December, the aging analysis of trade receivables is as follows:
Total Neither past due nor
impaired
Past due but not impaired
< 30 days 30–120 days > 120 days
2012 2,430 1,246 466 217 501
2011 2,665 1,602 459 219 385

79
21 Cash and cash equivalents Cash and cash equivalents consisted of the following items as of 31 December:
2012 2011
Cash and cash equivalents at banks and on hand 3,248 1,694 Short-term deposits with an original maturity of less than 90 days
1,701 631
Total cash and cash equivalents 4,949 2,325
Cash at banks earns interest at floating rates based on bank deposit rates. Short-term deposits
are made for varying periods of between one day and three months, depending on the
immediate cash requirements of the Company, and earn interest at the respective short-term
deposit rates.
The cash balances as of 31 December 2012 in Algeria of USD 1,856 (2011: USD 886), Vietnam
of nil (2011: USD 140) and Uzbekistan of USD 116 (2011: USD 17) are restricted due to local
government or central bank regulations.
The Company is not able to repatriate the cash balance of certain entities in Luxembourg and Italy as of 31 December 2012 of USD 176 (2011: USD 506) due to existing covenants under borrowing facilities.

80
22 Issued capital and reserves As of 31 December 2012 the Company had 2,630,639,827 authorized common shares (2011: 2,630,639,827) with a nominal value of USD 0.001 per share, of which 1,628,199,135 shares were issued and outstanding (2011: 1,628,199,135). The holders of common shares are, subject to our bye-laws and Bermuda law, generally entitled to enjoy all the rights attaching to common shares. Each fully paid common share entitles its holder to (a) participate in shareholder meetings, (b) have one vote on all issues voted upon at a shareholder meeting, except for the purposes of cumulative voting for the election of the supervisory board, in which case each common share shall have the same number of votes as the total number of members to be elected to the supervisory board and all such votes may be cast for a single candidate or may be distributed between or among two or more candidates, (c) receive dividends approved by the supervisory board, (d) in the event of our liquidation, receive a pro rata share of our surplus assets; and (e) exercise any other rights of a common shareholder set forth in our bye-laws and Bermuda law.
As of 31 December 2012 and 2011, the Company also had 433,532,000 authorized convertible
voting preferred shares with a nominal value of USD 0.001 per share, of which 433,532,000
shares were issued and outstanding at 31 December 2012 and 2011. The redemption value of
convertible preference shares are reflected in other financial liabilities. Each convertible
preference share entitles its holder to one vote per convertible preferred share, voting together
with the common shares as a single class, except where cumulative voting applies when
electing directors. Convertible preferred shares do not have dividend rights. The holders of
convertible preferred shares, in the event of our winding-up or dissolution, are not entitled to any
payment or distribution in respect of our surplus assets. The holders of convertible preferred
shares are, subject to our bye-laws and Bermuda law, entitled to convert their convertible
preferred shares, at their option, at any time (a) after the date which is two years and six
calendar months after the date of issue of the relevant convertible preferred shares but before
the date which is five years after such date of issue and (b) during the period between the date
on which a mandatory offer for all common and preferred shares is announced and the final
business day such offer is open for acceptance, in each case, in whole or in part, into common
shares on the basis of one common share for one convertible preferred share. Upon conversion,
the converting shareholder must pay to VimpelCom a conversion premium per share equal to
the greater of (a) the closing mid market price of VimpelCom common ADSs on the NYSE on
the date of the conversion notice, and (b) the 30 day volume weighted average price on the
NYSE of VimpelCom common ADSs on the date of the conversion notice. Any convertible
preferred shares not redeemed five years after their issue will be immediately redeemed by the
company at a redemption price of USD 0.001 per share. In the accompanying financials and in these notes, shares held by the Company or its subsidiaries are treated as “treasury shares.” Treasury shares amount to 8,996,457 shares of common stock as of 31 December 2012 (2011: 10,078,608). Change in capital surplus during 2011 primarily relates to the issuance of shares for the Wind Telecom acquisition and stock based compensation movements.
Share options exercised in each respective year have been settled using the treasury shares of
the Company. The reduction in the treasury shares equity component is equal to the cost

81
incurred to acquire the shares, on a weighted average basis. Any excess between the cash
received from employees and reduction in treasury shares is recorded in capital surplus.
On 21 December 2012 Altimo Coöperatief issued notice to VimpelCom Ltd. pursuant to Section
4.3(d) of its bye-laws, stating its present intention to convert 128,532,000 convertible preferred
shares to common shares at the ratio of one convertible preferred share to one common share
and setting forth a conversion date of April 16, 2013.
Nature and purpose of reserves
Other capital reserves
The other capital reserve is used to recognise the value of equity-settled share-based payment transactions provided to employees, including key management personnel, as part of their remuneration (Refer to the Note 24) and to record the accumulated impact of derivatives designated as cash flow hedges (Note 17).
Foreign currency translation reserve
The foreign currency translation reserve is used to record exchange differences arising from the translation of the financial statements of foreign subsidiaries. It is also used to record the effect of hedging net investments in foreign operations.
82
23 Dividends paid and proposed
Pursuant to Bermuda law, VimpelCom is restricted from declaring or paying a dividend if there
are reasonable grounds for believing that (a) VimpelCom is, or would after the payment be,
unable to pay its liabilities as they become due, or (b) the realizable value of VimpelCom assets
would, as a result of the dividend, be less than the aggregate of VimpelCom liabilities.
In March 2012, the Supervisory Board of the Company declared the payment of a final dividend
of USD 0.35 per ADS in relation to its 2011 results.
On 17 December 2012, the Supervisory Board of VimpelCom Ltd authorized the payment of USD 0.45 per ADS in relation to the Company’s interim 2012 results and of, the in March 2012 already announced, final dividend of USD 0.35 per ADS in relation to its 2011 results. The dividend payable was accrued as of 31 December 2012 in the amount of USD 1,295, gross of withholding tax, and was paid in January 2013. On 6 September 2011, the Supervisory Board of VimpelCom Ltd declared the payment of an interim dividend of USD 0.45 per ADS in relation to the Company’s 2011 results. The total interim dividend payment in the approximate amount of USD 728 (gross of withholding tax where applicable) was paid in December 2011.
On 14 April 2011, the Supervisory Board of VimpelCom Ltd declared the payment of a dividend
of USD 0.15 per ADS in relation to the Company’s 2010 results. The total final dividend payment
was approximately USD 243 (gross of withholding tax where applicable). The dividend was paid
in June 2011.
On 7 March 2011, the Supervisory Board of VimpelCom Ltd declared the payment of a dividend
of USD 0.19 per ADS in relation to the Company’s interim 2010 results. The total interim
dividend payment was approximately USD 245 (gross of withholding tax, where applicable) and
paid in March 2011.

83
24 Share-based payments
Stock Option Plans
Background
The Company adopted stock option plans, the 2000 Stock Option Plan and the 2010 Stock
Option Plan, under which it grants options to certain of its, and its subsidiaries’, affiliates,
officers, employees, directors and consultants to acquire shares of common stock of VimpelCom
Ltd. The Group also grants stock options to certain employees in accordance with their
employement agreements.
Options are granted by VC ESOP N.V., indirect wholly owned subsidiary administrating the
Stock Option Plan.
The Group has no legal or constructive obligation to repurchase or settle the options in cash.
Options granted under both 2000 and 2010 Stock Option Plan are conditional on the grantee
completing a specific period of service (vesting period) and meeting specific pre-defined KPIs,
which vary depending on the grantee. The share options granted will not vest if the KPI is not
met.
The contractual option terms are different per grantee and very between 3 to 5 years.
Movements during the year
The following table illustrates the number, weighted average exercise prices and movements
during the year:
2012 2011 2010
Options outstanding , beginning of year
4,583,040
5,018,915 6,601,000
Weighted-average exercise price of options outstanding, USD per option
16.25
18.41 17.5
Weighted-average grant-date fair value at the beginning of the year, USD per option
2.22
1.78 1.4
The number of options granted
609,166 3,001,945 604,622
Weighted-average exercise price of options granted
13.60 16.33 14.75 Weighted-average grant-date fair value of options granted during the year, USD per option
0.40 0.16 8.6
The number of options exercised -
(130,000) (820,260)
The number of options forfeited/modified/converted to SARs
(2,571,911)
(3,307,820) (1,366,447)
Weighted-average exercise price of options forfeited, USD per option
16.51
19.83 17.7
The number of options outstanding, end of year
2,620,295
4,583,040 5,018,915
Weighted-average exercise price of options outstanding, USD per option
15.37 16.25 18.41
Weighted-average grant-date fair value at the end of the year, USD per option
1.77
2.22 1.78 Out of the options outstanding at the end of the year the number of options fully vested and exercisable
2,104,445
1,675,540 4,078,000

84
Weighted average remaining contractual life of the options outstanding, in years 1.52 1.76 1.28
Valuation
The fair value of the options has been estimated using a Black Scholes option pricing model.
The fair value of each grant is estimated on the date of grant (or date of modification). In
estimating the fair value of the options, the Company applied significant assumptions.
The expected term of the options was determined based on analysis of historical behaviour of
stock option participants. Expected volatility of VimpelCom’s shares was estimated based on the
historical volatility of the shares on the New York Stock Exchange over the period equal to the
expected life of the option granted and other factors.
The dividend yield was included into the model based on expected dividend payment. The risk
free rate was determined using the rate on the United States Government Bonds, having a
remaining term to maturity equal to the expected life of the options, approximated where
applicable. Forfeiture rate was determined as an average for the historic experience for all
grants.
The following table illustrates the major assumptions of the Black Scholes model for the options
for the years ended 31 December:
2012 2011 2010
Expected volatility 32%-184% 91%-184% 39% - 107%
The weighted-average expected term (in years) 1.79 1.48 1.76
Expected dividend yield 1.8%-6.7% 1.8%-2.2% 2.2% - 3.9%
Risk free interest rate 0.3%-11.2% 5.3%-11.2% 4.8% - 5.9%
Forfeiture rate 0.45 0.07 0.07
SAR plan
Background
In 2009 OJSC VimpelCom’s Board adopted a SAR plan for members of senior management and
employees. Following the completion of the Exchange Offer in 2011, the plan was modified to
provide that it will be administered by OJSC VimpelCom’s General Director and board of
directors, which determines the aggregate number of SARs that may be granted. A SAR, upon
vesting, entitles the holder to receive a cash amount per SAR equal to any excess of the NYSE
closing price of ADS on the exercise date over the price at which such SAR was granted. The
Group also grants SAR’s to certain employees in accordance with their employement
agreements.
The SAR granted is conditional on the grantee completing a specific period of service (vesting
period) and meeting specific pre-defined KPIs, which vary depending on the grantee. The SAR
will not vest if the KPI is not met.

85
The obligation under this plan is classified in other non-financial liabilities in the balance sheet.
Movements during the year
The following table illustrates the number, weighted average exercise prices and movements
during the year:
2012 2011 2010
SARs outstanding , beginning of year
1,868,460
1,590,660 2,016,440
Weighted-average exercise price SARs outstanding, USD per SAR
13.92
13.37 13.1
Weighted-average grant-date fair value at the beginning of the year, USD per SAR
8.23
11.73 11.8
The number of SARs granted
1,440,000
580,000 182.860
Weighted-average exercise price of SARs granted, USD per SAR
11.38 15.59 19.4
Weighted-average grant-date fair value of SARs granted during the year, USD per SAR
1.60 0.38 6.0
The number of SARs exercised
(250,000)
(90,960) (190,760)
The number of SARs forfeited/modified/converted to SARs
(384,440)
(211,240) (417,880)
Weighted-average exercise price of SARs forfeited, USD per SAR
13.42
14.73 14.70
The number of SARs outstanding, end of year
2,674,020
1,868,460 1,590,660
Weighted-average exercise price of SARs outstanding, USD per SAR
12.50 13.92 13.37
Weighted-average grant-date fair value at the end of the year, USD per SAR
1.04
8.23 11.73 Out of the SARs outstanding at the end of the year the number of SARs fully vested and exercisable
984,020
1,288,460 777,320
Weighted average remaining contractual life of the SARs outstanding, in years 3 3.5 5
Valuation
The valuation principles and assumptions made, incl. sensitivities are the same as discussed
above for the Stock Option Plans.
Phantom option plans
In addition to the Stock Option Plans and SARs, members of the Supervisory Board and
Management Board who are not employees participate in a “phantom” stock plan. The details of
the plan and the movements are described in Note 27 “Related parties”. There were no new
grants under this plan in the last three years.
Shares Awards
Certain members of senior management can be awarded with shares according to their specific
employment contracts. In 2012 there were 200,000 shares awarded and 700,000 shares in
2011. There were no grants prior to those years.
Executive and Director Investment Plan

86
In March 2012, The Company adopted the VimpelCom Ltd. Executive Investment Plan, or “EIP,”
in which certain members of our senior management may participate, and in August 2012, the
Company adopted the VimpelCom Ltd. Director Investment Plan, or “DIP,” in which members of
our supervisory board may participate. Under the EIP and DIP, participants are invited to
personally invest in our common shares. At the same time as their investment, participants will
be awarded matching options to acquire a number of matching shares at the end of a specified
performance period if, at the end of that performance period, certain performance conditions and
other conditions set out in the plan documents have been met. If all conditions to vesting have
been met, the number of matching shares that participants will receive when they exercise their
options will be based on a multiple of their initial investment.
The EIP and DIP are administered by the compensation committee. The compensation
committee determines the timing of awards, the performance conditions and performance period
for the vesting of the matching options. In the case of the EIP, the compensation committee also
determines which members of our senior management will receive invitations.
In June 2012, the compensation committee made an offer to certain members of senior
management to participate in the EIP, and in August 2012, the compensation committee made
an offer to members of our supervisory board to participate in the DIP. The matching options
awarded in connection with these offers will be subject to a two-year performance period and
performance conditions set out in the plan’s documents, as well as the terms of the plan. Movements during the year for the Directors Investment Plan
2012
The number of options granted 107,406
Weighted-average exercise price of options granted, USD per option
10.45
Weighted-average grant-date fair value of options granted during the year, USD per option
19.65
The number of options exercised -
The number of options forfeited/modified -
Weighted-average exercise price of options forfeited, USD per option -
The number of options outstanding, end of year 107,406
Weighted-average exercise price of options outstanding, USD per option
10.45
Weighted-average grant-date fair value at the end of the year, USD per option
19.65
Out of the options/SARs outstanding at the end of the year the number of options/SARs fully vested and exercisable -
Weighted average remaining contractual life of the options outstanding, in years 2
Movements during the year for the Executive Investment Plan
2012
The number of options granted or converted from ESOP 550,311
Weighted-average exercise price of options granted, USD per option
7.61
Weighted-average grant-date fair value of options granted during the year, USD per option
14.46

87
The number of options exercised -
The number of options forfeited/modified -
Weighted-average exercise price of options forfeited, USD per option -
The number of options outstanding, end of year
550,311,03
Weighted-average exercise price of options outstanding, USD per option
7.61
Weighted-average grant-date fair value at the end of the year, USD per option
14.46
Out of the options outstanding at the end of the year the number of options fully vested and exercisable -
Weighted average remaining contractual life of the options outstanding, in years 2
Valuation
The fair value of the awards has been estimated using a Monte Carlo simulation model. The fair
value of each award is estimated on the date of grant (or date of modification) and represents
the expected payout. In estimating the fair value, the Company used significant assumptions
taking into account the total shareholder return threshold on the VIP share performance
(including dividend).
General information
The average share price for the years ended 31 December 2012, 2011 and 2010 was USD
10.24 per share, USD 12.5 per share and USD 16.4 per share respectively.
The total expenses recognized in these consolidation financial statements with respect to stock-
based compensation were USD 12, USD 15 and USD 3 for the years ended 31 December 2012,
2011 and 2010 respectively (Note 9). The total unrecognized expenses with respect to stock-
based compensation were USD 7.6 as of 31 December 2012 (2011: USD 5, 2010: nil).

88
25 Provisions The following table summarizes the movement in provisions for the years ended 31 December 2012 and 2011:
Income taxes provisions
Tax provisions other than for income tax
Provision for decommissioning
Legal provisions
Other provisions
Total provisions
At 1 January 2012 60 82 176 64 202 584 Arising during the year 100 29 26 13 43 211 Utilised - - (3) (15) (42) (60) Reclassification 74 93 (7) 6 (98) 68 Unused amounts reversed (15) (29) - (19) (19) (82) Translation adjustment and other 3 3 18 1 (6) 19
At 31 December 2012 222 178 210 50 80 740
Current 2012 51 60 - 4 77 192 Non-current 2012 171 118 210 46 3 548
222 178 210 50 80 740
At 1 January 2011 52 13 89 46 - 200 Acquisition of a subsidiary (Note 6) - 82 12 48 244 386 Arising during the year 9 12 78 23 75 197 Utilised - (11) (10) (39) (28) (88) Reclassification 10 (8) 1 (1) (6) (4) Unused amounts reversed (2) (1) - (7) (57) (67) Translation adjustment (9) (5) 1 (6) (26) (45) Discount rate adjustment and imputed interest (change in estimates) - - 5 - - 5
At 31 December 2011 60 82 176 64 202 584
Total current 30 82 - 20 50 182 Total non-current 30 - 176 44 152 402
60 82 176 64 202 584
The timing of payments in respect of non-current provisions is, with few exceptions, not contractually fixed and cannot be estimated with certainty. Key assumptions and sources of uncertainty are discussed in Note 4.
Significant tax and legal proceedings are discussed in Note 27 below. Given the uncertainties
inherent in such proceedings, there can be no guarantee that the ultimate outcome will be in line
with VimpelCom’s current view.

89
26 Related parties
Shareholders and other related parties
As of 31 December 2012 the Company is primarily owned by two major shareholders: Altimo
Coöperatief (a member of the Alfa group of companies, hereafter Altimo) and Telenor East
Holding II AS (hereafter Telenor). The Company has no ultimate controlling shareholder.
The following table provides the total amount of transactions that have been entered into with related parties and balances of accounts with them for the relevant financial years:
For the year ended and as of 31 December 2012
For the year ended and as of 31 December 2011
For the year ended and as of 31 December 2010
Revenue from Altimo 11 10 19 Revenue from Telenor 50 62 5 Revenue from associates 89 86 100 Finance income from associates 681 164 - Wind International Services Spa 27 86 - Wind International Services Sarl - 36 - SPAL TLC SpA 18 - - Revenue from other related parties 4 37 10
880 481 134
Services from Altimo 12 8 7 Services from Telenor 44 57 4 Services from associates 202 221 202 Wind International Services Spa - 343 - Wind International Services Sarl - 13 - Services from other related parties 30 42 10
288 684 223
Cash and cash equivalent 112 69 9 Accounts receivable from Altimo 1 1 2 Accounts receivable from Telenor 7 10 2 Wind International Services Spa 26 17 - Wind International Services Sarl - 14 - SPAL TLC SpA 46 Accounts receivable from associates 61 81 83 Financial asset receivable from associates 781 964 - Accounts receivable from other related parties 3 38 1
1,037 1,194 97
Non-current account receivable from associates - 2 5 Accounts payable to Altimo - - - Accounts payable to Telenor 3 10 2 Wind International Services Spa - 4 - Wind International Services Sarl - 5 - SPAL TLC SpA 10 Accounts payable to associates 40 25 3 Accounts payable to other related parties 9 38 1
62 82 6
Outstanding balances and transactions with Altimo relate to operations with Altimo (a member of
the Alfa group of companies), its consolidated subsidiaries, its direct owners and their

90
consolidated subsidiaries. In particular, VimpelCom has contracts with Alfa Insurance to provide
the Company with property and equipment liability insurance. VimpelCom has also entered into
a general service agreement with Altimo Management Services Ltd. for provision of
management advisory services, technical assistance and maintenance of network systems and
equipment and other services. The Company also has contracts to provide fixed
telecommunication service to Altimo and its subsidiaries.
Outstanding balances and transactions with Telenor relate to operations with VimpelCom’s
shareholder Telenor East Holding II AS, its consolidated subsidiaries, its direct owners and their
consolidated subsidiaries. VimpelCom has also entered into a services agreement with Telenor
for provision of financial and administrative services.
Outstanding balances and transactions with Weather II relate to operations with VimpelCom’s
shareholder Weather II, its consolidated subsidiaries, its direct owners and their consolidated
subsidiaries. In particular, Wind International Services (subsidiary of Weather II) provides call
termination and related services to VimpelCom subsidiaries pursuant to a framework agreement.
Effective from 15 August 2012, all entities affiliated with Weather Investments II S.à r.l. are no
longer considered to be related to VimpelCom as a result of a change in VimpelCom’s
shareholder structure on that date.
Outstanding balances and transactions with associates relate to operations with VimpelCom’s
equity investees (Note 12). Loans receivable mainly represent outstanding balances from
GWMC (Note 17). Euroset transactions mainly represent sales of telephones and accessories,
dealer commission payments for the acquisition of new subscribers and commission for
payments receipts. Operations with associates also include purchase of bill delivery services
and fixed telecommunication services.
Terms and conditions of transactions with related parties
Outstanding balances at the year-end, other than the loans from GWMC, are unsecured, interest
free and settlement occurs in cash. There have been no guarantees provided or received for any
related party receivables or payables. For the years ended 31 December 2012, 2011 and 2010,
VimpelCom has not recorded any impairment of receivables relating to amounts owed by related
parties, other than the loans from GWMC (Note 17). This assessment is undertaken each
financial year through examining the financial position of the related party and the market in
which the related party operates.
Compensation of key management personnel of the Company
Members of the Supervisory Board and Management Board of the Company are the key
management personnel. The amounts disclosed in the table are the amounts recognized as an
expense during the reporting period related to key management personnel:
2012 2011 2010
Short-term employee benefits 31 34 10
Share-based payment transactions 1 20 7
Total compensation paid to key management personnel 32 54 17

91
Each of our unaffiliated directors currently receives an annual retainer of € 100,000. Each affiliated director receives an annual retainer of € 40,000, and our current chairman of the Supervisory Board receives an additional annual retainer of €4,000. In addition, each unaffiliated director who serves as head of any of the official committees of our Supervisory Board receives additional annual compensation of € 25,000 per committee headed. All of our directors are reimbursed for expenses incurred in connection with service as a member of our Supervisory Board.
For this purpose, the term “unaffiliated director” means a director that is not an “Affiliate” (as defined in our bye-laws) nor employed by an Affiliate of the company and “affiliated director” means a director who is not an “unaffiliated director”.
In addition, our directors who are not employees may participate in a phantom stock plan,
pursuant to which they each receive up to a maximum of 20,000 phantom ADSs per year, with
an additional 10,000 phantom ADSs granted to the chairman of the supervisory board and an
additional 10,000 phantom ADSs granted to each director for serving as head of any official
committee of the supervisory board. The number of phantom ADSs actually granted to each
director is determined by the supervisory board. Phantom ADSs do not involve actual ADSs or
common shares, and the amount paid to a director upon redemption may not exceed USD 3.00
per ADS per year for each one-year term served by the director. Phantom ADSs vest at a rate of
1/12 of the grant amount for every month of service to our company as a director after the grant
date. Any vested phantom ADSs may be redeemed for cash only during the first open trading
window period to occur after the date the director ceases to serve on the supervisory board;
provided, however, that directors who are re-elected to subsequent terms on the supervisory
board may also redeem any phantom ADSs related to previous periods of service during any
open trading window that occurs while serving their subsequent terms. A director, upon exercise
of a phantom ADS, will receive, for each phantom ADS, cash in an amount equal to:
– the amount that the average sales price of one of our ADSs quoted on the NYSE for the
30-day period immediately prior to the date of exercise, exceeds;
– the average sales price of one of our ADSs quoted on the NYSE for the 30-day period
immediately prior to the date preceding the grant date of the phantom ADS; provided, however,
that the amount paid to a director upon redemption may not exceed USD 3.00 per ADS per year
for each one-year term served by the director.
In 2011, an aggregate of 230,000 phantom ADSs, with an exercise price of USD 13.64, were
granted to our directors in connection with their service on our Supervisory Board. In addition, in
connection with the completion of the VimpelCom Ltd. Transaction, as of 21 April 2010, all OJSC
VimpelCom directors who became members of our Supervisory Board waived their rights to any
outstanding phantom ADSs they held under the OJSC VimpelCom phantom stock program in
exchange for substitute phantom ADSs granted under the VimpelCom Ltd. phantom stock
program.
Of the total number of phantom ADSs granted in 2011, none were exercised and no payment
was made in 2011. As of 31 December 2011, an aggregate of 1,640,000 phantom ADSs were
outstanding, 1,410,000 of which were exercisable as of that date and within 60 days after.
In 2012 there was no additional phantom ADS granted.
Our senior managers are eligible to participate in our stock option plans and SARs.

92
27 Commitments, contingencies and uncertainties
Risks
Currency control risks
The imposition of currency exchange controls or other similar restrictions on currency convertibility in Algeria and CIS countries (particularly in Uzbekistan) could limit VimpelCom’s ability to convert local currencies or repatriate local cash in a timely manner or at all, as well as, remit dividends from the respective countries. Any such restrictions could have a material adverse effect on VimpelCom's business, financial condition and results of operations. The continued success and stability of the economies of these countries will be significantly impacted by their respective governments’ continued actions with regard to supervisory, legal and economic reforms.
Domestic and global economy risks
The economies of countries where VimpelCom operates are vulnerable to market downturns and economic slowdowns elsewhere in the world. The respective governments of these countries continue to take measures to support the economies in order to overcome the consequences of the global financial crisis. Despite some indications of recovery, there continues to be uncertainty regarding further economic growth, access to capital and cost of capital, which could negatively affect the Company’s future financial position, results of operations and business prospects. While management believes it is taking the appropriate measures to support the sustainability of VimpelCom’s business in the current circumstances, unexpected further deterioration in the areas could negatively affect the Company’s results and financial position in a manner not currently determinable.
Legislation risks
In the ordinary course of business, VimpelCom may be party to various legal and tax proceedings, and subject to claims, certain of which relate to the developing markets and evolving fiscal and regulatory environments in which VimpelCom operates. In the opinion of management, VimpelCom’s liability, if any, in all pending litigation, other legal proceeding or other matters, other than what is discussed in this Note, will not have a material effect upon the financial condition, results of operations or liquidity of VimpelCom. VimpelCom’s operations and financial position will continue to be affected by political developments in the countries in which VimpelCom operates including the application of existing and future legislation, and telecom and tax regulations. These developments could have a significant impact on VimpelCom’s ability to continue operations. VimpelCom does not believe that these contingencies, as related to its operations, are any more significant than those of similar enterprises in such countries.

93
Tax risks
The tax legislation in the markets VimpelCom operates in are unpredictable and give rise to
significant uncertainties, which could complicate our tax planning and business decisions. Tax
laws in many of the emerging markets in which we operate have been in force for a relatively
short period of time as compared to tax laws in more developed market economies. Tax
authorities in our markets are often some what less advanced in their interpretation of tax laws,
as well as in their enforcement and tax collection methods.
Any sudden and unforeseen amendments of tax laws or changes in the tax authorities’
interpretations of the respective tax laws and/or double tax treaties, could have a material
adverse effect on our future results of operations, cash flows or the amounts of dividends
available for distribution to shareholders in a particular period (e.g. introduction of Transfer
pricing rules and CFC legislation).
Management believes that it has paid or accrued all taxes that are applicable. Where uncertainty
exists, VimpelCom has accrued tax liabilities based on management’s best estimate. From time
to time, we may also identify tax contingencies for which we have not recorded an accrual. Such
unaccrued tax contingencies could materialize and require us to pay additional amounts of tax.
Commitments
Telecom Licenses Capital Commitments
VimpelCom’s ability to generate revenues in the countries it operates is dependent upon the operation of the wireless telecommunications networks authorized under its various licenses under GSM-900/1800 and “3G” (UMTS / WCDMA) mobile radiotelephony communications services and “4G” (LTE). Under the license agreements operating companies are subject to certain commitments, such as territory or population coverage, level of capital expenditures, and number of base stations to be fulfilled within a certain timeframe. After expiration of the license, our operating companies might be subject to additional payments for renewals, as well as new license capital and other commitments. In July 2012, OJSC VimpelCom was awarded a mobile license, a data transmission license, a voice transmission license and a telematic license for the provision of LTE services in Russia. For information regarding the other operators holding LTE licenses with whom we compete, see “Description of Operations of the Russia Business Unit—Mobile Business in Russia.” LTE is the next step in wireless technology and is expected to be the mobile broadband platform for new services and innovation for the future, which in practice will provide subscribers with significantly faster data rates for both uploading and downloading content, a greater number of mobile TV channels and better image quality. These licenses will allow OJSC VimpelCom to provide services using radio-electronic devices in Russia via networks that use LTE standard equipment within any of the following frequency bands: 735-742.5/776-783.5 MHz; 813.5-821/854.5-862 MHz; 2550-2560/2670-2680 MHz. The three channels (one channel (10 MHz) in frequency duplex in 2500-2690 MHz and two channels (7.5 MHz) in frequency duplex for 720-862 MHz), allocated to us in accordance with the licenses, have restrictions in use. To remove restrictions we have to perform certain organizational technical measures including, among others, radio frequency bands releasing spectrum conversion, refarming and reallocation between operators. We expect that the roll-out of the LTE network will occur using a phased approach based on a

94
pre-defined schedule pursuant to the requirements of the license. Under the phased approach, OJSC VimpelCom is required to launch LTE services by June 1, 2013. OJSC VimpelCom is then required to extend services to six regions in Russia by the end of 2013 and a specified number of additional regions in each year until December 1, 2019 when services must cover all of Russia. OJSC VimpelCom is required to comply with the following conditions among others under the terms of the license: (i) invest at least RUB 15 billion in each calendar year (including the period from July 12, 2012 to December 1, 2013) in the construction of its federal LTE network until the network is completed, which must occur before December 1, 2019; (ii) provide certain data transmission services in all secondary and higher educational institutions in specified areas; and (iii) provide interconnection capability to telecommunications operators that provide mobile services using virtual networks in any five regions in Russia not later than June 1, 2017.
Apple
On 31 March 2011, VimpelCom and Apple signed an amendment to an existing agreement regarding VimpelCom’s purchase of iPhones from Apple (“the Amendment”). Under the Amendment, 958,540 iPhone handsets (being the difference between 1,500,000 iPhone handsets per the original agreement and the amount actually purchased by the Company from Apple through 31 March 2011) should be purchased by the Company between 1 April 2011 and 31 March 2013. If VimpelCom does not comply with this agreed schedule and certain other terms of the Amendment, VimpelCom could become liable for the shortfall in orders of iPhone handsets that existed as of 31 March 2011, less any iPhone handsets actually purchased by VimpelCom after this date. As of 31 December 2012 the Company had not purchased all of the handsets that it was required to purchase in accordance with the agreed schedule. No provision has been recorded in relation to this matter since the probability of cash outflow was assessed as remote.
Operating lease commitments
Operating lease commitments for the succeeding five years is as follows:
2012 2011 2010
Less than 1 year 244 155 104
Between 1 and 5 years 303 244 269
More than 5 years 275 185 177
Total 822 584 550
Operating lease commitments mainly relate to the lease of base station sites and office spaces. Operating leases can be renewed but may be subject to renegotiations with lessors.

95
Contingencies and uncertainties
Algerian tax claims
OTA has recently been subject to tax claims by the Algerian tax authority with respect to payment of taxes during its taxation period between 2002 and 2009.
Claims for July 2002 to August 2007 Period
In 2001, when OTA signed its investment agreement with the Algerian Investment Promotion Organization in connection with its GSM license, OTA was granted favourable tax treatment for a period of five years starting in July 2002 and ending in August 2007. OTA has been charged by the Algerian Directions des Grandes Entreprises (DGE) with a final tax reassessment for 2004 and has been ordered to pay approximately DZD 4.34 billion, including penalties, (equal to approximately USD 57 at the exchange rate as of 31 December 2012).
In November 2009, OTA received a further final tax reassessment for the years 2005 through 2007 from the DGE ordering it to pay approximately DZD 43.9 billion, including penalties (equal to approximately USD 637 at the exchange rate as of 31 December 2012). The DGE has alleged that (i) OTA did not keep proper manual accounts during these years notwithstanding that OTA’s accounts were fully audited and approved by both OTA’s international auditors and its local statutory auditors, and (ii) OTA deducted certain expenses such as management and bad debt expenses and therefore understated the taxable income.
In Algeria the tax authorities are able to raise additional tax assessments for four years after the end of the relevant tax period. OTA has received the final tax assessment for the years 2004, 2005, 2006 and 2007. OTA filed a tax claim objection (tax appeal) on the 2004, 2005, 2006 and 2007 final tax assessments.
On 7 March 2010 OTA received a rejection on its submitted administrative appeal filed on 27 December 2009 against the notice of reassessment dated 16 November 2009 received from the DGE in respect of the tax years 2005, 2006 and 2007. OTA’s administrative appeal in relation to the 2004 tax reassessment has also been rejected. OTA appealed these rejections before the Algiers Administrative Tribunal. Its claims were rejected in April 2012. OTA appealed the decision of the Administrative Tribunal before the State Council in July 2012; these proceedings remain pending.
Claims for 2008 and 2009 Tax Years
On 30 September 2010, OTH announced that OTA has received a preliminary tax notification from the DGE in respect of the years 2008 and 2009, in which the DGE re-assessed taxes alleged to be owed by OTA in the amount of approximately DZD 17.1 billion (equal to approximately USD 217 at the exchange rate as of 31 December 2012), despite the fact that OTA has already paid the taxes due for these years.
The tax audit for these years was initiated in early 2010 following the tax filing for 2009.

96
This reassessment was based primarily on the allegation that OTA did not keep proper accounts for the years 2008 and 2009 notwithstanding that OTA’s accounts were fully audited and approved by both OTA’s international auditors and its local statutory auditors.
OTA received a final tax notification from the DGE in respect of the years 2008 and 2009 in December 2010. OTA's administrative appeal against this notification was rejected in March 2012 (of which OTA was formally notified in June 2012). OTA appealed this rejection before the Algiers Administrative Tribunal in October 2012; these proceedings remain pending.
Furthermore in 2011 OTA received an additional tax notification from the DGE in respect of the penalties for claims for July 2002 to August 2007 period, in the amount of approximately DZD 6.56 billion (equal to approximately USD 81 at the exchange rate as of 31 December 2012).
OTA continues to appeal all of the tax claims and continues to believe that the assessments are unjustified. Without prejudice to its rights and the rights of its shareholders under its investment agreement with the Algerian Investment Promotion Organization, applicable bilateral investment treaty and applicable laws, OTA was required to prepay claimed amounts and penalties totalling approximately DZD 71.9 billion (equal to approximately USD 955 using the average annual exchange rates according to the years in which amounts were prepaid). Management views the amounts paid to the DGE as uncertain tax positions and have accounted for them using a two step approach in accordance with IAS 12. In so doing, the Company has considered the technical merits of the assessments, including input in the form of a technical report from an independent external expert. There are significant risks involved in this case and as a result, the prepaid claimed amounts may not be fully recovered and for this appropriate provision has been recorded.

97
Other Algerian claims
Bank of Algeria Claim
On 15 April 2010, an injunction by the Bank of Algeria came into effect that restricts all Algerian banks from engaging in foreign banking transactions on behalf of OTA. OTA has challenged this injunction in the Algerian courts but the case is still pending. As a result of the injunction OTA is prevented from importing equipment from foreign suppliers and is prevented from transferring funds outside of Algeria. The Algerian authorities alleged breaches of foreign exchange regulations by OTA and a member of its senior management.
On 28 March 2012, the Algerian Court of First Instance handed down a judgment against OTA and a member of OTA’s senior executive team. The judgment consists of fines of DZD 99 billion (approximately USD 1,300 at the exchange rate as of 28 March 2012) including a criminal sentence against a member of OTA’s senior executive team. On 5 April 2012, OTA and its senior executive appealed the Criminal Court’s judgment and on 27 May 2012, the Algerian Criminal Court of Appeal handed down judgment on the day of the hearing, confirming the judgment against OTA, suspending the criminal custodial sentence previously ordered against OTA’s senior executive and transferring the burden of payment of the USD 80.5 fine ordered against the senior executive to OTA. On 31 May 2012, OTA lodged a final appeal against the 27 May 2012 judgment before the Algerian Supreme Court, which is still pending.
OTA maintains that OTA and its senior executive have acted in compliance with the law, and accordingly, no provision has been made for the Bank of Algeria claims in the financial statements.
Arbitration following Tax Reassessments and Bank of Algeria litigation
On 12 April 2012, OTH submitted a formal Notice of Arbitration against the Algeria government in respect of actions taken by the Algerian government against OTA. The claim in the Notice of Arbitration is being made under the arbitration rules of the United Nations Commission on International Trade Law. In its Notice of Arbitration, OTH asserts that since 2008 its rights under the Agreement on the Promotion and Reciprocal Protection of Investments between Egypt and Algeria have been violated by actions taken by the Algerian government against OTA, including the Algerian Court of First Instance’s 28 March 2012 judgment against OTA and a member of its senior executive team and the Tax Reassessments.
Sim-card Users
In 2010, the Algerian government issued a new finance law, where in case of failure to identify the SIM card user, a penalty amounting to DZD 100,000 (equivalent to USD 0.0013) for each unidentified SIM is paid for the first year and increase to DZD 150,000 (equivalent to USD 0.0019) for the second year. Although the exposure cannot currently be estimated, it is not expected to have a material impact on the financial statements.
Algerian business
The Algerian government has announced its intention to unilaterally purchase OTA, alleging that it has the right to do so under the pre-emption right contained in the 2009 Finance Act and the

98
2010 Supplemental Finance Act. Pursuant to this announcement, the value of OTA was to be determined by a valuation advisor retained by the Algerian Government. The unilateral purchase of OTA by the Algerian Government could have a materially adverse effect on the financial position and results of operations of the Company. OTA remains a strategically important asset for the Company and, therefore, VimpelCom is interested in exploring with the Algerian government, a resolution which would allow the Company to retain an interest in OTA. VimpelCom is engaged in without prejudice settlement discussions with the government, including the exploration of a possible sale to the Algerian government by OTH of an interest in OTA, including, subject to certain conditions, a majority stake in OTA. Any transaction will be subject to corporate approvals by OTH and VimpelCom. Such settlement discussion may address the resolution of the tax and other Algerian claims described above, which may be part of any settlement agreement. Depending on the terms of any such settlement agreement, the accounting for the tax and other Algerian claims may be materially different to that currently reflected in the financial statements. It is contemplated that, pursuant to any sale to the Algerian government, that the governance and management control of OTA would be such that VimpelCom would continue to consolidate OTA.
The Company continues to be open to finding an amicable resolution with the Algerian government that is mutually beneficial to both parties.
Iraqna Litigation
On 19 November 2012, Atheer Telecom Iraq Limited ("Atheer", an affiliate of the Zain Group)
initiated English High Court proceedings against Orascom Telecom Iraq Ltd ("OTIL") and OTH in
relation to a dispute arising out of the sale by OTIL of its Iraqi mobile subsidiary, Iraqna, in 2007
to Atheer. Atheer's claim is founded on the tax covenants in the underlying 2007 share
purchase agreement (“SPA”) between the parties. In particular, Atheer is seeking declarations
from the Court that OTIL and OTH are liable to indemnify it in respect of three alleged tax
liabilities: (1) a capital gains tax liability in the sum of IQD 219 billion (equal to approximately
USD 188 as of 31 December 2012) in respect of the transaction that formed the subject-matter
of the SPA; (2) an income tax liability in the sum of approximately IQD 96 billion (equal to
approximately USD 82 as of 31 December 2012) in respect of the years 2004-2007; and (3) a
withholding tax liability in the sum of approximately IQD 7 billion (equal to approximately USD 6
as of 31 December 2012).
The dispute is currently pending before the English High Court (Queen’s Bench division) in
London. OTIL and OTH are vigorously defending against the tax liabilities, and thus no provision
has been recorded for this matter.
Pricing of iPhone
The Federal Anti-Monopoly Service ("FAS") in Russia commenced proceedings against OJSC VimpelCom and OJSC Mobile TeleSystems (“MTS”) regarding alleged price collusion with respect to the sale prices of iPhones by OJSC VimpelCom and MTS. On 26 April 2012, the FAS issued a decision pursuant to which OJSC VimpelCom and MTS were found guilty of price fixing in that they acted in concert to fix identical wholesale prices for certain iPhone models during the

99
period from September 2010 to April 2011. Since both parties voluntarily ceased the alleged wrongdoings, the antimonopoly case was terminated. On 17 July 2012, the FAS fined OJSC VimpelCom RUR 18.2 million (the equivalent to USD 0.6 as of 17 July 2012), which was paid in full in 2012. LLC Summa Telecom LLC Summa Telecom filed a claim in first instance with the Moscow City Arbitration Court against the State Commission for Radio Frequencies (the “Commission”), the Ministry of Communications and Mass Media of the Russian Federation (the “Ministry”) and the Federal Service for Supervision of Communications, Information Technology and Mass Media (“Roskomnadzor”). LLC Summa Telecom claim sought to revoke the court’s September 8, 2011 decision which refused to allocate frequencies in the 2500-2700 MHz frequency range and to compel the defendant to allocate the following spectrum bands: 2500-2530 MHz, 2560-2570 MHz, 2620-2630 MHz, 2660-2670 MHz, and 2680-2690 MHz. On July 12, 2012, the Moscow City Arbitration Court upheld the claim and ruled in favour of LLC Summa Telecom. The Commission, the Ministry and Roskomnadzor filed an appeal, along with certain third parties. On September 26, 2012, OJSC VimpelCom was added as a third party to the proceedings. On October 25, 2012, the 9th Arbitration Court of Appeals overturned the July 12, 2012 decision and dismissed LLC Summa Telecom’s claim. LLC Summa Telecom filed an appeal, but this was dismissed by the court on February 14, 2013. On March 7, 2013, Summa Telecom filled an appeal with the Supreme Arbitration Court of the Russian Federation to review the rulings in exercise of the court’s supervisory powers. This review is currently pending. If LLC Summa Telecom prevails on its claim, it could initiate new proceedings which could potentially lead to a revision of the LTE tender, in which OJSC VimpelCom was awarded licenses and frequencies for the provision of LTE services in Russia. If a revision includes revocation of any part of LTE spectrum granted to us, it could result in a material adverse effects on our business, financial condition, results of operations and prospects.
Telenor East and Weather II – FAS claim
In April 2012, the Federal Antimonopoly Service (“FAS”) brought a claim against two of VimpelCom’s strategic shareholders at the time, Telenor East and Weather II, in the Moscow Arbitration Court. The FAS named VimpelCom Ltd., VimpelCom Holdings B.V., OJSC VimpelCom, OOO Altimo and Altimo Coöperatief as third parties under the claim. The FAS alleged that Telenor East’s 15 February 2012 purchase (the “Purchase”) of 234 million preferred shares in our company from Weather II violated relevant Russian law because Telenor East, as a company controlled by a foreign state (the Kingdom of Norway), may not exercise control over a Russian entity having strategic importance for the national defence and state security (such as our Russian subsidiary, OJSC VimpelCom). In connection with the claim, following a petition of FAS, the Moscow Arbitration Court issued rulings granting injunctive relief, which prohibited: (i) VimpelCom Ltd. and VimpelCom Holdings B.V. from voting at OJSC VimpelCom general shareholders meetings on matters related to a change of the members of the management bodies, and passing resolutions on approval of

100
major transactions and interested party transactions; (ii) Telenor East and Weather II from changing the composition of VimpelCom Ltd.’s supervisory board; (iii) Telenor East and Weather II from exercising their rights under the option agreement dated 15 February 2012; (iv) payment to the shareholders of OJSC VimpelCom of dividends based on OJSC VimpelCom’s 2011 operating results, and transfer of the cash intended for dividend distribution from OJSC VimpelCom accounts to the accounts of VimpelCom Ltd. or other companies with foreign banks; (v) the external auditors elected at the Annual General Shareholders Meeting of VimpelCom Ltd. held on 21 May 2012 from exercising the powers conferred on them; (vi) the board of directors of OJSC VimpelCom elected at the annual general shareholders meeting of OJSC VimpelCom from exercising their powers pursuant to the charter of OJSC VimpelCom; and (vii) other actions and steps designed to transfer the funds out of OJSC VimpelCom. In November 2012, the FAS withdrew its claim after Altimo increased its stake in VimpelCom Ltd. to 47.85% from 41.9% by purchasing the shares of Bertofan Investments Limited, a company owned by Ukrainian businessman Viktor Pinchuk. The injunctions issued in the proceedings were subsequently cancelled. Kyrgyzstan
Sky Mobile is one of fourteen defendants to litigation proceedings in the High Court of the Isle of Man brought by affiliates of MTS. The claim arises from a dispute in 2005 between the claimants and Fellowes International Holdings Limited over the ownership of Bitel, a Kyrgyz telecommunications company. The claimants allege that a Kyrgyz judgment in 2005 which determined that Fellowes, rather than the claimants, was the rightful owner of Bitel, was wrongfully obtained. The claimants further allege that a sale of BITEL's assets to Sky Mobile in 2006 was wrongful.The legal proceedings in this matter are pending. At this time, the Company is unable to assess the likelihood of the ultimate outcome of this lititgation and its effect on the Company’s operating results and financial condition. No provision has been recorded. KaR-Tel litigation with ex-shareholders On 10 January 2005, KaR-Tel, the Company’s operator and subsidiary in Kazakhstan, received an "order to pay" (“Order to Pay”) issued by The Savings Deposit Insurance Fund, a Turkish state agency responsible for collecting state claims arising from bank insolvencies (the "Fund"), in the amount of TRY 7.55 billion (the equivalent of approximately USD 4,233 at the exchange rate as of 31 December 2012). Through various court proceedings since 2005, the Company has petitioned to annul the Order to Pay. On 25 October 2010, the 4th Administrative Court of Istanbul reviewed Kar-Tel’s petition to annul the Order to Pay and ruled in favour of KaR-Tel. The court decision has been appealed by the Fund. The court file was sent by the Court to the Councel of State for the appeal proceedings.
On 22 March 2012 the Fund’s and Kar-Tel’s appeals on the decision of the 4th Administrative Court of Istanbul dated 25 October 2010 was reviewed by the Prosecution Office of the Council of State and has been sent to the 13th Chamber of the Council of State for review on the merits.

101
The Company continues to believe that the Fund's claim is without merit, and KaR-Tel will take whatever further actions it deems necessary and appropriate to protect itself against the Fund's claim. No provision has been made in relation to this case. The 1st Roaming Claim Against KaR-Tel: Threshold amounts
On 14 May 2010, the Antimonopoly Agency of Kazakhstan (the “Agency”) initiated an investigation of the alleged breach of antimonopoly laws by all three Kazakhstan GSM-operators (KaR-Tel, GSM Kazakhstan OAO Kazakhtelecom LLP, and Mobile Telecom Systems LLP) for abuse of dominant position. The Agency alleged that these companies infringed consumers' rights by requiring a minimum threshold amount in a consumer's prepaid account to be able to use certain roaming services (the “Threshold Amounts”). As a result of various court proceedings, the administrative fines for KaR-Tel have been reduced from KZT 11.6 billion (the equivalent of approximately USD 78 as of 15 June 2012) to KZT 155 million (the equivalent of USD 1 as of 15 June 2012) following a decision by the Interregional Administrative Court on 15 June 2012. On August 16, 2012 the administrative fine was paid and expensed by KaR-Tel. The decision is subject to appeal by the public prosecutor’s office or KaR-Tel within one year from the date thereof. The Company is considering whether it will appeal the decision.
No provision has been made in relation to this case.
The 2nd Roaming Claim Against KaR-Tel: Concerted actions high roaming tariffs
In 2010 the Agency also initiated an investigation with respect to alleged concerted actions of certain Kazakhstan and Russian GSM-mobile operators in relation to establishing and/or preserving monopolistic roaming tariffs. Kar-Tel denied any involvement in these alleged concerted actions and following various court proceedings the Interregional Administrative Court of Almaty ruled in favour of KaR-Tel on 1 March 2012. The period for appeal has expired. No provision has been made in relation to this case.
Dominant Market Position of Kar-Tel
On 10 October 2011, Kar-Tel was recognized by the Agency as having a dominant position in the interconnection market. If a company is recognized as having a dominant position, it is subject to special reporting obligations to the Agency, increased scrutiny in relation to anti-monopoly and competition issues and potential price regulation (e.g., tariff caps). Following various court proceedings against the claim of the Agency that KaR-Tel has a dominant market position, KaR-Tel submitted an application to the Supreme Court of Kazakhstan for supervisory review of the case. This appeal was rejected by the Supreme Court on 10 January 2013. The decision is only subject to appeal by the public prosecutor’s office or KaR-Tel which can appeal until 18 October 2013. KaR-Tel believes that its position is justified and is considering applying for appeal with at the public prosecutor’s office. No provision has been made in relation to this case. Antitrust Proceedings in Ukraine In December 2012, the Ukraine Anti-Monopoly Committee (the “UAMC”) completed two investigations regarding Kyivstar’s roaming charges and other local mobile tariffs. As a result of these investigations, the UAMC issued binding recommendations requiring Kyivstar to reduce

102
certain roaming charges and tariffs for mobile services to a level equal to those on a market with significant competition. These recommendations have been implemented with no negative effect on marketing, tariff policies or plans. Both investigations have now been closed by the UAMC. However, the UAMC has been investigating the distribution by Kyivstar of allegedly misleading information on its tariffs. In connection with the investigation, the UAMC imposed a fine of 50,000 UAH on Kyvistar (equal to approximately USD 0.006 at the exchange rate as of June, 2012), which Kyivstar paid in June, 2012. Other Disputes On 13 September 2012, the Italian Competition Authority (or the “ICA”) opened an anti-trust investigation in respect of three Italian mobile network operators (Telecom Italia, Vodafone and WIND) and carried out dawn raids on their premises. The investigation was started following a claim by Italian mobile virtual network operators, Bip Mobile. Bip Mobile claimed an alleged agreement between Telecom Italia, Vodafone and WIND, which was aimed to prevent the entry of Bip Mobile into the Italian mobile market through collusive pressure on the multi-brand point of sales starting as of June 2012. WIND is currently defending its conduct against Bip’s Mobile’s allegations and cooperating with the ICA in accordance with usual legal and procedural steps. We expect that the investigation will be completed by the end of September 2013. If Telecom Italia, Vodafone and/or WIND are to be found to in breach of applicable legislation, this could lead to a fine for these parties. As the investigation is still in progress and no allegations have been made by the ICA against Wind to date. Accordingly, no provision has been made in relation to this case.
Contingent tax liabilities
Multinational groups of the size of VimpelCom are exposed to varying degrees of uncertainty
related to tax planning changes in tax law and periodic tax audits. VimpelCom accounts for its
income taxes on the basis of its own internal analyses, supported by external advice.
VimpelCom continually monitors its global tax position, and whenever uncertainties arise,
VimpelCom assesses the potential consequences and either accrues the liability or discloses a
contingent liability in its financial statements, depending on the strength of the Company’s
position and the resulting risk of loss.
OTH
The Egyptian Large Taxpayers Office (the “LTO”) conducted a review of OTH’s tax filings for tax years 2000-2004. The LTO concluded that certain investments made by OTH during this period were actually license fees paid to foreign governments for which Egyptian withholding tax was due according to Egyptian tax laws. The LTO accordingly assessed EGP 1.9 billion (equal to
approximately USD 327 million at the exchange rate as of December 31, 2010) in additional tax liabilities against OTH for these tax years. OTH challenged the LTO’s assessment in a proceeding before an appellate committee of the Egyptian Ministry of Finance. On May 15, 2012, the appellate committee cancelled the LTO’s assessment for certain of the tax years. Based on the appellate committee’s decision and subsequent assessments issued to OTH,

103
OTH’s assessed liability as of November 29, 2012 stood at approximately EGP 323.0 million (approximately USD 53 at the exchange rate as of November 29, 2012) in back taxes for the relevant years and approximately EGP 430.5 million in penalties and interest (approximately USD 70 at the exchange rate as of November 29, 2012). In addition, as a result of the appellate committee’s decision, the LTO assessed additional tax liabilities in subsequent tax periods relating to the carry forward losses. As of December 31, 2012, OTH has paid approximately EGP 199.0 million (approximately USD 31 at the exchange rate as of December 31, 2012) toward the assessed amounts while it continues to challenge them. The LTO has also challenged the appellate committee’s decision and is seeking to reinstitute its original assessment. The Company has recorded a liability of USD 30 for remaining instalments in relation to this matter and a provision of USD 8. The Company continues to challenge the assessments of the LTO.
Other contingencies and uncertainties
In addition to the individual matters discussed above, the Company is also involved in legal
proceedings relating to the normal conduct of its business, such as claims for regulatory and
employment issues as well as general liability. The Company believes it has provided for all
probable liabilities deriving from the normal course of business. The Company does not expect
any liability arising from any other of these legal proceedings to have a material effect on the
results of operations, liquidity, capital resources or financial position of the Company.
Pledges and guarantees As of 31 December 2012 and 2011, the collateral pledged by the Company and its subsidiaries as security for their financial liabilities was as follows:
Wind Telecom
Wind Telecom pledge its shares in Wind Acquisition Holdings Finance SpA (“WAHF”) in favour of the Bank of New York Mellon as Trustee a BNY Corporate Trustee Services Limited as a security of the notes issued by WIND Acquisition Holding Finance SA.
WAHF Group
WAHF pledged 146,100,000 ordinary shares without nominal value representing 100% of the corporate capital of the subsidiary WIND Telecomunicazioni SpA in favour of the Guaranteerd Creditors pursuant the related Deed of pledge over the shares. WIND Telecomunicazioni SpA pledged 6,200 shares representing 100% of the corporate capital of the subsidiary Wind Acquisition Finance SA in favour of a pool of banks pursuant the related share pledge agreement. WAHF issued a special lien pursuant to article 46 of the Consolidated Banking Law of Italy on certain assets, present and future, belonging to the subsidiary Wind Italy as specified in the relevant deed, in favour of the banking syndicate party to the Senior Facility Agreement and other creditors specified in the relevant deed. Also in order to provide a guarantee for its obligations, Wind Italy has pledged as security its trade receivables, receivables arising from intercompany loans and receivables relating to insurance policies, present and future, as described in the specific instrument, its receivables arising from the Put and Call option dated May 26, 2005 as described in the relevant deed and the subsidiary WIND Telecomunicazioni SpA’s trademarks and intellectual property rights, as specified in the relevant deed, to the

104
banking syndicate in accordance with the Senior Facility Agreement and the other lending parties specified in the supplemental deed related to the respective contract as a guarantee for and in favour of the subscribers to the Senior Notes, expiring in 2017, issued on July 13, 2009 by Wind Acquisition Finance SA and in favour of the subscribers to the Senior Secured Notes, expiring in 2018, issued on November 26, 2010 and issued on April 13, 2012 by Wind Acquisition Finance SA. The guarantees and sureties have been received by WAHF Group from banks and insurance companies on behalf of the WAHF Group and in favour of third parties in respect of commitments of various kinds at the amount approximately EUR 525 million as of 31 December 2012 (2011: EUR 564 million) (USD 693 and USD 730 hereafter in this paragraph at the exchange rate as of 31 December 2012 and 2011 respectively), out of which (a) EUR 22 million (approximately USD 29) (2011: EUR 54 million (approximately USD 70)) issued by insurance companies, of which EUR 14 million (USD 19) (2011:EUR 44 million (USD 57)) in favour of the Rome Tax Revenue Office, as security against the WAHF Group’s excess VAT receivable which was offset in 2008 for EUR 30 million (or USD 39) and in 2009 for EUR 14 million (or USD 18) as part of the special procedure envisaged by Presidential Decree no. 633 of October 26, 1972 and subsequent amendments and (b) EUR 503 million (approximately USD 664) (2011: EUR 510 million (approximately USD 660)) issued by banks, relating to participation in tenders, of which EUR 439 million (USD 579) (2011: EUR 353 million (USD 457)) in favour of the Minister for Economic Development for the participation in the tender procedure it had been awarded the frequency use rights in the 800, 1800, 200 and 2600 MHz bands, to sponsorships, property leases, operations regarding prize competitions, events and excavation licenses.

105
28 Events after the reporting period
Dividends The dividend of USD 0.80 per ADS, which includes payment of USD 0.35 per ADS in relation to the Company’s 2011 final results and USD 0.45 per ADS in relation to the Company’s interim 2012 results, was paid in January 2013 (Note 23).
Significant change in financial liabilities On February 6, 2013, VimpelCom Holdings B.V. issued three Eurobonds for which the proceeds were received on February 13, 2013: USD 1,000 million at 5.95% maturing on February 13, 2023, USD 600 million at 5.20% maturing on February 13, 2019 and RUB 12,000 million (the equivalent of approximately USD 398 million as of February 13, 2013 at the exchange rate of the Central Bank of Russia) at 9.00% maturing on February 13, 2018. The proceeds will be used for repaying existing indebtedness of OJSC VimpelCom and for other general corporate purposes.
WIND Mobile Canada On 18 January 2013 Orascom Telecoms Holdings (OTH) announced that it intends to acquire
full control of WIND Mobile Canada pursuant to an acquisition of the shareholding Wind Canada
indirectly owned by OTH’s partner AAL Corporation. AAL Corporation is controlled by WIND
Mobile Canada Chairman, CEO and Founder Anthony Lacavera. The transaction will leave OTH
with an indirect 99.3% of the WIND Mobile Canada. Completion of the transaction is subject to
certain conditions, including regulatory approval.
As part of the agreement with AAL Corporation, which follows a change in Canadian law to allow
foreign ownership of telecommunications companies, Lacavera will remain with WIND Canada in
a non-operational capacity as Honorary Chair. Amsterdam, 22 March 2013 VimpelCom Ltd. J. Lunder