vijay deshmukh optics express
TRANSCRIPT

8/3/2019 Vijay Deshmukh Optics Express
http://slidepdf.com/reader/full/vijay-deshmukh-optics-express 1/16
Experimental and numerical analysis ontemporal dynamics of polarization switching inan injection-locked 1.55-µm wavelength VCSEL
Vijay Manohar Deshmukh, Seoung Hun Lee, Dong Wook Kim, Kyong Hon Kim,*and Min Hee Lee
Department of Physics, Inha University, Incheon, 402-751, Korea*[email protected]
Abstract: We present experimental and numerical study of temporalcharacteristics of injection-locked polarization switching of a conventional-type 1.55-µm wavelength single-mode vertical cavity surface-emitting laser(VCSEL). Delayed recovery response of the main-mode of the VCSEL wasobserved when short and strong optical injection pulses of an orthogonalpolarization to the VCSEL’s main polarization-mode were applied.Numerical analysis based on a spin-flip model describes that the relativelylong upper level lifetimes compared to a short injection-pulse width andlong cavity photon lifetimes cause delayed recovery response of the main-
mode of the VCSEL. An optimum bias current of the VCSEL was alsoobserved for the shortest recovery time of its free-running polarization modeafter the orthogonal polarization beam pulse injection.
©2011 Optical Society of America
OCIS codes: (140.7260) Vertical cavity surface emitting lasers; (140.3520) Lasers, injection-locked.
References and links
1. M. San Miguel, Q. Feng, and J. Moloney, “Light-polarization dynamics in surface-emitting semiconductorlasers,” Phys. Rev. A 52(2), 1728–1739 (1995).
2. W. L. Zhang, W. Pan, B. Luo, M. Y. Wang, and X. H. Zou, “Polarization switching and hysteresis of VCSELswith time-varying optical injection,” IEEE J. Sel. Top. Quantum Electron. 14(3), 889–894 (2008).
3. J. Martin-Regalado, F. Prati, M. San Miguel, and N. B. Abraham, “Polarization properties of vertical-cavitysurface-emitting lasers,” IEEE J. Quantum Electron. 33(5), 765–783 (1997).
4. A. Dyson and M. J. Adams, “Spin-polarized properties of optically pumped vertical-cavity surface-emitting
lasers,” J. Opt. B Quantum Semiclassical Opt. 5(3), 222–226 (2003).5. A. Gahl, S. Balle, and M. S. Miguel, “Polarization dynamics of optically pumped VCSELs,” IEEE J. Quantum
Electron. 35(3), 342–351 (1999).6. Y. Hong, R. Ju, P. S. Spencer, and K. A. Shore, “Investigation of polarization bistability in vertical-cavity
surface-emitting lasers subjected to optical feedback,” IEEE J. Quantum Electron. 41(5), 619–624 (2005).7. M. Sciamanna and K. Panajotov, “Route to polarization switching induced by optical injection in vertical-cavity
surface-emitting lasers,” Phys. Rev. A 73(2), 023811 (2006).8. J. Danckaert, B. Nagler, J. Albert, K. Panajotov, I. Veretennicoff, and T. Erneux, “Minimal rate equations
describing polarization switching in vertical-cavity surface-emitting lasers,” Opt. Commun. 201(1-3), 129–137(2002).
9. I. Gatare, K. Panajotov, and M. Sciamanna, “Frequency induced polarization bistability in vertical-cavitysurface-emitting lasers with orthogonal optical injection,” Phys. Rev. A 75(2), 023804 (2007).
10. S. Hallstein, J. D. Berger, M. Hilpert, H. C. Schneider, W. W. Rűhle, F. Jahnke, S. W. Koch, H. M. Gibbs, G.Khitrova, and M. Oestreich, “Manifestation of coherent spin precession in stimulated semiconductor emissiondynamics,” Phys. Rev. B 56(12), R7076–R7079 (1997).
11. K. H. Jeong, K. H. Kim, S. H. Lee, M. H. Lee, B. S. Yoo, and K. A. Shore, “Optical injection-inducedpolarization switching dynamics in 1.5-µm wavelength single-mode vertical-cavity surface-emitting lasers,”
IEEE Photon. Technol. Lett. 20(10), 779–781 (2008).12. S. H. Lee, H. W. Jung, K. H. Kim, M. H. Lee, B.-S. Yoo, J. Roh, and K. A. Shore, “1-GHz all-optical flip-flop
operation of conventional cylindrical-shaped single-mode VCSELs under low power optical injection,” IEEEPhoton. Technol. Lett. 22(23), 1759–1761 (2010).
13. A. E. Siegman, Lasers (Univ. Sci. Books, 1986), Chaps. 25 and 13.
#149641 - $15.00 USD Received 21 Jun 2011; revised 2 Aug 2011; accepted 11 Aug 2011; published 15 Aug 2011
(C) 2011 OSA 29 August 2011 / Vol. 19, No. 18 / OPTICS EXPRESS 16934

8/3/2019 Vijay Deshmukh Optics Express
http://slidepdf.com/reader/full/vijay-deshmukh-optics-express 2/16
14. J.-H. Shin, B.-S. Yoo, W.-S. Han, O.-K. Kwon, Y.-G. Ju, and J.-H. Lee, “CW operation and thresholdcharacteristics of all-monolithic InAlGaAs 1.55-µm VCSELs grown by MOCVD,” IEEE Photon. Technol. Lett.14(8), 1031–1033 (2002).
15. M.-R. Park, O.-K. Kwon, W.-S. Han, K.-H. Lee, S.-J. Park, and B.-S. Yoo, “All-monolithic 1.55 µmInAlGaAs/InP vertical cavity surface emitting lasers grown by metal organic chemical vapor deposition,” Jpn. J.Appl. Phys. 45(1), L8–L10 (2006).
1. Introduction
Polarization switching (PS) of VCSELs has been of significant interest of many researchersrecently. Many experimental and theoretical investigations [1–8] have been performed formultimode VCSELs mostly with continuous wave (CW) injection locking technique, butdetailed temporal behavior of the PS in single-mode (SM) VCSEL under short-pulse injectionlocking is not yet uncovered fully.
For digital and analogue communication application, knowledge of temporalcharacteristics of the PS is very important. Besides many advantages of VCSELs over edgeemitting lasers such as low threshold, circular output beam, easy fabrication in 2D structuresand low cost, the polarization property of the VCSEL output is being pursued for potential all-optical switching applications [9,10]. Recently we have observed some temporal delay on therecovered signals after the PS in VCSELs was induced by very short pulse injection [11]. Inaddition, our recent measurement has shown that the temporal delay on the recovered signalsafter the injection-induced PS becomes more significant when the VCSEL chip is moreisotropic in optical gain and cavity geometry and the injection beam is more strong to inducethe polarization switching. It is reported that even cylindrical-shaped VCSELs with a circularsymmetric output aperture have a polarization bistability during change of injection currentwhen the wavelength separation between the main polarization-mode and side-mode is veryclose [12]. The VCSEL’s bistability disappears and the VCSEL lases at a particularly well-defined polarization direction when the wavelengths between the two polarization modes arewell separated due to its asymmetric shape and/or internal birefringence. Even the circularlycylindrical-shaped VCSELs with a well-defined polarization output show a significanttemporal delay on the recovered original polarization mode after the injection-induced PSwhen the injection beam power becomes sufficiently strong compared to the VCSEL’soperating condition at a given bias current. Symmetricity and gain uniformity of the circularlycylindrical-shaped VCSELs vary from chip to chip although the VCSEL chips are taken fromthe same wafer. Therefore, in this paper we have investigated experimentally and numericallythe temporal delay characteristics of the recovered original polarization mode after the optical
pulse injection-induced PS of a SM VCSEL of well-defined polarization output with a well-separated side-mode wavelength.Since the SM VCSEL has one prominent mode depending on the small gain anisotropy
due to birefringence and spatial hole burning in the fundamental transverse mode of its cavity,we let the prominent main mode polarization in X-direction and the other suppressed mode,which has an orthogonal polarization to that of the main mode, in Y-direction. While theVCSEL is emitting a polarized beam in the X-direction, we inject an external pulse injectioninto the Y-direction. This pulse injection causes the VCSEL output switched from the X-polarization to Y-polarization direction during the short pulse period. When the injectionpulse duration becomes very short (in order of shorter than or equal to 50 ps) and its peak power is sufficiently strong, it is observed that a temporal delay occurs in recovery of theoriginal polarization mode after switching. This delay in recovery of the polarization modevaries with various parameters, such as bias current, injection optical power, and detuningbetween the master and slave laser wavelengths, which is explained on the basis of a spin-flip
model (SFM).
2. Experimental setup
The experimental setup used in our measurement is shown in Fig. 1. A distributed feedback laser diode (DFB LD) was used as a tunable master laser whose wavelength was varied bychanging its operating temperature. A conventional-type 1.55 µm-wavelength SM VCSEL
#149641 - $15.00 USD Received 21 Jun 2011; revised 2 Aug 2011; accepted 11 Aug 2011; published 15 Aug 2011
(C) 2011 OSA 29 August 2011 / Vol. 19, No. 18 / OPTICS EXPRESS 16935

8/3/2019 Vijay Deshmukh Optics Express
http://slidepdf.com/reader/full/vijay-deshmukh-optics-express 3/16
was a slave laser which was driven at a fixed bias current of 2.7 mA and maintained at aconstant temperature of 27 °C with a thermoelectric cooler packaged TO-CAN package. Theoutput spectrum of the free-running VCSEL measured with an optical spectrum analyzer(OSA) is shown in Fig. 2, which has the two dominant peaks, each corresponding to thefundamental mode in the X-polarization direction and to the side mode in the Y-polarizationdirection. The X- and Y-polarization peaks were observed at 1553.73 nm and 1554.15 nm,respectively, with a spectral separation of 0.42 nm. The resolution of the OSA used was 0.07
nm. The SMSR (side-mode suppression ratio) was maintained at 30.22 dB for separateddetection of the two polarization-modes with a fiber-type polarization-beam-splitter (PBS)and a digital communication analyzer (DCA, HP 83485A) under polarization control with thepolarization controller PC2. The threshold of this VCSEL was 2.25 mA at the operatingtemperature of 27 °C.
Fig. 1. A schematic diagram of experimental setup. PC: polarization controller, PBS:polarization beam splitter, and DCA: digital communication analyzer.
Fig. 2. Measured optical spectrum of the SM VCSEL in a free running mode, showing the X-and Y-polarization modes.
The L-I characteristics of a stand-alone VCSEL used in this measurent showed that nopolarization switching took place under change of its driving current, thus illustrating noinherent bi-stability in our VCSEL. The CW VCSEL output has a X-polarized mode beam of 44.90 µW power and a Y-polarized mode at 2.27 µW measured with two optical channels of
#149641 - $15.00 USD Received 21 Jun 2011; revised 2 Aug 2011; accepted 11 Aug 2011; published 15 Aug 2011
(C) 2011 OSA 29 August 2011 / Vol. 19, No. 18 / OPTICS EXPRESS 16936

8/3/2019 Vijay Deshmukh Optics Express
http://slidepdf.com/reader/full/vijay-deshmukh-optics-express 4/16
the DCA at a fixed bias current of 2.7 mA with a polarization controller PC2 adjusted to theX-polarization maximum condition when there is no external beam injection. This smallpower ratio between the two polarization outputs may be attributed mainly to the poorpolarization isolation (~18 dB) of the PBS used in our measurement.
For the PS experiment with short-pulse injection, the DFB laser was gain-switched with a500 MHz pulse generator to deliver laser pulses of temporal pulse width 51.70 ps. The peak power of the injection pulses was 189.32 µW. The wavelength of the injection DFB laser was
tuned over 1553.99 nm ~1554.41 nm with its operating temperature control from 11.5°Cthrough 15.8°C. The polarization of the DFB Laser was matched with the side-mode of theVCSEL in the Y-polarization direction using PC1. The power meter connected to the 20%output port of a 80:20 beam splitter monitored the average power of the DFB LD’s injectionpulses. The injection-locked VCSEL output was passed through an optical circulator and theninto the PBS.
The separated X- and Y-polarized outputs from the PBS were analyzed using the opticalinput channels of the DCA. Figure 3 shows the actual pulse traces of the two polarization-mode outputs measured on the DCA. The traces show the delayed X-polarization outputrecovery time of longer than 500 ps after removal of the injection pulse in the orthogonalpolarization direction.
Fig. 3. Measured oscilloscope traces of the X- and Y-polarization outputs of the VCSEL beamfrom the PBS with the DCA at the zero-detuned injection wavelength. The injection pulse hada pulse width of 51.7 ps. (Time scale = 500 ps/DIV, Vertical scale for X-polarized output = 20µW/DIV and that for Y-polarized output is 50 µW/DIV.)
As shown in Figs. 4, 5 and 6, depending on the bias currents of the VCSEL and the opticalinjection powers the different delay time of the main-mode recovery after the polarizationswitching as well as some relaxation oscillation were observed. The amplitude of therelaxation oscillation of the X-polarized output observed during the recovery process after theend of the injection pulse was relatively very small. So, we have considered the rise time of the recovery signal of the X-polarized output as the recovery time of the X-polarized output.The rise time of the recovery signal of the X-polarized output is defined as the time taken bythe X-polarized output to rise from the 10% to 90% of the steady state value of the X-polarized output. To find the origin of the delay in the X-polarization output recovery time,effects of variation of the bias current of the VCSEL and peak power of the injection pulse on
the delay in the recovery time of the X-polarization pulse were studied. Figures 4 and 5 showthe measured traces of X- and Y-polarized intensity outputs for various bias currents of theVCSEL and for various peak powers of the Y-polarized injection pulse, respectively. For aconstant injection peak power of 128.55 µW at the injection wavelength corresponding to theY-polarization peak of VCSEL (1554.15 nm), the polarization recovery time changes from270.1 ps to 266.3 ps, 819 ps, and 922.3 ps as the bias current increases from 3.0 mA to 4.5
#149641 - $15.00 USD Received 21 Jun 2011; revised 2 Aug 2011; accepted 11 Aug 2011; published 15 Aug 2011
(C) 2011 OSA 29 August 2011 / Vol. 19, No. 18 / OPTICS EXPRESS 16937

8/3/2019 Vijay Deshmukh Optics Express
http://slidepdf.com/reader/full/vijay-deshmukh-optics-express 5/16
mA in a step of 0.5 mA. On the other hand, for a constant bias current of 4.5 mA the recoverytime changes from 1012 ps to 922.3 ps, 1341 ps, and 1013 ps as the injection power reducesfrom 182 µW to 127 µW, 82 µW and 55 µW, respectively. While for a constant bias current of 3.5 mA, the recovery time changes from 266.3 ps to 226.8 ps, 282.4 ps, and 235.7 ps as theinjection power reduces from 129 µW to 92 µW, 57 µW and 39 µW, respectively, which isshown in Fig. 6.
The details of the observed phenomena are explained in section 5.
Fig. 4. Variation of recovery time of the X- and Y-polarization-mode output intensities (yellowand violet color traces, respectively) with the bias current of the VCSEL at a constant injectionpower of 127 µW at the injection wavelength corresponding to the Y-polarization peak of 1554.15 nm. (Time scale = 500 ps/DIV, Vertical scale = 20 µW/DIV, the X-polarized output
offset was adjusted to (a) −50 µW, (b) −25 µW, (c) 0 µW and (d) + 25 µW for the VCSEL biascurrents of (a) 3.0 mA, (b) 3.5 mA, (c) 4.0 mA and (d) 4.5 mA, respectively). The marks “Xoff’ indicate the zero-levels of the X-polarization output intensities which correspond the uppertraces (yellow color).
3. Theoretical background
For numerical analysis of the temporal characteristics of the PS action in VCSELs, thetheoretical model given by Miguel, Feng and Molony [1] has been used. This model isextended for study of the time-varying optical injection effect into the orthogonal Y-polarizedmode (i.e. side mode) of a VCSEL output at detuned injection wavelength [2].
The output beam of a VCSEL without an external optical beam injection is constant intime under a constant continuous wave (CW) driving current, and the normalized electricalfield values of the optical beam intensity are taken as Ex = 1 for the X-polarization mode andEy = 0 for the Y-polarization mode. The injection pulse is modeled as a Gaussian-shapedpulse of 50 ps FWHM pulse width which is injected at a time of 0 ns.
#149641 - $15.00 USD Received 21 Jun 2011; revised 2 Aug 2011; accepted 11 Aug 2011; published 15 Aug 2011
(C) 2011 OSA 29 August 2011 / Vol. 19, No. 18 / OPTICS EXPRESS 16938

8/3/2019 Vijay Deshmukh Optics Express
http://slidepdf.com/reader/full/vijay-deshmukh-optics-express 6/16
Fig. 5. Temporal variation of the X- and Y-polarization-mode output intensities (yellow andviolet color traces, respectively) of the SM VCSEL under a Y-polarization pulse beam injectionof various peak powers ((a)~(d)) at a constant bias current of 4.5 mA. (Time scale = 500ps/DIV, Vertical scale = 20 µW/DIV.) P
inj: Injected power in µW. The offset for X-polarized
output power was adjusted to 25 µW. The marks “X off’ indicate the zero-levels of the X-polarization output intensities which correspond the upper traces (yellow color).
Fig. 6. Temporal variation of the X- and Y-polarization-mode output intensities (yellow andviolet color traces, respectively) of the SM VCSEL under a Y-polarization pulse beam injectionof various peak powers ((a)–(d)) at a constant bias current of 3.5 mA. (Time scale = 500ps/DIV, Vertical scale = 20 µW/DIV.), Pinj: Injection pulse power in µW. The marks “X off’indicate the zero-levels of the X-polarization output intensities which correspond the uppertraces (yellow color).
The rate equations for the electrical fields of the X- and Y-polarizations, the excited
population and the population difference between spin-up and spin down radiation channelsare as follows [2]:
( )( ) ( )1 x
x x y a p x sp x
dE = k + jα NE E + jnE γ + jγ + j ∆ω E + β ξ
dt − − (1)
#149641 - $15.00 USD Received 21 Jun 2011; revised 2 Aug 2011; accepted 11 Aug 2011; published 15 Aug 2011
(C) 2011 OSA 29 August 2011 / Vol. 19, No. 18 / OPTICS EXPRESS 16939

8/3/2019 Vijay Deshmukh Optics Express
http://slidepdf.com/reader/full/vijay-deshmukh-optics-express 7/16
( )( ) ( )1 y
y x a p y sp y inj inj
dE = k + jα NE E jnE + γ + jγ j ∆ω E + β ξ +k E
dt − − − (2)
( ) ( )1e e e y x x y
dN = γ N + P + γ µ jγ n E E E E
dt − − − (3)
( )* *s e e y x x ydn n nP j n E E E E
dt γ γ γ = − − − − (4)
Here, E x and E y are the complex amplitudes of the VCSEL output at X- and Y-polarizationdirections, respectively. N and n are the total population inversion and the difference betweenthe population inversions for spin-up and spin-down radiation channels, respectively. k is thedecay rate of the electric field in the VCSEL cavity. α is the linewidth enhancement factor. β sp is the strength of the spontaneous emission. µ is the normalized injection current ( µ = 1 forthreshold). P = | E x|
2+ | E y|
2is the normalized output power. ξ x and ξ y are independent Gaussian
white noise sources with a zero mean and a unit variance in the X- and Y-polarizationdirections, respectively. E inj is the electric field amplitude of the injection beam, which ismodeled as a Gaussian-shaped time-dependent pulse. ∆ω is the frequency detuning betweenthe master laser (DFB-LD) and the suppressed Y-polarization mode of the slave VCSEL. k inj is the coupling coefficient of the injection beam into the VCSEL. γa is the linear dichroism, γp
is the linear birefringence, γe is the decay rate of the total population inversion N , and γs is thespin-flip rate.In order to find the proper value of k inj, the X-polarized intensity is plotted for various
values of k inj at k = 25 ns−1
and γa = −1.25 ns−1
, and the result is shown in Fig. 7. It is foundthat when k inj = k , calculated values for the X-polarized intensity and other parameters, such asthe turn-off pulse width of the X-polarized output and the turn-on pulse width of the Y-polarized intensity, are close to the experimentally measured values. Thus, the value of k inj istaken to be equal to k as in Refs [2] and [3].
Fig. 7. Variation of the X-polarized intensity versus time for various values of k inj in ns−1 at k =
25 ns−1.
The value of birefringence (γp) is a half of the frequency difference value between the twospectral modes of the VCSEL [3]. So the two spectral mode separation was measured to be0.42 nm from the observed VCSEL’s output spectrum, and thus γp was calculated as 26.09
ns−1
. Since our VCSEL showed no polarization switching for change of its driving currentonly, the normalized bias current for the VCSEL with respect to the threshold current waskept constant at 1.2, i.e. at 2.7 mA. Other constants used are explained in Table 1 below.
#149641 - $15.00 USD Received 21 Jun 2011; revised 2 Aug 2011; accepted 11 Aug 2011; published 15 Aug 2011
(C) 2011 OSA 29 August 2011 / Vol. 19, No. 18 / OPTICS EXPRESS 16940

8/3/2019 Vijay Deshmukh Optics Express
http://slidepdf.com/reader/full/vijay-deshmukh-optics-express 8/16
Table 1. Parameter Values used in Theoretical Analysis
Symbol Quantity Value References
Field decay rate 25 ns−1 [3] & Fig. 9
α Line width enhancement factor 3 [2]
eγ Decay rate of total population N 5 ns−1 Fig. 8
sγ Spin flip rate 50 ns−1 [9]
pγ Linear birefringence −26.09 ns−1 Fig. 2 & [3]
aγ Linear dichroism −1.25 ns−1
[3] & Fig. 8
sp β Strength of spontaneous emission 10−5
[2]
injk Coupling coefficient 25 ns−1 [3]
The effect of variation of γa and γe on the VCSEL’s polarization output intensity is studied,and the results are shown in Fig. 8.
Fig. 8. Temporal intensity variation of the X- and Y-polarization-mode outputs (black and redcolors, respectively) of the SM VCSEL under a Y-polarization pulse beam injection for variousvalues of the linear dichroism (γa) and carrier decay rate (γe).
γa is related to the power difference between the X- and Y-polarization mode outputs.
When this difference is very small, it is very easy to switch the polarization output. Since γe isthe decay rate of the total excited population, its effect can be seen as the output intensitymeasured on the DCA.
For small γa value, as γe increases (i.e. the carrier decay time decreases), the polarizationswitching takes place more easily [Figs. 8(a), 8(b) and 8(c)] and the polarization recoverytime for the X-polarized output increases. On the other hand, for a large γa value, we need a
#149641 - $15.00 USD Received 21 Jun 2011; revised 2 Aug 2011; accepted 11 Aug 2011; published 15 Aug 2011
(C) 2011 OSA 29 August 2011 / Vol. 19, No. 18 / OPTICS EXPRESS 16941

8/3/2019 Vijay Deshmukh Optics Express
http://slidepdf.com/reader/full/vijay-deshmukh-optics-express 9/16
short decay time (i.e. a large decay rate γe) to ensure the polarization switching and shorter X-polarized output recovery time. Under the pulse injection of an orthogonal polarization mode,the VCSEL’s output polarization is switched temporarily, and as soon as injection pulse isover, it switches back to the initial polarization conditions.
In our case, we use a single-mode VCSEL. Therefore, the value of γa is taken as
1.251
aγ = ns
−
− , and from consideration of the X-polarization mode as a dominant
fundamental mode, the value of γa is taken negative [3].The optimum value of inverse of the photon life-time is calculated, by using variousvalues of the field decay rate (also called as inverse of the photon lifetime, which is given by1/2k ) [3]. From Fig. 9, it is clear that, when the photon life-time is close to the spin flip time,the relaxation oscillation is the minimum and the numerically calculated parameters matchwith those experimentally measured. Hence, the value of the field decay rate, for our VCSEL,
is chosen as 25 ns−1for the analysis of X- and Y-polarized output variation with wavelength
detuning from the peak value of its Y-polarized output.
Fig. 9. Variation of the X-polarization mode intensity of the VCSEL output under a pulsed Y-
polarization beam injection for various field decay rates at a fixed spin-flip rate of 50 ns −1. The
photon life time is calculated as (1/2k ), where k is field decay rate in ns −1.
4. Comparison of numerically calculated and experimentally measured results
4.1 Effect of wavelength detuning
When the injection beam wavelength is detuned from the side-mode wavelength of the SMVCSEL, the VCSEL’s X- and Y-polarization mode outputs are analyzed numerically usingEqs. (1) through (4) and the parameters shown in Table 1.
#149641 - $15.00 USD Received 21 Jun 2011; revised 2 Aug 2011; accepted 11 Aug 2011; published 15 Aug 2011
(C) 2011 OSA 29 August 2011 / Vol. 19, No. 18 / OPTICS EXPRESS 16942

8/3/2019 Vijay Deshmukh Optics Express
http://slidepdf.com/reader/full/vijay-deshmukh-optics-express 10/16
Fig. 10. Comparison of experimentally observed oscilloscope traces and numerically calculatedplots of the X- and Y-polarization beam dynamics of a SM VCSEL under short pulse injectionof a Y-polarization mode beam at various detuning wavelengths. The injection pulse width is51.70 ps and its peak power is 129 µW. For numerically calculated plots, the injection pulse
width is considered as 50 ps. γa is taken as −1 ns−1 for Figs. (g) through (l) and as −1.25 ns−1 forFigs. (m) through (r).
#149641 - $15.00 USD Received 21 Jun 2011; revised 2 Aug 2011; accepted 11 Aug 2011; published 15 Aug 2011
(C) 2011 OSA 29 August 2011 / Vol. 19, No. 18 / OPTICS EXPRESS 16943

8/3/2019 Vijay Deshmukh Optics Express
http://slidepdf.com/reader/full/vijay-deshmukh-optics-express 11/16
Figure 10 shows comparison of numerically calculated and experimentally observedresults for the X- and Y-polarized beam intensity dynamics of the SM VCSEL under anexternal pulse injection in the Y-polarization direction at various detuned wavelengths. Themeasured and calculated results indicate that strong polarization switching occurs at thedetuned wavelengths of the injection laser beam from 0 to 0.08 nm. However, when the
injection beam is detuned to shorter wavelengths toward ∆λ = −0.08 nm, the polarizationswitching mechanism becomes suppressed. The calculated results match well with the
measured ones for γa = −1.25 ns−1.
4.2 Pulse width variation
Figure 11(a) shows comparative plots of the measured and calculated pulse widths (FullWidth at Half Maximum; FWHM) of the X-polarization output turn-off pulse as functions of the injection wavelength detuning from the Y-polarization peak wavelength, while Fig. 11(b)shows those for the Y-polarization turn-on output pulses. The two different calculation results
are plotted for the linear dichroisms of −1.0 ns−1
and −1.25 ns−1
. The calculated and measuredturn-off pulse widths of the X-polarization output pulse show a similar trend. The calculatedturn-on pulse width plot of the Y-polarization pulse output as a function of the wavelengthdetuning shows a similar trend to the measured results, but it is shifted toward a longwavelength side compared to the measured one.
Fig. 11. Comparison of the measured and calculated (a) turn-off pulse widths of the X-polarization output and (b) turn-on pulse widths of Y-polarized output as functions of theinjection wavelength detuning from the Y-polarization peak wavelength of the VCSEL. Black lines with open squares represent experimental results, red lines with open circles represent
numerically calculated results for γa = −1 ns−1, and blue lines with open triangles represent
numerically calculated results for γa = −1.25 ns−1.
4.3 Intensity variation
Figures 12(a) and 12(b) show the measured and calculated intensities of the turn-off pulseminimum of the X-polarization output and those of the turn-on pulse maximum of the Y-polarization output pulse, respectively, as functions of wavelength detuning from the Y-polarization output’s spectral peak. The intensity values are taken in a normalized linear unitwhich is obtained by dividing the each intensity value by the maximum output intensity
obtained during the wavelength detuning from −0.16 nm to 0.26 nm.The numerically calculated results shown in Figs. 12(a) and 12(b) indicate similar trends
to the experimentally measured results though their shapes do not match exactly to each other.
Both of the numerical and experimental results show that detuning of the injection beamwavelength to slightly longer wavelength side than the Y-polarization spectral peak of theVCSEL allows strong polarization switching. This phenomena may be explained with the factthat the excited electrons are likely to be more populated in lower levels of the conductionband and the holes are likely to be more populated in upper levels of the valence band.
#149641 - $15.00 USD Received 21 Jun 2011; revised 2 Aug 2011; accepted 11 Aug 2011; published 15 Aug 2011
(C) 2011 OSA 29 August 2011 / Vol. 19, No. 18 / OPTICS EXPRESS 16944

8/3/2019 Vijay Deshmukh Optics Express
http://slidepdf.com/reader/full/vijay-deshmukh-optics-express 12/16
Fig. 12. Comparison of the measured and calculated (normalized) intensities of (a) the turn-off pulse minimum of the X-polarization output and (b) the turn-on pulse maximum of the Y-polarization output of the VCSEL as functions of wavelength detuning from the Y-polarizationoutput’s spectral peak. Black lines with open squares represent experimental results, red lines
with open circles represent numerically calculated results for γa = −1 ns−1, and blue lines with
open triangles represent numerically calculated results for γa = −1.25 ns−1.
5. Discussion
5.1 Spin flip modelThe spin-flip model (Fig. 13) considers magnetic sublevels of the conduction electron bandand the valance hole band [5]. The electron transition from the conduction band to the heavyhole state is 3 times more probable than that from the conduction band to the light hole state[4]. Therefore, the transition to the light hole state is neglected in our analysis. We alsoassume that the spin relaxation of holes are instantaneous, and hence the time taken for theholes’ spin relaxation can be neglected.
Fig. 13. Band structure of a quantum well and selection rules.
When there is a transition from the upper + 1/2 (electron’s spin up) state to the lower + 3/2(heavy hole) state corresponding ∆J = + 1, a left circularly polarized light is emitted, while,
for the transition from the upper −1/2 (electron’s spin down) state to the lower −3/2 (heavyhole) state corresponding ∆J = −1, a right circularly polarized light is emitted [3].
The output light is combination of the left- and right-circularly polarized lights, giving aplane polarized light. The complex amplitudes of the plane polarized light in terms of thecircularly polarized lights are given by,
#149641 - $15.00 USD Received 21 Jun 2011; revised 2 Aug 2011; accepted 11 Aug 2011; published 15 Aug 2011
(C) 2011 OSA 29 August 2011 / Vol. 19, No. 18 / OPTICS EXPRESS 16945

8/3/2019 Vijay Deshmukh Optics Express
http://slidepdf.com/reader/full/vijay-deshmukh-optics-express 13/16
2
E E E x
++ −
= (5)
2
E E E i y
−−+
= − (6)
Since we are observing the VCSEL’s output light intensity in either the X- or Y-polarizationmode, we consider only the plane polarized light for our analysis.
5.2 Effect of Y-polarized pulse injection on the X- and Y-polarized outputs of the VCSEL
As an initial condition, we consider that the X-polarized light is emitted as the fundamentalmode while the Y-polarized light as a side mode. The side-mode suppression ratio is highenough (30.22 dB in our case) so that we can neglect the intensity of the Y-polarized light. Itcan be understood as the complex amplitudes of the right- and left-circularly polarized lightare equal (E+ = E-) i.e. the spin-up and spin-down populations at the conduction band are thesame. The above equation indicates that the X-polarized beam intensity is twice of the left- orright-circularly polarized intensity, and is taken as 1 (normalized), while the Y-polarizedintensity is considered as zero, for numerical calculations. When we inject an external Y-polarized light, it increases the difference between right and left circularly polarized lightamplitudes. The injected light disturbs the distribution of the spin-down and spin-up
populations. Let us consider a situation where the spin-up population is swiped out by theinjection, and the spin-down is untouched. (Even the opposite situation can take place.) As thetotal population in the conduction band is decreased, it gives reduction in the X-polarizedbeam intensity, while increase in the Y-polarization beam intensity.
When the injection pulse is over or after the spin-flip time, the spin-down population flipsback into the spin-up state. This tries to equalize the population distributions. However, if theinjection pulse is longer than the spin-relaxation time, then the flipped spin-up electrons areswiped out by the injection pulse. This again increase the Y-polarization beam intensity andthe output Y-polarized beam pulse is temporally expanded as compared with the injectedpulse. Figure 14 illustrates the temporal variations of the X- and Y-polarization beamintensities, the total population inversion variation, and the difference variation between thepopulation inversions for spin-up and spin-down radiation channels under injection of a 50-pspulse in the Y-polarization direction at the time zero. Flipping of the spin polarization fromone state to the other can be expected from the temporal oscillation of the population
inversion difference between the spin-up and spin-down radiation channels shown inFig. 14(d). Thus, the relaxation oscillations in the X- and Y-polarization output intensities areexpected from the spin-polarization flipping dynamics.
Once the injection pulse is over, the population inversion starts to build up. The decay rate
of total population is of the order of 1 ns −1[1]. The X-polarization beam intensity regains its
steady-state value after some time which is comparable to the cavity build-up time. The cavitybuildup time is related to the recovery time of the excited state population inversion which issubstantially longer than the photon lifetime t c [13]. The photon lifetime can be calculated ast c = t RT /(1 – R1 R2) assuming no other loss except the mirror reflectivities, where t RT is theround trip time of photons in the laser cavity and R1 and R2 are the reflectivities of two cavitymirrors, respectively [13]. Since the cavity round trip time t RT is expressed as t RT = 2nd /c withrefractive index of n of the cavity medium, cavity length of d , and the speed of light in a freespace c. The laser cavity parameters of the cavity length and mirror reflectivities of ourVCSEL are listed in Refs [14] and [15]. The cavity length d is about 10 µm whichcorresponds approximately to the separation between the middle of the top and bottomdistributed Bragg reflectors (DBRs), and R1 = 0.999 and R2 = 0.9983 for the DBRs. Thephoton lifetime is calculated to be about an order of 90 ps which is longer than the injectionpulse width. Thus, the build-up time of the X-polarization recovery is longer than the photonlifetime, and the delay recovery is observed as shown in Fig. 3. The photon lifetime calculated
#149641 - $15.00 USD Received 21 Jun 2011; revised 2 Aug 2011; accepted 11 Aug 2011; published 15 Aug 2011
(C) 2011 OSA 29 August 2011 / Vol. 19, No. 18 / OPTICS EXPRESS 16946

8/3/2019 Vijay Deshmukh Optics Express
http://slidepdf.com/reader/full/vijay-deshmukh-optics-express 14/16
from the cavity length and mirror reflectivities is approximately four times greater than theobtained photon lifetime from Fig. 9 from comparison of the experimentally observed resultsand numerically calculated plots. We can expect two major causes for this difference. One ispotentially different mirror reflectivities of the Bragg reflectors because they vary slightlyfrom batch to batch even through a same wafer fabrication recipe is used. The other one ispotential variation of the mirror reflectivities as well as the refractive index of the cavitymaterials during the external laser beam injection because the injection beam changes the
carrier distributions in the semiconductor materials. The injection beam may lower the mirrorreflectivities or/and reduce the effective cavity length, which results in a shortened photonlifetime.
-1 0 1 2 3 4 5
0.0
0.1
0.2
0.3
0.4
(d)(c)
(b)
E2
x
(a)
-1 0 1 2 3 4 5
0.0
0.1
0.2
0.3
0.4
E2
y
-1 0 1 2 3 4 5
0.8
0.9
1.0
1.1
1.2
Time in ns
N
Time in ns-1 0 1 2 3 4 5
-0.04
-0.02
0.00
0.02
0.04
n
Fig. 14. Intensity variations of the (a) X-polarization and (b) Y-polarization modes, (c) the totalpopulation inversion variation, and (d) the difference variation between the populationinversions for spin-up and spin-down radiation channels, all as functions of time, under a 50-pspulse injection in the Y-polarization direction at time zero. The scales on the Y-axes are innormalized linear units.
For a Y-polarized injection beam close the zero wavelength detuning (i.e. for the injectionbeam at the side-mode wavelength of the VCSEL), almost all the carriers from the conductionband are removed. This situation is similar to when the VCSEL is not driven with any currentbefore the current supply is turned on. Thus, once the injection beam is removed ( i.e. thesituation similar to VCSEL current supply is turned on), the carrier build-up starts to takeplaces through a relaxation oscillation. This phenomena can be seen in Fig. 3.
5.3 X-polarized output recovery time versus VCSEL bias current and Y-polarized injection pulse power
The recovery time of the X-polarized output of the VCSEL shown in Figs. 4 and 5 is plottedagainst its bias current and the peak power of the Y-polarized injection pulse at the Y-polarized output peak wavelength (i.e. at the zero-detuning wavelength) and are shown inFigs. 15(a) and 15(b), respectively.
#149641 - $15.00 USD Received 21 Jun 2011; revised 2 Aug 2011; accepted 11 Aug 2011; published 15 Aug 2011
(C) 2011 OSA 29 August 2011 / Vol. 19, No. 18 / OPTICS EXPRESS 16947
8/3/2019 Vijay Deshmukh Optics Express
http://slidepdf.com/reader/full/vijay-deshmukh-optics-express 15/16
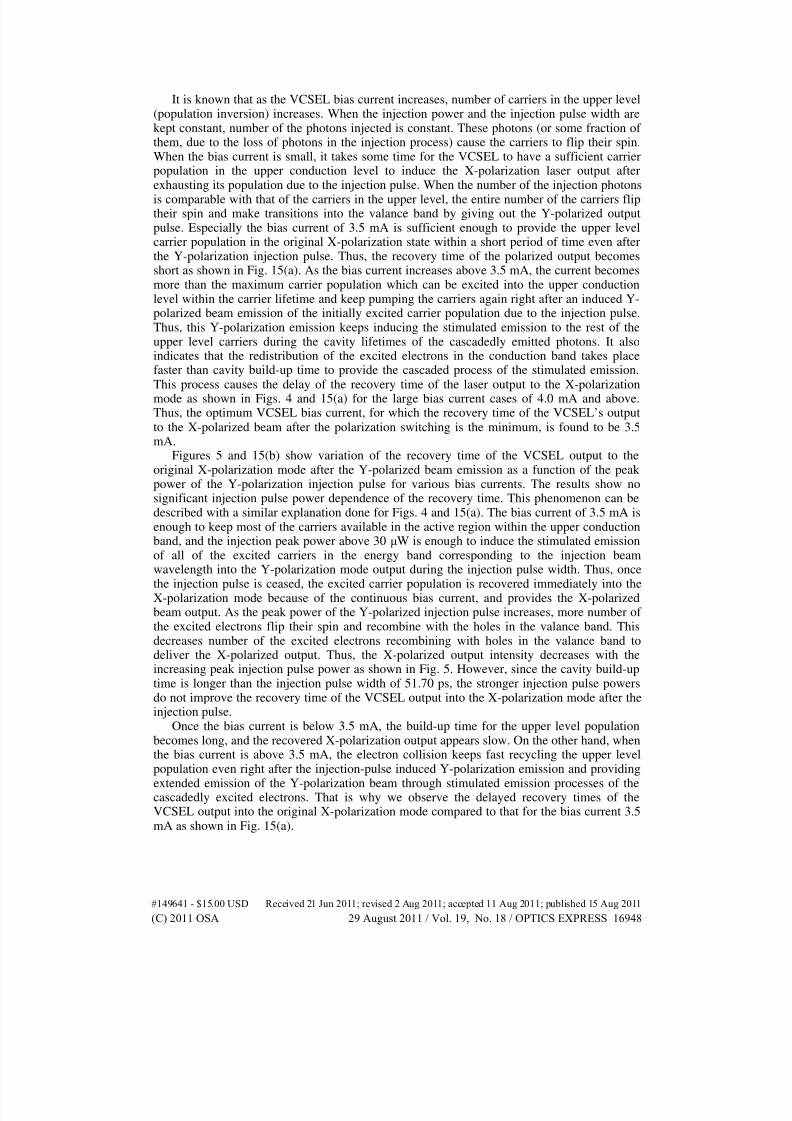
It is known that as the VCSEL bias current increases, number of carriers in the upper level(population inversion) increases. When the injection power and the injection pulse width arekept constant, number of the photons injected is constant. These photons (or some fraction of them, due to the loss of photons in the injection process) cause the carriers to flip their spin.When the bias current is small, it takes some time for the VCSEL to have a sufficient carrierpopulation in the upper conduction level to induce the X-polarization laser output afterexhausting its population due to the injection pulse. When the number of the injection photons
is comparable with that of the carriers in the upper level, the entire number of the carriers fliptheir spin and make transitions into the valance band by giving out the Y-polarized outputpulse. Especially the bias current of 3.5 mA is sufficient enough to provide the upper levelcarrier population in the original X-polarization state within a short period of time even afterthe Y-polarization injection pulse. Thus, the recovery time of the polarized output becomesshort as shown in Fig. 15(a). As the bias current increases above 3.5 mA, the current becomesmore than the maximum carrier population which can be excited into the upper conductionlevel within the carrier lifetime and keep pumping the carriers again right after an induced Y-polarized beam emission of the initially excited carrier population due to the injection pulse.Thus, this Y-polarization emission keeps inducing the stimulated emission to the rest of theupper level carriers during the cavity lifetimes of the cascadedly emitted photons. It alsoindicates that the redistribution of the excited electrons in the conduction band takes placefaster than cavity build-up time to provide the cascaded process of the stimulated emission.This process causes the delay of the recovery time of the laser output to the X-polarizationmode as shown in Figs. 4 and 15(a) for the large bias current cases of 4.0 mA and above.Thus, the optimum VCSEL bias current, for which the recovery time of the VCSEL’s outputto the X-polarized beam after the polarization switching is the minimum, is found to be 3.5mA.
Figures 5 and 15(b) show variation of the recovery time of the VCSEL output to theoriginal X-polarization mode after the Y-polarized beam emission as a function of the peak power of the Y-polarization injection pulse for various bias currents. The results show nosignificant injection pulse power dependence of the recovery time. This phenomenon can bedescribed with a similar explanation done for Figs. 4 and 15(a). The bias current of 3.5 mA isenough to keep most of the carriers available in the active region within the upper conductionband, and the injection peak power above 30 µW is enough to induce the stimulated emissionof all of the excited carriers in the energy band corresponding to the injection beamwavelength into the Y-polarization mode output during the injection pulse width. Thus, once
the injection pulse is ceased, the excited carrier population is recovered immediately into theX-polarization mode because of the continuous bias current, and provides the X-polarizedbeam output. As the peak power of the Y-polarized injection pulse increases, more number of the excited electrons flip their spin and recombine with the holes in the valance band. Thisdecreases number of the excited electrons recombining with holes in the valance band todeliver the X-polarized output. Thus, the X-polarized output intensity decreases with theincreasing peak injection pulse power as shown in Fig. 5. However, since the cavity build-uptime is longer than the injection pulse width of 51.70 ps, the stronger injection pulse powersdo not improve the recovery time of the VCSEL output into the X-polarization mode after theinjection pulse.
Once the bias current is below 3.5 mA, the build-up time for the upper level populationbecomes long, and the recovered X-polarization output appears slow. On the other hand, whenthe bias current is above 3.5 mA, the electron collision keeps fast recycling the upper levelpopulation even right after the injection-pulse induced Y-polarization emission and providing
extended emission of the Y-polarization beam through stimulated emission processes of thecascadedly excited electrons. That is why we observe the delayed recovery times of theVCSEL output into the original X-polarization mode compared to that for the bias current 3.5mA as shown in Fig. 15(a).
#149641 - $15.00 USD Received 21 Jun 2011; revised 2 Aug 2011; accepted 11 Aug 2011; published 15 Aug 2011
(C) 2011 OSA 29 August 2011 / Vol. 19, No. 18 / OPTICS EXPRESS 16948

8/3/2019 Vijay Deshmukh Optics Express
http://slidepdf.com/reader/full/vijay-deshmukh-optics-express 16/16
Fig. 15. (a) Recovery time of the X-polarization output as a function of the VCSEL bias currentat various peak powers of the Y-polarized injection pulse and (b) recovery time for the X-polarization output as a function of peak power of the Y-polarized injection pulse at variousVCSEL bias currents.
6. Conclusion
We have studied temporal dynamics of polarization switching of a single-mode VCSEL under
injection of short laser pulses of an orthogonal polarization direction to its free-running outputpolarization mode. The short pulse injection beam was obtained from a gain-switched DFB-LD and its wavelength is tuned by changing its operation temperature. The peak intensity andpulse width of the polarization-switched pulses as well as the recovery time of the returningsignals of the original free-running polarization-mode of the VCSEL were measuredexperimentally and calculated numerically for various detuned injection wavelengths from theside-mode beam wavelength of the VCSEL in the orthogonal polarization direction. Bothcalculated and measured results show similar trends except slight discrepancy in their detaileddependencies on the injection beam’s wavelengths. The difference between the numerical andexperimental results may be due to several reasons like dependence of the birefringence anddichroism of the VCSEL on injection intensity, spectral/spatial hole burning, and difficulty inmatching the polarization of the injection pulse with the side-mode polarization of the VCSELin the actual experiment. The loss of the injection beam’s power at the DBR layers of theVCSEL itself and the detector response have not been included in our numerical simulation,
which may be included in further elaborate analyses. The recovery time of the SM VCSEL toits original free-running polarization mode after polarization switching due to injection pulsesof an orthogonal polarization mode has also been studied for various bias currents andinjection pulse powers. The results indicate that there is an optimum bias current for the givenVCSEL to deliver fastest polarization recovery time.
Acknowledgments
This work was supported by the Basic Science Research Programs through the NationalResearch Foundation of Korea (NRF) funded by the Korean Ministry of Education, Scienceand Technology under Grants 2009-0073617 and 2009-0084514. The authors gratefully thank Drs. Byeung-Soo Yoo and Jay Roh of Raycan Co., Ltd. for providing us the VCSELs.
#149641 - $15.00 USD Received 21 Jun 2011; revised 2 Aug 2011; accepted 11 Aug 2011; published 15 Aug 2011
(C) 2011 OSA 29 August 2011 / Vol. 19, No. 18 / OPTICS EXPRESS 16949