vermillion river watershed joint powers organization wenck fish sampling final report...p.o. box 249...
TRANSCRIPT

Vermillion River 2009 Fish Community
Monitoring Report
Prepared for
Vermillion River Watershed Joint
Powers Organization
November 2009

Wenck File #1305-13
Prepared for:
VERMILLION RIVER WATERSHEDJOINT POWERS ORGANIZATION
Vermillion River2009 Fish Community
Monitoring Report
Prepared by:
WENCK ASSOCIATES, INC.1800 Pioneer Creek Center
P.O. Box 249Maple Plain, Minnesota 55359-0249
(763) 479-4200
November 2009
T:\1305 Vermillion\13 Fish Monitoring Project\Report\Final Report\2009 Fish Community Monitoring Report_final.doc
1-1
Table of Contents
1.0 INTRODUCTION ........................................................................................................... 1-1
2.0 STREAM FISH MONITORING ................................................................................... 2-1
2.1 Field Reconnaissance and Reach Determination................................................. 2-2 2.2 Fish Community Monitoring ............................................................................... 2-4
3.0 MONITORING RESULTS ............................................................................................ 3-1
3.1 Fish Community Summary Information.............................................................. 3-1 3.2 IBI Calculations ................................................................................................... 3-2
4.0 CONCLUSIONS AND RECOMMENDATIONS ........................................................ 4-1
5.0 REFERENCES ................................................................................................................ 5-1
TABLES
1 Sample Reach Information for the Seven Stream Fish Monitoring Sites. 2 Electrofishing Methods, Sample Date and Total Fishing Time. 3 General Fish Community Sampling Results. 4 Warmwater and Coldwater IBI Scoring for Stream Monitoring Sites
FIGURES
1 Stream Monitoring Sites in the Vermillion River Watershed 2 Stream Monitoring Site A1 3 Stream Monitoring Site A3 4 Stream Monitoring Site A4 5 Stream Monitoring Site A7 6 Stream Monitoring Site A10 7 Stream Monitoring Site A11 8 Stream Monitoring Site A14
APPENDICES A Field Photos B MN DNR Special Survey Permit No. 15932 C Stream Fish Field Monitoring Sheets D Species Summary Table E Trout Collections Summary Table F IBI Scoring: Warmwater and Coldwater Metrics and Calculations
T:\1305 Vermillion\13 Fish Monitoring Project\Report\Final Report\2009 Fish Community Monitoring Report_final.doc
1-1
1.0 Introduction
The Vermillion River Watershed covers approximately 335 square miles in Scott and Dakota
Counties in Minnesota and contains reaches designated as either warmwater or coldwater stream
fish communities . The Vermillion River Watershed Joint Powers Organization (VRWJPO) is
tasked with developing policies and programs that protect and improve water resources within
the watershed. In the summer of 2008 the VRWJPO developed a biological monitoring plan as a
means to assess and track biological health throughout the watershed. The biological monitoring
plan described goals and objectives for monitoring aquatic macroinvertebrate and fish
community health as well as assessing the existing stream habitat and geomorphology in the
watershed.
Because the Vermillion River Watershed contains stream reaches that are designated as both
warmwater and coldwater fish communities, the VRWJPO is interested in determining the
appropriate means for assessing the fish community health in both warmwater and coldwater
reaches as well as establishing appropriate management goals for each community type. The
Index of Biotic Integrity (IBI) is a useful tool that has been developed for assessing the overall
health of a stream by monitoring some aspect of the biological community. IBIs have been
developed for both warmwater and coldwater stream fish communities. The Minnesota
Department of Natural Resources (MN DNR) is currently coordinating with the VRWJPO on the
IBI monitoring. The VRWJPO has expanded their IBI monitoring program to monitoring sites in
addition to what MN DNR personnel are currently providing.
In the spring of 2009, the VRWJPO established a contract with Wenck Associates, Inc. (Wenck)
to assist with the fish sampling portion of the biological monitoring program at seven established
stream monitoring sites within the watershed that included reaches designated as either coldwater
and warmwater stream fish communities. One of the objectives of the 2009 biological

T:\1305 Vermillion\13 Fish Monitoring Project\Report\Final Report\2009 Fish Community Monitoring Report_final.doc
1-2
monitoring program are to collect fish community data from each of the identified reaches,
determine the status of the existing fish community health through the application of IBI metrics
to the fish community data, and to assist the VRWJPO with the development of attainable
management objectives for the different stream fish communities within the watershed.

T:\1305 Vermillion\13 Fish Monitoring Project\Report\Final Report\2009 Fish Community Monitoring Report_final.doc
2-1
2.0 Stream Fish Monitoring
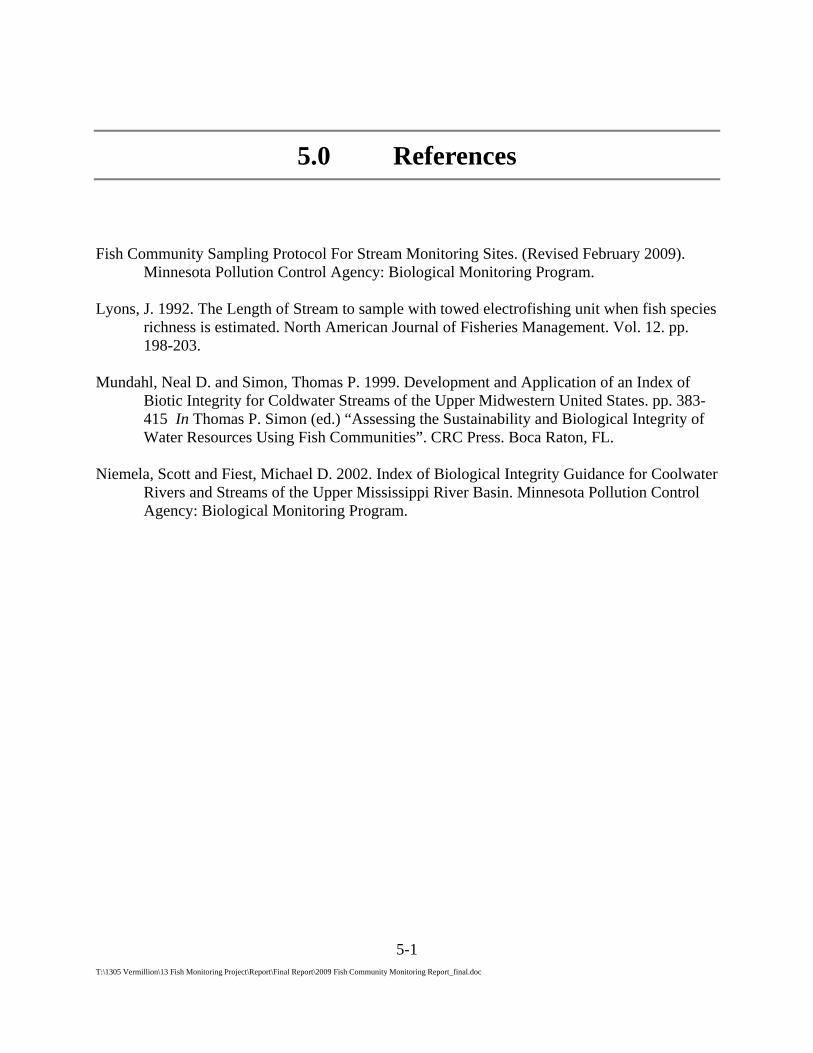
Seven stream monitoring sites were identified by the VRWJPO for inclusion in the 2009 fish
community monitoring project (Figure 1). The seven monitoring sites include three reaches (sites
A1, A3, and A7) that are designated as coldwater fish communities (class 2A waters). The four
remaining reaches (sites A4, A10, A11 and A14) contain warmwater fish communities (class 2B
waters). Additionally there are four reaches that are designated as trout streams by the MN DNR,
sites A1, A3, A7, A10. The MN DNR designate trout streams based on set of criteria. If a reach
is designated a trout stream then the trout stream designation is carried out for that reach and its
tributaries to the end of the section the stream is located within. As a result, it is possible for a
warmwater tributary to a coldwater stream to be designated as a trout stream by the MN DNR.
The Minnesota Pollution Control Agency (MPCA) has developed an IBI for warmwater rivers
and streams of Upper Mississippi River Basin (Niemela and Fiest, 2002). The MPCA IBI
provides the necessary protocols for stream fish monitoring including: defining the sampling
reach needed; identifying an index period for fish community monitoring; describing survey
methods required for different size streams; and establishing metrics for calculating IBI scores
from the collected data.
The MPCA has not developed an IBI for coldwater streams in Minnesota. However, an IBI for
coldwater streams in the Upper Midwest has been developed (Mundahl and Simon, 1998). This
coldwater IBI was developed from a variety of collection records from various agencies and
individuals across the Midwest. The IBI does not detail field methods and requirements to the
same extent provided in the MPCA warmwater IBI. However, the main collection method for
both the coldwater and warmwater IBIs are through stream electrofishing. As a result, the field
methods, including reach determination, sampling methods and data collections, for the all
reaches in 2009 fish community monitoring study in the Vermillion River followed the field
T:\1305 Vermillion\13 Fish Monitoring Project\Report\Final Report\2009 Fish Community Monitoring Report_final.doc
2-2
protocols established in the MPCA IBI for Warmwater Rivers and Streams of the Upper
Mississippi River Basin (Niemela and Fiest, 2002).
2.1 FIELD RECONNAISSANCE AND REACH DETERMINATION
The MPCA warmwater IBI describes the methods for determining the proper length of a stream
sample reach necessary for fish community monitoring. Based on previous studies in Wisconsin
by Lyons (1992) the proper sample reach for IBI monitoring has been determined to be 35 times
the mean width of the stream. The MPCA has added an additional condition that the minimum
sample reach be no less than 150 meters and the maximum reach be no more than 500 meters
(Niemela and Fiest, 2002).
Field reconnaissance of the seven sample sites was performed in early August. Using a 300 foot
survey tape, the width of the stream channel was measured a minimum of ten times for each
sample reach. The distance between channel width measurements varied from 50 to 100 feet,
depending on the average width of the stream. The channel width measurements were relatively
consistent for the sample sites, with all of the sites except site A14 averaging less than 15 feet in
width.
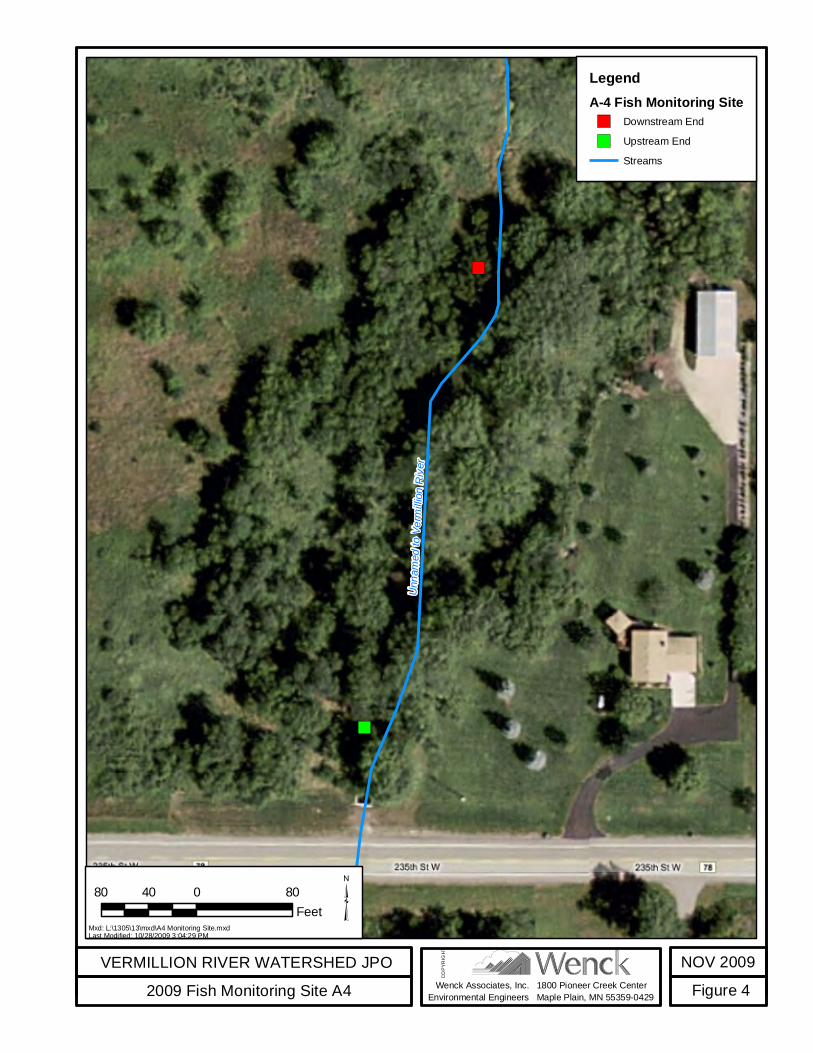
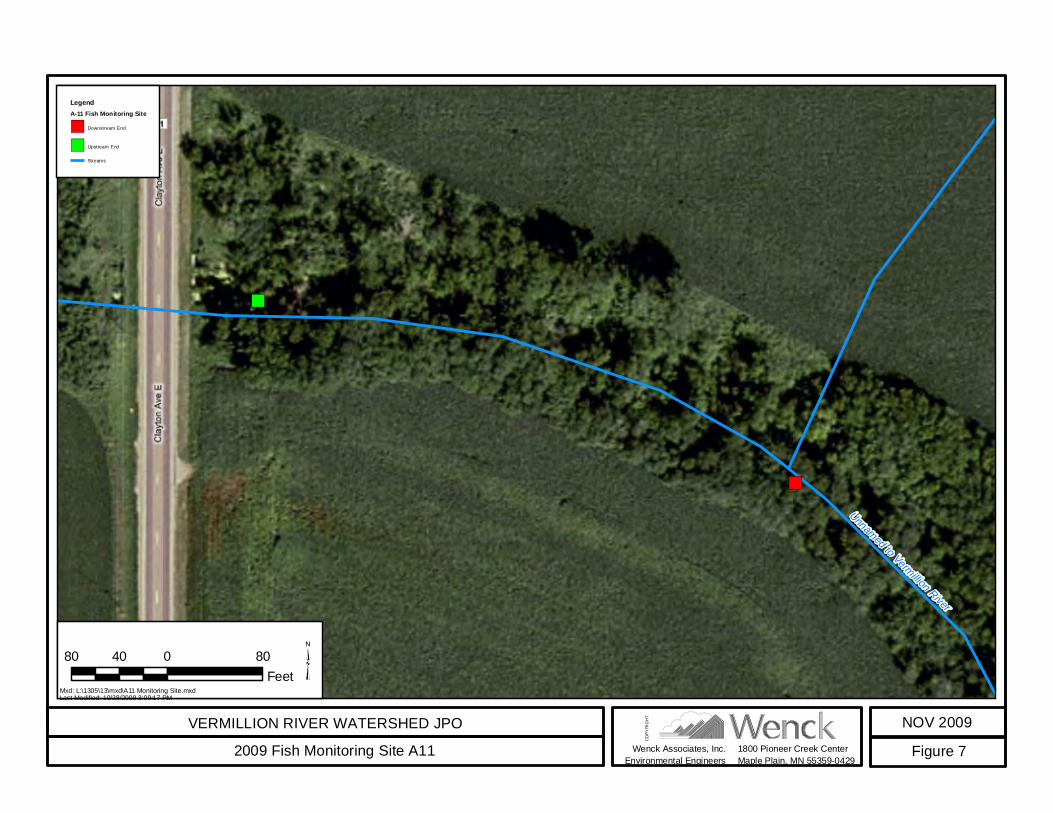
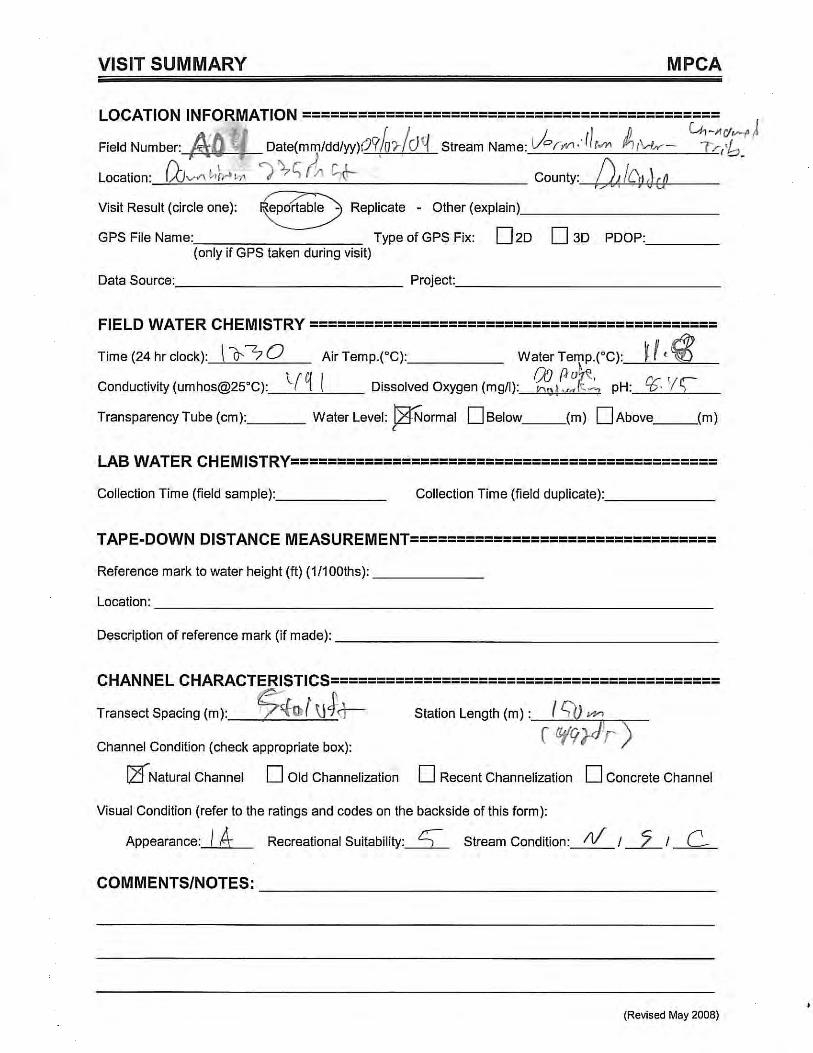
Based on the average stream widths, four of the seven sample reaches (sites A1, A4, A10 and
A11) were determined to be the minimum reach length of 150 meters (492 ft). Once the sample
reaches were determined, flagging was placed on a tree along the bank at the upstream and
downstream end of the reach for each site. The GPS coordinates were recorded with a hand-held
GPS unit at the upstream and downstream points. The GPS coordinates and the sample reach
lengths for all of sample sites are provided in Table 1. Photos of the sample reaches are provided
in Appendix A (field photos 1 - 8).
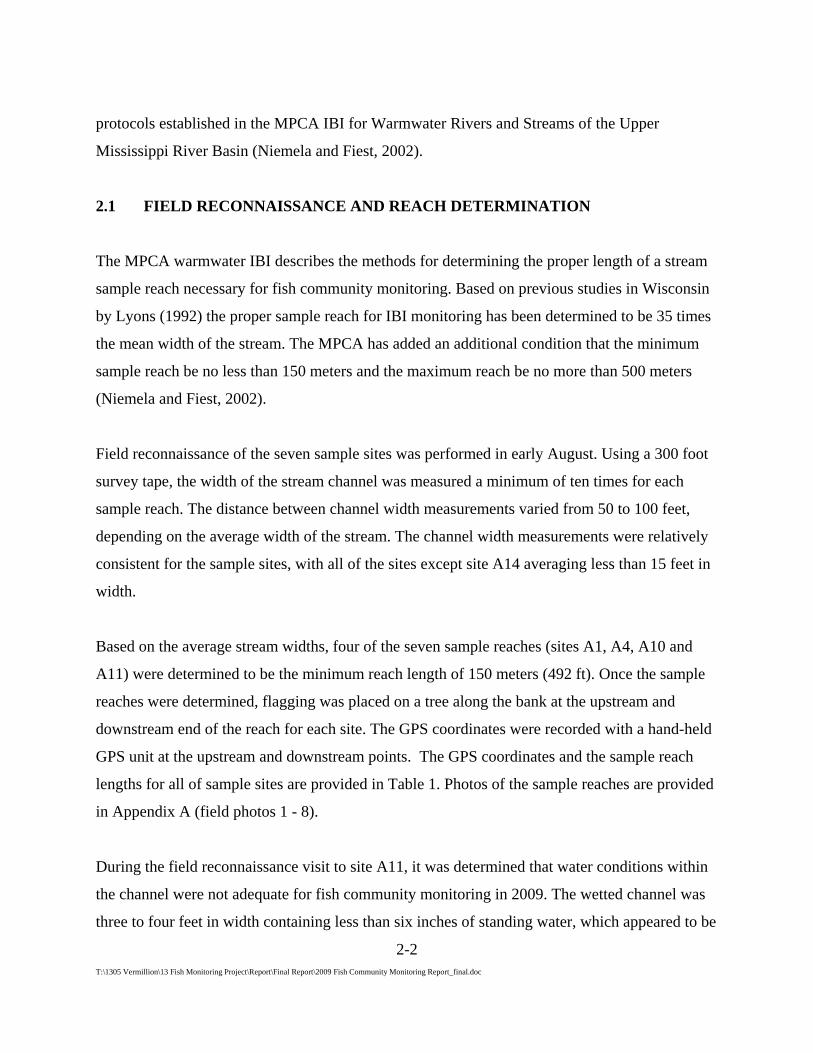
During the field reconnaissance visit to site A11, it was determined that water conditions within
the channel were not adequate for fish community monitoring in 2009. The wetted channel was
three to four feet in width containing less than six inches of standing water, which appeared to be
T:\1305 Vermillion\13 Fish Monitoring Project\Report\Final Report\2009 Fish Community Monitoring Report_final.doc
2-3
less than half of the high water level conditions for this channel. With the low water levels, the
majority of the areas of the channel that would contain habitat for fish (such as undercut banks or
woody snags) were dry. Fish that normally utilize this reach likely retreated downstream to areas
with more favorable water conditions. Due to the lack of water in the channel and the lack of
available habitat to sample, fish community monitoring was not conducted at site A11 in 2009.
Table 1: Sample reach information for the seven sites in the 2009 Vermillion River stream fish monitoring project.
Site Fish Community Upstream Coordinates Downstream Coordinates Average
Width Sample Reach
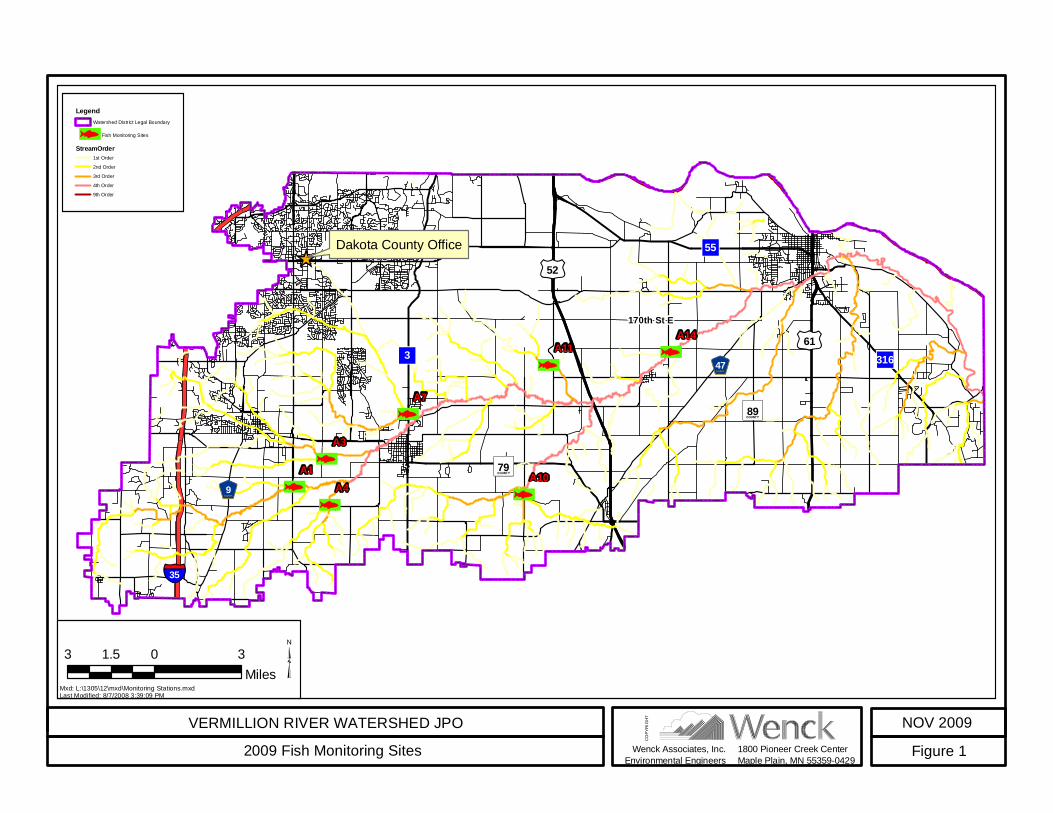
Length (meters) A1 Coldwater 44.618556 93.217583 44.618833 93.216194 12.9 ft 492 ft (150 m)
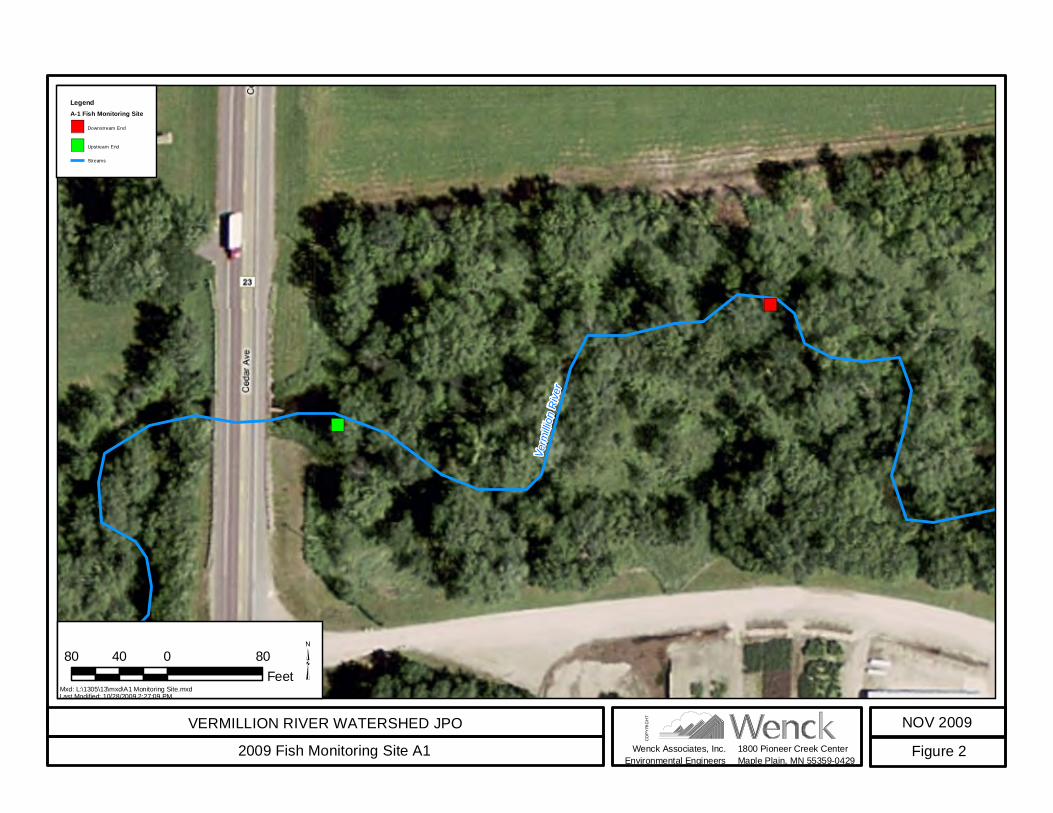
A3 Coldwater 44.632778 93.195028 44.632778 93.192917 14.7 ft 525 ft (160 m)
A4 Warmwater 44.609278 93.192250 44.610333 93.191889 7.4 ft 492 ft (150 m)
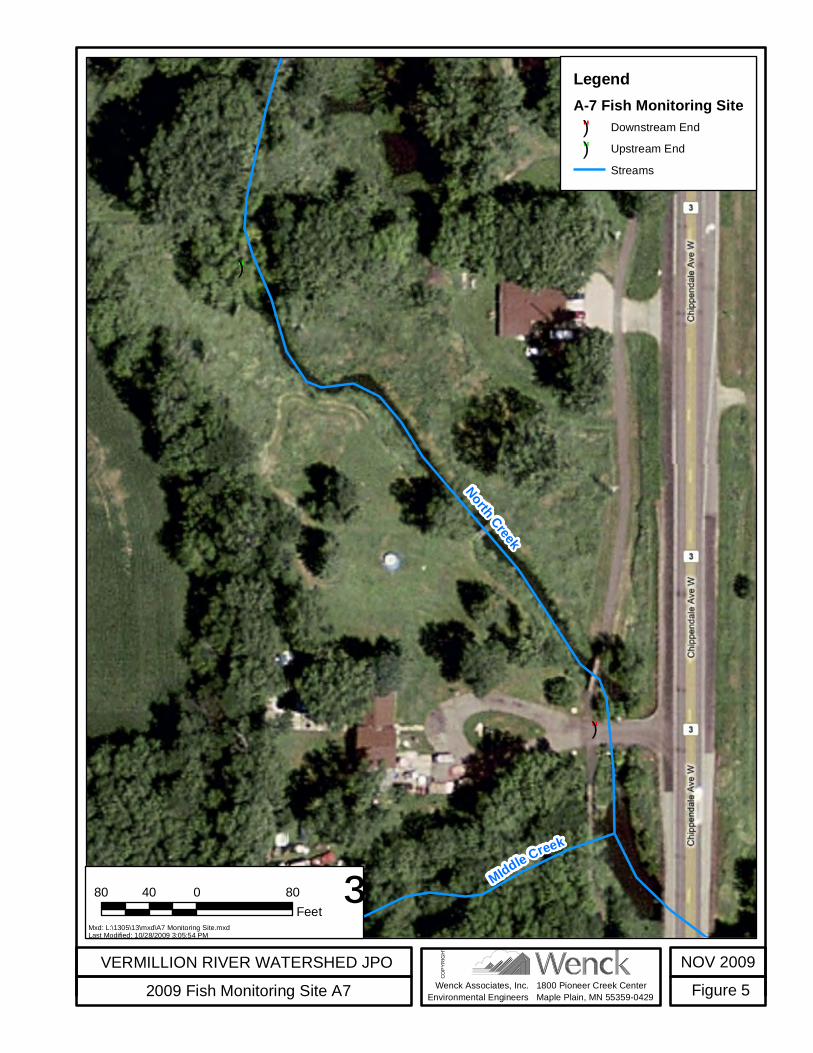
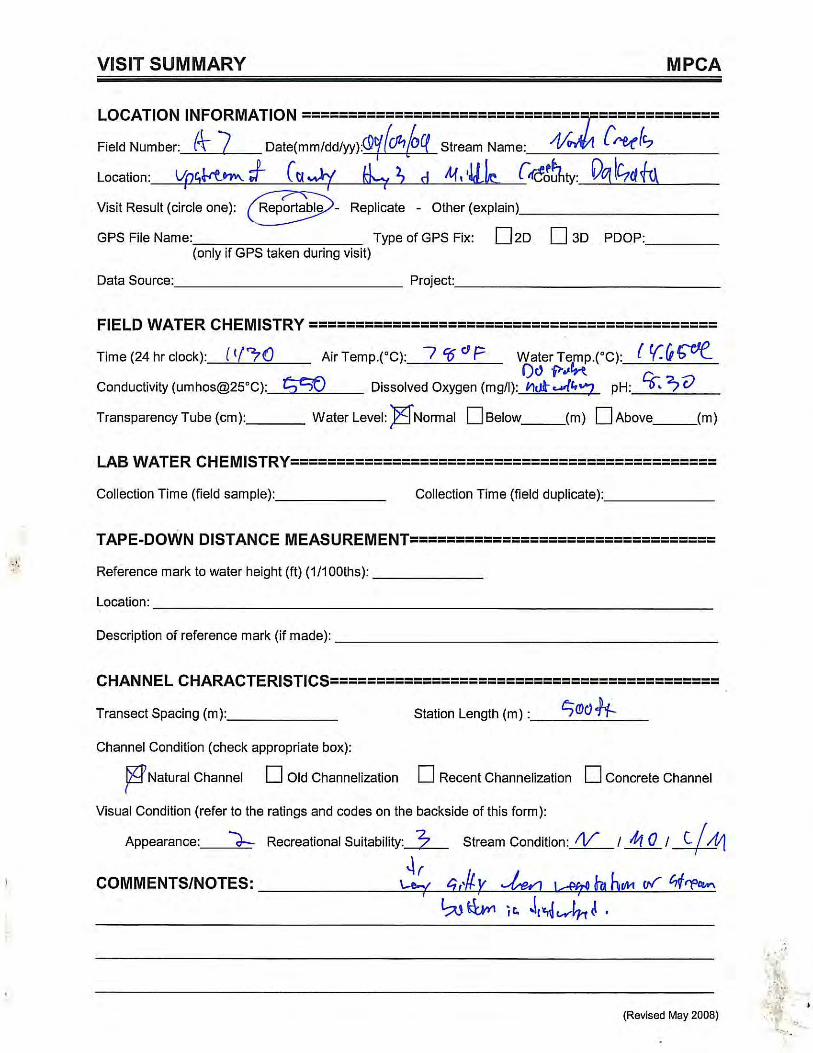
A7 Coldwater 44.655917 93.138111 44.654861 93.136972 14.9 ft 500 ft (152 m)
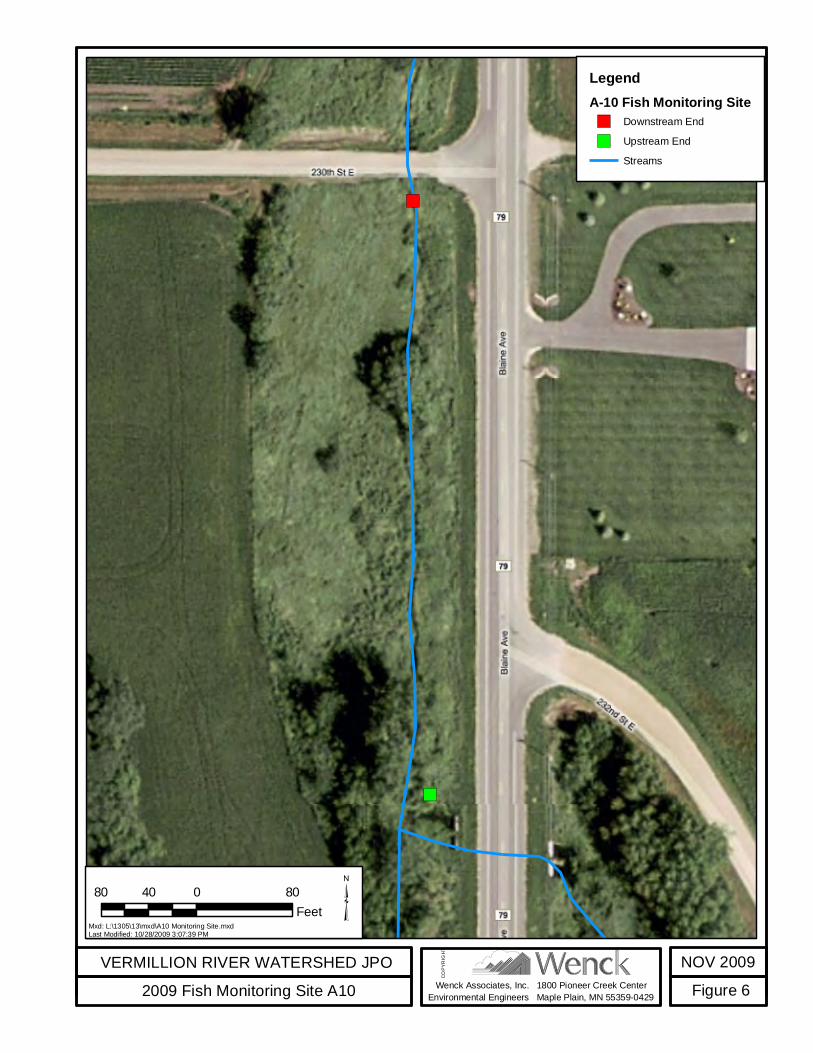
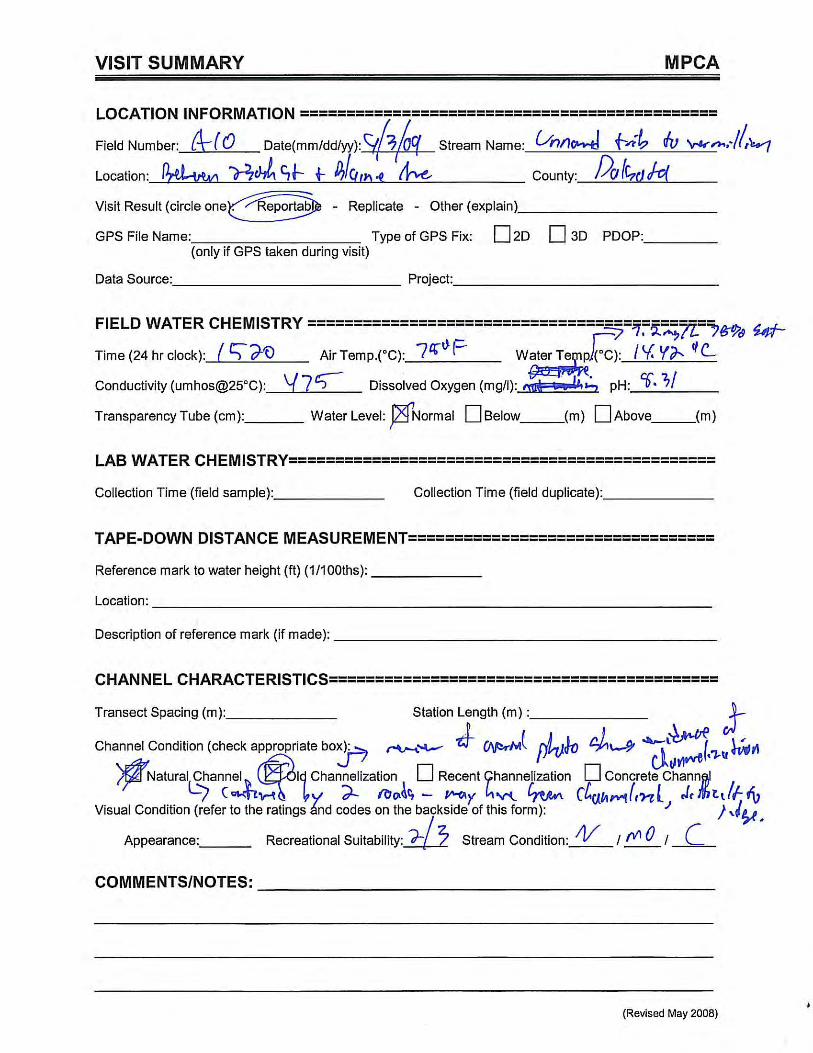
A10 Warmwater 44.614444 93.055639 44.615806 93.055694 6 ft 492 ft (150 m)
A11** Warmwater -- -- -- -- ~ 4 ft 492 ft (150 m)
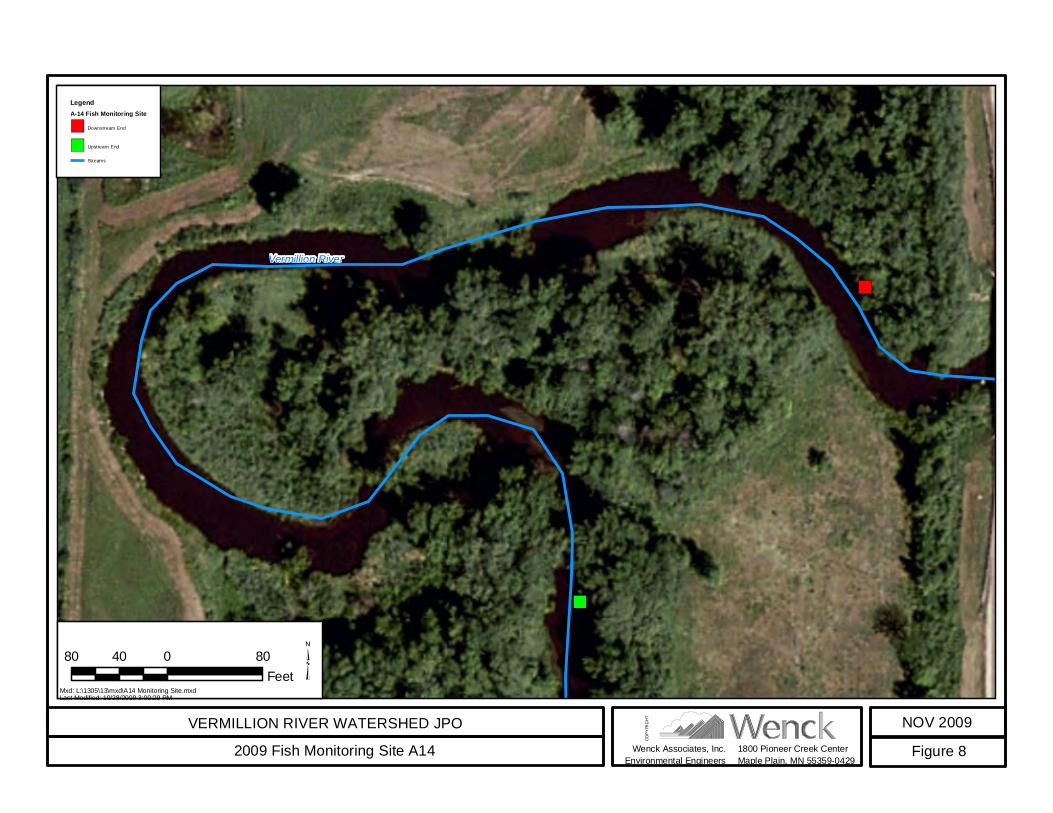
A14 Warmwater 44.685778 92.955583 44.686500 92.954667 35 ft 1225 ft (373 m)
**Due to low water level conditions fish community monitoring was not conducted at site A11.
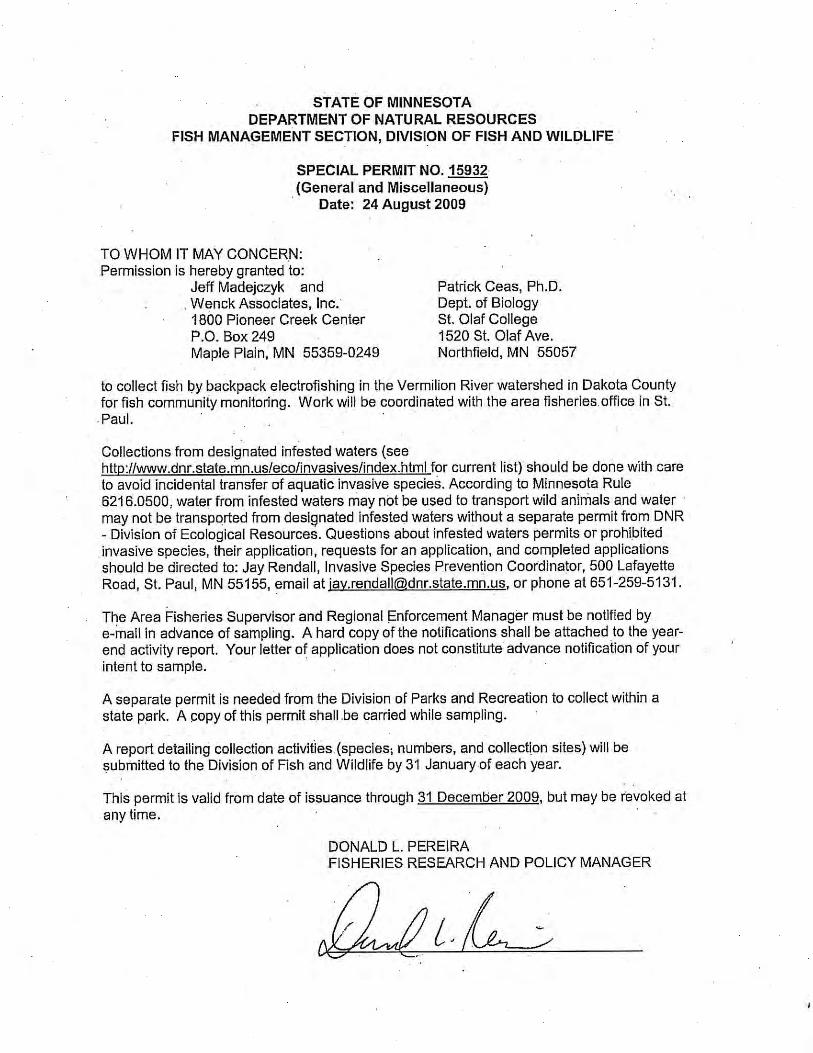
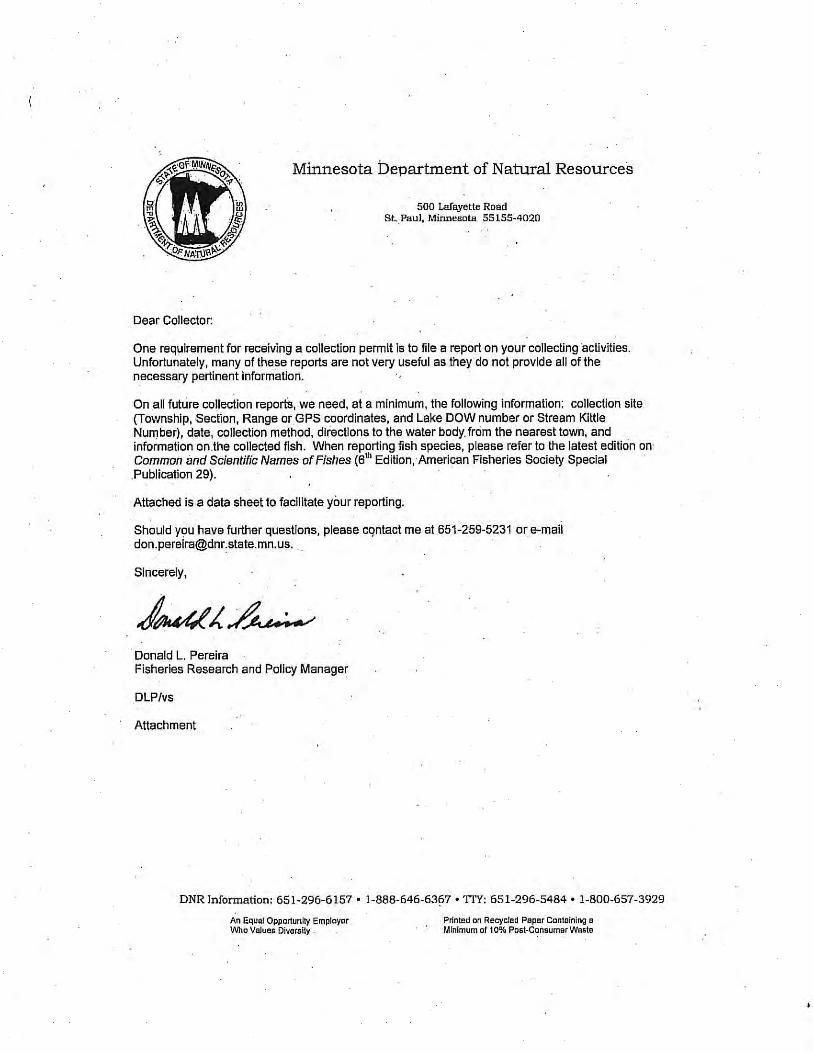
A special permit from the MN DNR is required for private entities or individuals to conduct fish
community monitoring such as electrofishing in Minnesota public waters. A letter and map of
the sample sites was sent to the MN DNR on August 17th, 2009 requesting a permit to conduct
fish community monitoring at the seven designated sites on the Vermillion River by means of
backpack or barge electrofishing. The special survey permit was issued by the MN DNR on
August 24th, 2009 (see Appendix B). The survey permit is valid until the end of the calendar year
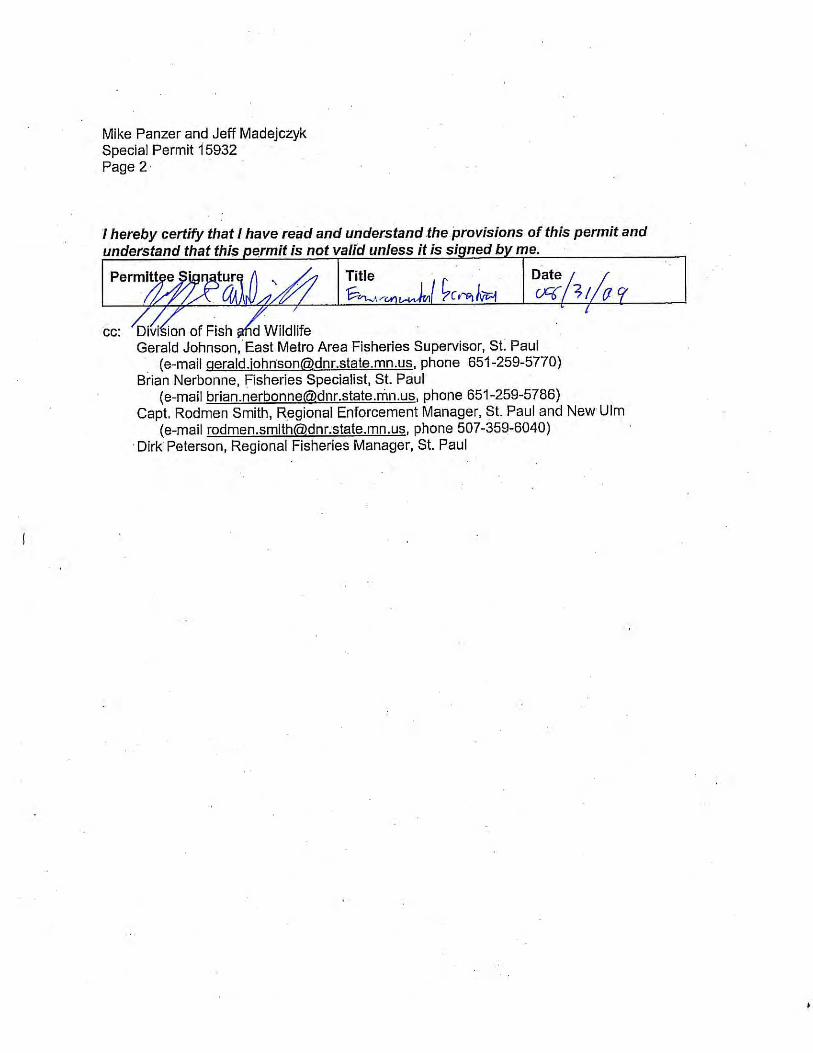
and must be renewed for future years of the study. The survey permit also requires that the fish
community data collected be reported to the MN DNR. Survey results from this report will be
provided to the MN DNR to fulfill that requirement.
T:\1305 Vermillion\13 Fish Monitoring Project\Report\Final Report\2009 Fish Community Monitoring Report_final.doc
2-4
2.2 FISH COMMUNITY MONITORING
The index period for fish community sampling is defined as mid-June through mid-September in
the MPCA warmwater IBI protocol. The MN DNR has conducted monitoring in the Vermillion
River over the last five years, traditionally sampling in early September. The past MN DNR
monitoring has mainly focused on sampling for trout, but the MN DNR is currently coordinating
with the VRWJPO on the IBI monitoring at seven sites in the watershed. Discussions with the
MN DNR indicated that their 2009 IBI fish community monitoring efforts would be targeted for
early September to correspond to the previous years of monitoring, even though previous
monitoring was not conducted for the purposes of calculating IBIs. As a result, the 2009 fish
community monitoring conducted under this effort was targeted for early September to coincide
with the DNR monitoring efforts in the Vermillion River watershed.
The application of the different sampling methods are defined in the MPCA warmwater IBI
based on stream size (Niemela and Fiest, 2002), with the backpack unit used for small, wadeable
streams less that eight meters wide and the barge unit used on medium sized, wadeable streams
greater than eight meters wide. The backpack unit was used at five sites, sites A1, A3, A4, A7,
and A10 (see Appendix A – photos 9 and 10), while the barge unit was used at site A14 (see
Appendix A – photos 11 and 12).
All stream fish collections followed the methods outlined in the MPCA warmwater IBI, as well
as the MPCA Standard Operating Procedures for electrofishing (Rev. Feb. 2009). Each reach
was fished beginning from the downstream point established during field reconnaissance in an
upstream direction up to the upstream end of the established reach. All habitats within the
channel were sampled with the electrofishing units and all fish were netted during fishing.
Due to the relatively narrow width of most of the stream reaches, it was possible to effectively
sample all available instream habitats. The total electrofishing time of each reach was recorded at
the end of the sampling run for that site. The electrofishing method, sample times and sample
dates for each reach are presented in Table 2.
T:\1305 Vermillion\13 Fish Monitoring Project\Report\Final Report\2009 Fish Community Monitoring Report_final.doc
2-5
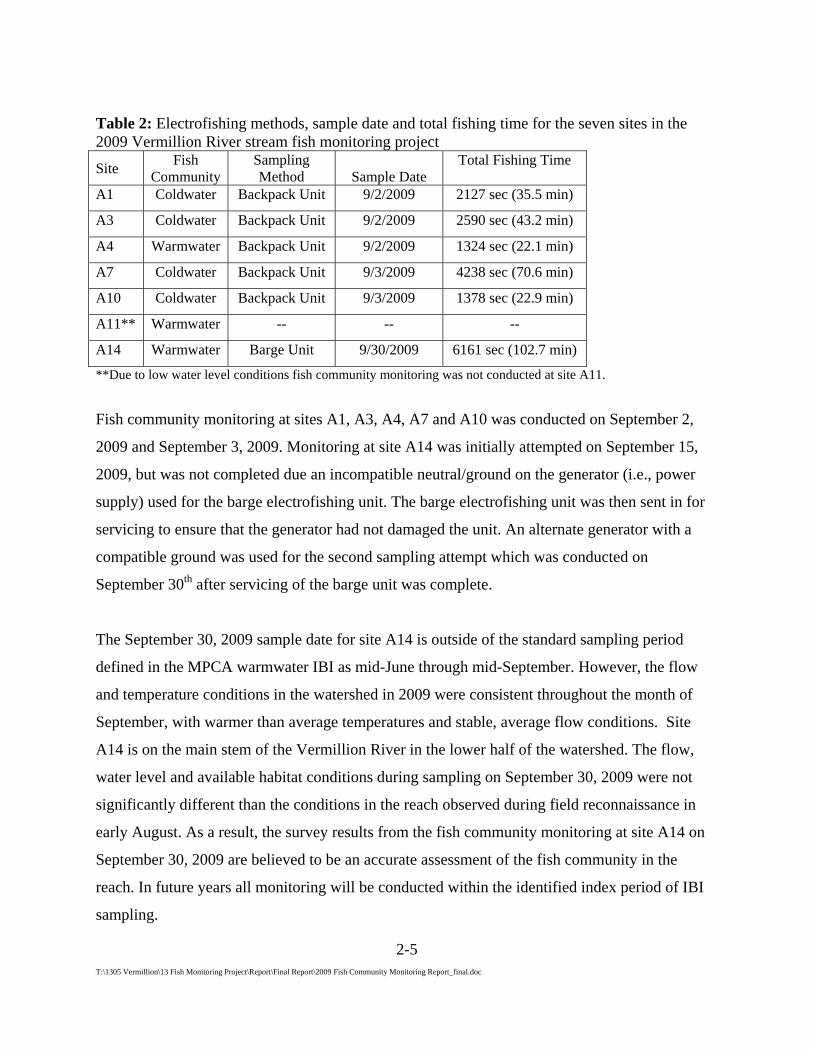
Table 2: Electrofishing methods, sample date and total fishing time for the seven sites in the 2009 Vermillion River stream fish monitoring project
Site Fish Community
Sampling Method Sample Date
Total Fishing Time
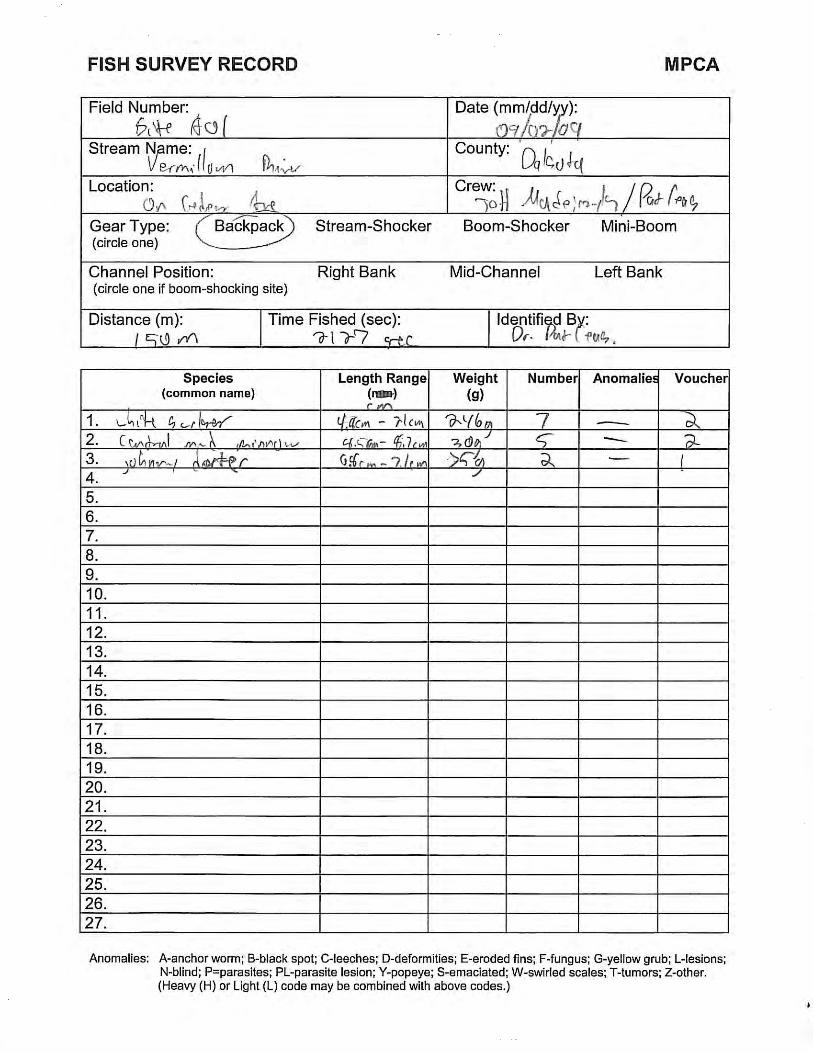
A1 Coldwater Backpack Unit 9/2/2009 2127 sec (35.5 min)
A3 Coldwater Backpack Unit 9/2/2009 2590 sec (43.2 min)
A4 Warmwater Backpack Unit 9/2/2009 1324 sec (22.1 min)
A7 Coldwater Backpack Unit 9/3/2009 4238 sec (70.6 min)
A10 Coldwater Backpack Unit 9/3/2009 1378 sec (22.9 min)
A11** Warmwater -- -- --
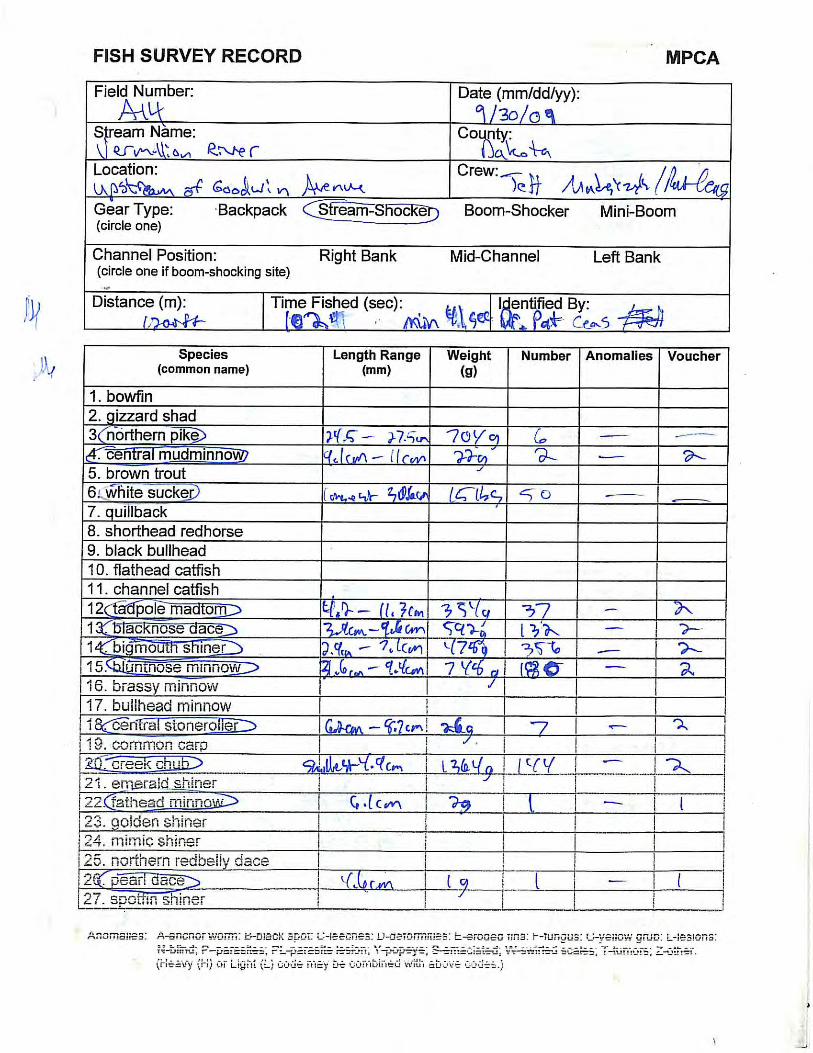
A14 Warmwater Barge Unit 9/30/2009 6161 sec (102.7 min)
**Due to low water level conditions fish community monitoring was not conducted at site A11.
Fish community monitoring at sites A1, A3, A4, A7 and A10 was conducted on September 2,
2009 and September 3, 2009. Monitoring at site A14 was initially attempted on September 15,
2009, but was not completed due an incompatible neutral/ground on the generator (i.e., power
supply) used for the barge electrofishing unit. The barge electrofishing unit was then sent in for
servicing to ensure that the generator had not damaged the unit. An alternate generator with a
compatible ground was used for the second sampling attempt which was conducted on
September 30th after servicing of the barge unit was complete.
The September 30, 2009 sample date for site A14 is outside of the standard sampling period
defined in the MPCA warmwater IBI as mid-June through mid-September. However, the flow
and temperature conditions in the watershed in 2009 were consistent throughout the month of
September, with warmer than average temperatures and stable, average flow conditions. Site
A14 is on the main stem of the Vermillion River in the lower half of the watershed. The flow,
water level and available habitat conditions during sampling on September 30, 2009 were not
significantly different than the conditions in the reach observed during field reconnaissance in
early August. As a result, the survey results from the fish community monitoring at site A14 on
September 30, 2009 are believed to be an accurate assessment of the fish community in the
reach. In future years all monitoring will be conducted within the identified index period of IBI
sampling.

T:\1305 Vermillion\13 Fish Monitoring Project\Report\Final Report\2009 Fish Community Monitoring Report_final.doc
2-6
During fish monitoring at each site, collected fish were placed in buckets or tubs. Water in the
buckets was changed during monitoring to provide adequate dissolved oxygen for the fish. For
reaches where electrofishing lasted more that one half hour or when a large number of fish were
collected, large tubs were set up with aerators. Fish mortality was negligible, with only a few
individual deaths during all the collecting.
After electrofishing was complete, a fish processing station was set up with a large numbers of
tubs and buckets, including aerators (see Appendix A – Photo 13). All individuals were
identified and sorted by species into a tub/bucket. Dr. Patrick Ceas of St. Olaf College served as
the expert ichthyologist for all field identifications for this project. Once the identification and
sorting was complete, the largest and smallest fish of each species were weighed and measured,
following the MPCA protocols for fish processing (see Appendix A – Photos 14 and 15). Batch
weights were then taken of the remaining fish for each species.
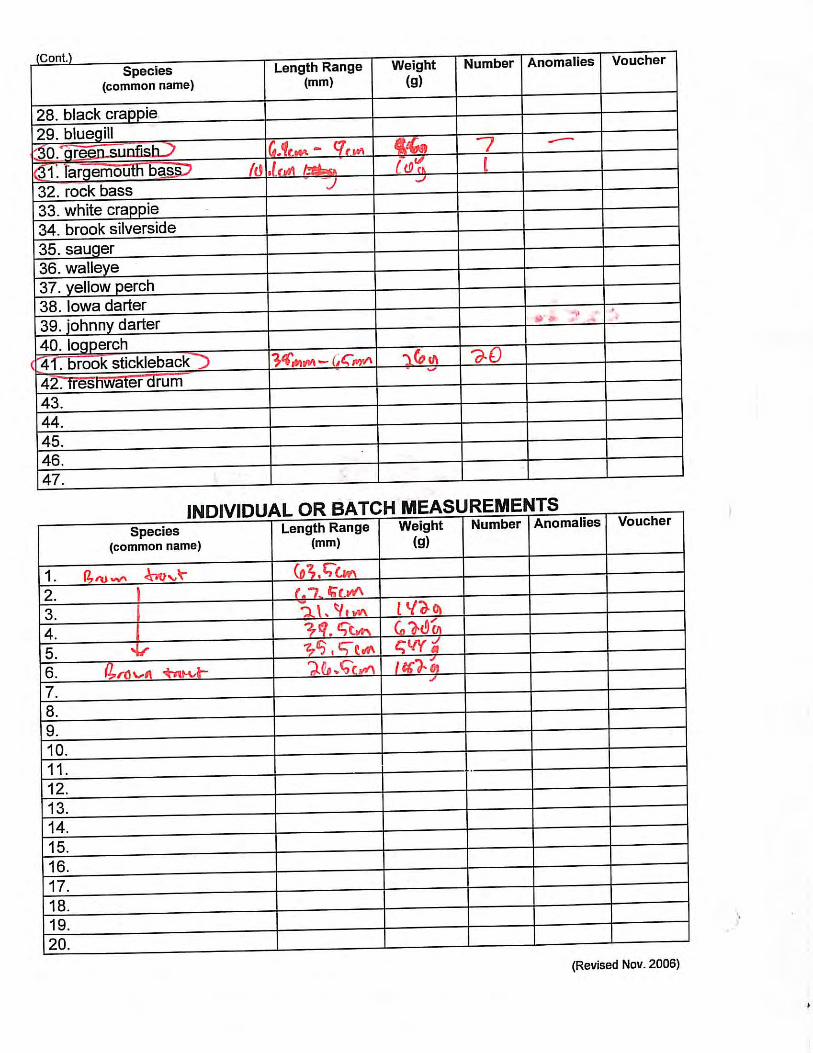
In some cases large fish were weighed and measured individually. In most cases all trout
collected were weighed and measured individually. All fish of each species were then counted
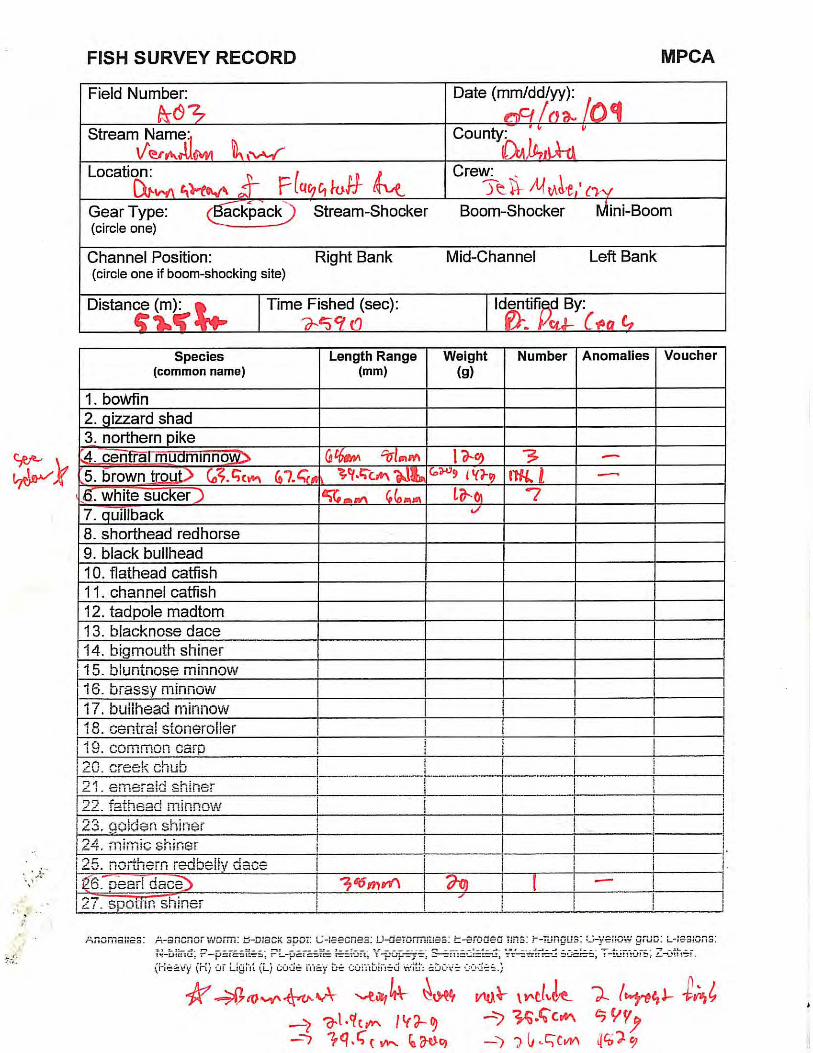
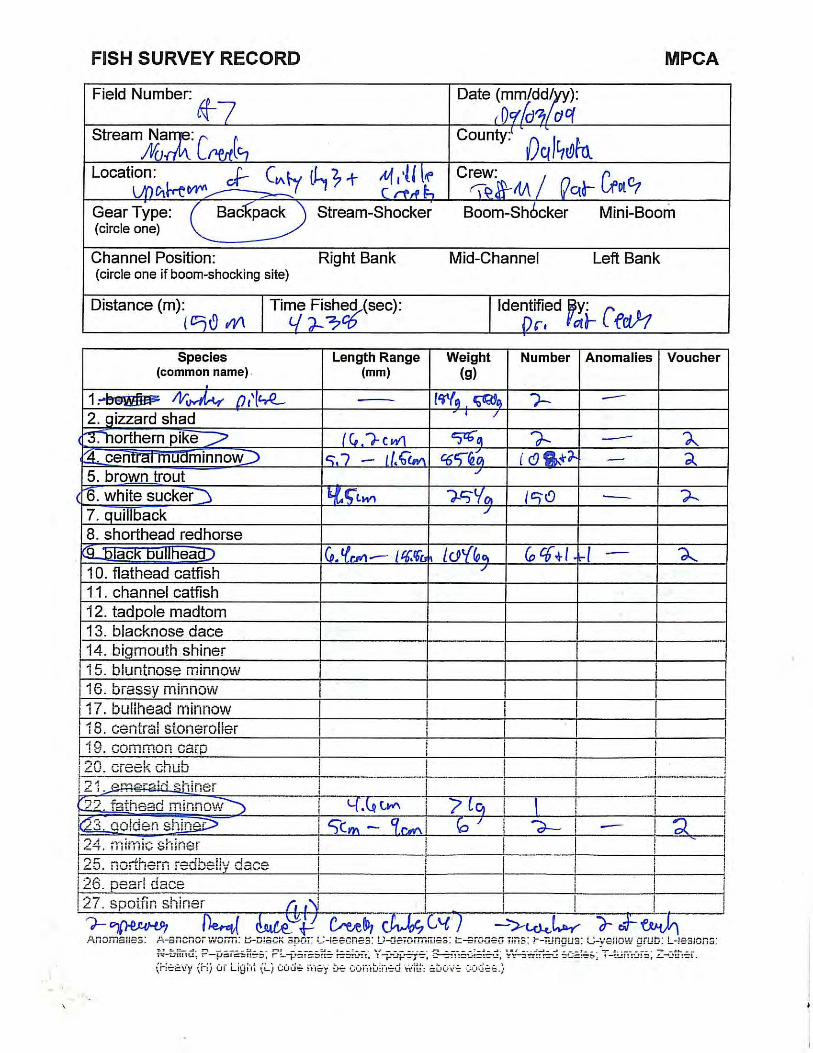
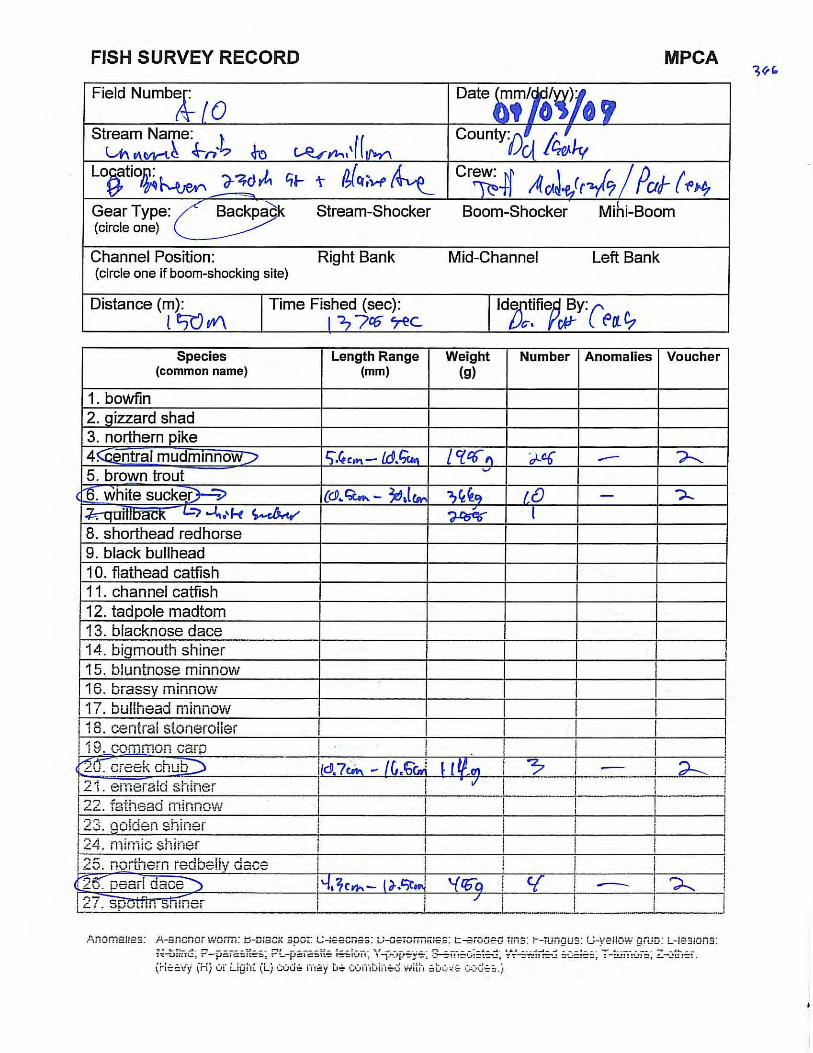
and released (see Appendix A – Photo 16). All fish community data collected, including fish
species, number of each species, lengths and weights were recorded on MPCA datasheets for
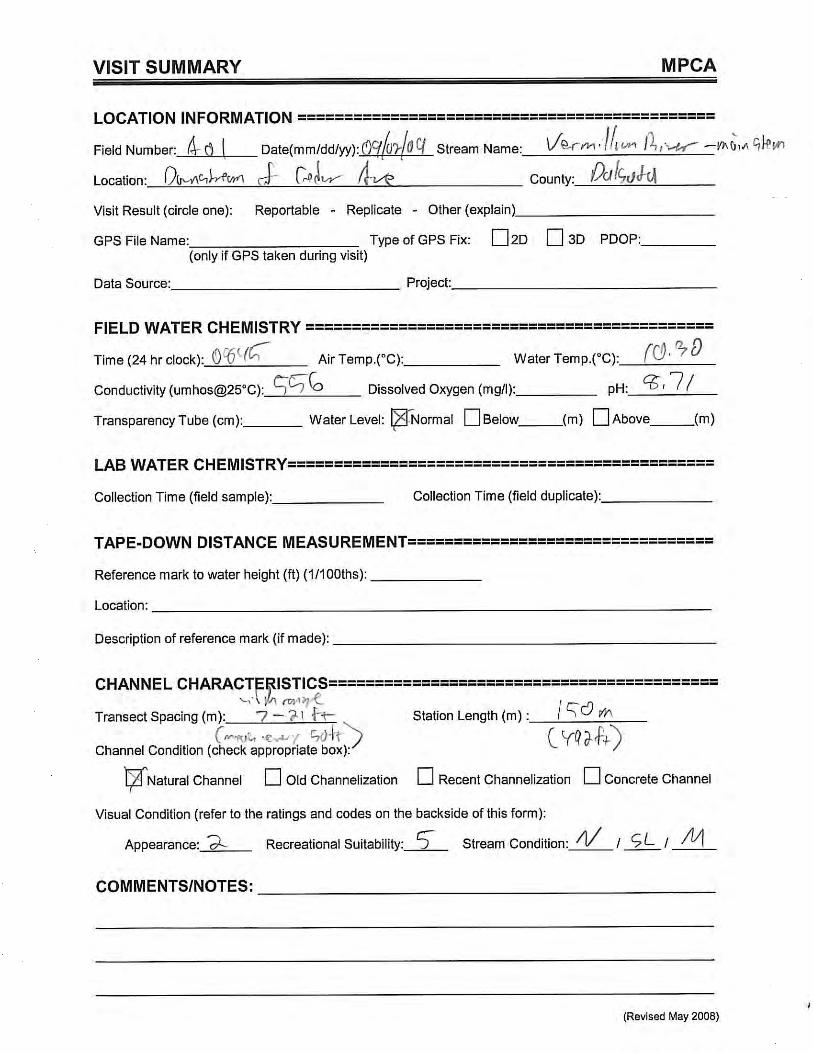
stream fish monitoring (see Appendix C – Field Sheets) Voucher specimens from each sample
site were kept and preserved, with the number of specimens recorded on the data sheet for the
site. Voucher specimens were sent to the MPCA to be archived with the fish community samples
collected from the Vermillion River watershed by the MPCA in 2008.
T:\1305 Vermillion\13 Fish Monitoring Project\Report\Final Report\2009 Fish Community Monitoring Report_final.doc
3-1
3.0 Monitoring Results
3.1 FISH COMMUNITY SUMMARY INFORMATION
Total electrofishing time at the six sites ranged from 22 to 102 minutes (see Table 2), with longer
fishing times mainly driven by the amount of fish collected and not sample reach length. There
were a total of 2240 fish collected from 23 different species across the six sites that were
monitored in 2009 (see Appendix D – Species Summary Table).
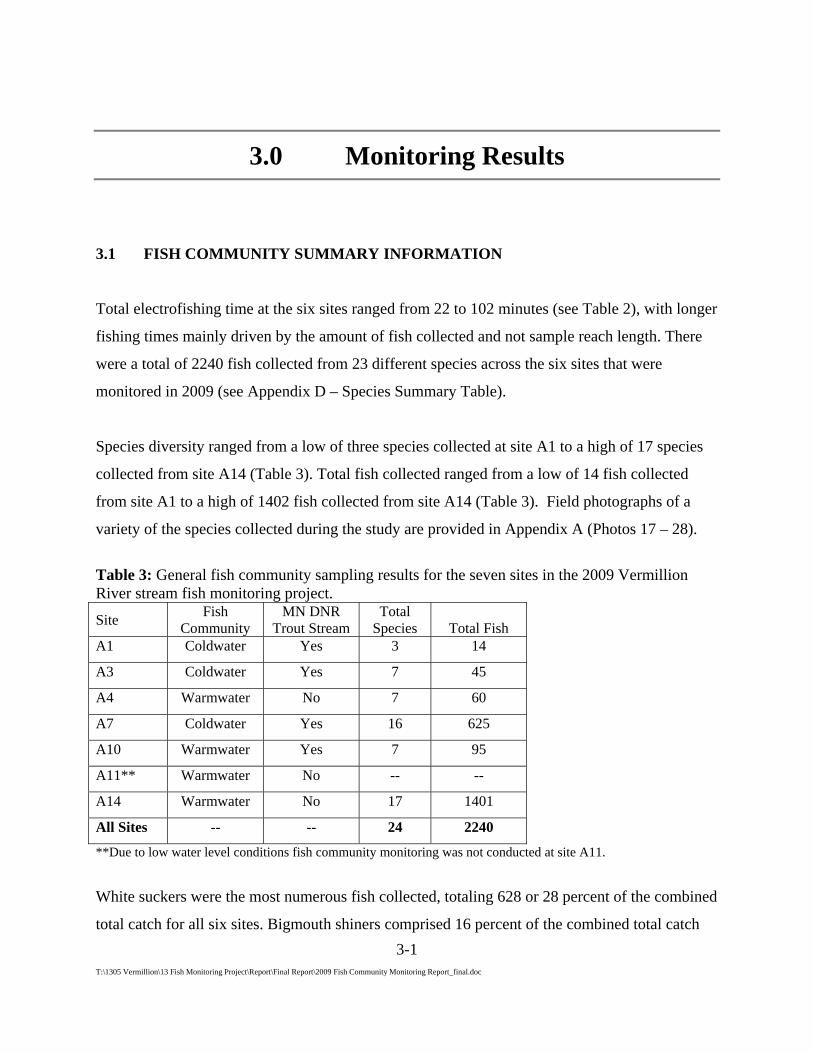
Species diversity ranged from a low of three species collected at site A1 to a high of 17 species
collected from site A14 (Table 3). Total fish collected ranged from a low of 14 fish collected
from site A1 to a high of 1402 fish collected from site A14 (Table 3). Field photographs of a
variety of the species collected during the study are provided in Appendix A (Photos 17 – 28).
Table 3: General fish community sampling results for the seven sites in the 2009 Vermillion River stream fish monitoring project.
Site Fish Community
MN DNR Trout Stream
Total Species Total Fish
A1 Coldwater Yes 3 14
A3 Coldwater Yes 7 45
A4 Warmwater No 7 60
A7 Coldwater Yes 16 625
A10 Warmwater Yes 7 95
A11** Warmwater No -- --
A14 Warmwater No 17 1401
All Sites -- -- 24 2240
**Due to low water level conditions fish community monitoring was not conducted at site A11.
White suckers were the most numerous fish collected, totaling 628 or 28 percent of the combined
total catch for all six sites. Bigmouth shiners comprised 16 percent of the combined total catch

T:\1305 Vermillion\13 Fish Monitoring Project\Report\Final Report\2009 Fish Community Monitoring Report_final.doc
3-2
but this species was only collected at one site (A14). All other species comprised less than ten
percent of the combined total catch for the six monitoring sites. White suckers and central
mudminnows were the only fish collected at all six monitoring sites (see Appendix D – Species
Summary Table). Johnny darters and pearl dace were collected at five sites; brook stickleback,
brown trout and largemouth bass were collected at four sites; and creek chubs and green sunfish
were collected at three sites. The other 14 of the 23 species observed during the 2009 Vermillion
River fish monitoring were collected at only one or two sites (see Appendix D – Species
Summary Table).
Brown trout were collected from four sites during the study, of which two of the sites are
classified as coldwater fish communities (sites A3 and A7) and from two sites that are classified
as having a warmwater fish community (sites A10 and A14). Based on conversations with the
MN DNR fisheries staff familiar with the project area, it is not uncommon to collect an
occasional brown trout on the main stem of the Vermillion River in the lower reaches of the
watershed that are classified as warmwater fisheries. Brown trout of catchable size for
recreational anglers were collected at all four sites where trout were observed with the largest
specimens being a 26.6 and 25 inch trout collected at site A3, an 18.5 inch trout at site A7, a 17
inch trout from site A10, and a 21.5 inch trout collected from site A14. See Appendix E for a
summary of all trout collected during the study.
3.2 IBI CALCULATIONS
The 2009 Vermillion River stream fish monitoring project included stream monitoring sites that
are classified as having either warmwater or coldwater fish communities. The purpose of the
monitoring was to collect stream fish community datasets to be used to calculate IBI scores for
each sample site. The VRWJPO is in the process of determining appropriate management goals
for the stream fish communities throughout the watershed and as a result requested that both
warmwater and coldwater IBI scoring be applied to the data collected from each site. The
warmwater scoring criteria used for the study was taken from the MPCA IBI for warmwater
streams of the Upper Mississippi River (Neimela and Fiest, 2002) and the coldwater IBI scoring

T:\1305 Vermillion\13 Fish Monitoring Project\Report\Final Report\2009 Fish Community Monitoring Report_final.doc
3-3
criteria was taken from Mundahl and Simon’s coldwater IBI for streams of the Upper
Midwestern States (1998).
The MPCA warmwater IBI provides separate scoring criteria for sites depending on the
watershed size. There are four watershed sizes identified in the warmwater IBI, with the sites
from the Vermillion River 2009 fish monitoring project falling into two of the categories: small
streams (5 – 35 mi2 watershed) and moderate sized streams (35 – 200 mi2 watershed area). The
metrics used to calculate the IBI scores for each stream size category are provided in
Appendix E.
Five of the sites from the Vermillion River 2009 fish monitoring project fall into the small
stream category (sites A1, A3, A4, A7 and A10) while only one of the sites falls into the
moderate size stream category (site A14). Each of the two categories uses ten metrics to calculate
the IBI score for the site, with a maximum score of ten for each metric, resulting in a maximum
score of 100 for the warmwater IBI.
The MPCA warmwater IBI use categorical, as opposed to continuous, scoring for metrics,
meaning that the metric score is dependant on an assigned category given a value of 0, 2, 5, 7 or
10. Eight of the ten the metrics used for the warmwater IBI are the same for both the small and
moderate size streams. The two unique metrics for the small-size streams are the “number of
minnow species” and “percent dominant two species” while the moderate-size stream metrics are
the “number of darter, sculpin and madtom species” and “number of piscivore species” metrics
(see Appendix E).
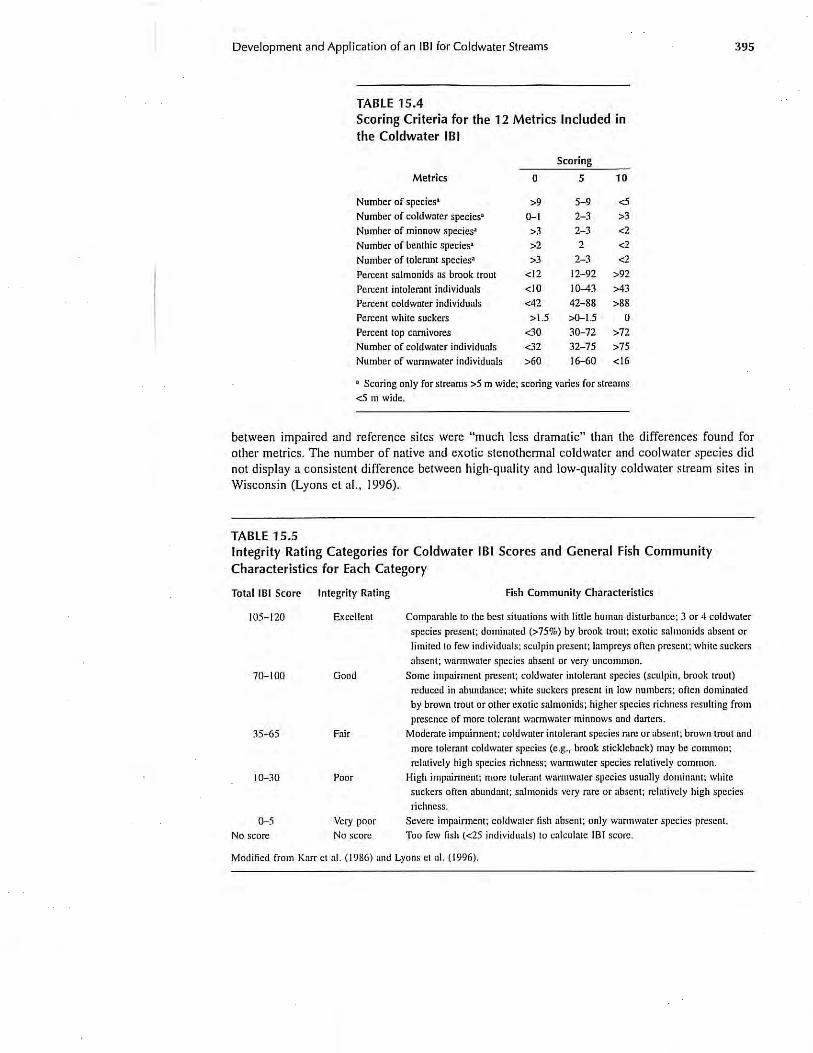
The coldwater IBI scoring criteria (Mundahl and Simon, 2002) uses 12 total metrics each with a
maximum score of 10 for a total score of 120. The coldwater IBI also uses categorical, as
opposed to continuous, scoring for the metrics. The coldwater IBI does not alter the metric
scoring for sites based on watershed sized as is done by the MPCA warmwater IBI. Therefore
the same 12 metric scoring system was applied to all six of the sites from the Vermillion River
2009 fish monitoring project. The scoring criteria for the coldwater IBI (Mundahl and Simon,
2002) are provided in Appendix E.
T:\1305 Vermillion\13 Fish Monitoring Project\Report\Final Report\2009 Fish Community Monitoring Report_final.doc
3-4
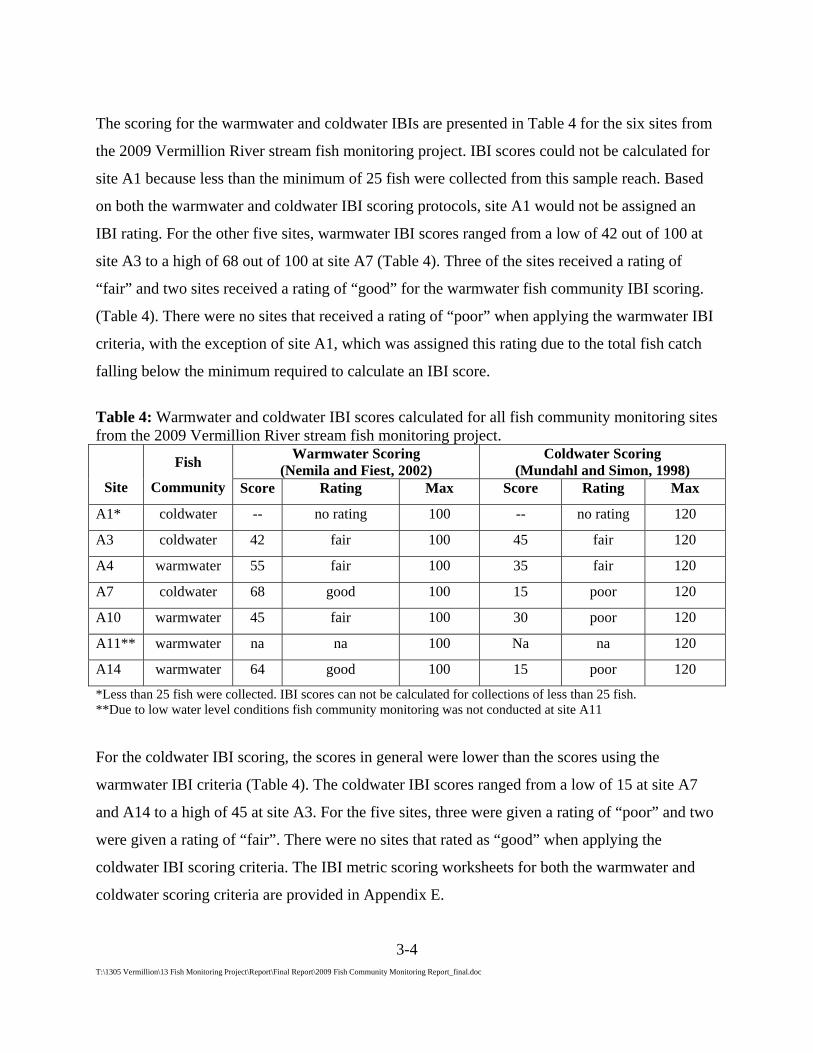
The scoring for the warmwater and coldwater IBIs are presented in Table 4 for the six sites from
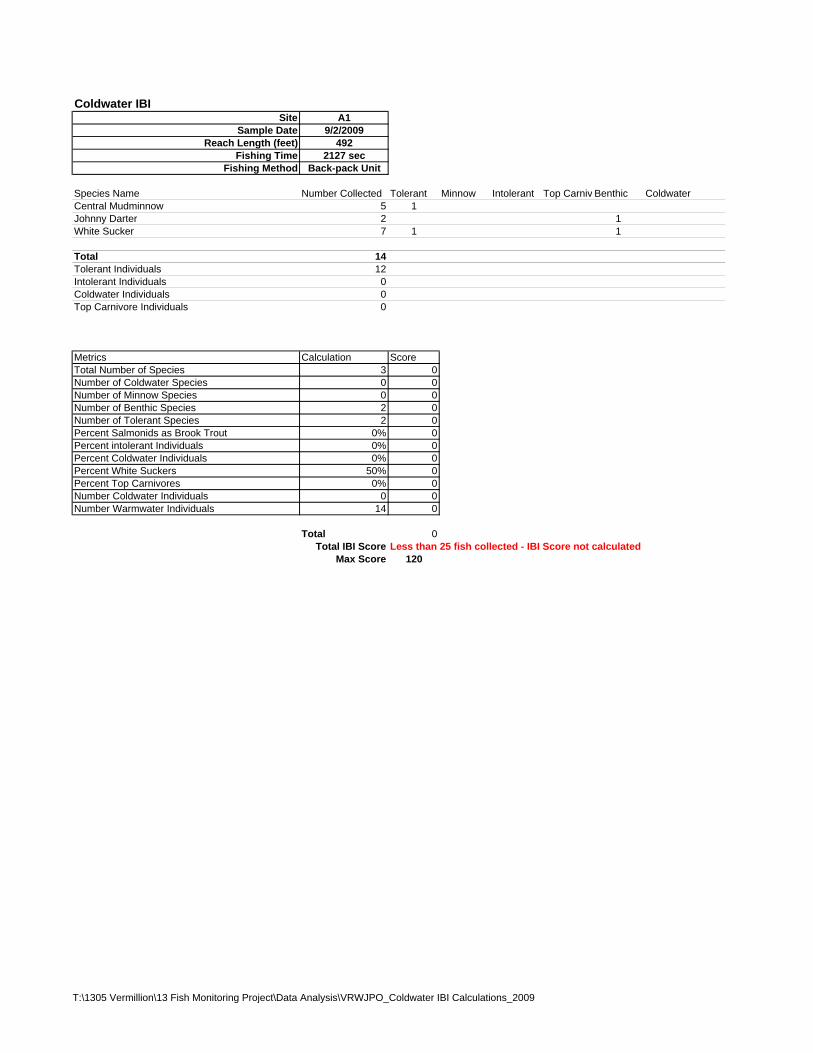
the 2009 Vermillion River stream fish monitoring project. IBI scores could not be calculated for
site A1 because less than the minimum of 25 fish were collected from this sample reach. Based
on both the warmwater and coldwater IBI scoring protocols, site A1 would not be assigned an
IBI rating. For the other five sites, warmwater IBI scores ranged from a low of 42 out of 100 at
site A3 to a high of 68 out of 100 at site A7 (Table 4). Three of the sites received a rating of
“fair” and two sites received a rating of “good” for the warmwater fish community IBI scoring.
(Table 4). There were no sites that received a rating of “poor” when applying the warmwater IBI
criteria, with the exception of site A1, which was assigned this rating due to the total fish catch
falling below the minimum required to calculate an IBI score.
Table 4: Warmwater and coldwater IBI scores calculated for all fish community monitoring sites from the 2009 Vermillion River stream fish monitoring project.
Warmwater Scoring (Nemila and Fiest, 2002)
Coldwater Scoring (Mundahl and Simon, 1998)
Site
Fish
Community Score Rating Max Score Rating Max
A1* coldwater -- no rating 100 -- no rating 120
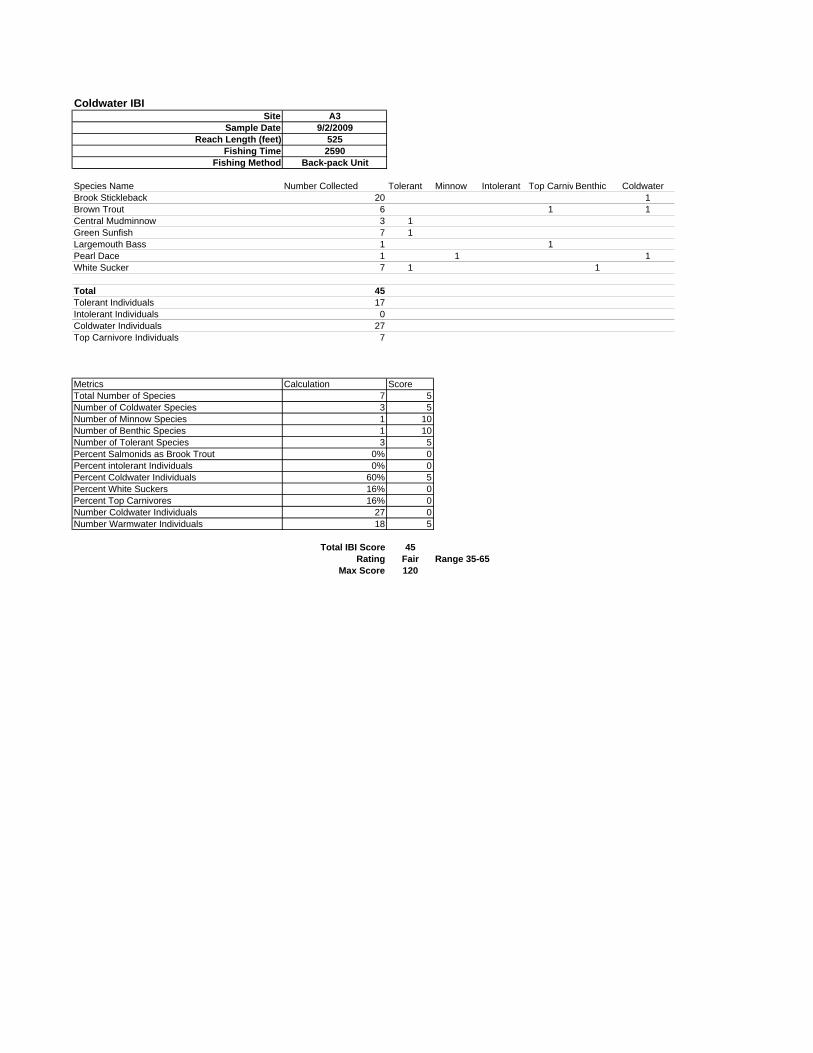
A3 coldwater 42 fair 100 45 fair 120
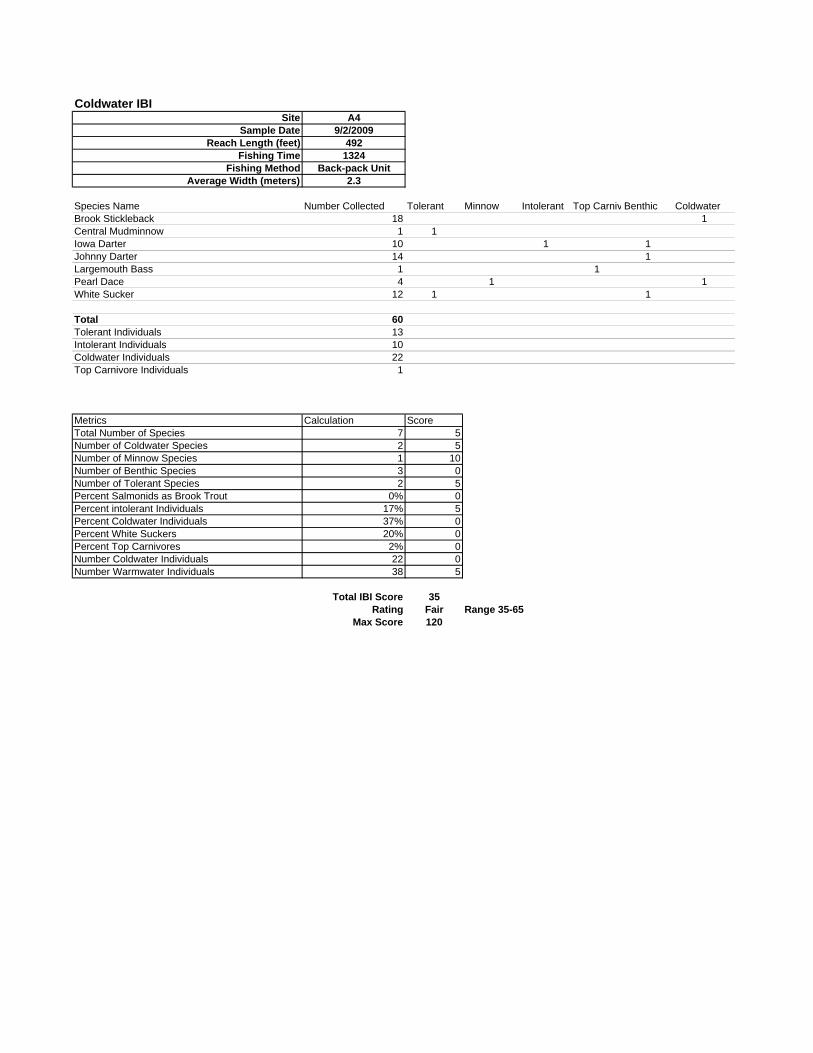
A4 warmwater 55 fair 100 35 fair 120
A7 coldwater 68 good 100 15 poor 120
A10 warmwater 45 fair 100 30 poor 120
A11** warmwater na na 100 Na na 120
A14 warmwater 64 good 100 15 poor 120
*Less than 25 fish were collected. IBI scores can not be calculated for collections of less than 25 fish. **Due to low water level conditions fish community monitoring was not conducted at site A11
For the coldwater IBI scoring, the scores in general were lower than the scores using the
warmwater IBI criteria (Table 4). The coldwater IBI scores ranged from a low of 15 at site A7
and A14 to a high of 45 at site A3. For the five sites, three were given a rating of “poor” and two
were given a rating of “fair”. There were no sites that rated as “good” when applying the
coldwater IBI scoring criteria. The IBI metric scoring worksheets for both the warmwater and
coldwater scoring criteria are provided in Appendix E.
T:\1305 Vermillion\13 Fish Monitoring Project\Report\Final Report\2009 Fish Community Monitoring Report_final.doc
4-1
4.0 Conclusions and Recommendations
Fish community monitoring was conducted at six of the seven identified stream sites during the
2009 Vermillion River stream fish monitoring project. One site was not surveyed due to low
water conditions. Of the six sites surveyed, IBI scores were calculated for only five sites, due to
an insufficient total catch at site A1 (less than the 25 fish minimum required for IBI scoring). In
general, all fish communities scored better when applying the warmwater IBI scoring criteria as
opposed to when applying the coldwater scoring criteria. The warmwater IBI scores ranged from
42 to 68 and were rated as fair to good. The coldwater IBI scores ranged from 15 to 45 and were
rated from poor to fair (see Section 3 – Table 4). There were no coldwater reaches sampled that
received ratings of good or excellent.
Site A1
Site A1 is an upper reach on the main stem of the Vermillion River that is designated as a
coldwater fish community. There were only 14 fish collected during the 2009 monitoring at Site
A1, which is less than the minimum total catch recommended for scoring using either the
warmwater or coldwater IBI. There appeared to be adequate water levels at the time of sampling
but there was a limited amount of pool habitat on this reach and there were no deep pools
present. The lack of pool habitat may cause fish to utilize this reach of the Vermillion River less
frequently late in the monitoring season during warmer, low water conditions. Site A1 should be
sampled again in proceeding years to determine if the 2009 results were an anomaly or indicative
of a very poor fish community. It may be necessary to redefine this sample reach or possibly
sample this reach multiple times during the index period at different flow conditions to see if
scores change/improve.
T:\1305 Vermillion\13 Fish Monitoring Project\Report\Final Report\2009 Fish Community Monitoring Report_final.doc
4-2
Site A3
Site A3 is the coldwater site that received the highest score when applying the coldwater IBI
metrics (see Table 4). However the overall rating of the fish community was still only rated as
“fair”. Site A3 had high metric scores for low “number of minnow species” and “number of
benthic species” collected. An increase in the number of the species from these two groups is
usually an indicator of disturbance or declining habitat conditions. Site A3 also had the highest
percentage of coldwater individuals of all the coldwater sites monitored in 2009, but the “total
number of coldwater individuals” collected still received a score of “0” for this metric, indicating
that habitat or water quality conditions necessary for a healthy coldwater fish community are not
present. When applying the warmwater IBI scoring criteria, Site A3 received a score of 42 and a
rating of “fair”. The site scored moderately well for the “number of wetland species”, “percent
dominant two species”, and “number of fish per 100 meters” metrics. Site A3 scored low to
poorly for all other metrics under the warmwater scoring.
Site A4
Site A4 received a rating of fair when applying the warmwater IBI scoring criteria. This site is a
small, headwater tributary to the Vermillion River. The channel is very narrow and was
relatively shallow. There was a mixture of hard, rock substrates with areas of fine silt and clay.
Overall species diversity was poor at this site but high metric scores were received for the
“percent of tolerant species”; “percent dominant two species”; and “number of fish per 100
meters.” Site A4 received a rating of fair when applying the coldwater IBI scoring criteria. The
site had a high metric score for the low “number of minnow species” present and fair metric
scores for the “total number of species”, “number of coldwater species”, “number of tolerant
species” and “percent of intolerant individuals” metrics. The site received low metric scores for
all other metrics.
Site A7
An interesting aspect of the 2009 fish monitoring study is that Site A7 is designated as a
coldwater steam fish community that scored “poor” using the coldwater IBI metrics but scored
“good” using the warmwater IBI scoring metrics. Site A7 actually received the highest score of
T:\1305 Vermillion\13 Fish Monitoring Project\Report\Final Report\2009 Fish Community Monitoring Report_final.doc
4-3
all reaches sampled when applying the warmwater IBI metrics (see Table 4). The high number of
species (16) collected, high number of minnow species collected and overall high number of
warmwater individuals collected all resulted in low scores for metrics under the coldwater IBI
but also resulted in high scores for metrics under the warmwater IBI scoring. The IBI results
from this study suggest two possible conclusions for site A7: 1) that the stream is a coldwater
community that has experienced significant disturbance and is now dominated by tolerant or
warmwater species; or 2) that the stream is a warmwater/coolwater community that exhibits
good community health and is capable of supporting trout or other coldwater species. Further
investigation of the stream, including historic water quality and fish community records,
macroinvertebrate IBI results from 2009, as well as habitat and geomorphic results from 2009,
would be necessary to determine if the site is a disturbed coldwater community or a “coolwater”
community.
Site A10
Site A10 is a small tributary stream that is a warmwater stream that is narrow but moderately
deep and well shaded by tall grassy vegetation on the stream banks. The site is also designated as
a MN DNR trout stream due to it being a tributary to a reach meeting the criteria for a trout
stream designation. Site A10 received a score of 45 and a rating of “fair” when applying the
warmwater IBI scoring criteria. The site scored well for the “percent dominant two species” and
“number of fish per 100 meters” metrics. The site also scored moderately well for the “number
of wetland species” and “number of invertivore species” metrics under the warmwater IBI
criteria. Site A10 received a score of 30 and a rating of “poor” when applying the coldwater IBI
scoring criteria. The site scored moderately well for the “total number of species”, “number of
coldwater species”, “number of benthic species”, and “number of coldwater individuals” metrics.
The site scored poorly for all other coldwater metrics.
Site A14
Site A14 is on the mainstem of the Vermillion River and is the site that is located farthest
downstream in the watershed of all reaches sample in the 2009 study. The site received a score of
64 and a rating of “good” when applying the warmwater IBI metrics. The site received high

T:\1305 Vermillion\13 Fish Monitoring Project\Report\Final Report\2009 Fish Community Monitoring Report_final.doc
4-4
metric scores for “total number of species”, “number of wetland species”, and “number of fish
per 100 meters.” Site A14 scored moderately well for most of the metrics in the warmwater IBI
and only the “number of intolerant species” metric scored poorly for site A14. Site A14 received
a score of 15 and a rating of “poor” when applying the coldwater IBI scoring criteria. The site
scored moderately well for the “number of benthic species” and “number of coldwater species”
metrics but scored poorly for all other metrics. Site A14 was the longest reach sampled in the
2009 study. There were some deep pools, as well as some woody snags, creating favorable
habitat for fish in this reach. However, the prevalence of long, shallow, sandy runs within the
reach may be limiting the fishing community at some level and preventing this reach from
receiving higher IBI scores.
Overall, the fish community sites in 2009 study scored moderately well when applying the
warmwater IBI criteria and in general scored poorly when applying coldwater IBI criteria. The
overall low scores for the coldwater reaches are related to low scores for several metrics
including “percent of salmonids as brook trout”; “percent of intolerant individuals”; “percent of
coldwater individuals”; “percent of white suckers”; “percent top carnivores”; “number of
coldwater individuals” and “number of warmwater individuals”.
Overall the stream fish monitoring collected a high number of white suckers, tolerant species and
warmwater individuals from all sites in the study. These metrics indicate that water quality and
habitat conditions within a reach are favoring species tolerant of watershed or stream channel
disturbance, such as increased temperature or increased silt/suspended sediment loads. The
collections at coldwater reaches collected a low number of top carnivores and coldwater
individuals. Based on the IBI metrics, healthy coldwater systems should be dominated by species
that favor coldwater conditions and include a high percentage of top carnivores.
There were no brook trout collected during this study. Brook trout are the trout species native to
Minnesota trout streams but this species is less tolerant of conditions often associated with
disturbed systems, such as increased temperature, loss of deep pool habitat/refugia or increased
sediment loads. As a result, brook trout have been extirpated from many trout streams in
T:\1305 Vermillion\13 Fish Monitoring Project\Report\Final Report\2009 Fish Community Monitoring Report_final.doc
4-5
Minnesota and across the upper Midwest. Brown trout are more tolerant of increased temperature
and sediment loads as compared to brook trout, which is the reason brown trout are often stocked
in coldwater systems. The MN DNR stocking program for the Vermillion River began in 1988,
with brook trout stocked during only one year of the program (after three years of brown trout
stocking) and brown trout being stocked during all other years. In order for brook trout to
become reestablished within the Vermillion River watershed, they would have to be stocked
under the MN DNR program or an alternate stocking effort. An analysis would need to be
conducted to determine if the current habitat and water quality conditions are adequate to allow
the establishment of a brook trout population in the Vermillion River, so that valuable resources
are not wasted. Another factor that would need to be examined is if it would be possible for the
brook trout population to coexist with the current brown trout population. The current brown
trout stocking efforts in the watershed have been successful and the species is currently highly
valued by local anglers. Therefore, it could be undesirable from a public standpoint to develop a
brook trout or alternate stocking program that would jeopardize the current trout fishery. The
lack of brook trout in the Vermillion River will continue to result in a low score for “percent of
salmonids as brook trout” metric under the coldwater IBI scoring criteria.
Due to the low coldwater IBI scores across all sites monitored in 2009, it appears that large scale
watershed and stream channel improvements may be necessary to improve the health of the
coldwater fish communities in the Vermillion River watershed if they are expected to meet
coldwater stream fish standards. In general, it appears that smaller scale changes or
improvements to watershed and stream channel conditions would be necessary to improve the
warmwater fish communities in the Vermillion River. It is also possible that the warmwater fish
communities are not as sensitive to the current disturbance conditions in the watershed, such as
temperature, which disproportionately affects coldwater fish communities.
T:\1305 Vermillion\13 Fish Monitoring Project\Report\Final Report\2009 Fish Community Monitoring Report_final.doc
5-1
5.0 References
Fish Community Sampling Protocol For Stream Monitoring Sites. (Revised February 2009). Minnesota Pollution Control Agency: Biological Monitoring Program.
Lyons, J. 1992. The Length of Stream to sample with towed electrofishing unit when fish species
richness is estimated. North American Journal of Fisheries Management. Vol. 12. pp. 198-203.
Mundahl, Neal D. and Simon, Thomas P. 1999. Development and Application of an Index of
Biotic Integrity for Coldwater Streams of the Upper Midwestern United States. pp. 383-415 In Thomas P. Simon (ed.) “Assessing the Sustainability and Biological Integrity of Water Resources Using Fish Communities”. CRC Press. Boca Raton, FL.
Niemela, Scott and Fiest, Michael D. 2002. Index of Biological Integrity Guidance for Coolwater
Rivers and Streams of the Upper Mississippi River Basin. Minnesota Pollution Control Agency: Biological Monitoring Program.

T:\1305 Vermillion\13 Fish Monitoring Project\Report\Final Report\2009 Fish Community Monitoring Report_final.doc
Figures
ÈF
ÈFÈF
ÈF
ÈF
ÈFÈF
_̂Dakota County Office
£¤52
©̈79
""3 ""316£¤61
""55
§̈¦35
45679
456747
170th St E
©̈89
A3
A1
A7
A4A10
A11A14
VERMILLION RIVER WATERSHED JPO2009 Fish Monitoring Sites
NOV 2009Figure 1
3 0 31.5Miles ³
1800 Pioneer Creek CenterMaple Plain, MN 55359-0429
Wenck Associates, Inc.Environmental Engineers
COPY
RIGH
T
LegendWatershed District Legal Boundary
ÈF Fish Monitoring Sites
StreamOrder1st Order2nd Order3rd Order4th Order9th Order
Mxd: L:\1305\12\mxd\Monitoring Stations.mxdLast Modified: 8/7/2008 3:39:09 PM
")
")
Verm
illion R
iver
VERMILLION RIVER WATERSHED JPO2009 Fish Monitoring Site A1
NOV 2009Figure 2
80 0 8040Feet ³
1800 Pioneer Creek CenterMaple Plain, MN 55359-0429
Wenck Associates, Inc.Environmental Engineers
COPY
RIGH
T
LegendA-1 Fish Monitoring Site
") Downstream End
") Upstream End
Streams
Mxd: L:\1305\13\mxd\A1 Monitoring Site.mxdLast Modified: 10/28/2009 2:27:09 PM
") ")South Creek
VERMILLION RIVER WATERSHED JPO2009 Fish Monitoring Site A3
NOV 2009Figure 3
80 0 8040Feet ³
1800 Pioneer Creek CenterMaple Plain, MN 55359-0429
Wenck Associates, Inc.Environmental Engineers
COPY
RIGH
T
LegendA-3 Fish Monitoring Site
") Downstream End
") Upstream End
Streams
Mxd: L:\1305\13\mxd\A3 Monitoring Site.mxdLast Modified: 10/28/2009 2:32:48 PM
Wenck Associates, Inc.Environmental Engineers
")
")
Unna
med t
o Verm
illion R
iver
VERMILLION RIVER WATERSHED JPO2009 Fish Monitoring Site A4
NOV 2009Figure 41800 Pioneer Creek Center
Maple Plain, MN 55359-0429
COPY
RIGH
T
80 0 8040Feet ³
Mxd: L:\1305\13\mxd\A4 Monitoring Site.mxdLast Modified: 10/28/2009 3:04:29 PM
LegendA-4 Fish Monitoring Site") Downstream End") Upstream End
Streams
Wenck Associates, Inc.Environmental Engineers
")
")
MIddle Creek
North Creek
VERMILLION RIVER WATERSHED JPO2009 Fish Monitoring Site A7
NOV 2009Figure 51800 Pioneer Creek Center
Maple Plain, MN 55359-0429
COPY
RIGH
T
80 0 8040Feet ³
LegendA-7 Fish Monitoring Site") Downstream End") Upstream End
Streams
Mxd: L:\1305\13\mxd\A7 Monitoring Site.mxdLast Modified: 10/28/2009 3:05:54 PM
Wenck Associates, Inc.Environmental Engineers
")
")
VERMILLION RIVER WATERSHED JPO2009 Fish Monitoring Site A10
NOV 2009Figure 61800 Pioneer Creek Center
Maple Plain, MN 55359-0429
COPY
RIGH
T
80 0 8040Feet ³
LegendA-10 Fish Monitoring Site") Downstream End") Upstream End
Streams
Mxd: L:\1305\13\mxd\A10 Monitoring Site.mxdLast Modified: 10/28/2009 3:07:39 PM
")
")
Unnamed to Vermillion River
VERMILLION RIVER WATERSHED JPO2009 Fish Monitoring Site A11
NOV 2009Figure 7
80 0 8040Feet ³
1800 Pioneer Creek CenterMaple Plain, MN 55359-0429
Wenck Associates, Inc.Environmental Engineers
COPY
RIGH
T
LegendA-11 Fish Monitoring Site
") Downstream End
") Upstream End
Streams
Mxd: L:\1305\13\mxd\A11 Monitoring Site.mxdLast Modified: 10/28/2009 3:09:17 PM
")
")
Vermillion River
VERMILLION RIVER WATERSHED JPO2009 Fish Monitoring Site A14
NOV 2009Figure 8
80 0 8040Feet ³
1800 Pioneer Creek CenterMaple Plain, MN 55359-0429
Wenck Associates, Inc.Environmental Engineers
COPY
RIGH
T
LegendA-14 Fish Monitoring Site
") Downstream End
") Upstream End
Streams
Mxd: L:\1305\13\mxd\A14 Monitoring Site.mxdLast Modified: 10/28/2009 3:00:29 PM

T:\1305 Vermillion\13 Fish Monitoring Project\Report\Final Report\2009 Fish Community Monitoring Report_final.doc
Appendix A
Field Photos
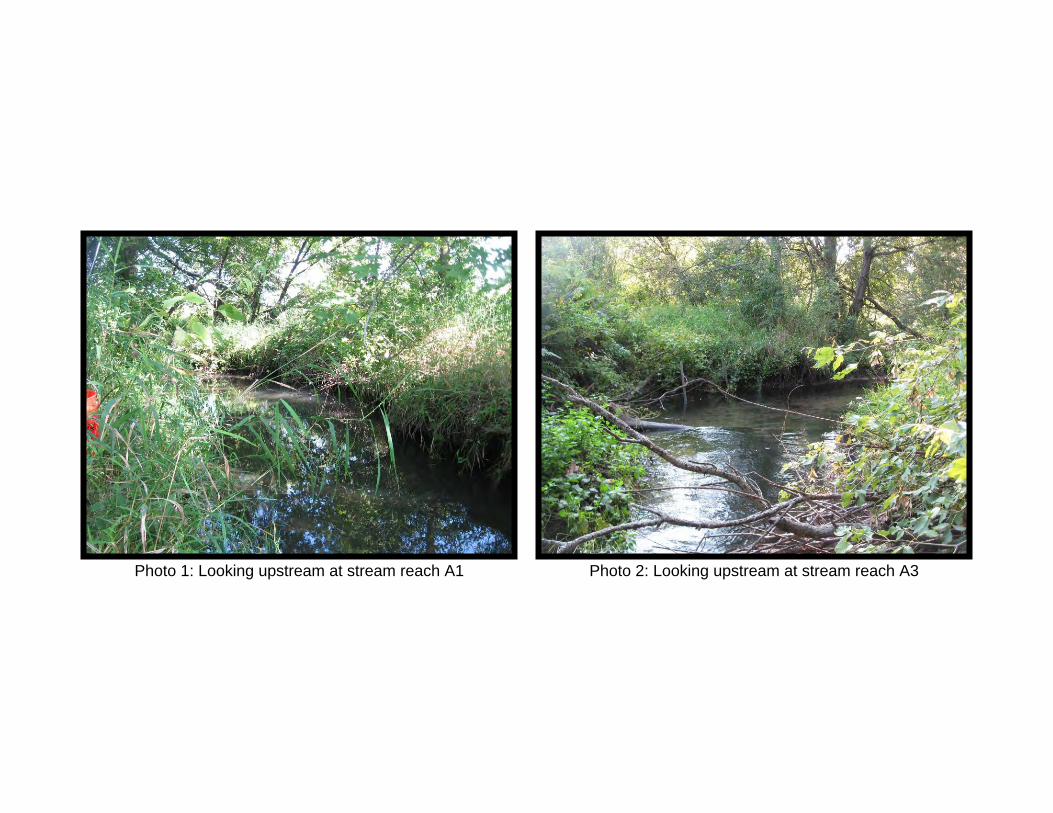
Photo 1: Looking upstream at stream reach A1 Photo 2: Looking upstream at stream reach A3
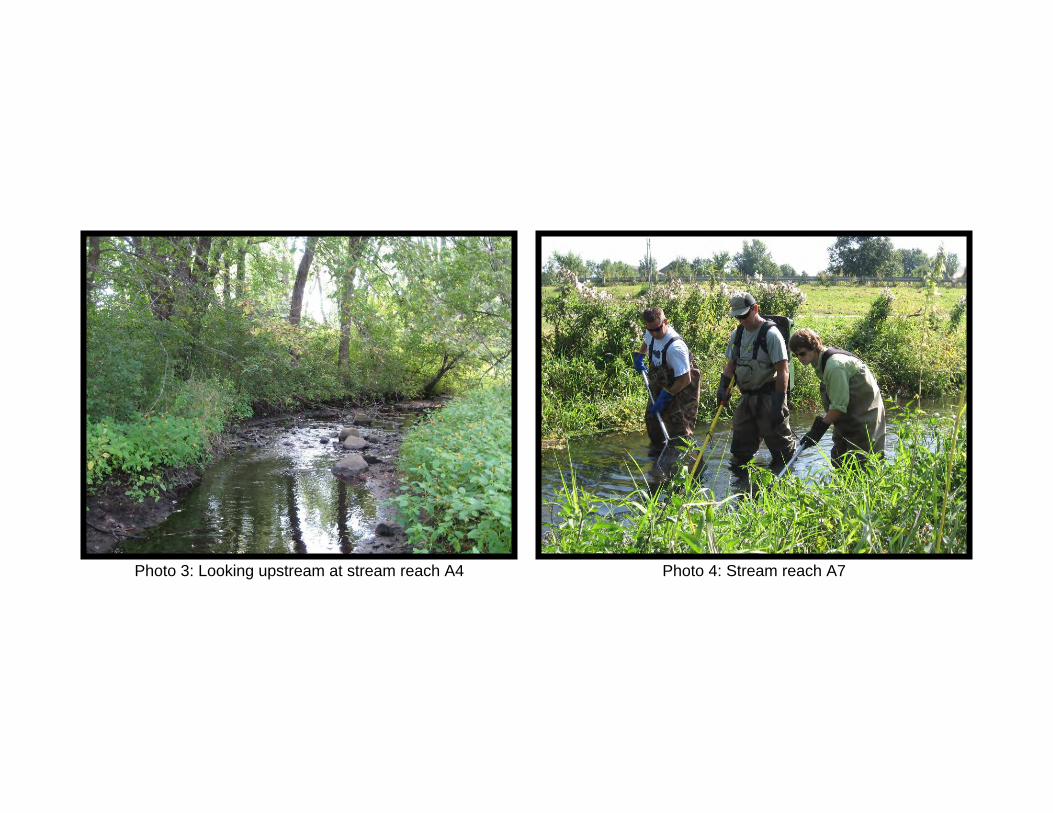
Photo 3: Looking upstream at stream reach A4 Photo 4: Stream reach A7
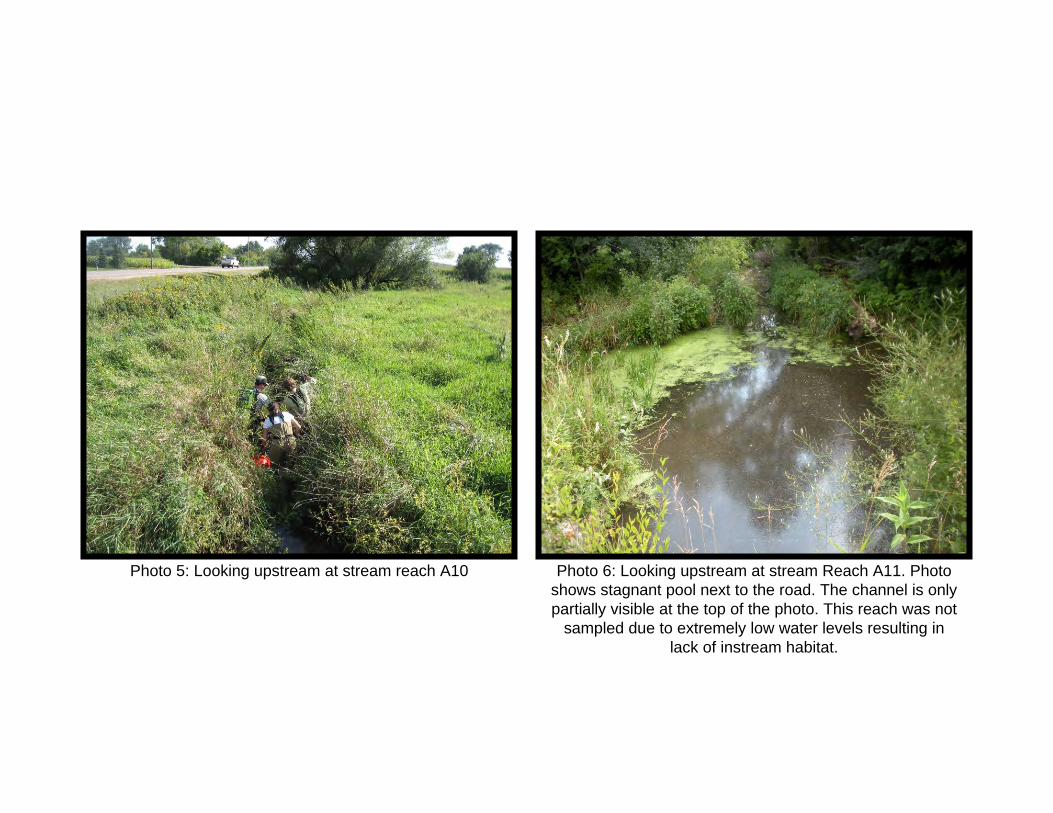
Photo 5: Looking upstream at stream reach A10 Photo 6: Looking upstream at stream Reach A11. Photo shows stagnant pool next to the road. The channel is only partially visible at the top of the photo. This reach was not
sampled due to extremely low water levels resulting in lack of instream habitat.
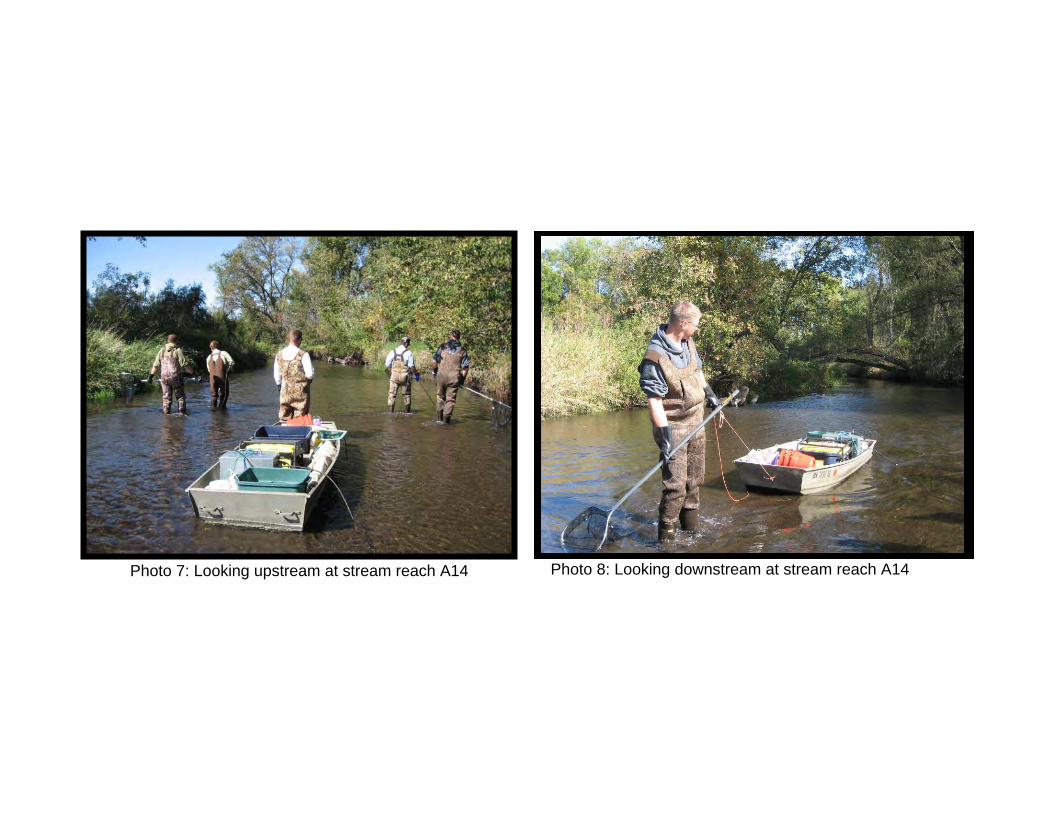
Photo 7: Looking upstream at stream reach A14 Photo 8: Looking downstream at stream reach A14
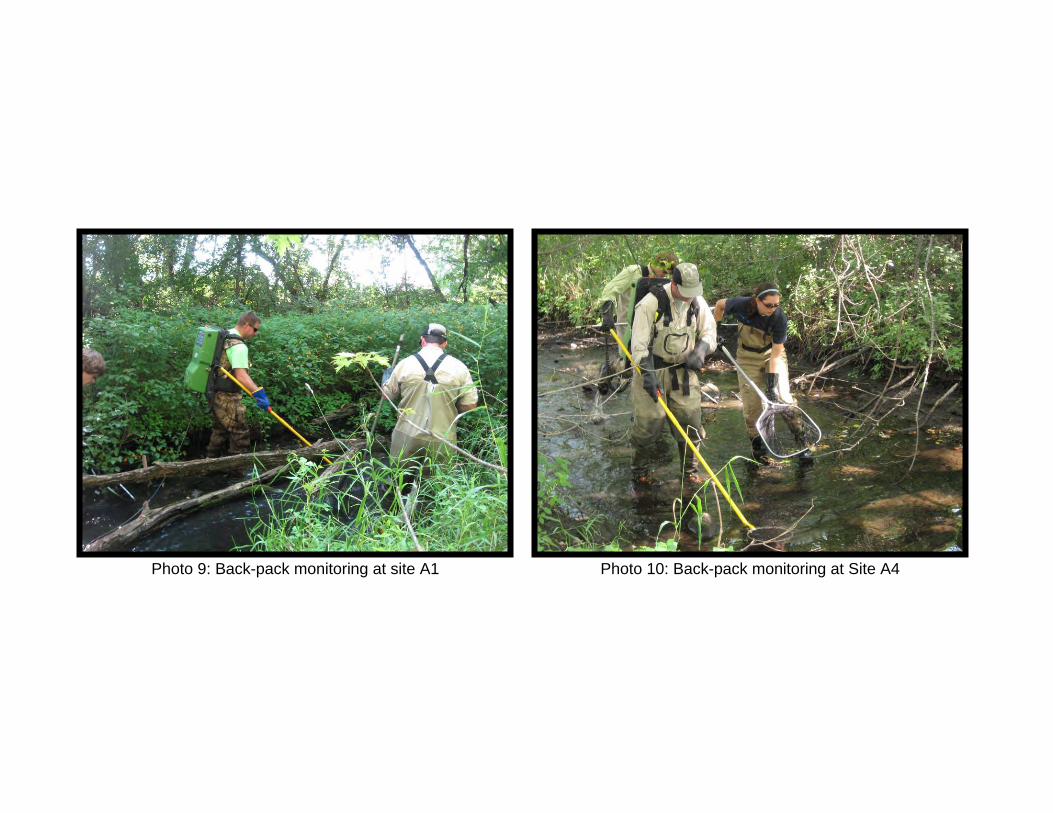
Photo 9: Back-pack monitoring at site A1 Photo 10: Back-pack monitoring at Site A4
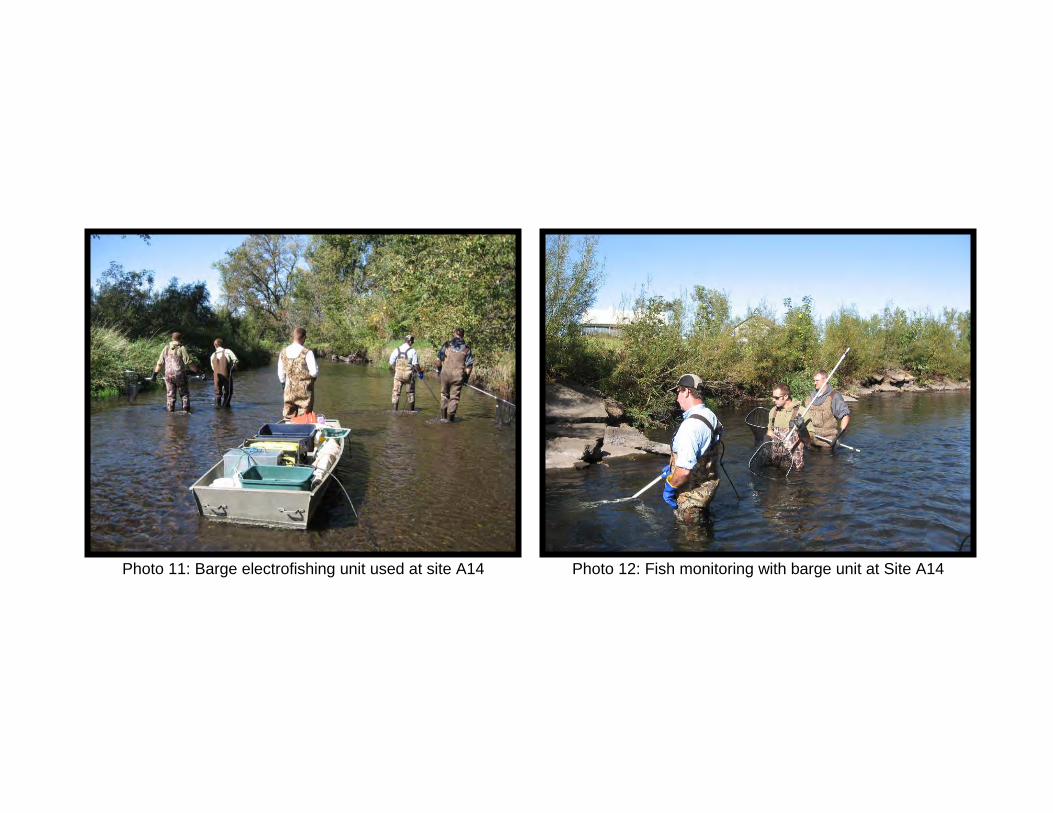
Photo 11: Barge electrofishing unit used at site A14 Photo 12: Fish monitoring with barge unit at Site A14
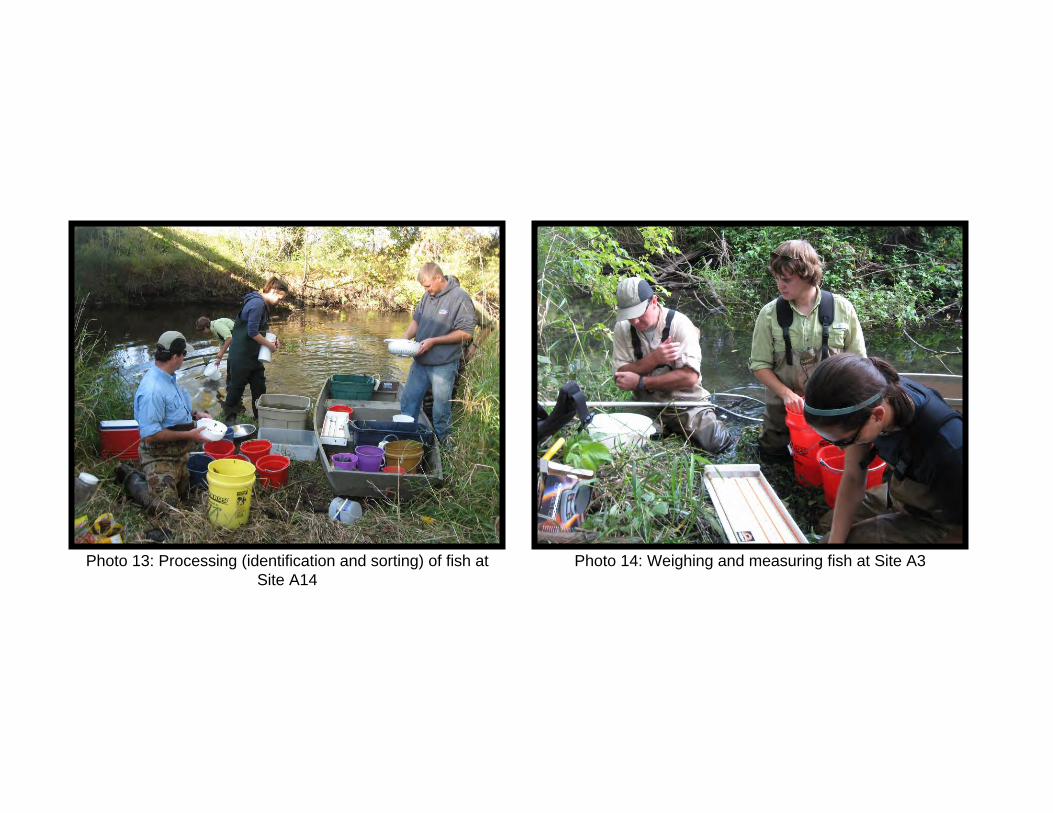
Photo 14: Weighing and measuring fish at Site A3Photo 13: Processing (identification and sorting) of fish at Site A14
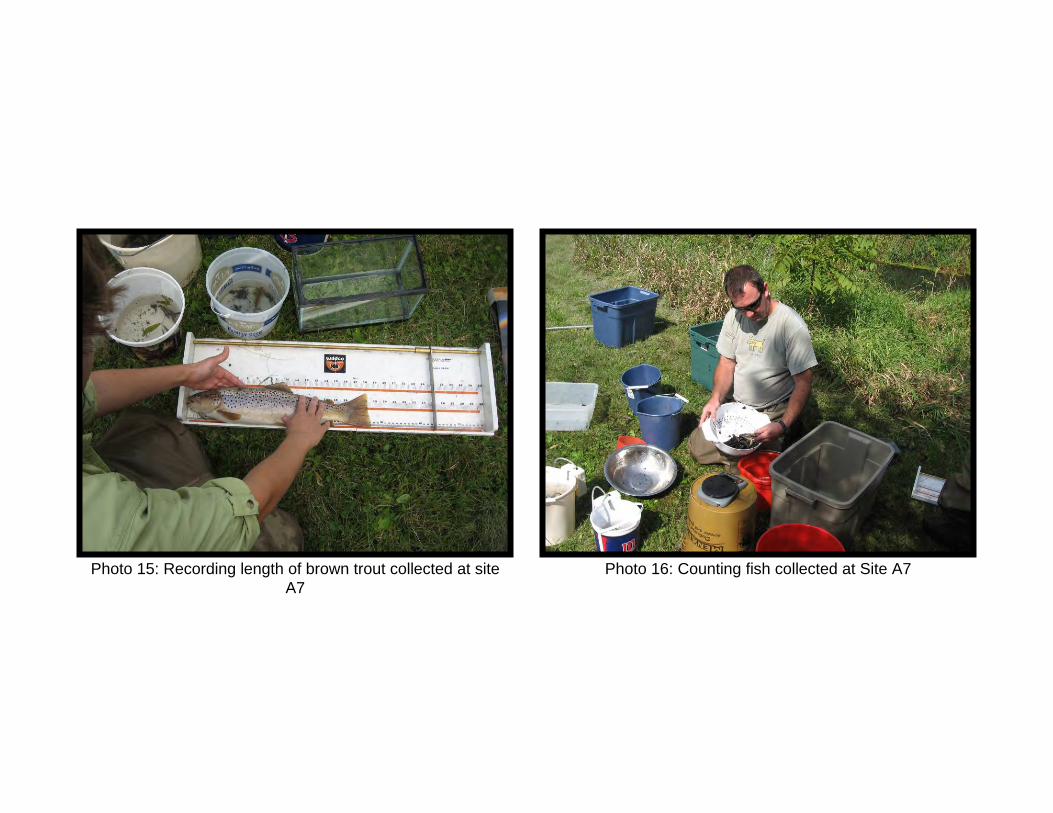
Photo 15: Recording length of brown trout collected at site A7
Photo 16: Counting fish collected at Site A7
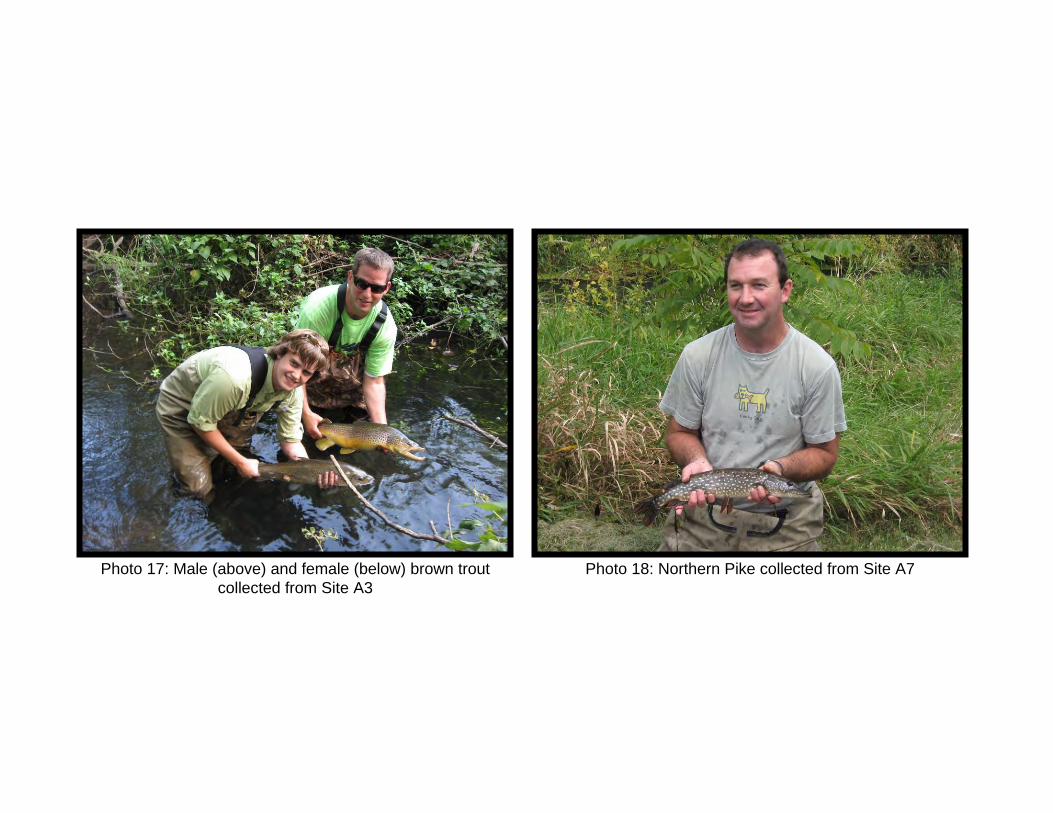
Photo 17: Male (above) and female (below) brown trout collected from Site A3
Photo 18: Northern Pike collected from Site A7
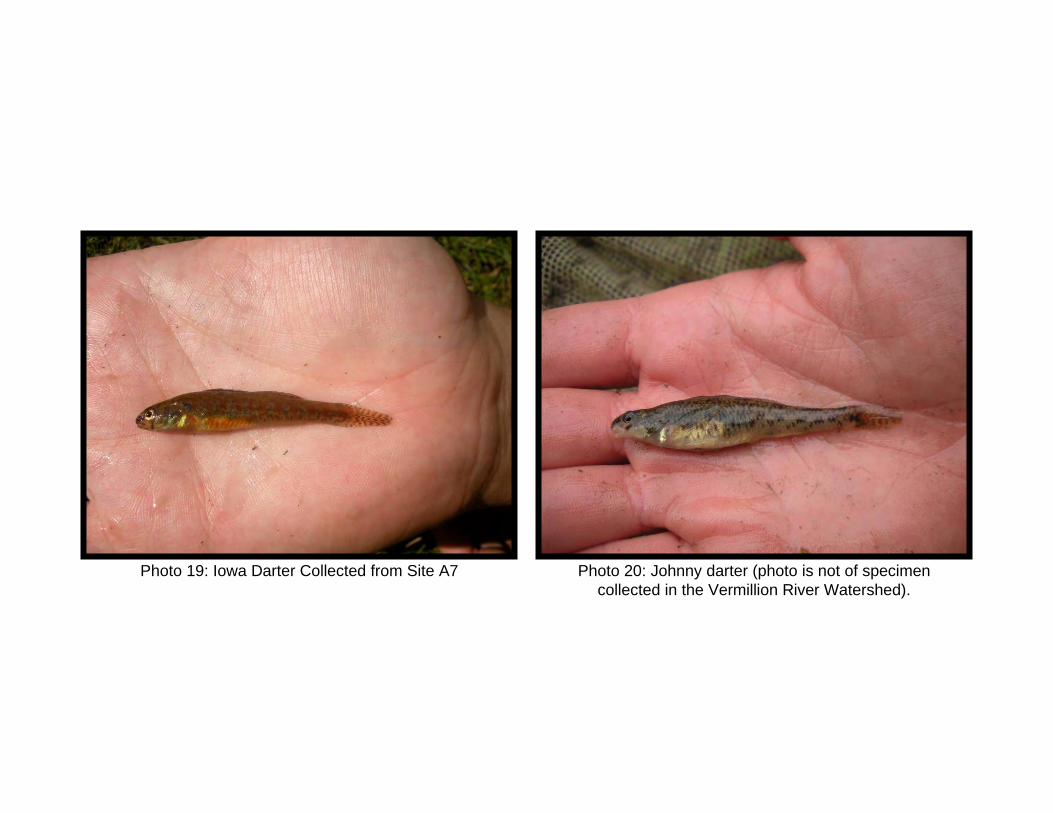
Photo 19: Iowa Darter Collected from Site A7 Photo 20: Johnny darter (photo is not of specimen collected in the Vermillion River Watershed).

Photo 21: Central mudminnow; collected from all sites. (photo is not of specimen collected in the Vermillion River
Watershed).Photo 22: Pearl dace collected at Site A10
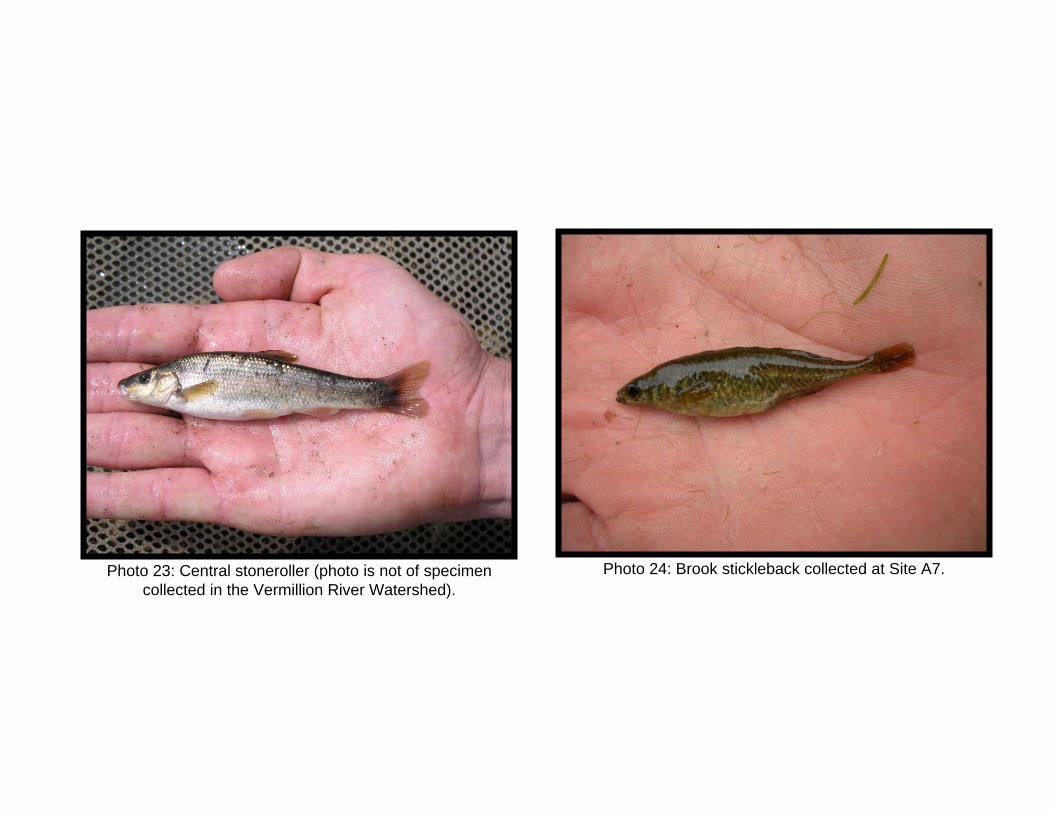
Photo 23: Central stoneroller (photo is not of specimen collected in the Vermillion River Watershed).
Photo 24: Brook stickleback collected at Site A7.

Photo 25: Common carp collected at site A14. Photo 26: Creek chub (photo is not of specimen collected in the Vermillion River Watershed).
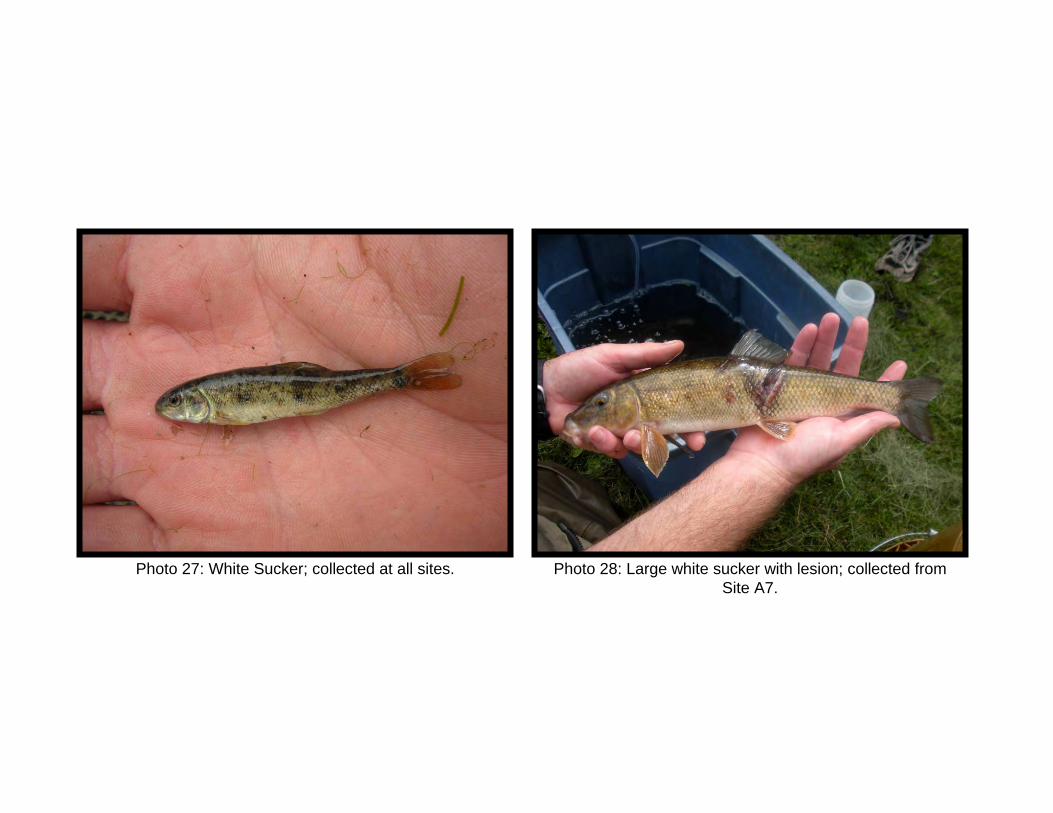
Photo 28: Large white sucker with lesion; collected from Site A7.
Photo 27: White Sucker; collected at all sites.
T:\1305 Vermillion\13 Fish Monitoring Project\Report\Final Report\2009 Fish Community Monitoring Report_final.doc
Appendix B
MN DNR Special Survey Permit
No. 15932
T:\1305 Vermillion\13 Fish Monitoring Project\Report\Final Report\2009 Fish Community Monitoring Report_final.doc
Appendix C
Stream Fish Community Monitoring: Field Data Sheets


T:\1305 Vermillion\13 Fish Monitoring Project\Report\Final Report\2009 Fish Community Monitoring Report_final.doc
Appendix D
Species Summary Table
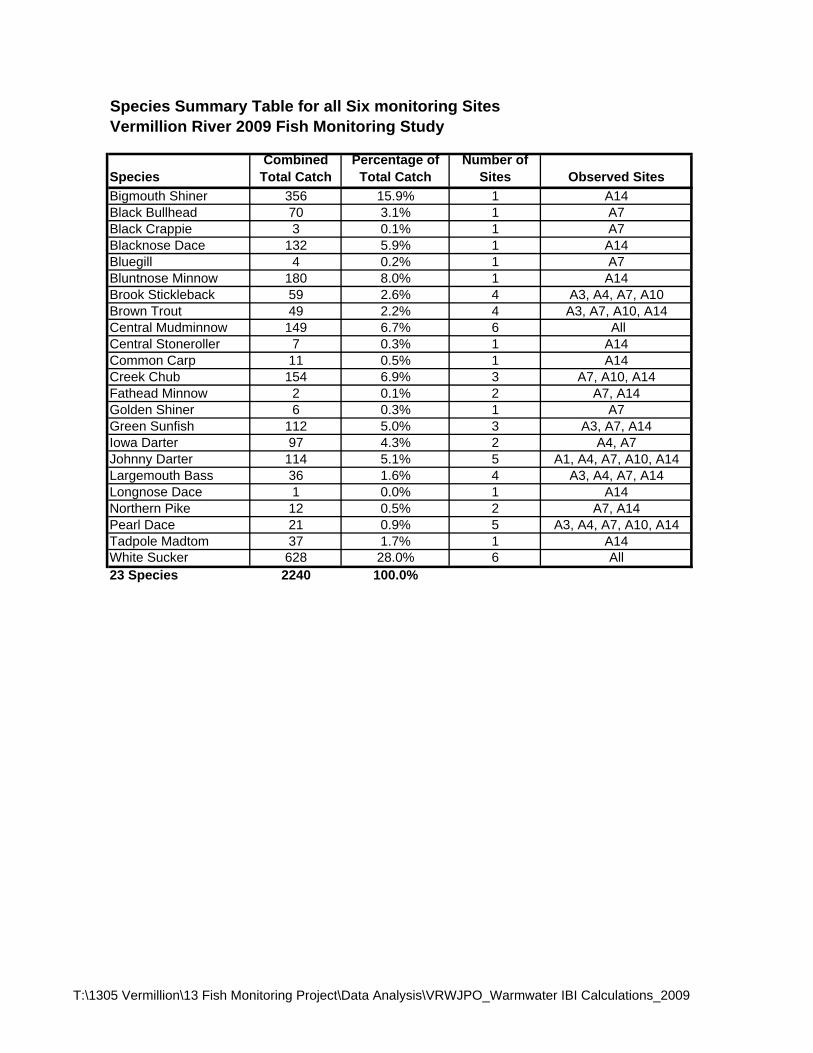
Species Summary Table for all Six monitoring SitesVermillion River 2009 Fish Monitoring Study
Species Combined
Total CatchPercentage of
Total CatchNumber of
Sites Observed SitesBigmouth Shiner 356 15.9% 1 A14Black Bullhead 70 3.1% 1 A7Black Crappie 3 0.1% 1 A7Blacknose Dace 132 5.9% 1 A14Bluegill 4 0.2% 1 A7Bluntnose Minnow 180 8.0% 1 A14Brook Stickleback 59 2.6% 4 A3, A4, A7, A10Brown Trout 49 2.2% 4 A3, A7, A10, A14Central Mudminnow 149 6.7% 6 AllCentral Stoneroller 7 0.3% 1 A14Common Carp 11 0.5% 1 A14Creek Chub 154 6.9% 3 A7, A10, A14Fathead Minnow 2 0.1% 2 A7, A14Golden Shiner 6 0.3% 1 A7Green Sunfish 112 5.0% 3 A3, A7, A14Iowa Darter 97 4.3% 2 A4, A7Johnny Darter 114 5.1% 5 A1, A4, A7, A10, A14Largemouth Bass 36 1.6% 4 A3, A4, A7, A14Longnose Dace 1 0.0% 1 A14Northern Pike 12 0.5% 2 A7, A14Pearl Dace 21 0.9% 5 A3, A4, A7, A10, A14Tadpole Madtom 37 1.7% 1 A14White Sucker 628 28.0% 6 All23 Species 2240 100.0%
T:\1305 Vermillion\13 Fish Monitoring Project\Data Analysis\VRWJPO_Warmwater IBI Calculations_2009

T:\1305 Vermillion\13 Fish Monitoring Project\Report\Final Report\2009 Fish Community Monitoring Report_final.doc
Appendix E
Trout Collections Summary Table
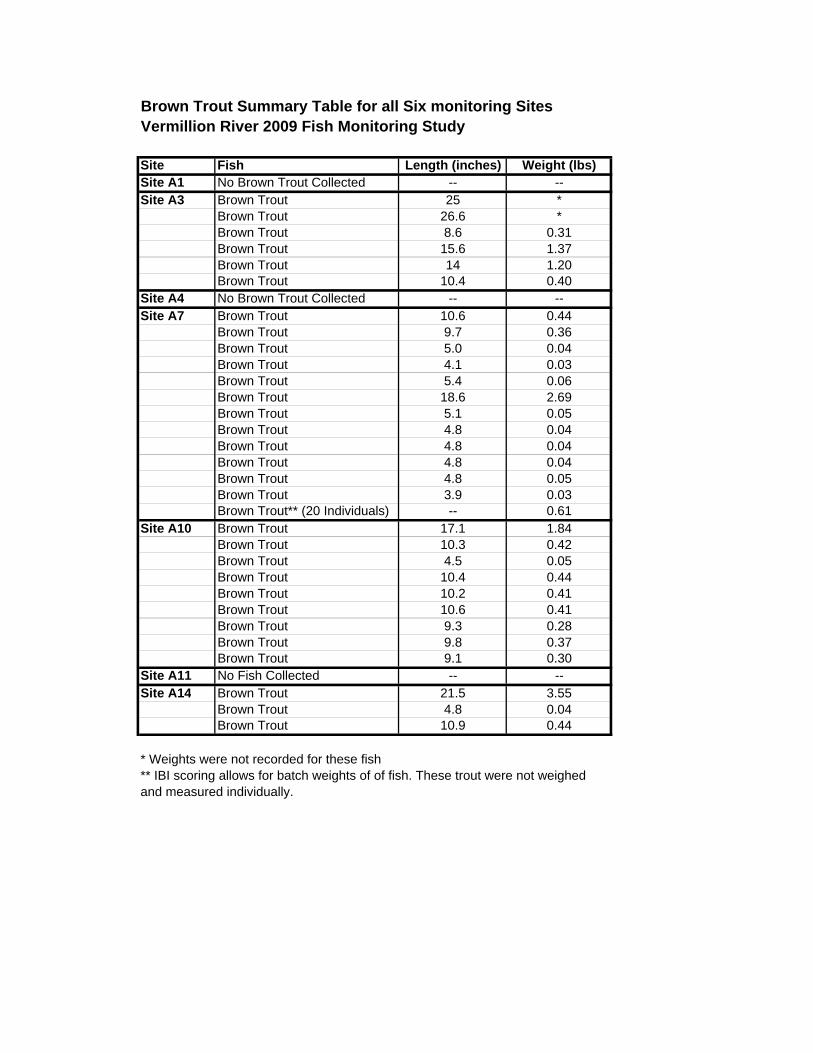
Brown Trout Summary Table for all Six monitoring SitesVermillion River 2009 Fish Monitoring Study
Site Fish Length (inches) Weight (lbs)Site A1 No Brown Trout Collected -- --Site A3 Brown Trout 25 *
Brown Trout 26.6 *Brown Trout 8.6 0.31Brown Trout 15.6 1.37Brown Trout 14 1.20Brown Trout 10.4 0.40
Site A4 No Brown Trout Collected -- --Site A7 Brown Trout 10.6 0.44
Brown Trout 9.7 0.36Brown Trout 5.0 0.04Brown Trout 4.1 0.03Brown Trout 5.4 0.06Brown Trout 18.6 2.69Brown Trout 5.1 0.05Brown Trout 4.8 0.04Brown Trout 4.8 0.04Brown Trout 4.8 0.04Brown Trout 4.8 0.05Brown Trout 3.9 0.03Brown Trout** (20 Individuals) -- 0.61
Site A10 Brown Trout 17.1 1.84Brown Trout 10.3 0.42Brown Trout 4.5 0.05Brown Trout 10.4 0.44Brown Trout 10.2 0.41Brown Trout 10.6 0.41Brown Trout 9.3 0.28Brown Trout 9.8 0.37Brown Trout 9.1 0.30
Site A11 No Fish Collected -- --Site A14 Brown Trout 21.5 3.55
Brown Trout 4.8 0.04Brown Trout 10.9 0.44
* Weights were not recorded for these fish** IBI scoring allows for batch weights of of fish. These trout were not weighedand measured individually.
T:\1305 Vermillion\13 Fish Monitoring Project\Report\Final Report\2009 Fish Community Monitoring Report_final.doc
Appendix F
IBI Scoring: Warmwater and Coldwater Metrics and Calculations
Upper Mississippi River Basin Index of Biological Integrity 18
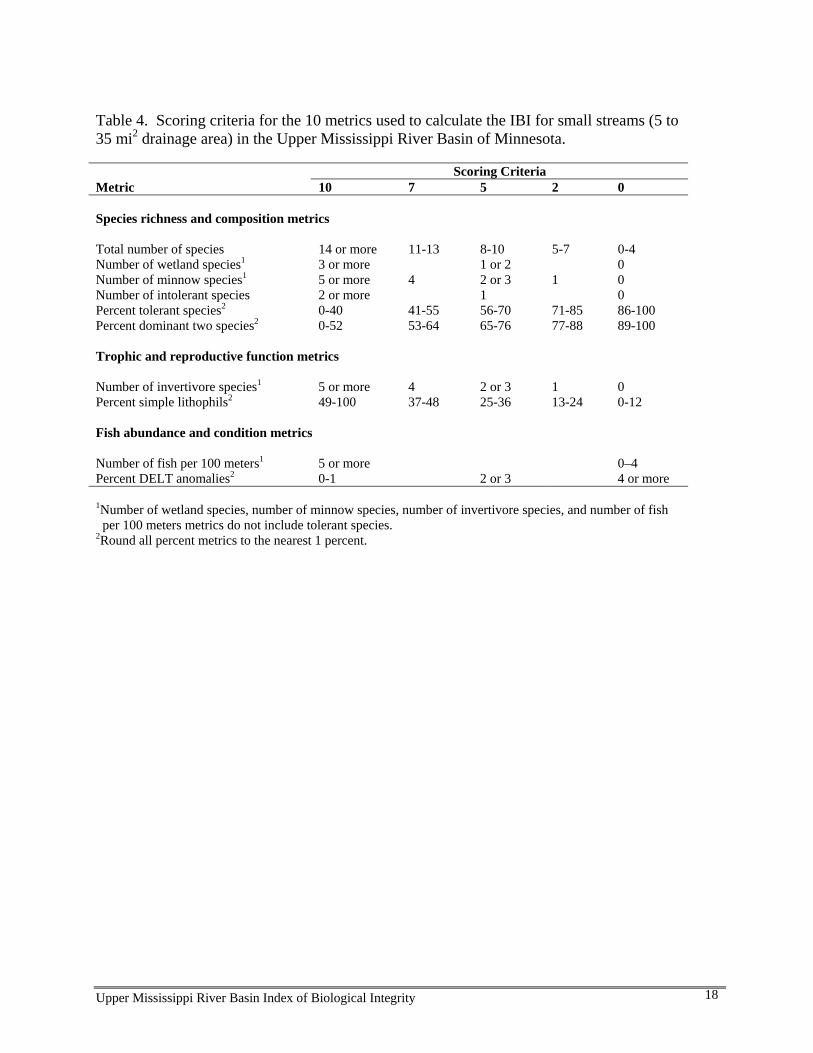
Table 4. Scoring criteria for the 10 metrics used to calculate the IBI for small streams (5 to 35 mi2 drainage area) in the Upper Mississippi River Basin of Minnesota. Scoring Criteria Metric 10 7 5 2 0 Species richness and composition metrics Total number of species 14 or more 11-13 8-10 5-7 0-4 Number of wetland species1 3 or more 1 or 2 0 Number of minnow species1 5 or more 4 2 or 3 1 0 Number of intolerant species 2 or more 1 0 Percent tolerant species2 0-40 41-55 56-70 71-85 86-100 Percent dominant two species2 0-52 53-64 65-76 77-88 89-100 Trophic and reproductive function metrics Number of invertivore species1 5 or more 4 2 or 3 1 0 Percent simple lithophils2 49-100 37-48 25-36 13-24 0-12 Fish abundance and condition metrics Number of fish per 100 meters1 5 or more 0–4 Percent DELT anomalies2 0-1 2 or 3 4 or more
1Number of wetland species, number of minnow species, number of invertivore species, and number of fish per 100 meters metrics do not include tolerant species. 2Round all percent metrics to the nearest 1 percent.

Upper Mississippi River Basin Index of Biological Integrity 19
Table 5. Narrative guidelines for interpreting the overall IBI scores for small streams (5 to 35 mi2 drainage area) in the Upper Mississippi River Basin (modified from Karr 1981, and Lyons 1992a)
Overall IBI Score
Biological Integrity Rating
Fish Community Attributes
100-80 Excellent Comparable to the best situations with minimal human disturbance; typically more than 13 species present; no more than 50% of the catch is comprised of tolerant species or dominated by two species; assemblage typically includes 1 to 3 intolerant species and 1 to 5 wetland, minnow, and invertivore species; simple lithophilic spawners comprise up to 50% of the community; a full array of age and size classes are represented
79-60 Good Species richness somewhat below expectations, from 8 to 15 species possible, but more commonly 9 to 13; no more than 70% of the catch is comprised of tolerant species or dominated by two species; assemblage typically includes 1 to 3 intolerant species and 1 to 5 wetland, minnow, and invertivore species; simple lithophilic spawners make up to 50% of the community; size/age distributions may show signs of imbalance.
59-40 Fair Decreased species richness, from 6 to 14 species possible, but more commonly 8 to 10; typically, from 50% to 90% of the catch is comprised of tolerant species or dominated by two species; assemblage typically includes no intolerant species, or if present, only 1 species; 1 to 3 wetland, minnow and invertivore species; simple lithophilic spawners comprise up to 30% of the community; size/age distributions may show signs of imbalance.
39-20 Poor Decreased species richness; from 5 and 9 species possible, but more commonly 6 to 8; almost all are tolerant species (80-98%); the dominant two species comprise from 60 to 90% of the catch; assemblage typically includes 1 to 3 wetland, minnow, and invertivore species, no intolerant species, or if present, only 1 species; simple lithophilic spawners typically make up no more than 20% of the community; size/age distributions may show signs of imbalance; growth rates and condition factors sometimes depressed; hybrids sometimes common.
19-0 Very Poor The community is indicative of a severely modified landscape and in-stream habitat; very few species present, typically between 1 and 6; almost all are tolerant forms (90-100%), the dominant two species comprise from 80 to 100% of the catch; wetland, minnow, intolerant, and invertivore species are not present, or if so, typically only 1 species present; simple lithophilic spawners comprise no more than 5% of the catch; hybrids, or exotics may be common; age/size distributions are abnormal; DELT fish (fish with deformities, eroded fins, lesions, or tumors) may be present in the most severely degraded environments.
No Score Thorough sampling finds few or no fish; impossible to calculate IBI.
Upper Mississippi River Basin Index of Biological Integrity 20
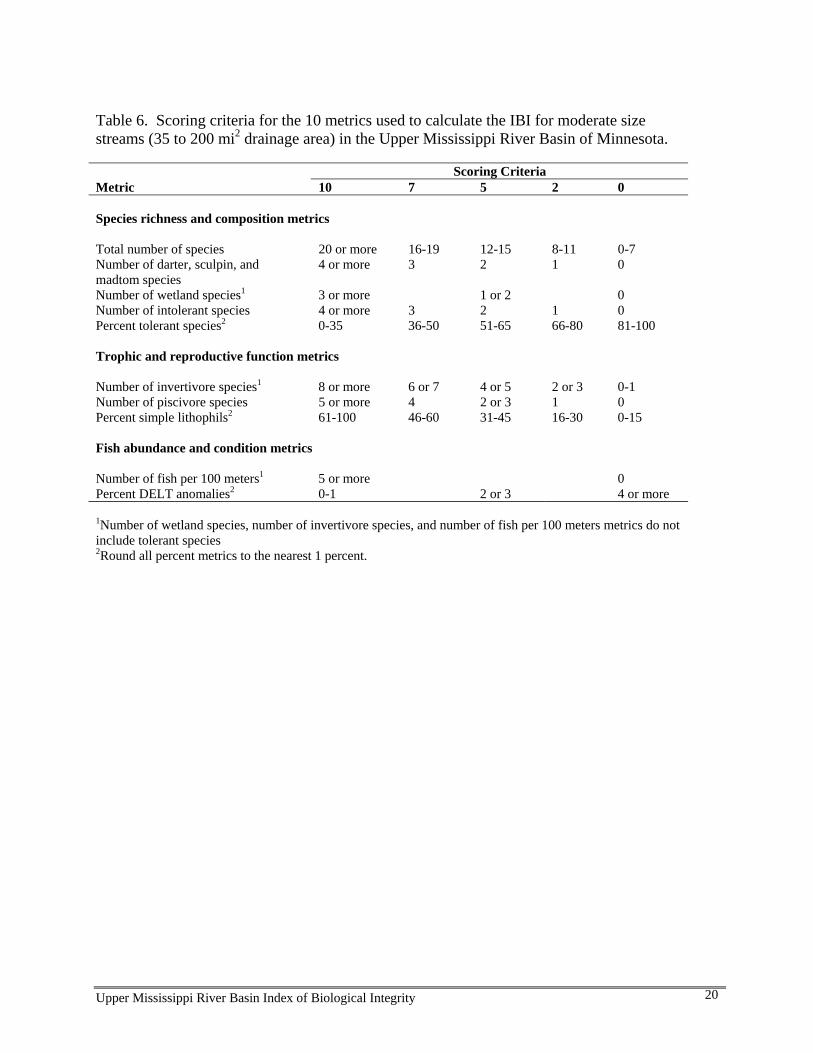
Table 6. Scoring criteria for the 10 metrics used to calculate the IBI for moderate size streams (35 to 200 mi2 drainage area) in the Upper Mississippi River Basin of Minnesota. Scoring Criteria Metric 10 7 5 2 0 Species richness and composition metrics Total number of species 20 or more 16-19 12-15 8-11 0-7 Number of darter, sculpin, and madtom species
4 or more 3 2 1 0
Number of wetland species1 3 or more 1 or 2 0 Number of intolerant species 4 or more 3 2 1 0 Percent tolerant species2 0-35 36-50 51-65 66-80 81-100 Trophic and reproductive function metrics Number of invertivore species1 8 or more 6 or 7 4 or 5 2 or 3 0-1 Number of piscivore species 5 or more 4 2 or 3 1 0 Percent simple lithophils2 61-100 46-60 31-45 16-30 0-15 Fish abundance and condition metrics Number of fish per 100 meters1 5 or more 0 Percent DELT anomalies2 0-1 2 or 3 4 or more
1Number of wetland species, number of invertivore species, and number of fish per 100 meters metrics do not include tolerant species 2Round all percent metrics to the nearest 1 percent.
Upper Mississippi River Basin Index of Biological Integrity 21
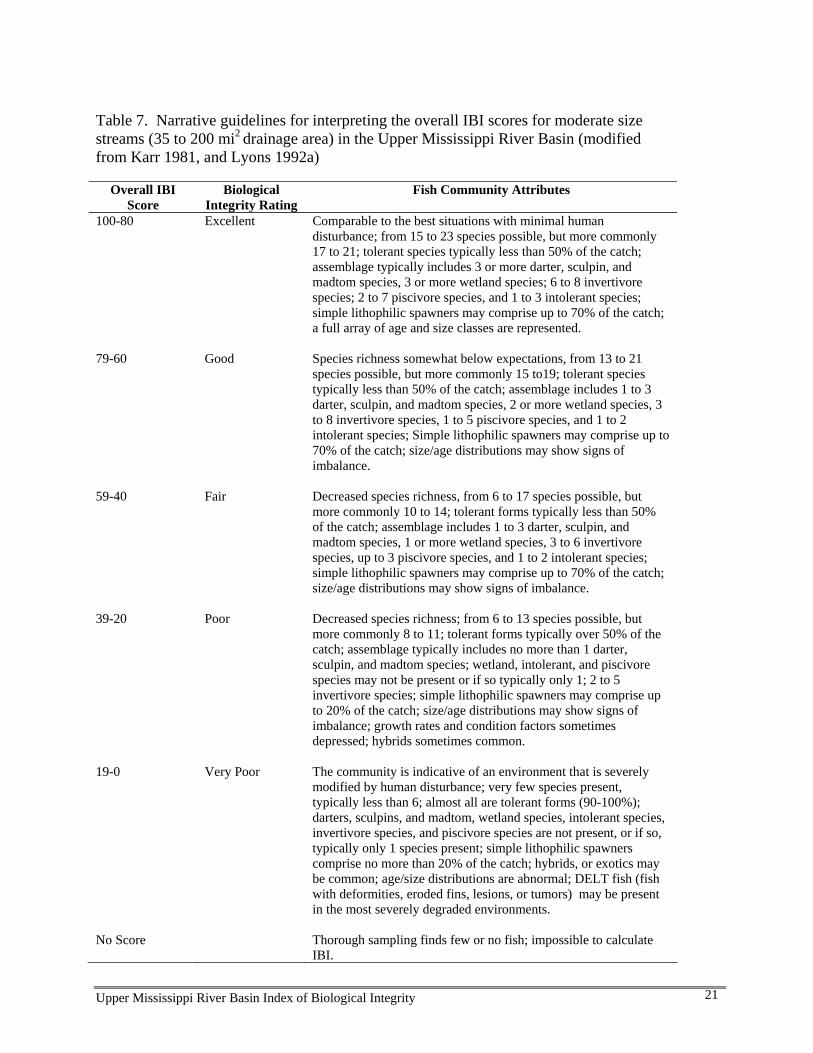
Table 7. Narrative guidelines for interpreting the overall IBI scores for moderate size streams (35 to 200 mi2 drainage area) in the Upper Mississippi River Basin (modified from Karr 1981, and Lyons 1992a)
Overall IBI Score
Biological Integrity Rating
Fish Community Attributes
100-80 Excellent Comparable to the best situations with minimal human disturbance; from 15 to 23 species possible, but more commonly 17 to 21; tolerant species typically less than 50% of the catch; assemblage typically includes 3 or more darter, sculpin, and madtom species, 3 or more wetland species; 6 to 8 invertivore species; 2 to 7 piscivore species, and 1 to 3 intolerant species; simple lithophilic spawners may comprise up to 70% of the catch; a full array of age and size classes are represented.
79-60 Good Species richness somewhat below expectations, from 13 to 21 species possible, but more commonly 15 to19; tolerant species typically less than 50% of the catch; assemblage includes 1 to 3 darter, sculpin, and madtom species, 2 or more wetland species, 3 to 8 invertivore species, 1 to 5 piscivore species, and 1 to 2 intolerant species; Simple lithophilic spawners may comprise up to 70% of the catch; size/age distributions may show signs of imbalance.
59-40 Fair Decreased species richness, from 6 to 17 species possible, but more commonly 10 to 14; tolerant forms typically less than 50% of the catch; assemblage includes 1 to 3 darter, sculpin, and madtom species, 1 or more wetland species, 3 to 6 invertivore species, up to 3 piscivore species, and 1 to 2 intolerant species; simple lithophilic spawners may comprise up to 70% of the catch; size/age distributions may show signs of imbalance.
39-20 Poor Decreased species richness; from 6 to 13 species possible, but more commonly 8 to 11; tolerant forms typically over 50% of the catch; assemblage typically includes no more than 1 darter, sculpin, and madtom species; wetland, intolerant, and piscivore species may not be present or if so typically only 1; 2 to 5 invertivore species; simple lithophilic spawners may comprise up to 20% of the catch; size/age distributions may show signs of imbalance; growth rates and condition factors sometimes depressed; hybrids sometimes common.
19-0 Very Poor The community is indicative of an environment that is severely modified by human disturbance; very few species present, typically less than 6; almost all are tolerant forms (90-100%); darters, sculpins, and madtom, wetland species, intolerant species, invertivore species, and piscivore species are not present, or if so, typically only 1 species present; simple lithophilic spawners comprise no more than 20% of the catch; hybrids, or exotics may be common; age/size distributions are abnormal; DELT fish (fish with deformities, eroded fins, lesions, or tumors) may be present in the most severely degraded environments.
No Score Thorough sampling finds few or no fish; impossible to calculate IBI.
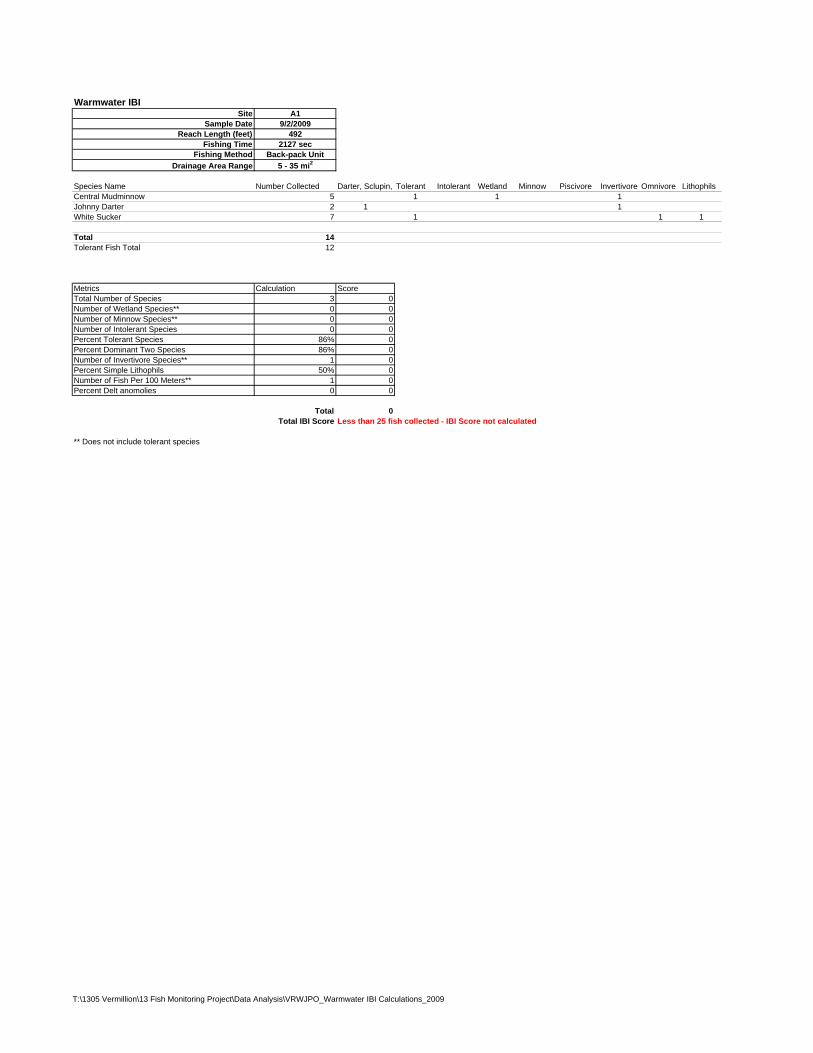
Warmwater IBISite A1
Sample Date 9/2/2009Reach Length (feet) 492
Fishing Time 2127 secFishing Method Back-pack Unit
Drainage Area Range 5 - 35 mi2
Species Name Number Collected Darter, Sclupin, Tolerant Intolerant Wetland Minnow Piscivore Invertivore Omnivore LithophilsCentral Mudminnow 5 1 1 1Johnny Darter 2 1 1White Sucker 7 1 1 1
Total 14Tolerant Fish Total 12
Metrics Calculation ScoreTotal Number of Species 3 0Number of Wetland Species** 0 0Number of Minnow Species** 0 0Number of Intolerant Species 0 0Percent Tolerant Species 86% 0Percent Dominant Two Species 86% 0Number of Invertivore Species** 1 0Percent Simple Lithophils 50% 0Number of Fish Per 100 Meters** 1 0Percent Delt anomolies 0 0
Total 0Total IBI Score Less than 25 fish collected - IBI Score not calculated
** Does not include tolerant species
T:\1305 Vermillion\13 Fish Monitoring Project\Data Analysis\VRWJPO_Warmwater IBI Calculations_2009
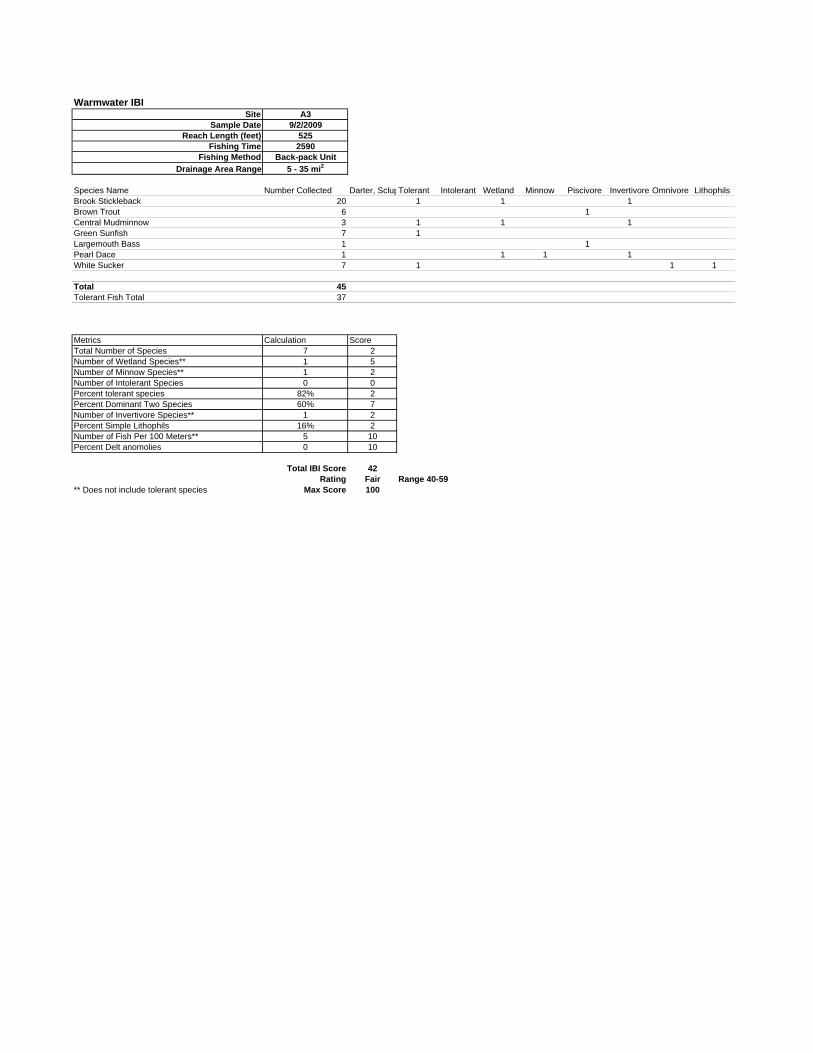
Warmwater IBISite A3
Sample Date 9/2/2009Reach Length (feet) 525
Fishing Time 2590Fishing Method Back-pack Unit
Drainage Area Range 5 - 35 mi2
Species Name Number Collected Darter, SclupTolerant Intolerant Wetland Minnow Piscivore Invertivore Omnivore LithophilsBrook Stickleback 20 1 1 1Brown Trout 6 1Central Mudminnow 3 1 1 1Green Sunfish 7 1Largemouth Bass 1 1Pearl Dace 1 1 1 1White Sucker 7 1 1 1
Total 45Tolerant Fish Total 37
Metrics Calculation ScoreTotal Number of Species 7 2Number of Wetland Species** 1 5Number of Minnow Species** 1 2Number of Intolerant Species 0 0Percent tolerant species 82% 2Percent Dominant Two Species 60% 7Number of Invertivore Species** 1 2Percent Simple Lithophils 16% 2Number of Fish Per 100 Meters** 5 10Percent Delt anomolies 0 10
Total IBI Score 42Rating Fair Range 40-59
** Does not include tolerant species Max Score 100

Warmwater IBISite A4
Sample Date 9/2/2009Reach Length (feet) 492
Fishing Time 1324Fishing Method Back-pack Unit
Drainage Area Range 5 - 35 mi2
Species Name Number Collected Darter, SclupTolerant Intolerant Wetland Minnow Piscivore Invertivore Omnivore LithophilsBrook Stickleback 18 1 1 1Central Mudminnow 1 1 1 1Iowa Darter 10 1 1 1 1Johnny Darter 14 1 1Largemouth Bass 1 1Pearl Dace 4 1 1 1White Sucker 12 1 1 1
Total 60Tolerant Fish Total 31
Metrics Calculation ScoreTotal Number of Species 7 2Number of Wetland Species** 2 5Number of Minnow Species** 1 2Number of Intolerant Species 1 5Percent tolerant species 52% 7Percent Dominant Two Species 53% 7Number of Invertivore Species** 3 5Percent Simple Lithophils 20% 2Number of Fish Per 100 Meters** 19 10Percent Delt anomolies 0 10
Total IBI Score 55Rating Fair Range 40-59
** Does not include tolerant species Max Score 100

Warmwater IBISite A7
Sample Date 9/3/2009Reach Length (feet) 500
Fishing Time 4238 secFishing Method Back-pack Unit
Drainage Area Range 5 - 35 mi2
Species Name Number Collected Darter, SclupinTolerant Intolerant Wetland Minnow Piscivore Invertivore Omnivore LithophilsBlack Bullhead 70 1 1 1Black Crappie 3 1Bluegill 4 1Brook Stickleback 2 1 1 1Brown Trout 32 1Central Mudminnow 110 1 1 1Creek Chub 4 1 1Fathead Minnow 1 1 1 1 1Golden Shiner 6 1 1 1Green Sunfish 89 1Iowa Darter 87 1 1 1 1Johnny Darter 3 1 1Largemouth Bass 33 1Northern Pike 6 1 1Pearl Dace 11 1 1 1White Sucker 164 1 1 1
Total 625Tolerant Fish Total 446
Metrics Calculation ScoreTotal Number of Species 16 10Number of Wetland Species** 3 10Number of Minnow Species** 1 2Number of Intolerant Species 1 5Percent tolerant species 71% 2Percent Dominant Two Species 44% 10Number of Invertivore Species** 4 7Percent Simple Lithophils 26% 2Number of Fish Per 100 Meters** 117 10Percent Delt anomolies 1 10
Total IBI Score 68Rating Good Range 60-79
** Does not include tolerant species Max Score 100
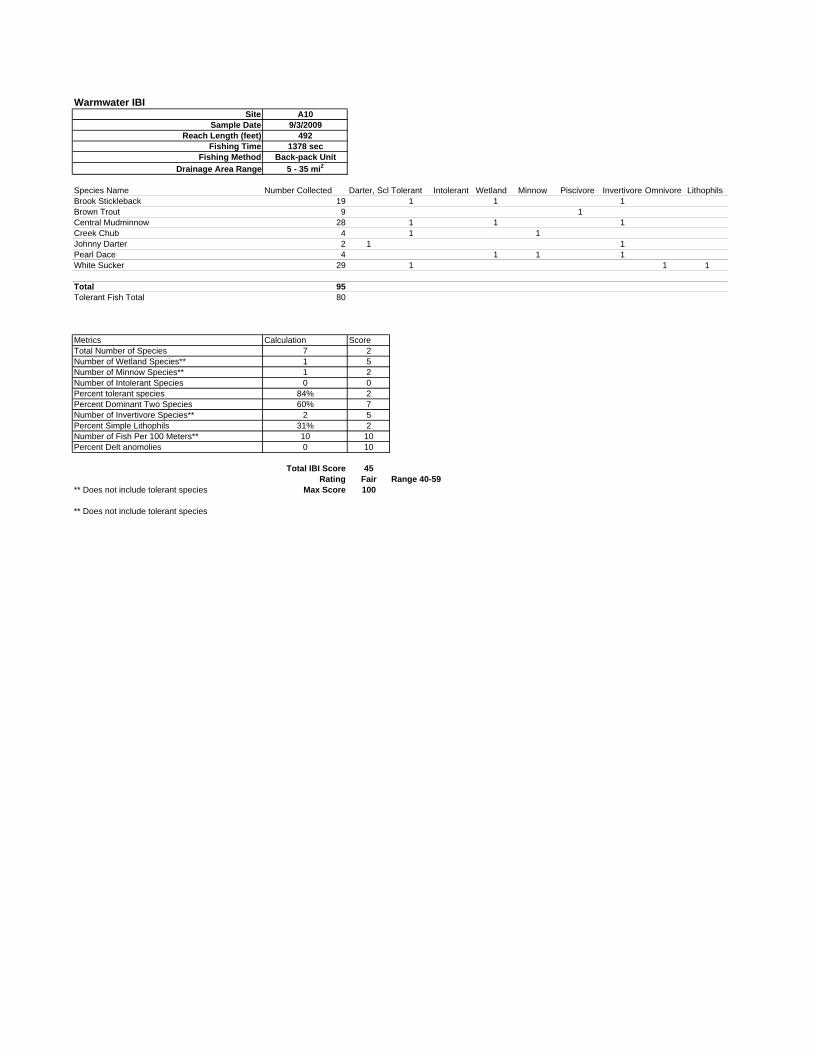
Warmwater IBISite A10
Sample Date 9/3/2009Reach Length (feet) 492
Fishing Time 1378 secFishing Method Back-pack Unit
Drainage Area Range 5 - 35 mi2
Species Name Number Collected Darter, Scl Tolerant Intolerant Wetland Minnow Piscivore Invertivore Omnivore LithophilsBrook Stickleback 19 1 1 1Brown Trout 9 1Central Mudminnow 28 1 1 1Creek Chub 4 1 1Johnny Darter 2 1 1Pearl Dace 4 1 1 1White Sucker 29 1 1 1
Total 95Tolerant Fish Total 80
Metrics Calculation ScoreTotal Number of Species 7 2Number of Wetland Species** 1 5Number of Minnow Species** 1 2Number of Intolerant Species 0 0Percent tolerant species 84% 2Percent Dominant Two Species 60% 7Number of Invertivore Species** 2 5Percent Simple Lithophils 31% 2Number of Fish Per 100 Meters** 10 10Percent Delt anomolies 0 10
Total IBI Score 45Rating Fair Range 40-59
** Does not include tolerant species Max Score 100
** Does not include tolerant species
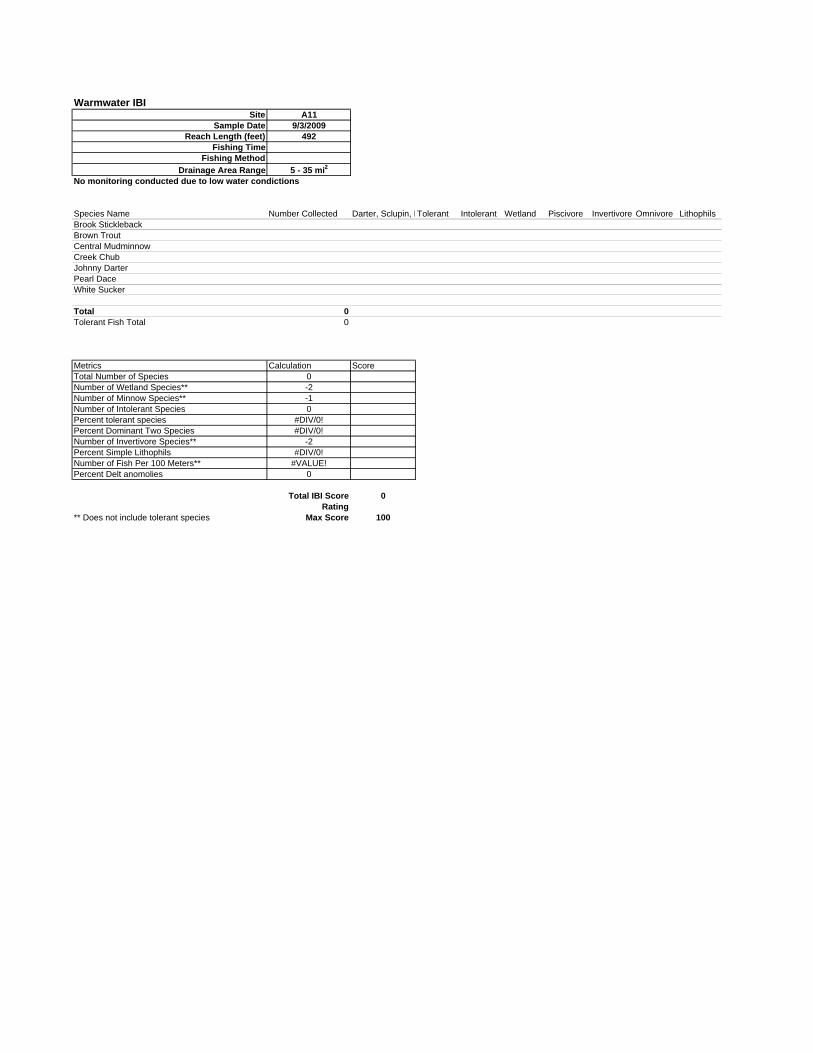
Warmwater IBISite A11
Sample Date 9/3/2009Reach Length (feet) 492
Fishing TimeFishing Method
Drainage Area Range 5 - 35 mi2
No monitoring conducted due to low water condictions
Species Name Number Collected Darter, Sclupin, MTolerant Intolerant Wetland Piscivore Invertivore Omnivore LithophilsBrook SticklebackBrown TroutCentral MudminnowCreek ChubJohnny DarterPearl DaceWhite Sucker
Total 0Tolerant Fish Total 0
Metrics Calculation ScoreTotal Number of Species 0Number of Wetland Species** -2Number of Minnow Species** -1Number of Intolerant Species 0Percent tolerant species #DIV/0!Percent Dominant Two Species #DIV/0!Number of Invertivore Species** -2Percent Simple Lithophils #DIV/0!Number of Fish Per 100 Meters** #VALUE!Percent Delt anomolies 0
Total IBI Score 0Rating
** Does not include tolerant species Max Score 100

Warmwater IBISite A14
Sample Date 9/30/2009Reach Length (feet) 1225
Fishing Time 102 min 4 secFishing Method Barge Unit
Drainage Area Range 35 - 200 mi2
Species Name Number Collected Darter, SclupTolerant Intolerant Wetland Piscivore Invertivore Omnivore LithophilsBigmouth Shiner 356 1Blacknose Dace 132 1 1Bluntnose Minnow 180 1Brown Trout 3 1Central Mudminnow 2 1 1 1Central Stoneroller 7Common Carp 11 1 1Creek Chub 146 1Fathead Minnow 1 1 1 1Green Sunfish 16 1Johnny Darter 93 1 1Largemouth Bass 1 1Longnose Dace 1 1 1 1Northern Pike 6 1 1Pearl Dace 1 1 1Tadpole Madtom 37 1 1 1White Sucker 409 1 1 1
Total 1402Tolerant Fish Total 897
Metrics Calculation ScoreTotal Number of Species 17 7Number of Darter, Sclupin and Madtom species 2 5Number of Wetland Species** 3 10Number of Intolerant Species 1 2Percent tolerant species 64% 5Number of Invertivore Species** 5 5Number of Piscivore Species 3 5Percent Simple Lithophils 39% 5Number of Fish Per 100 Meters** 135 10Percent Delt anomolies 0 10
Total IBI Score 64Rating Good Range 60-79
** Does not include tolerant species Max Score 100
Coldwater IBI Site A1
Sample Date 9/2/2009Reach Length (feet) 492
Fishing Time 2127 secFishing Method Back-pack Unit
Species Name Number Collected Tolerant Minnow Intolerant Top Carniv Benthic ColdwaterCentral Mudminnow 5 1Johnny Darter 2 1White Sucker 7 1 1
Total 14Tolerant Individuals 12Intolerant Individuals 0Coldwater Individuals 0Top Carnivore Individuals 0
Metrics Calculation ScoreTotal Number of Species 3 0Number of Coldwater Species 0 0Number of Minnow Species 0 0Number of Benthic Species 2 0Number of Tolerant Species 2 0Percent Salmonids as Brook Trout 0% 0Percent intolerant Individuals 0% 0Percent Coldwater Individuals 0% 0Percent White Suckers 50% 0Percent Top Carnivores 0% 0Number Coldwater Individuals 0 0Number Warmwater Individuals 14 0
Total 0Total IBI Score Less than 25 fish collected - IBI Score not calculated
Max Score 120
T:\1305 Vermillion\13 Fish Monitoring Project\Data Analysis\VRWJPO_Coldwater IBI Calculations_2009
Coldwater IBI Site A3
Sample Date 9/2/2009Reach Length (feet) 525
Fishing Time 2590Fishing Method Back-pack Unit
Species Name Number Collected Tolerant Minnow Intolerant Top Carniv Benthic ColdwaterBrook Stickleback 20 1Brown Trout 6 1 1Central Mudminnow 3 1Green Sunfish 7 1Largemouth Bass 1 1Pearl Dace 1 1 1White Sucker 7 1 1
Total 45Tolerant Individuals 17Intolerant Individuals 0Coldwater Individuals 27Top Carnivore Individuals 7
Metrics Calculation ScoreTotal Number of Species 7 5Number of Coldwater Species 3 5Number of Minnow Species 1 10Number of Benthic Species 1 10Number of Tolerant Species 3 5Percent Salmonids as Brook Trout 0% 0Percent intolerant Individuals 0% 0Percent Coldwater Individuals 60% 5Percent White Suckers 16% 0Percent Top Carnivores 16% 0Number Coldwater Individuals 27 0Number Warmwater Individuals 18 5
Total IBI Score 45Rating Fair Range 35-65
Max Score 120
Coldwater IBI Site A4
Sample Date 9/2/2009Reach Length (feet) 492
Fishing Time 1324Fishing Method Back-pack Unit
Average Width (meters) 2.3
Species Name Number Collected Tolerant Minnow Intolerant Top Carniv Benthic ColdwaterBrook Stickleback 18 1Central Mudminnow 1 1Iowa Darter 10 1 1Johnny Darter 14 1Largemouth Bass 1 1Pearl Dace 4 1 1White Sucker 12 1 1
Total 60Tolerant Individuals 13Intolerant Individuals 10Coldwater Individuals 22Top Carnivore Individuals 1
Metrics Calculation ScoreTotal Number of Species 7 5Number of Coldwater Species 2 5Number of Minnow Species 1 10Number of Benthic Species 3 0Number of Tolerant Species 2 5Percent Salmonids as Brook Trout 0% 0Percent intolerant Individuals 17% 5Percent Coldwater Individuals 37% 0Percent White Suckers 20% 0Percent Top Carnivores 2% 0Number Coldwater Individuals 22 0Number Warmwater Individuals 38 5
Total IBI Score 35Rating Fair Range 35-65
Max Score 120
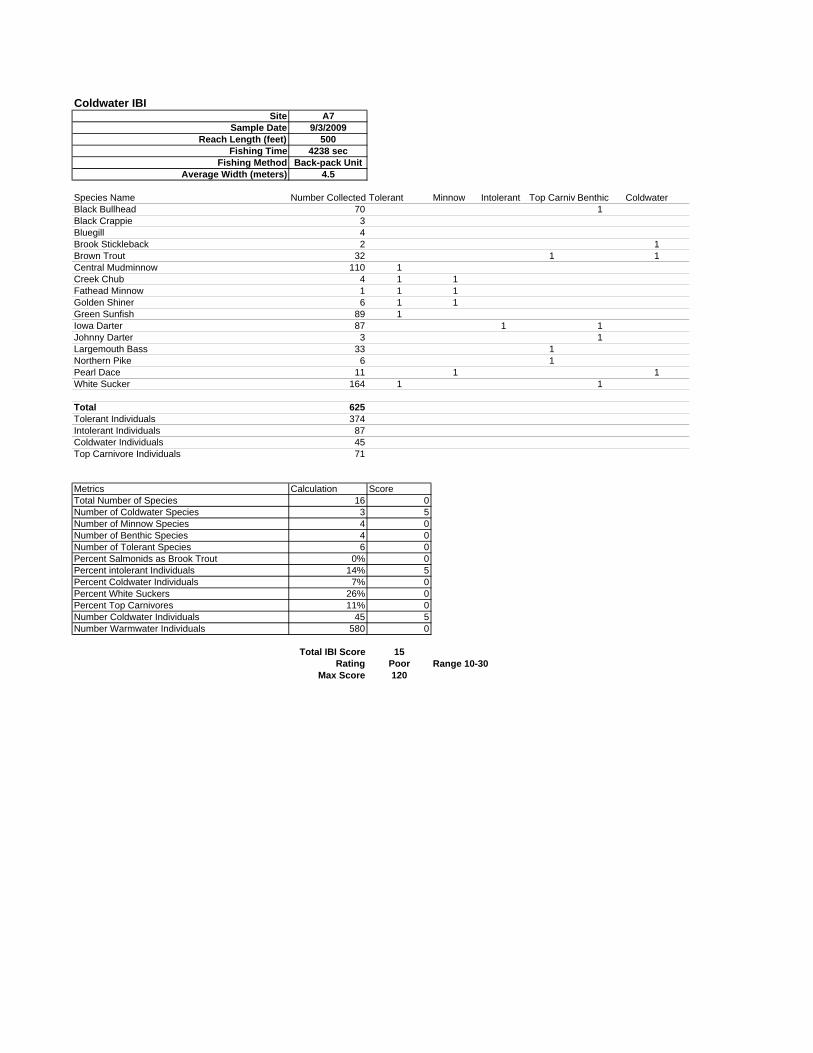
Coldwater IBI Site A7
Sample Date 9/3/2009Reach Length (feet) 500
Fishing Time 4238 secFishing Method Back-pack Unit
Average Width (meters) 4.5
Species Name Number Collected Tolerant Minnow Intolerant Top Carniv Benthic ColdwaterBlack Bullhead 70 1Black Crappie 3Bluegill 4Brook Stickleback 2 1Brown Trout 32 1 1Central Mudminnow 110 1Creek Chub 4 1 1Fathead Minnow 1 1 1Golden Shiner 6 1 1Green Sunfish 89 1Iowa Darter 87 1 1Johnny Darter 3 1Largemouth Bass 33 1Northern Pike 6 1Pearl Dace 11 1 1White Sucker 164 1 1
Total 625Tolerant Individuals 374Intolerant Individuals 87Coldwater Individuals 45Top Carnivore Individuals 71
Metrics Calculation ScoreTotal Number of Species 16 0Number of Coldwater Species 3 5Number of Minnow Species 4 0Number of Benthic Species 4 0Number of Tolerant Species 6 0Percent Salmonids as Brook Trout 0% 0Percent intolerant Individuals 14% 5Percent Coldwater Individuals 7% 0Percent White Suckers 26% 0Percent Top Carnivores 11% 0Number Coldwater Individuals 45 5Number Warmwater Individuals 580 0
Total IBI Score 15Rating Poor Range 10-30
Max Score 120

Coldwater IBI Site A10
Sample Date 9/3/2009Reach Length (feet) 492
Fishing Time 1378 secFishing Method Back-pack Unit
Average Width (meters) 1.8
Species Name Number Collected Tolerant Minnow Intolerant Top Carniv Benthic ColdwaterBrook Stickleback 19 1Brown Trout 9 1 1Central Mudminnow 28 1Creek Chub 4 1 1Johnny Darter 2 1Pearl Dace 4 1 1White Sucker 29 1 1
Total 95Tolerant Individuals 61Intolerant Individuals 0Coldwater Individuals 32Top Carnivore Individuals 9
Metrics Calculation ScoreTotal Number of Species 7 5Number of Coldwater Species 3 5Number of Minnow Species 2 0Number of Benthic Species 2 10Number of Tolerant Species 3 5Percent Salmonids as Brook Trout 0% 0Percent intolerant Individuals 0% 0Percent Coldwater Individuals 34% 0Percent White Suckers 31% 0Percent Top Carnivores 9% 0Number Coldwater Individuals 32 5Number Warmwater Individuals 63 0
Total IBI Score 30Rating Poor Range 10-30
Max Score 120
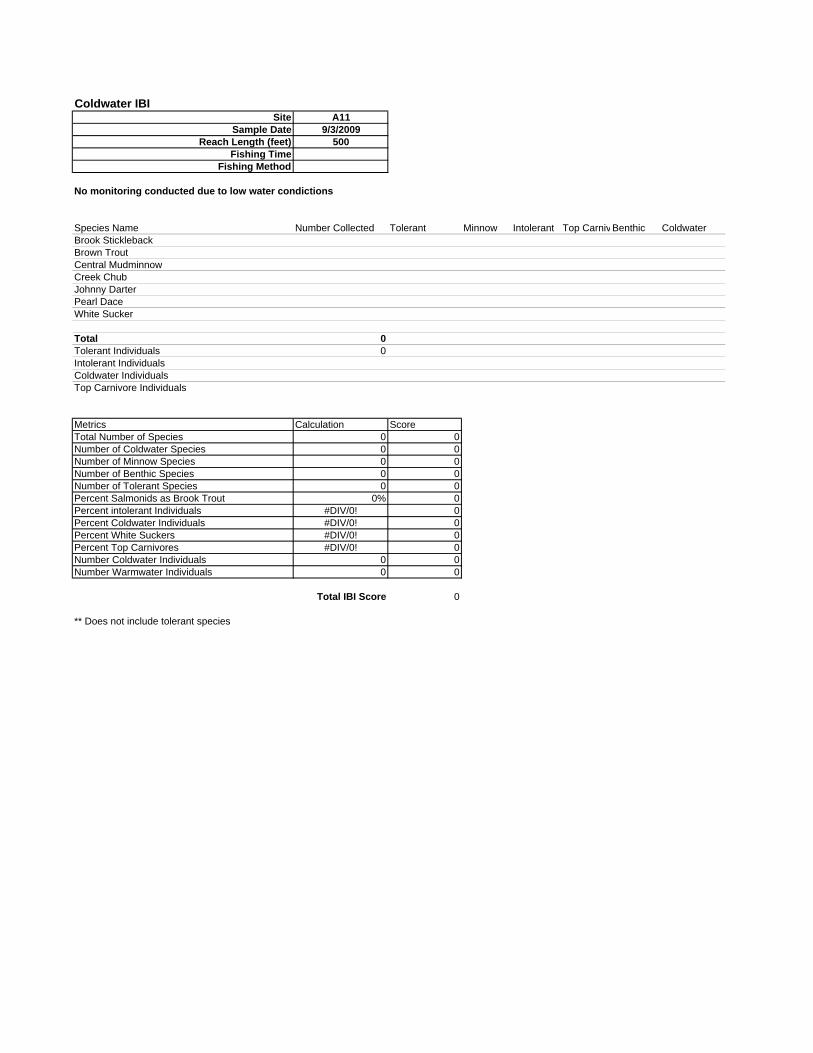
Coldwater IBI Site A11
Sample Date 9/3/2009Reach Length (feet) 500
Fishing TimeFishing Method
No monitoring conducted due to low water condictions
Species Name Number Collected Tolerant Minnow Intolerant Top CarnivBenthic ColdwaterBrook SticklebackBrown TroutCentral MudminnowCreek ChubJohnny DarterPearl DaceWhite Sucker
Total 0Tolerant Individuals 0Intolerant IndividualsColdwater IndividualsTop Carnivore Individuals
Metrics Calculation ScoreTotal Number of Species 0 0Number of Coldwater Species 0 0Number of Minnow Species 0 0Number of Benthic Species 0 0Number of Tolerant Species 0 0Percent Salmonids as Brook Trout 0% 0Percent intolerant Individuals #DIV/0! 0Percent Coldwater Individuals #DIV/0! 0Percent White Suckers #DIV/0! 0Percent Top Carnivores #DIV/0! 0Number Coldwater Individuals 0 0Number Warmwater Individuals 0 0
Total IBI Score 0
** Does not include tolerant species
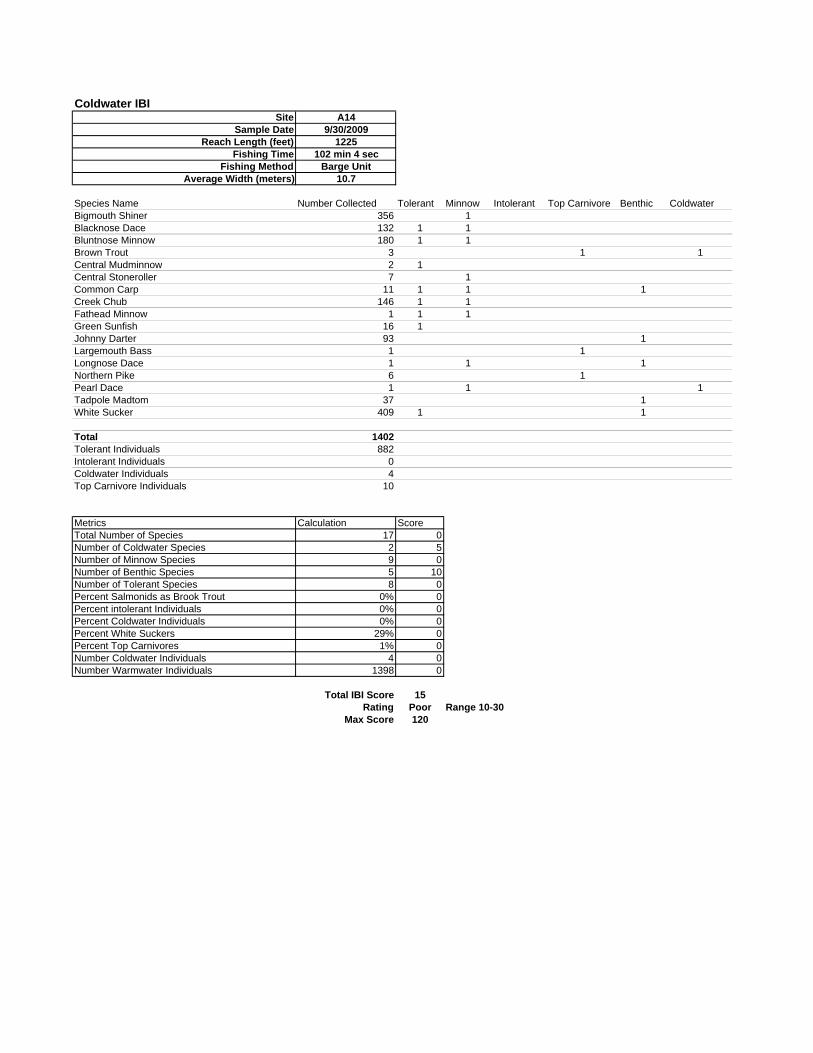
Coldwater IBI Site A14
Sample Date 9/30/2009Reach Length (feet) 1225
Fishing Time 102 min 4 secFishing Method Barge Unit
Average Width (meters) 10.7
Species Name Number Collected Tolerant Minnow Intolerant Top Carnivore Benthic ColdwaterBigmouth Shiner 356 1Blacknose Dace 132 1 1Bluntnose Minnow 180 1 1Brown Trout 3 1 1Central Mudminnow 2 1Central Stoneroller 7 1Common Carp 11 1 1 1Creek Chub 146 1 1Fathead Minnow 1 1 1Green Sunfish 16 1Johnny Darter 93 1Largemouth Bass 1 1Longnose Dace 1 1 1Northern Pike 6 1Pearl Dace 1 1 1Tadpole Madtom 37 1White Sucker 409 1 1
Total 1402Tolerant Individuals 882Intolerant Individuals 0Coldwater Individuals 4Top Carnivore Individuals 10
Metrics Calculation ScoreTotal Number of Species 17 0Number of Coldwater Species 2 5Number of Minnow Species 9 0Number of Benthic Species 5 10Number of Tolerant Species 8 0Percent Salmonids as Brook Trout 0% 0Percent intolerant Individuals 0% 0Percent Coldwater Individuals 0% 0Percent White Suckers 29% 0Percent Top Carnivores 1% 0Number Coldwater Individuals 4 0Number Warmwater Individuals 1398 0
Total IBI Score 15Rating Poor Range 10-30
Max Score 120