vancouver and abbotsford · 2007. 7. 31. · anmore port moody port coquitlam white rock langley...
TRANSCRIPT

C a n a d a M o r t g a g e a n d H o u s i n g C o r p o r a t i o nDate Released: May 2007
H o u s i n g M a r k e t I n f o r m a t i o n
Housing NOW
Vancouver and Abbotsford
New home construction activity inthe Vancouver CMA continued totrend down in April, but remains athistorically high levels. Housing startswere down 22 per cent in the firstfour months of 2007 to 5,757 units.Single detached starts declined by 40per cent to 1,214 units, while multipleunit starts dipped 15 per cent to4,543 units.
Overall, year to date housing startsare at levels similar to the past fouryears. The first half of 2006experienced an expectionally highlevel of construction activity, whichmagnified the decrease in starts for2007.
There were 357 single detachedhomes started in the Vancouver CMAfor April, the fourth consecutivemonthly increase.
Table of contents
1 Vancouver Home Building Contin-ues to Edge Down
2 Abbotsford Housing Starts Jump
3 Maps - Vancouver CMA
9 Maps - Abbotsford CMA
15 Housing Tables - Vancouver CMA
43 Housing Tables - Abbotsford CMA
Figure 1
Vancouver CMA Starts Still HighJanuary - April
0
1000
2000
3000
4000
5000
6000
7000
8000
2001 2002 2003 2004 2005 2006 2007
Units
MultiSingle
Vancouver Home BuildingContinues to Edge Down
subscribe NOW!Access CMHC’s Market Analysis Centre publicationsquickly and conveniently on the Order Desk atwww.cmhc.ca/housingmarketinformation.View, print, download or subscribe to get marketinformation e-mailed to you on the day it isreleased. New ! CMHC’s electronic suite ofnational standardized products is now availablefor free.
Unfavourable weather conditionsduring the winter months delayedmany projects for builders, especiallyin areas closer to the Fraser Valley.The City of Surrey, which accountedfor almost half of the single detachedhousing starts in the CMA in 2006, isexperiencing a decline in single familystarts, which are now at levels similarto 2002. Notable declines arecurrently taking place in theneighbourhoods of Cloverdale andNorth Surrey.
There were 21,924 homes underconstruction in the Vancouver CMA.The number of units underconstruction was at high levels aslabour shortages continue to moveforward completion dates for manyprojects. With the year to date dropin single detached starts, the numberof single family homes underconstruction decreased for the sixthconsecutive month. With the highnumber of units under construction,completions continue to be over athousand homes a month.
The number of homes that werecompleted and unabsorbed in theCMA was 1,167, nearly 50 per cent
Housing Starts inAbbotsfordContinue to RiseAbbotsford home starts continued tooutpace new construction activityfrom the year before. Total housingstarts in April, at a 100 units, weremore than double the 42 homesstarted in the same month last year.Year to date housing starts in theAbbotsford Census MetropolitanArea (CMA) were at 464 units, or a25 per cent increase in comparisonto home construction in the first fourmonths.
Year to date home starts inAbbotsford City, where most of theCMA’s home construction is takingplace, have jumped 42 per cent. Theopposite is being experienced inMission, where year to date homestarts show a drop of 34 per cent,from 86 to 57 homes started. Thelack of multiple family home starts hascontributed to a decline.
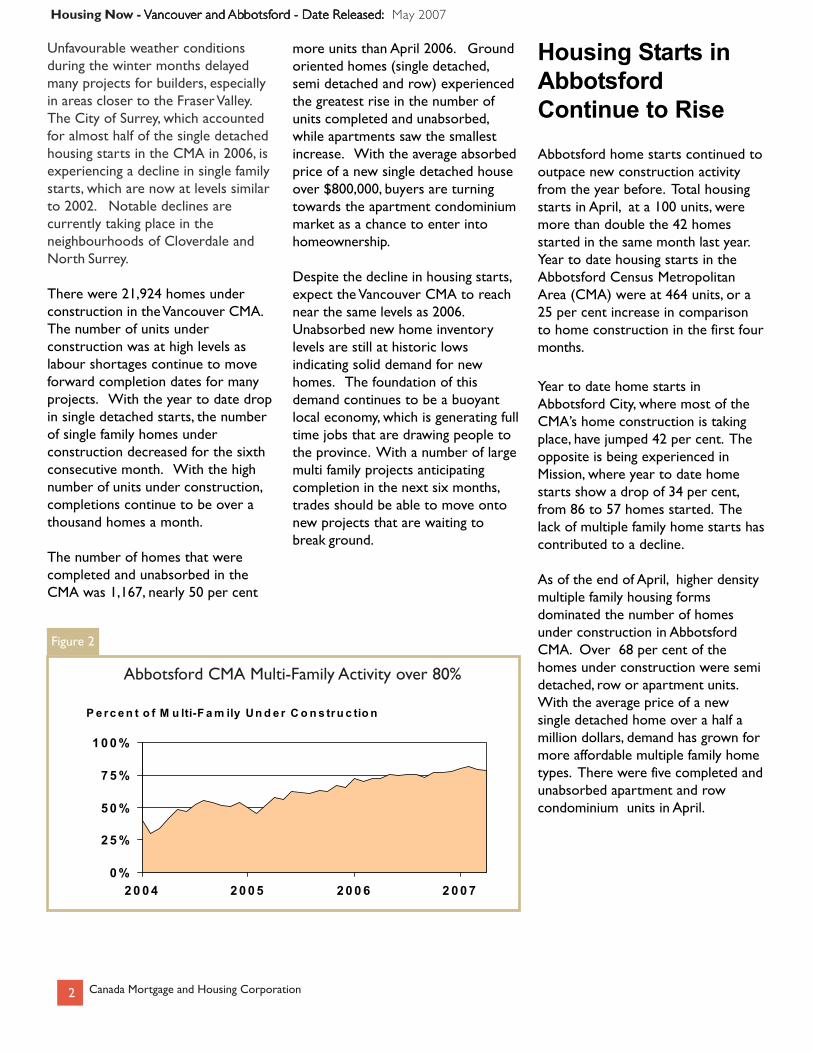
As of the end of April, higher densitymultiple family housing formsdominated the number of homesunder construction in AbbotsfordCMA. Over 68 per cent of thehomes under construction were semidetached, row or apartment units.With the average price of a newsingle detached home over a half amillion dollars, demand has grown formore affordable multiple family hometypes. There were five completed andunabsorbed apartment and rowcondominium units in April.
more units than April 2006. Groundoriented homes (single detached,semi detached and row) experiencedthe greatest rise in the number ofunits completed and unabsorbed,while apartments saw the smallestincrease. With the average absorbedprice of a new single detached houseover $800,000, buyers are turningtowards the apartment condominiummarket as a chance to enter intohomeownership.
Despite the decline in housing starts,expect the Vancouver CMA to reachnear the same levels as 2006.Unabsorbed new home inventorylevels are still at historic lowsindicating solid demand for newhomes. The foundation of thisdemand continues to be a buoyantlocal economy, which is generating fulltime jobs that are drawing people tothe province. With a number of largemulti family projects anticipatingcompletion in the next six months,trades should be able to move ontonew projects that are waiting tobreak ground.
Abbotsford CMA Multi-Family Activity over 80%
Figure 2
P e rc e n t o f M u lti-F a m ily Un d e r C o n s tru c tio n
0 %
2 5 %
5 0 %
7 5 %
1 0 0 %
2 0 0 4 2 0 0 5 2 0 0 6 2 0 0 7
Housing Now - VVVVVancouvancouvancouvancouvancouver and er and er and er and er and AbAbAbAbAbbotsfbotsfbotsfbotsfbotsford - Date Released:ord - Date Released:ord - Date Released:ord - Date Released:ord - Date Released: May 2007
Canada Mortgage and Housing Corporation2

Van
couve
r C
MA
Tota
l N
um
ber
of St
arts
Apri
l 2007
HIG
HW
AY 1
FRASE
R H
WY
HIG
HW
AY 99
264 ST
HIGHWAY 17
58 A
VE
176 ST
U.E
.L.
Surr
ey
Del
ta
Map
le
Rid
ge
Langl
ey
Dis
tric
t
Co
qui
tlam
Bur
naby
Van
couv
er
Ric
hm
ond
No
rth V
anco
uver
DM
Wes
t Van
couv
er
Pitt
Mea
do
ws
Bow
en
Isla
ndA
nm
ore
Port
M
oo
dy
Port
C
oqui
tlam
Whi
te
Rock
Langl
ey
Cit
y
New
W
estm
inst
er
No
rth
Van
couv
er
Cit
y
Bel
carr
a
Lio
n's
B
ay
04
812
2
Km
N
Lege
nd
No
sta
rts
2 -
89 s
tart
s
90 -
177 s
tart
s
178 -
265 s
tart
s
266 -
353 s
tart
s
No
t su
rvey
ed
Housing Now - Vancouver and Abbotsford - Date Released: May 2007
Canada Mortgage and Housing Corporation3

Vanc
ouve
r C
MA
Num
ber
of S
tart
s (S
ingl
es)
Apr
il 20
07
HIG
HW
AY 1
FRAS
ER H
WY
HIGHW
AY 99
264 ST
HIGHWAY 17
58 A
VE
176 ST
U.E
.L.
Surr
eyD
elta
Map
le
Rid
ge
Lang
ley
Dis
tric
t
Coq
uitla
m
Burn
aby
Vanc
ouve
r
Ric
hmon
d
Nor
th V
anco
uver
DM
Wes
t Va
ncou
ver
Pitt
M
eado
ws
Bow
en
Isla
ndA
nmor
e
Port
M
oody
Port
C
oqui
tlam
Whi
te
Roc
k
Lang
ley
City
New
W
estm
inst
er
Nor
th
Vanc
ouve
r C
ity
Belc
arra
Lion
's Ba
y
04
812
2
Km
N
Lege
ndN
o st
arts
1 -
34 s
tart
s
35 -
67
star
ts
68 -
100
sta
rts
101
- 13
3 st
arts
Not
sur
veye
d
Housing Now - Vancouver and Abbotsford - Date Released: May 2007
Canada Mortgage and Housing Corporation4

Van
couve
r C
MA
Num
ber
of St
arts
(M
ultip
les)
Apri
l 2007
HIG
HW
AY 1
FRASE
R H
WY
HIG
HW
AY 99
264 ST
HIGHWAY 1758
AVE
176 ST
U.E
.L.
Surr
ey
Del
ta
Map
le
Rid
ge
Langl
ey
Dis
tric
t
Co
qui
tlam
Bur
naby
Van
couv
er
Ric
hm
ond
No
rth V
anco
uver
DM
Wes
t Van
couv
er
Pitt
Mea
do
ws
Bow
en
Isla
ndA
nm
ore
Port
M
oo
dy
Port
C
oqui
tlam
Whi
te
Rock
Langl
ey
Cit
y
New
W
estm
inst
er
No
rth
Van
couv
er
Cit
y
Bel
carr
a
Lio
n's
B
ay
04
812
2
Km
N
Lege
nd
No
sta
rts
6 -
80 s
tart
s
81 -
155 s
tart
s
156 -
229 s
tart
s
230 -
304 s
tart
s
No
t su
rvey
ed
Housing Now - Vancouver and Abbotsford - Date Released: May 2007
Canada Mortgage and Housing Corporation5
Van
couve
r C
MA
Tota
l N
um
ber
of St
arts
Januar
y - A
pri
l 2007
HIG
HW
AY 1
FRASE
R H
WY
HIG
HW
AY 99
264 ST
HIGHWAY 17
58 A
VE
176 ST
U.E
.L.
Surr
ey
Del
ta
Map
le
Rid
ge
Langl
ey
Dis
tric
t
Co
qui
tlam
Bur
naby
Van
couv
er
Ric
hm
ond
No
rth V
anco
uver
DM
Wes
t Van
couv
er
Pitt
Mea
do
ws
Bow
en
Isla
ndA
nm
ore
Port
M
oo
dy
Port
C
oqui
tlam
Whi
te
Rock
Langl
ey
Cit
y
New
W
estm
inst
er
No
rth
Van
couv
er
Cit
y
Bel
carr
a
Lio
n's
B
ay
04
812
2
Km
N
Lege
nd
No
sta
rts
1 -
339 s
tart
s
340 -
678 s
tart
s
679 -
1,0
16 s
tart
s
1,0
17 -
1,3
55 s
tart
s
No
t su
rvey
ed
Housing Now - Vancouver and Abbotsford - Date Released: May 2007
Canada Mortgage and Housing Corporation6

Van
couve
r C
MA
Num
ber
of St
arts
(Si
ngl
es)
Januar
y - A
pri
l 2007
HIG
HW
AY 1
FRASE
R H
WY
HIG
HW
AY 99
264 ST
HIGHWAY 1758
AVE
176 ST
U.E
.L.
Surr
ey
Del
ta
Map
le
Rid
ge
Langl
ey
Dis
tric
t
Co
qui
tlam
Bur
naby
Van
couv
er
Ric
hm
ond
No
rth V
anco
uver
DM
Wes
t Van
couv
er
Pitt
Mea
do
ws
Bow
en
Isla
ndA
nm
ore
Port
M
oo
dy
Port
C
oqui
tlam
Whi
te
Rock
Langl
ey
Cit
y
New
W
estm
inst
er
No
rth
Van
couv
er
Cit
y
Bel
carr
a
Lio
n's
B
ay
04
812
2
Km
N
Lege
nd
No
sta
rts
1 -
120 s
tart
s
121 -
239 s
tart
s
240 -
358 s
tart
s
359 -
477 s
tart
s
No
t su
rvey
ed
Housing Now - Vancouver and Abbotsford - Date Released: May 2007
Canada Mortgage and Housing Corporation7
Van
couve
r C
MA
Num
ber
of St
arts
(M
ultip
les)
Januar
y - A
pri
l 2007
HIG
HW
AY 1
FRASE
R H
WY
HIG
HW
AY 99
264 ST
HIGHWAY 17
58 A
VE
176 ST
U.E
.L.
Surr
ey
Del
ta
Map
le
Rid
ge
Langl
ey
Dis
tric
t
Co
qui
tlam
Bur
naby
Van
couv
er
Ric
hm
ond
No
rth V
anco
uver
DM
Wes
t Van
couv
er
Pitt
Mea
do
ws
Bow
en
Isla
ndA
nm
ore
Port
M
oo
dy
Port
C
oqui
tlam
Whi
te
Rock
Langl
ey
Cit
y
New
W
estm
inst
er
No
rth
Van
couv
er
Cit
y
Bel
carr
a
Lio
n's
B
ay
04
812
2
Km
N
Lege
nd
No
sta
rts
2 -
221 s
tart
s
222 -
440 s
tart
s
441 -
659 s
tart
s
660 -
878 s
tart
s
No
t su
rvey
ed
Housing Now - Vancouver and Abbotsford - Date Released: May 2007
Canada Mortgage and Housing Corporation8

Abbotsford CMANumber of Starts (Singles)
April 2007
LOUGHEED
HWY
LOUGHEED HWY
ABBO
TSFO
RD
MI SSIO
N H
WY
HIGHWAY 1
Fraser Valley H RDA
Mission DM
Abbotsford City
N
0 2.5 5 7.51.25
Km
Legend
No starts
12 - 22 starts
23 - 33 starts
Not surveyed
Housing Now - Vancouver and Abbotsford - Date Released: May 2007
Canada Mortgage and Housing Corporation9

Abbotsford CMANumber of Starts (Multiples)
April 2007
LOUGHEED
HWY
LOUGHEED HWY
ABBO
TSFO
RD
MI SSIO
N H
WY
HIGHWAY 1
Fraser Valley H RDA
Mission DM
Abbotsford City
N
0 2.5 5 7.51.25
Km
Legend
No starts
55 starts
Not surveyed
Housing Now - Vancouver and Abbotsford - Date Released: May 2007
Canada Mortgage and Housing Corporation10

Abbotsford CMATotal Number of Starts
January - April 2007
LOUGHEED
HWY
LOUGHEED HWY
ABBO
TSFO
RD
MI SSIO
N H
WY
HIGHWAY 1
Fraser Valley H RDA
Mission DM
Abbotsford City
N
0 2.5 5 7.51.25
Km
Legend
1 - 150 starts
151 - 299 starts
300 - 448 starts
Not surveyed
Housing Now - Vancouver and Abbotsford - Date Released: May 2007
Canada Mortgage and Housing Corporation11

Abbotsford CMANumber of Starts (Singles)
January - April 2007
LOUGHEED
HWY
LOUGHEED HWY
ABBO
TSFO
RD
MI SSIO
N H
WY
HIGHWAY 1
Fraser Valley H RDA
Mission DM
Abbotsford City
N
0 2.5 5 7.51.25
Km
Legend
1 - 30 starts
31 - 59 starts
60 - 89 starts
Not surveyed
Housing Now - Vancouver and Abbotsford - Date Released: May 2007
Canada Mortgage and Housing Corporation12
Abbotsford CMANumber of Starts (Multiples)
January - April 2007
LOUGHEED
HWY
LOUGHEED HWY
ABBO
TSFO
RD
MI SSIO
N H
WY
HIGHWAY 1
Fraser Valley H RDA
Mission DM
Abbotsford City
N
0 2.5 5 7.51.25
Km
Legend
No starts
359 starts
Not surveyed
Housing Now - Vancouver and Abbotsford - Date Released: May 2007
Canada Mortgage and Housing Corporation13
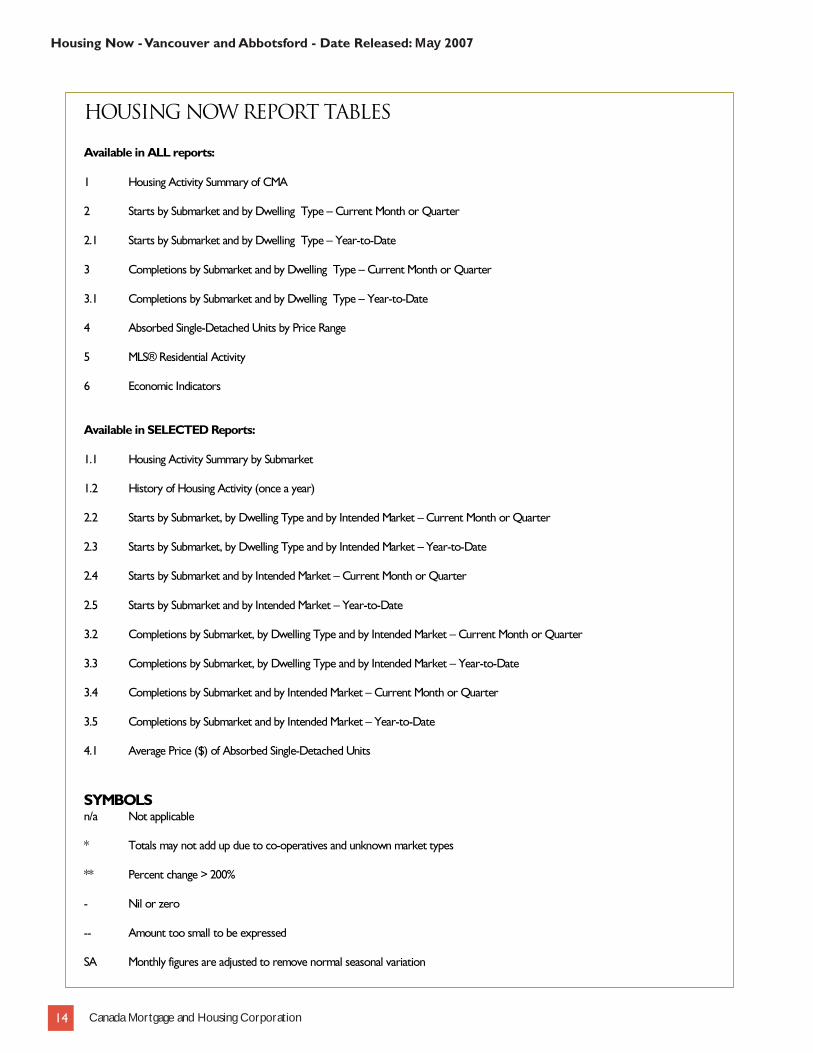
HOUSING NOW REPORT TABLES Available in ALL reports: 1 Housing Activity Summary of CMA 2 Starts by Submarket and by Dwelling Type – Current Month or Quarter 2.1 Starts by Submarket and by Dwelling Type – Year-to-Date 3 Completions by Submarket and by Dwelling Type – Current Month or Quarter 3.1 Completions by Submarket and by Dwelling Type – Year-to-Date 4 Absorbed Single-Detached Units by Price Range 5 MLS® Residential Activity 6 Economic Indicators Available in SELECTED Reports: 1.1 Housing Activity Summary by Submarket 1.2 History of Housing Activity (once a year) 2.2 Starts by Submarket, by Dwelling Type and by Intended Market – Current Month or Quarter 2.3 Starts by Submarket, by Dwelling Type and by Intended Market – Year-to-Date 2.4 Starts by Submarket and by Intended Market – Current Month or Quarter 2.5 Starts by Submarket and by Intended Market – Year-to-Date 3.2 Completions by Submarket, by Dwelling Type and by Intended Market – Current Month or Quarter 3.3 Completions by Submarket, by Dwelling Type and by Intended Market – Year-to-Date 3.4 Completions by Submarket and by Intended Market – Current Month or Quarter 3.5 Completions by Submarket and by Intended Market – Year-to-Date 4.1 Average Price ($) of Absorbed Single-Detached Units SYMBOLS n/a Not applicable * Totals may not add up due to co-operatives and unknown market types ** Percent change > 200% - Nil or zero -- Amount too small to be expressed SA Monthly figures are adjusted to remove normal seasonal variation
Housing Now - Vancouver and Abbotsford - Date Released: May 2007
Canada Mortgage and Housing Corporation14
1
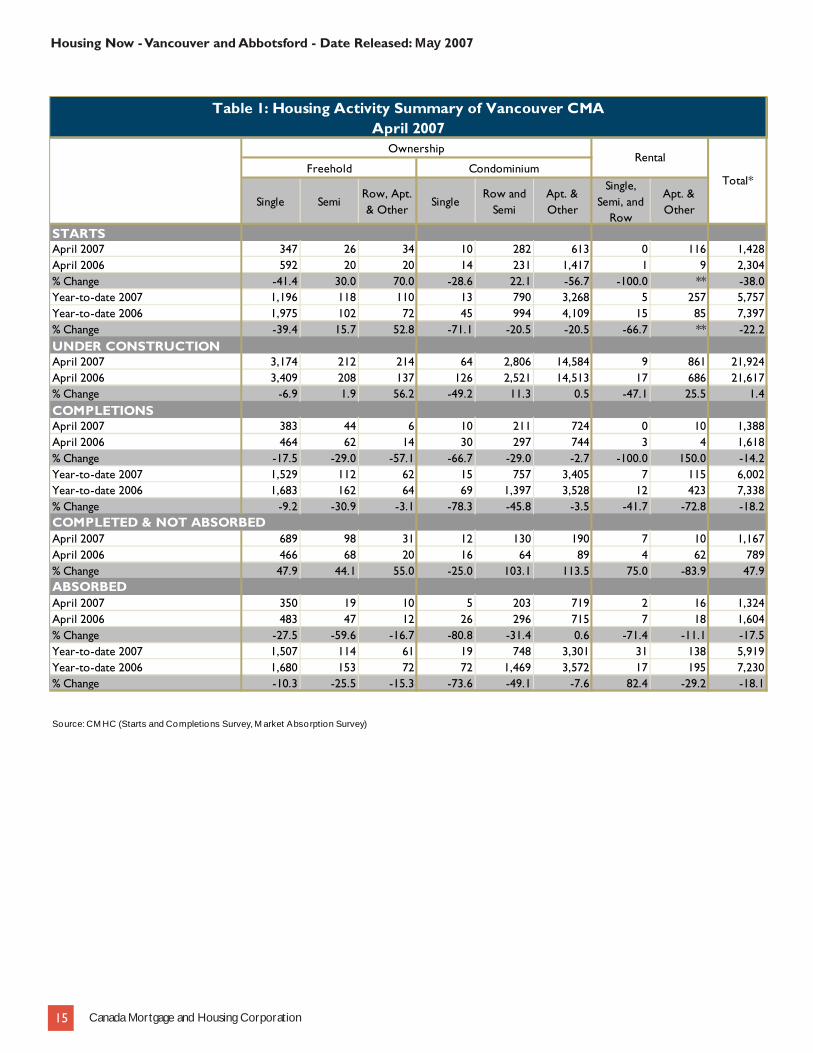
Table 1: Housing Activity Summary of Vancouver CMAApril 2007
Ownership
Freehold Condominium
Single SemiRow, Apt. & Other
SingleRow and
SemiApt. & Other
Single, Semi, and
Row
Apt. & Other
STARTSApril 2007 347 26 34 10 282 613 0 116 1,428April 2006 592 20 20 14 231 1,417 1 9 2,304% Change -41.4 30.0 70.0 -28.6 22.1 -56.7 -100.0 ** -38.0Year-to-date 2007 1,196 118 110 13 790 3,268 5 257 5,757Year-to-date 2006 1,975 102 72 45 994 4,109 15 85 7,397% Change -39.4 15.7 52.8 -71.1 -20.5 -20.5 -66.7 ** -22.2UNDER CONSTRUCTIONApril 2007 3,174 212 214 64 2,806 14,584 9 861 21,924April 2006 3,409 208 137 126 2,521 14,513 17 686 21,617% Change -6.9 1.9 56.2 -49.2 11.3 0.5 -47.1 25.5 1.4COMPLETIONSApril 2007 383 44 6 10 211 724 0 10 1,388April 2006 464 62 14 30 297 744 3 4 1,618% Change -17.5 -29.0 -57.1 -66.7 -29.0 -2.7 -100.0 150.0 -14.2Year-to-date 2007 1,529 112 62 15 757 3,405 7 115 6,002Year-to-date 2006 1,683 162 64 69 1,397 3,528 12 423 7,338% Change -9.2 -30.9 -3.1 -78.3 -45.8 -3.5 -41.7 -72.8 -18.2COMPLETED & NOT ABSORBEDApril 2007 689 98 31 12 130 190 7 10 1,167April 2006 466 68 20 16 64 89 4 62 789% Change 47.9 44.1 55.0 -25.0 103.1 113.5 75.0 -83.9 47.9ABSORBEDApril 2007 350 19 10 5 203 719 2 16 1,324April 2006 483 47 12 26 296 715 7 18 1,604% Change -27.5 -59.6 -16.7 -80.8 -31.4 0.6 -71.4 -11.1 -17.5Year-to-date 2007 1,507 114 61 19 748 3,301 31 138 5,919Year-to-date 2006 1,680 153 72 72 1,469 3,572 17 195 7,230% Change -10.3 -25.5 -15.3 -73.6 -49.1 -7.6 82.4 -29.2 -18.1
Source: CM HC (Starts and Completions Survey, M arket Absorption Survey)
Rental
Total*
Housing Now - Vancouver and Abbotsford - Date Released: May 2007
Canada Mortgage and Housing Corporation15

Table 1.1: Housing Activity Summary by SubmarketApril 2007
Ownership
Freehold Condominium
Single SemiRow, Apt. & Other
SingleRow and
SemiApt. & Other
Single, Semi, and
Row
Apt. & Other
STARTSBurnabyApril 2007 15 6 0 0 14 153 0 0 188April 2006 25 8 0 0 15 0 0 0 48DeltaApril 2007 18 0 0 0 0 0 0 0 18April 2006 21 0 0 0 11 0 1 0 33LangleyApril 2007 45 2 6 0 36 0 0 0 89April 2006 74 0 0 0 0 0 0 0 74Maple Ridge / Pitt MeadowsApril 2007 24 0 0 0 0 0 0 0 24April 2006 38 0 0 7 0 0 0 0 45New WestminsterApril 2007 4 0 0 0 0 0 0 0 4April 2006 6 0 0 0 0 123 0 0 129North VancouverApril 2007 10 2 0 0 0 81 0 0 93April 2006 15 0 4 0 0 156 0 0 175RichmondApril 2007 23 0 0 4 40 259 0 5 331April 2006 28 0 0 0 73 180 0 3 284SurreyApril 2007 133 8 0 0 129 79 0 4 353April 2006 260 0 2 0 106 413 0 6 787Tri-CitiesApril 2007 9 2 16 6 27 0 0 0 60April 2006 12 0 4 7 14 158 0 0 195University Endowment LandsApril 2007 0 0 0 0 0 0 0 107 107April 2006 0 0 0 0 0 55 0 0 55Vancouver CityApril 2007 48 6 2 0 0 41 0 0 97April 2006 98 12 4 0 12 327 0 0 453West VancouverApril 2007 12 0 0 0 36 0 0 0 48April 2006 8 0 0 0 0 0 0 0 8White RockApril 2007 0 0 10 0 0 0 0 0 10April 2006 1 0 6 0 0 5 0 0 12Vancouver CMAApril 2007 347 26 34 10 282 613 0 116 1,428April 2006 592 20 20 14 231 1,417 1 9 2,304
Source: CM HC (Starts and Completions Survey, M arket Absorption Survey)
Rental
Total*
Housing Now - Vancouver and Abbotsford - Date Released: May 2007
Canada Mortgage and Housing Corporation16

Table 1.1: Housing Activity Summary by SubmarketApril 2007
Ownership
Freehold Condominium
Single SemiRow, Apt. & Other
SingleRow and
SemiApt. & Other
Single, Semi, and
Row
Apt. & Other
UNDER CONSTRUCTIONBurnabyApril 2007 89 50 0 0 279 1,878 0 146 2,442April 2006 92 50 0 0 477 2,084 0 146 2,849DeltaApril 2007 62 2 0 0 21 48 0 1 134April 2006 95 0 0 0 23 93 2 0 213LangleyApril 2007 562 6 6 2 285 131 0 6 998April 2006 456 0 0 0 116 327 0 0 899Maple Ridge / Pitt MeadowsApril 2007 253 2 0 0 144 851 0 0 1,250April 2006 271 0 0 12 56 330 0 0 669New WestminsterApril 2007 40 4 0 14 54 1,362 0 0 1,474April 2006 36 0 0 0 14 865 0 0 915North VancouverApril 2007 94 10 4 1 96 794 0 27 1,026April 2006 100 24 20 0 75 466 5 0 690RichmondApril 2007 176 10 0 7 483 1,826 0 7 2,509April 2006 208 6 0 5 326 1,117 1 8 1,671SurreyApril 2007 1,160 12 4 14 1,008 1,020 0 247 3,465April 2006 1,349 0 2 58 741 1,038 0 78 3,266Tri-CitiesApril 2007 81 32 106 25 158 1,749 0 54 2,205April 2006 94 32 76 47 116 1,383 0 44 1,792University Endowment LandsApril 2007 5 0 0 0 28 364 9 107 513April 2006 3 0 0 0 103 504 9 71 690Vancouver CityApril 2007 397 78 30 0 174 4,466 0 250 5,395April 2006 427 90 19 0 408 6,122 0 255 7,321West VancouverApril 2007 162 6 0 1 76 88 0 16 349April 2006 180 0 0 4 66 79 0 84 413White RockApril 2007 15 0 64 0 0 7 0 0 86April 2006 28 0 20 0 0 105 0 0 153Vancouver CMAApril 2007 3,174 212 214 64 2,806 14,584 9 861 21,924April 2006 3,409 208 137 126 2,521 14,513 17 686 21,617
Source: CM HC (Starts and Completions Survey, M arket Absorption Survey)
Rental
Total*
Housing Now - Vancouver and Abbotsford - Date Released: May 2007
Canada Mortgage and Housing Corporation17

Table 1.1: Housing Activity Summary by SubmarketApril 2007
Ownership
Freehold Condominium
Single SemiRow, Apt. & Other
SingleRow and
SemiApt. & Other
Single, Semi, and
Row
Apt. & Other
COMPLETIONSBurnabyApril 2007 9 20 0 0 30 175 0 0 234April 2006 45 42 0 0 76 58 0 0 221DeltaApril 2007 5 0 0 1 11 0 0 0 17April 2006 13 0 0 0 16 0 1 0 30LangleyApril 2007 38 4 0 5 14 43 0 0 104April 2006 16 2 0 0 0 42 2 0 62Maple Ridge / Pitt MeadowsApril 2007 62 0 0 0 0 0 0 0 62April 2006 32 0 0 0 12 0 0 0 44New WestminsterApril 2007 10 0 0 0 0 0 0 0 10April 2006 0 0 0 0 39 0 0 0 39North VancouverApril 2007 7 2 0 0 0 132 0 0 141April 2006 10 0 4 0 0 0 0 0 14RichmondApril 2007 28 4 0 0 7 0 0 0 39April 2006 29 0 0 2 39 352 0 4 426SurreyApril 2007 148 0 0 0 93 68 0 10 319April 2006 182 2 0 21 88 123 0 0 416Tri-CitiesApril 2007 3 0 0 4 0 58 0 0 65April 2006 14 0 6 7 19 71 0 0 117University Endowment LandsApril 2007 0 0 0 0 24 78 0 0 102April 2006 0 0 0 0 0 0 0 0 0Vancouver CityApril 2007 57 14 2 0 32 170 0 0 275April 2006 111 16 4 0 8 98 0 0 237West VancouverApril 2007 10 0 0 0 0 0 0 0 10April 2006 3 0 0 0 0 0 0 0 3White RockApril 2007 1 0 4 0 0 0 0 0 5April 2006 7 0 0 0 0 0 0 0 7Vancouver CMAApril 2007 383 44 6 10 211 724 0 10 1,388April 2006 464 62 14 30 297 744 3 4 1,618
Source: CM HC (Starts and Completions Survey, M arket Absorption Survey)
Rental
Total*
Housing Now - Vancouver and Abbotsford - Date Released: May 2007
Canada Mortgage and Housing Corporation18

Table 1.1: Housing Activity Summary by SubmarketApril 2007
Ownership
Freehold Condominium
Single SemiRow, Apt. & Other
SingleRow and
SemiApt. & Other
Single, Semi, and
Row
Apt. & Other
COMPLETED & NOT ABSORBEDBurnabyApril 2007 45 34 0 0 4 0 0 0 83April 2006 50 19 0 0 19 0 0 0 88DeltaApril 2007 21 0 0 1 1 15 0 1 39April 2006 6 0 0 0 0 0 0 0 6LangleyApril 2007 74 0 0 4 25 32 0 0 135April 2006 49 1 0 9 9 5 2 0 75Maple Ridge / Pitt MeadowsApril 2007 50 0 0 2 0 14 0 0 66April 2006 24 0 0 0 3 0 0 0 27New WestminsterApril 2007 24 2 0 0 0 0 0 0 26April 2006 1 0 0 0 0 11 0 0 12North VancouverApril 2007 6 2 8 0 0 0 0 0 16April 2006 2 2 0 0 0 0 0 0 4RichmondApril 2007 45 5 0 1 19 12 0 0 82April 2006 39 3 0 0 13 8 2 1 66SurreyApril 2007 269 0 6 4 63 71 2 9 424April 2006 124 0 0 5 13 57 0 61 260Tri-CitiesApril 2007 7 11 11 0 16 0 5 0 50April 2006 11 5 14 2 0 7 0 0 39University Endowment LandsApril 2007 1 0 0 0 0 8 0 0 9April 2006 0 0 0 0 0 0 0 0 0Vancouver CityApril 2007 130 44 0 0 2 0 0 0 176April 2006 141 38 6 0 7 1 0 0 193West VancouverApril 2007 9 0 0 0 0 2 0 0 11April 2006 10 0 0 0 0 0 0 0 10White RockApril 2007 4 0 6 0 0 36 0 0 46April 2006 7 0 0 0 0 0 0 0 7Vancouver CMAApril 2007 689 98 31 12 130 190 7 10 1,167April 2006 466 68 20 16 64 89 4 62 789
Source: CM HC (Starts and Completions Survey, M arket Absorption Survey)
Rental
Total*
Housing Now - Vancouver and Abbotsford - Date Released: May 2007
Canada Mortgage and Housing Corporation19

Table 1.1: Housing Activity Summary by SubmarketApril 2007
Ownership
Freehold Condominium
Single SemiRow, Apt. & Other
SingleRow and
SemiApt. & Other
Single, Semi, and
Row
Apt. & Other
ABSORBEDBurnabyApril 2007 6 10 0 0 26 175 0 0 217April 2006 54 31 0 0 71 58 0 0 214DeltaApril 2007 7 0 0 0 10 0 0 0 17April 2006 14 0 0 0 20 0 1 0 35LangleyApril 2007 46 4 0 1 10 29 0 0 90April 2006 24 1 0 0 0 44 2 0 71Maple Ridge / Pitt MeadowsApril 2007 56 0 0 0 0 0 0 0 56April 2006 35 0 0 0 10 0 0 0 45New WestminsterApril 2007 6 0 0 0 0 0 0 0 6April 2006 0 0 0 0 41 13 0 0 54North VancouverApril 2007 12 2 2 0 1 132 0 0 149April 2006 8 3 4 0 0 0 0 0 15RichmondApril 2007 23 0 0 0 10 0 0 0 33April 2006 38 0 0 2 38 354 4 3 439SurreyApril 2007 125 0 0 0 83 76 2 13 299April 2006 200 2 0 17 87 83 0 15 404Tri-CitiesApril 2007 4 0 0 4 1 58 0 3 70April 2006 16 2 2 7 19 65 0 0 111University Endowment LandsApril 2007 0 0 0 0 24 70 0 0 94April 2006 0 0 0 0 0 0 0 0 0Vancouver CityApril 2007 50 3 6 0 38 176 0 0 273April 2006 84 8 6 0 10 98 0 0 206West VancouverApril 2007 10 0 0 0 0 2 0 0 12April 2006 4 0 0 0 0 0 0 0 4White RockApril 2007 1 0 2 0 0 1 0 0 4April 2006 4 0 0 0 0 0 0 0 4Vancouver CMAApril 2007 350 19 10 5 203 719 2 16 1,324April 2006 483 47 12 26 296 715 7 18 1,604
Source: CM HC (Starts and Completions Survey, M arket Absorption Survey)
Rental
Total*
Housing Now - Vancouver and Abbotsford - Date Released: May 2007
Canada Mortgage and Housing Corporation20

Table 1.2: History of Housing Starts of Vancouver CMA1997 - 2006
Ownership
Freehold Condominium
Single SemiRow, Apt. & Other
SingleRow and
SemiApt. & Other
Single, Semi, and
Row
Apt. & Other
2006 5,511 354 231 86 3,155 8,845 21 488 18,705% Change 17.9 -11.1 33.5 -58.0 -12.1 -4.8 -68.2 -6.2 -1.12005 4,673 398 173 205 3,588 9,291 66 520 18,914% Change -11.8 -10.4 -41.6 -26.5 -6.2 8.8 -8.3 -22.8 -2.72004 5,297 444 296 279 3,826 8,542 72 674 19,430% Change 4.5 1.8 17.0 -0.4 47.2 41.3 -10.0 -22.0 24.32003 5,070 436 253 280 2,599 6,044 80 864 15,626% Change 4.7 -3.1 -8.3 135.3 31.7 44.5 45.5 -30.7 18.42002 4,843 450 276 119 1,974 4,182 55 1,247 13,197% Change 42.4 -1.3 39.4 9.2 79.9 51.9 -70.4 -50.8 21.52001 3,400 456 198 109 1,097 2,754 186 2,535 10,862% Change 10.2 27.4 25.3 ** -11.1 28.0 ** 125.3 32.42000 3,086 358 158 35 1,234 2,152 20 1,125 8,203% Change -13.0 28.8 79.5 ** 17.0 -20.3 n/a 13.9 -5.51999 3,546 278 88 7 1,055 2,700 0 988 8,677% Change 7.4 -4.8 -23.5 -87.3 -28.1 -56.1 -100.0 160.0 -26.91998 3,303 292 115 55 1,468 6,146 119 380 11,878% Change -28.0 11.5 27.8 -36.8 -28.7 -18.6 -45.2 -63.1 -25.51997 4,585 262 90 87 2,060 7,547 217 1,031 15,950
Source: CM HC (Starts and Completions Survey)
Rental
Total*
Housing Now - Vancouver and Abbotsford - Date Released: May 2007
Canada Mortgage and Housing Corporation21

Table 2: Starts by Submarket and by Dwelling TypeApril 2007
Single Semi Row Apt. & Other Total
April 2007
April 2006
April 2007
April 2006
April 2007
April 2006
April 2007
April 2006
April 2007
April 2006
% Change
Anmore 2 0 0 0 0 0 0 0 2 0 n/aBelcarra 0 0 0 0 0 0 0 0 0 0 n/aBowen Island 4 6 0 0 0 0 0 0 4 6 -33.3 Burnaby - Mountain 0 0 0 0 0 0 0 0 0 0 n/a Burnaby - North 1 8 0 0 0 0 0 0 1 8 -87.5 Burnaby - Lougheed Mall 0 0 0 0 0 0 0 0 0 0 n/a Burnaby - South & East 3 5 0 0 0 0 0 0 3 5 -40.0 Burnaby - Central Park 2 3 0 0 0 0 0 0 2 3 -33.3 Burnaby - Remainder 9 9 6 10 14 13 153 0 182 32 **Burnaby Total 15 25 6 10 14 13 153 0 188 48 **Coquitlam 12 9 2 0 11 0 10 2 35 11 ** Delta - Tsawwassen 1 11 0 0 0 0 0 0 1 11 -90.9 Delta - Ladner 12 10 0 6 0 5 0 0 12 21 -42.9 Delta - North 5 1 0 0 0 0 0 0 5 1 **Delta 18 22 0 6 0 5 0 0 18 33 -45.5Langley City 0 2 0 0 0 0 0 0 0 2 -100.0Langley District 45 72 6 0 32 0 6 0 89 72 23.6Lion's Bay 0 0 0 0 0 0 0 0 0 0 n/aMaple Ridge 20 39 0 0 0 0 0 0 20 39 -48.7New Westminster 4 6 0 0 0 0 0 123 4 129 -96.9North Vancouver City 1 9 2 0 0 0 81 156 84 165 -49.1North Vancouver DM 9 6 0 0 0 0 0 4 9 10 -10.0Pitt Meadows 4 6 0 0 0 0 0 0 4 6 -33.3Port Coquitlam 0 4 0 0 0 8 6 64 6 76 -92.1Port Moody 3 6 0 2 16 4 0 96 19 108 -82.4Richmond 27 28 20 4 20 69 264 183 331 284 16.5 Surrey - South 22 12 4 0 0 0 0 0 26 12 116.7 Surrey - Cloverdale 47 101 0 0 58 43 4 8 109 152 -28.3 Surrey - North 56 133 8 0 41 45 0 0 105 178 -41.0 Surrey - Guildford 1 2 0 4 0 14 79 0 80 20 ** Surrey - Whalley 7 12 0 0 26 0 0 413 33 425 -92.2Surrey Total 133 260 12 4 125 102 83 421 353 787 -55.1University Endowment Lands 0 0 0 0 0 0 107 55 107 55 94.5 Vancouver - West End 0 0 0 0 0 5 0 149 0 154 -100.0 Vancouver - Downtown 0 0 0 0 0 0 0 0 0 0 n/a Vancouver - Kitsilano 1 0 0 0 0 0 0 0 1 0 n/a Vancouver - False Creek 0 1 0 0 0 0 0 0 0 1 -100.0 Vancouver - Granville/Oak 0 1 0 0 0 0 0 92 0 93 -100.0 Vancouver - Kerrisdale 1 1 0 0 0 0 41 0 42 1 ** Vancouver - Marpole 3 4 0 0 0 0 0 0 3 4 -25.0 Vancouver - Eastside 31 83 6 10 0 7 2 90 39 190 -79.5 Vancouver - Mt. Pleasant 0 2 0 0 0 0 0 0 0 2 -100.0 Vancouver - Strath/Grand 0 0 0 2 0 0 0 0 0 2 -100.0 Vancouver - Westside 12 6 0 0 0 0 0 0 12 6 100.0Vancouver Total 48 98 6 12 0 12 43 331 97 453 -78.6West Vancouver 12 8 16 0 20 0 0 0 48 8 **White Rock 0 1 0 0 0 0 10 11 10 12 -16.7Vancouver CMA 357 607 70 38 238 213 763 1,446 1,428 2,304 -38.0
Source: CM HC (Starts and Completions Survey)
Submarket
Housing Now - Vancouver and Abbotsford - Date Released: May 2007
Canada Mortgage and Housing Corporation22

Table 2.1: Starts by Submarket and by Dwelling TypeJanuary - April 2007
Single Semi Row Apt. & Other Total
YTD 2007
YTD 2006
YTD 2007
YTD 2006
YTD 2007
YTD 2006
YTD 2007
YTD 2006
YTD 2007
YTD 2006
% Change
Anmore 6 8 0 0 0 0 0 0 6 8 -25.0Belcarra 0 0 0 0 0 0 0 0 0 0 n/aBowen Island 6 10 0 0 0 0 0 0 6 10 -40.0 Burnaby - Mountain 0 0 0 0 4 0 0 0 4 0 n/a Burnaby - North 19 21 2 4 0 6 169 0 190 31 ** Burnaby - Lougheed Mall 0 0 0 0 0 0 0 0 0 0 n/a Burnaby - South & East 11 8 6 4 0 55 0 0 17 67 -74.6 Burnaby - Central Park 5 5 2 8 0 41 0 214 7 268 -97.4 Burnaby - Remainder 21 30 22 28 37 56 310 0 390 114 **Burnaby Total 56 64 32 44 41 158 479 214 608 480 26.7Coquitlam 17 35 14 14 28 7 86 461 145 517 -72.0 Delta - Tsawwassen 3 19 0 0 0 0 0 48 3 67 -95.5 Delta - Ladner 14 40 0 8 0 5 0 0 14 53 -73.6 Delta - North 19 4 2 0 0 0 0 0 21 4 **Delta 36 63 2 8 0 5 0 48 38 124 -69.4Langley City 3 5 0 0 0 0 0 158 3 163 -98.2Langley District 189 225 14 0 122 18 8 0 333 243 37.0Lion's Bay 1 0 0 0 0 0 0 0 1 0 n/aMaple Ridge 86 128 0 0 0 0 62 0 148 128 15.6New Westminster 15 23 8 0 12 0 200 201 235 224 4.9North Vancouver City 3 13 10 8 17 14 344 158 374 193 93.8North Vancouver DM 31 20 2 4 4 22 0 46 37 92 -59.8Pitt Meadows 12 32 0 10 54 24 0 268 66 334 -80.2Port Coquitlam 5 14 2 2 0 41 245 92 252 149 69.1Port Moody 13 26 0 6 44 16 270 150 327 198 65.2Richmond 95 152 54 76 55 138 629 683 833 1,049 -20.6 Surrey - South 87 52 6 30 0 34 153 36 246 152 61.8 Surrey - Cloverdale 154 317 2 4 129 110 138 62 423 493 -14.2 Surrey - North 199 435 10 0 70 140 2 0 281 575 -51.1 Surrey - Guildford 4 5 0 4 0 14 79 36 83 59 40.7 Surrey - Whalley 33 38 0 0 70 5 219 463 322 506 -36.4Surrey Total 477 847 18 38 269 303 591 597 1,355 1,785 -24.1University Endowment Lands 1 0 0 6 0 46 107 94 108 146 -26.0 Vancouver - West End 0 0 0 0 1 5 20 149 21 154 -86.4 Vancouver - Downtown 0 0 0 0 0 10 63 525 63 535 -88.2 Vancouver - Kitsilano 1 5 2 6 0 0 0 78 3 89 -96.6 Vancouver - False Creek 0 1 2 0 0 0 0 0 2 1 100.0 Vancouver - Granville/Oak 1 2 0 0 12 0 153 92 166 94 76.6 Vancouver - Kerrisdale 6 4 0 0 0 9 90 22 96 35 174.3 Vancouver - Marpole 12 12 2 2 3 0 0 0 17 14 21.4 Vancouver - Eastside 78 246 26 22 5 32 175 192 284 492 -42.3 Vancouver - Mt. Pleasant 0 3 8 4 3 0 0 0 11 7 57.1 Vancouver - Strath/Grand 0 0 2 2 8 0 43 0 53 2 ** Vancouver - Westside 35 43 0 0 0 0 20 15 55 58 -5.2Vancouver Total 133 316 42 36 32 56 564 1,073 771 1,481 -47.9West Vancouver 26 40 18 0 20 0 0 0 64 40 60.0White Rock 3 10 0 0 0 0 44 23 47 33 42.4Vancouver CMA 1,214 2,031 216 252 698 848 3,629 4,266 5,757 7,397 -22.2
Source: CM HC (Starts and Completions Survey)
Submarket
Housing Now - Vancouver and Abbotsford - Date Released: May 2007
Canada Mortgage and Housing Corporation23

Table 2.2: Starts by Submarket, by Dwelling Type and by Intended MarketApril 2007
Row Apt. & Other
Freehold and Condominium
RentalFreehold and Condominium
Rental
April 2007 April 2006 April 2007 April 2006 April 2007 April 2006 April 2007 April 2006
Anmore 0 0 0 0 0 0 0 0Belcarra 0 0 0 0 0 0 0 0Bowen Island 0 0 0 0 0 0 0 0 Burnaby - Mountain 0 0 0 0 0 0 0 0 Burnaby - North 0 0 0 0 0 0 0 0 Burnaby - Lougheed Mall 0 0 0 0 0 0 0 0 Burnaby - South & East 0 0 0 0 0 0 0 0 Burnaby - Central Park 14 13 0 0 153 0 0 0 Burnaby - Remainder 14 13 0 0 153 0 0 0Burnaby Total 11 0 0 0 10 2 0 0Coquitlam 0 0 0 0 0 0 0 0 Delta - Tsawwassen 0 5 0 0 0 0 0 0 Delta - Ladner 0 0 0 0 0 0 0 0 Delta - North 0 5 0 0 0 0 0 0Delta 0 0 0 0 0 0 0 0Langley City 32 0 0 0 6 0 0 0Langley District 0 0 0 0 0 0 0 0Lion's Bay 0 0 0 0 0 0 0 0Maple Ridge 0 0 0 0 0 123 0 0New Westminster 0 0 0 0 81 156 0 0North Vancouver City 0 0 0 0 0 4 0 0North Vancouver DM 0 0 0 0 0 0 0 0Pitt Meadows 0 8 0 0 6 64 0 0Port Coquitlam 16 4 0 0 0 96 0 0Port Moody 20 69 0 0 259 180 5 3Richmond 0 0 0 0 0 0 0 0 Surrey - South 58 43 0 0 0 2 4 6 Surrey - Cloverdale 41 45 0 0 0 0 0 0 Surrey - North 0 14 0 0 79 0 0 0 Surrey - Guildford 26 0 0 0 0 413 0 0 Surrey - Whalley 125 102 0 0 79 415 4 6Surrey Total 0 0 0 0 0 55 107 0University Endowment Lands 0 5 0 0 0 149 0 0 Vancouver - West End 0 0 0 0 0 0 0 0 Vancouver - Downtown 0 0 0 0 0 0 0 0 Vancouver - Kitsilano 0 0 0 0 0 0 0 0 Vancouver - False Creek 0 0 0 0 0 92 0 0 Vancouver - Granville/Oak 0 0 0 0 41 0 0 0 Vancouver - Kerrisdale 0 0 0 0 0 0 0 0 Vancouver - Marpole 0 7 0 0 2 90 0 0 Vancouver - Eastside 0 0 0 0 0 0 0 0 Vancouver - Mt. Pleasant 0 0 0 0 0 0 0 0 Vancouver - Strath/Grand 0 0 0 0 0 0 0 0 Vancouver - Westside 0 12 0 0 43 331 0 0Vancouver Total 20 0 0 0 0 0 0 0West Vancouver 0 0 0 0 10 11 0 0White Rock 238 213 0 0 647 1,437 116 9Vancouver CMA 0 0 0 0 0 0 0 0
Source: CM HC (Starts and Completions Survey)
Submarket
Housing Now - Vancouver and Abbotsford - Date Released: May 2007
Canada Mortgage and Housing Corporation24

Table 2.3: Starts by Submarket, by Dwelling Type and by Intended MarketJanuary - April 2007
Row Apt. & Other
Freehold and Condominium
RentalFreehold and Condominium
Rental
YTD 2007 YTD 2006 YTD 2007 YTD 2006 YTD 2007 YTD 2006 YTD 2007 YTD 2006
Anmore 0 0 0 0 0 0 0 0Belcarra 0 0 0 0 0 0 0 0Bowen Island 4 0 0 0 0 0 0 0 Burnaby - Mountain 0 6 0 0 169 0 0 0 Burnaby - North 0 0 0 0 0 0 0 0 Burnaby - Lougheed Mall 0 55 0 0 0 0 0 0 Burnaby - South & East 0 41 0 0 0 214 0 0 Burnaby - Central Park 37 56 0 0 310 0 0 0 Burnaby - Remainder 41 158 0 0 479 214 0 0Burnaby Total 28 7 0 0 86 461 0 0Coquitlam 0 0 0 0 0 48 0 0 Delta - Tsawwassen 0 5 0 0 0 0 0 0 Delta - Ladner 0 0 0 0 0 0 0 0 Delta - North 0 5 0 0 0 48 0 0Delta 0 0 0 0 0 158 0 0Langley City 122 18 0 0 6 0 2 0Langley District 0 0 0 0 0 0 0 0Lion's Bay 0 0 0 0 62 0 0 0Maple Ridge 12 0 0 0 200 201 0 0New Westminster 17 14 0 0 344 158 0 0North Vancouver City 4 22 0 0 0 46 0 0North Vancouver DM 54 24 0 0 0 268 0 0Pitt Meadows 0 41 0 0 245 92 0 0Port Coquitlam 44 16 0 0 270 150 0 0Port Moody 55 138 0 0 623 680 6 3Richmond 0 34 0 0 38 36 115 0 Surrey - South 129 110 0 0 115 56 23 6 Surrey - Cloverdale 70 140 0 0 2 0 0 0 Surrey - North 0 14 0 0 79 36 0 0 Surrey - Guildford 70 5 0 0 219 463 0 0 Surrey - Whalley 269 303 0 0 453 591 138 6Surrey Total 0 46 0 0 0 94 107 0University Endowment Lands 1 5 0 0 20 149 0 0 Vancouver - West End 0 10 0 0 63 525 0 0 Vancouver - Downtown 0 0 0 0 0 78 0 0 Vancouver - Kitsilano 0 0 0 0 0 0 0 0 Vancouver - False Creek 12 0 0 0 153 92 0 0 Vancouver - Granville/Oak 0 9 0 0 90 22 0 0 Vancouver - Kerrisdale 3 0 0 0 0 0 0 0 Vancouver - Marpole 5 32 0 0 171 116 4 76 Vancouver - Eastside 3 0 0 0 0 0 0 0 Vancouver - Mt. Pleasant 8 0 0 0 43 0 0 0 Vancouver - Strath/Grand 0 0 0 0 20 15 0 0 Vancouver - Westside 32 56 0 0 560 997 4 76Vancouver Total 20 0 0 0 0 0 0 0West Vancouver 0 0 0 0 44 23 0 0White Rock 698 848 0 0 3,372 4,181 257 85Vancouver CMA 0 0 0 0 0 0 0 0
Source: CM HC (Starts and Completions Survey)
Submarket
Housing Now - Vancouver and Abbotsford - Date Released: May 2007
Canada Mortgage and Housing Corporation25
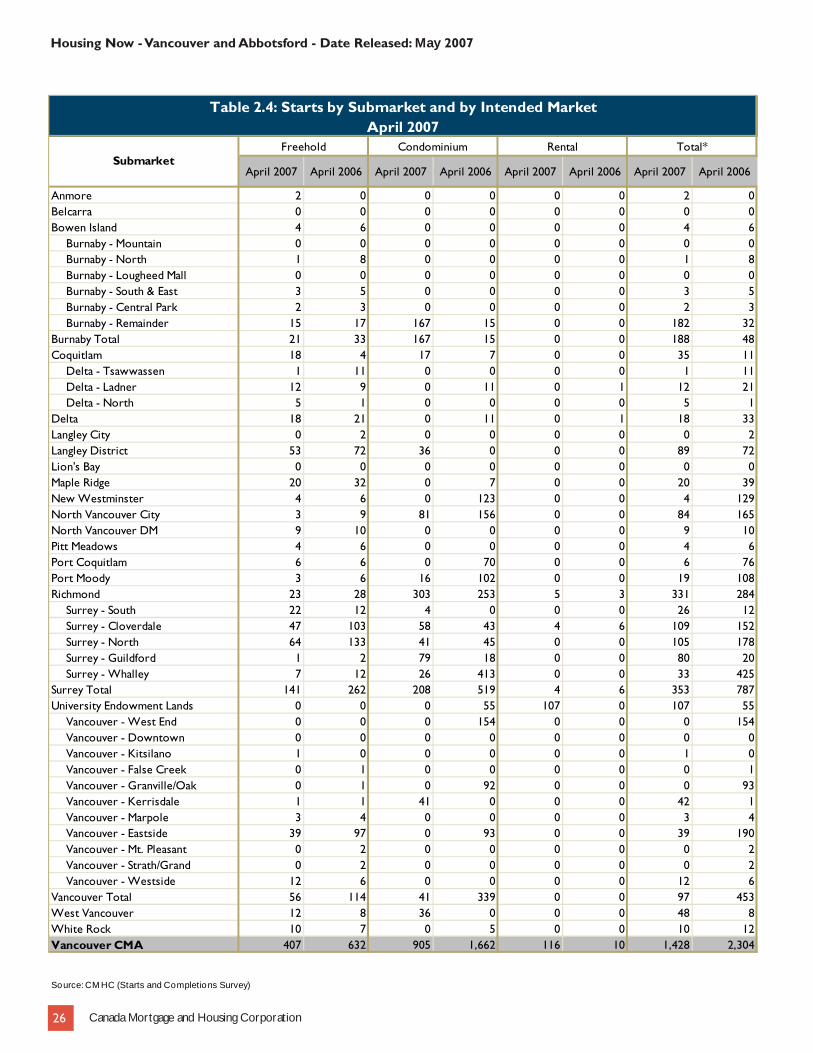
Table 2.4: Starts by Submarket and by Intended MarketApril 2007
Freehold Condominium Rental Total*
April 2007 April 2006 April 2007 April 2006 April 2007 April 2006 April 2007 April 2006
Anmore 2 0 0 0 0 0 2 0Belcarra 0 0 0 0 0 0 0 0Bowen Island 4 6 0 0 0 0 4 6 Burnaby - Mountain 0 0 0 0 0 0 0 0 Burnaby - North 1 8 0 0 0 0 1 8 Burnaby - Lougheed Mall 0 0 0 0 0 0 0 0 Burnaby - South & East 3 5 0 0 0 0 3 5 Burnaby - Central Park 2 3 0 0 0 0 2 3 Burnaby - Remainder 15 17 167 15 0 0 182 32Burnaby Total 21 33 167 15 0 0 188 48Coquitlam 18 4 17 7 0 0 35 11 Delta - Tsawwassen 1 11 0 0 0 0 1 11 Delta - Ladner 12 9 0 11 0 1 12 21 Delta - North 5 1 0 0 0 0 5 1Delta 18 21 0 11 0 1 18 33Langley City 0 2 0 0 0 0 0 2Langley District 53 72 36 0 0 0 89 72Lion's Bay 0 0 0 0 0 0 0 0Maple Ridge 20 32 0 7 0 0 20 39New Westminster 4 6 0 123 0 0 4 129North Vancouver City 3 9 81 156 0 0 84 165North Vancouver DM 9 10 0 0 0 0 9 10Pitt Meadows 4 6 0 0 0 0 4 6Port Coquitlam 6 6 0 70 0 0 6 76Port Moody 3 6 16 102 0 0 19 108Richmond 23 28 303 253 5 3 331 284 Surrey - South 22 12 4 0 0 0 26 12 Surrey - Cloverdale 47 103 58 43 4 6 109 152 Surrey - North 64 133 41 45 0 0 105 178 Surrey - Guildford 1 2 79 18 0 0 80 20 Surrey - Whalley 7 12 26 413 0 0 33 425Surrey Total 141 262 208 519 4 6 353 787University Endowment Lands 0 0 0 55 107 0 107 55 Vancouver - West End 0 0 0 154 0 0 0 154 Vancouver - Downtown 0 0 0 0 0 0 0 0 Vancouver - Kitsilano 1 0 0 0 0 0 1 0 Vancouver - False Creek 0 1 0 0 0 0 0 1 Vancouver - Granville/Oak 0 1 0 92 0 0 0 93 Vancouver - Kerrisdale 1 1 41 0 0 0 42 1 Vancouver - Marpole 3 4 0 0 0 0 3 4 Vancouver - Eastside 39 97 0 93 0 0 39 190 Vancouver - Mt. Pleasant 0 2 0 0 0 0 0 2 Vancouver - Strath/Grand 0 2 0 0 0 0 0 2 Vancouver - Westside 12 6 0 0 0 0 12 6Vancouver Total 56 114 41 339 0 0 97 453West Vancouver 12 8 36 0 0 0 48 8White Rock 10 7 0 5 0 0 10 12Vancouver CMA 407 632 905 1,662 116 10 1,428 2,304
Source: CM HC (Starts and Completions Survey)
Submarket
Housing Now - Vancouver and Abbotsford - Date Released: May 2007
Canada Mortgage and Housing Corporation26

Table 2.5: Starts by Submarket and by Intended MarketJanuary - April 2007
Freehold Condominium Rental Total*
YTD 2007 YTD 2006 YTD 2007 YTD 2006 YTD 2007 YTD 2006 YTD 2007 YTD 2006
Anmore 6 8 0 0 0 0 6 8Belcarra 0 0 0 0 0 0 0 0Bowen Island 6 10 0 0 0 0 6 10 Burnaby - Mountain 0 0 4 0 0 0 4 0 Burnaby - North 21 25 169 6 0 0 190 31 Burnaby - Lougheed Mall 0 0 0 0 0 0 0 0 Burnaby - South & East 17 12 0 55 0 0 17 67 Burnaby - Central Park 7 13 0 255 0 0 7 268 Burnaby - Remainder 43 52 347 62 0 0 390 114Burnaby Total 88 102 520 378 0 0 608 480Coquitlam 63 49 82 468 0 0 145 517 Delta - Tsawwassen 3 19 0 48 0 0 3 67 Delta - Ladner 14 38 0 13 0 2 14 53 Delta - North 21 4 0 0 0 0 21 4Delta 38 61 0 61 0 2 38 124Langley City 3 5 0 158 0 0 3 163Langley District 192 221 134 18 7 4 333 243Lion's Bay 1 0 0 0 0 0 1 0Maple Ridge 86 121 62 7 0 0 148 128New Westminster 23 23 212 201 0 0 235 224North Vancouver City 9 23 365 170 0 0 374 193North Vancouver DM 30 23 7 64 0 5 37 92Pitt Meadows 12 30 54 304 0 0 66 334Port Coquitlam 17 20 235 129 0 0 252 149Port Moody 13 26 314 172 0 0 327 198Richmond 93 148 734 894 6 7 833 1,049 Surrey - South 87 52 44 100 115 0 246 152 Surrey - Cloverdale 156 317 244 170 23 6 423 493 Surrey - North 209 427 72 148 0 0 281 575 Surrey - Guildford 4 5 79 54 0 0 83 59 Surrey - Whalley 33 38 289 468 0 0 322 506Surrey Total 489 839 728 940 138 6 1,355 1,785University Endowment Lands 1 0 0 146 107 0 108 146 Vancouver - West End 0 0 21 154 0 0 21 154 Vancouver - Downtown 0 0 63 535 0 0 63 535 Vancouver - Kitsilano 3 11 0 78 0 0 3 89 Vancouver - False Creek 2 1 0 0 0 0 2 1 Vancouver - Granville/Oak 1 2 165 92 0 0 166 94 Vancouver - Kerrisdale 6 4 90 31 0 0 96 35 Vancouver - Marpole 17 14 0 0 0 0 17 14 Vancouver - Eastside 104 288 176 128 4 76 284 492 Vancouver - Mt. Pleasant 11 7 0 0 0 0 11 7 Vancouver - Strath/Grand 2 2 51 0 0 0 53 2 Vancouver - Westside 35 43 20 15 0 0 55 58Vancouver Total 181 372 586 1,033 4 76 771 1,481West Vancouver 28 40 36 0 0 0 64 40White Rock 45 28 2 5 0 0 47 33Vancouver CMA 1,424 2,149 4,071 5,148 262 100 5,757 7,397
Source: CM HC (Starts and Completions Survey)
Submarket
Housing Now - Vancouver and Abbotsford - Date Released: May 2007
Canada Mortgage and Housing Corporation27
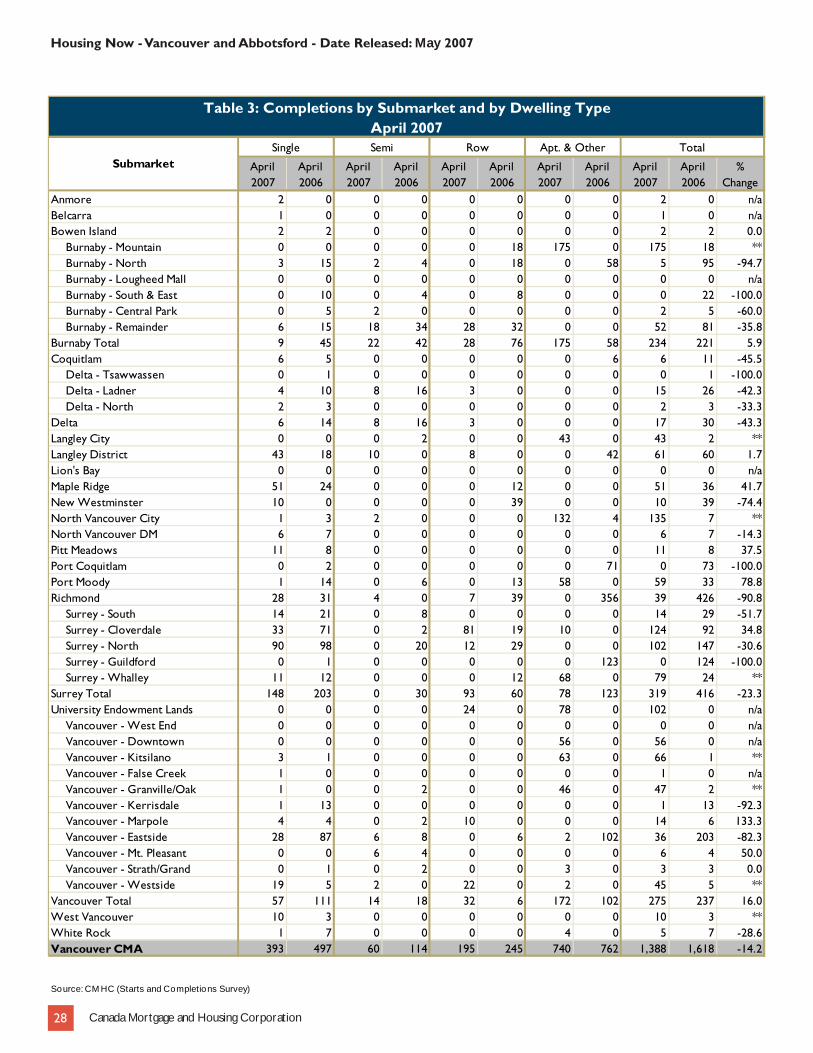
Table 3: Completions by Submarket and by Dwelling TypeApril 2007
Single Semi Row Apt. & Other Total
April 2007
April 2006
April 2007
April 2006
April 2007
April 2006
April 2007
April 2006
April 2007
April 2006
% Change
Anmore 2 0 0 0 0 0 0 0 2 0 n/aBelcarra 1 0 0 0 0 0 0 0 1 0 n/aBowen Island 2 2 0 0 0 0 0 0 2 2 0.0 Burnaby - Mountain 0 0 0 0 0 18 175 0 175 18 ** Burnaby - North 3 15 2 4 0 18 0 58 5 95 -94.7 Burnaby - Lougheed Mall 0 0 0 0 0 0 0 0 0 0 n/a Burnaby - South & East 0 10 0 4 0 8 0 0 0 22 -100.0 Burnaby - Central Park 0 5 2 0 0 0 0 0 2 5 -60.0 Burnaby - Remainder 6 15 18 34 28 32 0 0 52 81 -35.8Burnaby Total 9 45 22 42 28 76 175 58 234 221 5.9Coquitlam 6 5 0 0 0 0 0 6 6 11 -45.5 Delta - Tsawwassen 0 1 0 0 0 0 0 0 0 1 -100.0 Delta - Ladner 4 10 8 16 3 0 0 0 15 26 -42.3 Delta - North 2 3 0 0 0 0 0 0 2 3 -33.3Delta 6 14 8 16 3 0 0 0 17 30 -43.3Langley City 0 0 0 2 0 0 43 0 43 2 **Langley District 43 18 10 0 8 0 0 42 61 60 1.7Lion's Bay 0 0 0 0 0 0 0 0 0 0 n/aMaple Ridge 51 24 0 0 0 12 0 0 51 36 41.7New Westminster 10 0 0 0 0 39 0 0 10 39 -74.4North Vancouver City 1 3 2 0 0 0 132 4 135 7 **North Vancouver DM 6 7 0 0 0 0 0 0 6 7 -14.3Pitt Meadows 11 8 0 0 0 0 0 0 11 8 37.5Port Coquitlam 0 2 0 0 0 0 0 71 0 73 -100.0Port Moody 1 14 0 6 0 13 58 0 59 33 78.8Richmond 28 31 4 0 7 39 0 356 39 426 -90.8 Surrey - South 14 21 0 8 0 0 0 0 14 29 -51.7 Surrey - Cloverdale 33 71 0 2 81 19 10 0 124 92 34.8 Surrey - North 90 98 0 20 12 29 0 0 102 147 -30.6 Surrey - Guildford 0 1 0 0 0 0 0 123 0 124 -100.0 Surrey - Whalley 11 12 0 0 0 12 68 0 79 24 **Surrey Total 148 203 0 30 93 60 78 123 319 416 -23.3University Endowment Lands 0 0 0 0 24 0 78 0 102 0 n/a Vancouver - West End 0 0 0 0 0 0 0 0 0 0 n/a Vancouver - Downtown 0 0 0 0 0 0 56 0 56 0 n/a Vancouver - Kitsilano 3 1 0 0 0 0 63 0 66 1 ** Vancouver - False Creek 1 0 0 0 0 0 0 0 1 0 n/a Vancouver - Granville/Oak 1 0 0 2 0 0 46 0 47 2 ** Vancouver - Kerrisdale 1 13 0 0 0 0 0 0 1 13 -92.3 Vancouver - Marpole 4 4 0 2 10 0 0 0 14 6 133.3 Vancouver - Eastside 28 87 6 8 0 6 2 102 36 203 -82.3 Vancouver - Mt. Pleasant 0 0 6 4 0 0 0 0 6 4 50.0 Vancouver - Strath/Grand 0 1 0 2 0 0 3 0 3 3 0.0 Vancouver - Westside 19 5 2 0 22 0 2 0 45 5 **Vancouver Total 57 111 14 18 32 6 172 102 275 237 16.0West Vancouver 10 3 0 0 0 0 0 0 10 3 **White Rock 1 7 0 0 0 0 4 0 5 7 -28.6Vancouver CMA 393 497 60 114 195 245 740 762 1,388 1,618 -14.2
Source: CM HC (Starts and Completions Survey)
Submarket
Housing Now - Vancouver and Abbotsford - Date Released: May 2007
Canada Mortgage and Housing Corporation28

Table 3.1: Completions by Submarket and by Dwelling TypeJanuary - April 2007
Single Semi Row Apt. & Other Total
YTD 2007
YTD 2006
YTD 2007
YTD 2006
YTD 2007
YTD 2006
YTD 2007
YTD 2006
YTD 2007
YTD 2006
% Change
Anmore 10 8 0 0 0 0 0 0 10 8 25.0Belcarra 1 1 0 0 0 0 0 0 1 1 0.0Bowen Island 4 27 0 0 0 0 0 0 4 27 -85.2 Burnaby - Mountain 0 2 0 0 0 30 175 230 175 262 -33.2 Burnaby - North 23 44 2 8 0 18 0 241 25 311 -92.0 Burnaby - Lougheed Mall 0 3 0 0 0 0 0 0 0 3 -100.0 Burnaby - South & East 12 21 8 12 0 12 211 0 231 45 ** Burnaby - Central Park 1 9 10 6 0 12 0 0 11 27 -59.3 Burnaby - Remainder 39 47 44 46 97 101 215 594 395 788 -49.9Burnaby Total 75 126 64 72 97 173 601 1,065 837 1,436 -41.7Coquitlam 17 14 12 16 0 0 14 36 43 66 -34.8 Delta - Tsawwassen 8 4 0 0 0 0 0 0 8 4 100.0 Delta - Ladner 6 15 8 42 3 0 1 0 18 57 -68.4 Delta - North 9 14 0 0 0 0 0 0 9 14 -35.7Delta 23 33 8 42 3 0 1 0 35 75 -53.3Langley City 1 0 0 2 0 0 120 0 121 2 **Langley District 214 199 10 6 41 192 0 42 265 439 -39.6Lion's Bay 0 0 0 0 0 0 0 0 0 0 n/aMaple Ridge 140 109 0 0 0 29 62 0 202 138 46.4New Westminster 36 19 2 0 0 106 0 192 38 317 -88.0North Vancouver City 10 6 2 8 11 10 132 162 155 186 -16.7North Vancouver DM 29 18 0 42 0 41 0 86 29 187 -84.5Pitt Meadows 24 29 0 0 12 49 0 0 36 78 -53.8Port Coquitlam 4 15 4 0 12 26 8 73 28 114 -75.4Port Moody 28 33 4 16 17 38 195 56 244 143 70.6Richmond 117 143 30 26 47 93 234 577 428 839 -49.0 Surrey - South 52 67 12 10 0 15 63 204 127 296 -57.1 Surrey - Cloverdale 175 189 8 4 127 169 39 0 349 362 -3.6 Surrey - North 317 284 4 26 103 166 0 0 424 476 -10.9 Surrey - Guildford 0 4 4 0 20 44 129 123 153 171 -10.5 Surrey - Whalley 44 33 0 0 17 12 68 0 129 45 186.7Surrey Total 588 577 28 40 267 406 299 327 1,182 1,350 -12.4University Endowment Lands 1 0 0 0 61 0 202 0 264 0 n/a Vancouver - West End 0 0 0 0 0 0 0 0 0 0 n/a Vancouver - Downtown 0 0 0 0 41 9 1,318 1,043 1,359 1,052 29.2 Vancouver - Kitsilano 7 1 2 0 0 0 74 2 83 3 ** Vancouver - False Creek 1 0 0 0 0 0 39 0 40 0 n/a Vancouver - Granville/Oak 2 1 0 4 0 0 46 0 48 5 ** Vancouver - Kerrisdale 3 21 0 0 9 0 2 0 14 21 -33.3 Vancouver - Marpole 9 15 0 10 10 0 0 0 19 25 -24.0 Vancouver - Eastside 86 283 6 18 25 33 54 352 171 686 -75.1 Vancouver - Mt. Pleasant 1 1 14 12 6 0 0 0 21 13 61.5 Vancouver - Strath/Grand 1 7 0 10 0 0 5 0 6 17 -64.7 Vancouver - Westside 65 50 2 6 22 0 40 2 129 58 122.4Vancouver Total 175 379 24 60 113 42 1,578 1,399 1,890 1,880 0.5West Vancouver 49 13 0 24 0 0 14 0 63 37 70.3White Rock 5 15 0 0 0 0 122 0 127 15 **Vancouver CMA 1,551 1,764 188 354 681 1,205 3,582 4,015 6,002 7,338 -18.2
Source: CM HC (Starts and Completions Survey)
Submarket
Housing Now - Vancouver and Abbotsford - Date Released: May 2007
Canada Mortgage and Housing Corporation29

Table 3.2: Completions by Submarket, by Dwelling Type and by Intended MarketApril 2007
Row Apt. & Other
Freehold and Condominium
RentalFreehold and Condominium
Rental
April 2007 April 2006 April 2007 April 2006 April 2007 April 2006 April 2007 April 2006
Anmore 0 0 0 0 0 0 0 0Belcarra 0 0 0 0 0 0 0 0Bowen Island 0 18 0 0 175 0 0 0 Burnaby - Mountain 0 18 0 0 0 58 0 0 Burnaby - North 0 0 0 0 0 0 0 0 Burnaby - Lougheed Mall 0 8 0 0 0 0 0 0 Burnaby - South & East 0 0 0 0 0 0 0 0 Burnaby - Central Park 28 32 0 0 0 0 0 0 Burnaby - Remainder 28 76 0 0 175 58 0 0Burnaby Total 0 0 0 0 0 6 0 0Coquitlam 0 0 0 0 0 0 0 0 Delta - Tsawwassen 3 0 0 0 0 0 0 0 Delta - Ladner 0 0 0 0 0 0 0 0 Delta - North 3 0 0 0 0 0 0 0Delta 0 0 0 0 43 0 0 0Langley City 8 0 0 0 0 42 0 0Langley District 0 0 0 0 0 0 0 0Lion's Bay 0 12 0 0 0 0 0 0Maple Ridge 0 39 0 0 0 0 0 0New Westminster 0 0 0 0 132 4 0 0North Vancouver City 0 0 0 0 0 0 0 0North Vancouver DM 0 0 0 0 0 0 0 0Pitt Meadows 0 0 0 0 0 71 0 0Port Coquitlam 0 13 0 0 58 0 0 0Port Moody 7 39 0 0 0 352 0 4Richmond 0 0 0 0 0 0 0 0 Surrey - South 81 19 0 0 0 0 10 0 Surrey - Cloverdale 12 29 0 0 0 0 0 0 Surrey - North 0 0 0 0 0 123 0 0 Surrey - Guildford 0 12 0 0 68 0 0 0 Surrey - Whalley 93 60 0 0 68 123 10 0Surrey Total 24 0 0 0 78 0 0 0University Endowment Lands 0 0 0 0 0 0 0 0 Vancouver - West End 0 0 0 0 56 0 0 0 Vancouver - Downtown 0 0 0 0 63 0 0 0 Vancouver - Kitsilano 0 0 0 0 0 0 0 0 Vancouver - False Creek 0 0 0 0 46 0 0 0 Vancouver - Granville/Oak 0 0 0 0 0 0 0 0 Vancouver - Kerrisdale 10 0 0 0 0 0 0 0 Vancouver - Marpole 0 6 0 0 2 102 0 0 Vancouver - Eastside 0 0 0 0 0 0 0 0 Vancouver - Mt. Pleasant 0 0 0 0 3 0 0 0 Vancouver - Strath/Grand 22 0 0 0 2 0 0 0 Vancouver - Westside 32 6 0 0 172 102 0 0Vancouver Total 0 0 0 0 0 0 0 0West Vancouver 0 0 0 0 4 0 0 0White Rock 195 245 0 0 730 758 10 4Vancouver CMA 0 0 0 0 0 0 0 0
Source: CM HC (Starts and Completions Survey)
Submarket
Housing Now - Vancouver and Abbotsford - Date Released: May 2007
Canada Mortgage and Housing Corporation30

Table 3.3: Completions by Submarket, by Dwelling Type and by Intended MarketJanuary - April 2007
Row Apt. & Other
Freehold and Condominium
RentalFreehold and Condominium
Rental
YTD 2007 YTD 2006 YTD 2007 YTD 2006 YTD 2007 YTD 2006 YTD 2007 YTD 2006
Anmore 0 0 0 0 0 0 0 0Belcarra 0 0 0 0 0 0 0 0Bowen Island 0 30 0 0 175 230 0 0 Burnaby - Mountain 0 18 0 0 0 241 0 0 Burnaby - North 0 0 0 0 0 0 0 0 Burnaby - Lougheed Mall 0 12 0 0 211 0 0 0 Burnaby - South & East 0 12 0 0 0 0 0 0 Burnaby - Central Park 97 101 0 0 215 594 0 0 Burnaby - Remainder 97 173 0 0 601 1,065 0 0Burnaby Total 0 0 0 0 14 36 0 0Coquitlam 0 0 0 0 0 0 0 0 Delta - Tsawwassen 3 0 0 0 0 0 1 0 Delta - Ladner 0 0 0 0 0 0 0 0 Delta - North 3 0 0 0 0 0 1 0Delta 0 0 0 0 120 0 0 0Langley City 41 192 0 0 0 42 0 0Langley District 0 0 0 0 0 0 0 0Lion's Bay 0 29 0 0 62 0 0 0Maple Ridge 0 106 0 0 0 192 0 0New Westminster 11 10 0 0 132 162 0 0North Vancouver City 0 41 0 0 0 86 0 0North Vancouver DM 12 49 0 0 0 0 0 0Pitt Meadows 12 26 0 0 8 73 0 0Port Coquitlam 17 38 0 0 195 56 0 0Port Moody 47 93 0 0 233 573 1 4Richmond 0 15 0 0 63 43 0 161 Surrey - South 127 169 0 0 6 0 33 0 Surrey - Cloverdale 103 166 0 0 0 0 0 0 Surrey - North 20 44 0 0 129 123 0 0 Surrey - Guildford 17 12 0 0 68 0 0 0 Surrey - Whalley 267 406 0 0 266 166 33 161Surrey Total 61 0 0 0 131 0 71 0University Endowment Lands 0 0 0 0 0 0 0 0 Vancouver - West End 41 9 0 0 1,318 985 0 58 Vancouver - Downtown 0 0 0 0 73 2 1 0 Vancouver - Kitsilano 0 0 0 0 39 0 0 0 Vancouver - False Creek 0 0 0 0 46 0 0 0 Vancouver - Granville/Oak 9 0 0 0 2 0 0 0 Vancouver - Kerrisdale 10 0 0 0 0 0 0 0 Vancouver - Marpole 25 33 0 0 50 152 4 200 Vancouver - Eastside 6 0 0 0 0 0 0 0 Vancouver - Mt. Pleasant 0 0 0 0 5 0 0 0 Vancouver - Strath/Grand 22 0 0 0 36 2 4 0 Vancouver - Westside 113 42 0 0 1,569 1,141 9 258Vancouver Total 0 0 0 0 14 0 0 0West Vancouver 0 0 0 0 122 0 0 0White Rock 681 1,205 0 0 3,467 3,592 115 423Vancouver CMA 0 0 0 0 0 0 0 0
Source: CM HC (Starts and Completions Survey)
Submarket
Housing Now - Vancouver and Abbotsford - Date Released: May 2007
Canada Mortgage and Housing Corporation31

Table 3.4: Completions by Submarket and by Intended MarketApril 2007
Freehold Condominium Rental Total*
April 2007 April 2006 April 2007 April 2006 April 2007 April 2006 April 2007 April 2006
Anmore 2 0 0 0 0 0 2 0Belcarra 1 0 0 0 0 0 1 0Bowen Island 2 2 0 0 0 0 2 2 Burnaby - Mountain 0 0 175 18 0 0 175 18 Burnaby - North 5 19 0 76 0 0 5 95 Burnaby - Lougheed Mall 0 0 0 0 0 0 0 0 Burnaby - South & East 0 14 0 8 0 0 0 22 Burnaby - Central Park 2 5 0 0 0 0 2 5 Burnaby - Remainder 22 49 30 32 0 0 52 81Burnaby Total 29 87 205 134 0 0 234 221Coquitlam 2 10 4 1 0 0 6 11 Delta - Tsawwassen 0 1 0 0 0 0 0 1 Delta - Ladner 3 9 12 16 0 1 15 26 Delta - North 2 3 0 0 0 0 2 3Delta 5 13 12 16 0 1 17 30Langley City 0 2 43 0 0 0 43 2Langley District 42 16 19 42 0 2 61 60Lion's Bay 0 0 0 0 0 0 0 0Maple Ridge 51 24 0 12 0 0 51 36New Westminster 10 0 0 39 0 0 10 39North Vancouver City 3 7 132 0 0 0 135 7North Vancouver DM 6 7 0 0 0 0 6 7Pitt Meadows 11 8 0 0 0 0 11 8Port Coquitlam 0 2 0 71 0 0 0 73Port Moody 1 8 58 25 0 0 59 33Richmond 32 29 7 393 0 4 39 426 Surrey - South 14 11 0 18 0 0 14 29 Surrey - Cloverdale 33 60 81 32 10 0 124 92 Surrey - North 90 100 12 47 0 0 102 147 Surrey - Guildford 0 1 0 123 0 0 0 124 Surrey - Whalley 11 12 68 12 0 0 79 24Surrey Total 148 184 161 232 10 0 319 416University Endowment Lands 0 0 102 0 0 0 102 0 Vancouver - West End 0 0 0 0 0 0 0 0 Vancouver - Downtown 0 0 56 0 0 0 56 0 Vancouver - Kitsilano 3 1 63 0 0 0 66 1 Vancouver - False Creek 1 0 0 0 0 0 1 0 Vancouver - Granville/Oak 1 2 46 0 0 0 47 2 Vancouver - Kerrisdale 1 13 0 0 0 0 1 13 Vancouver - Marpole 4 6 10 0 0 0 14 6 Vancouver - Eastside 36 99 0 104 0 0 36 203 Vancouver - Mt. Pleasant 6 2 0 2 0 0 6 4 Vancouver - Strath/Grand 0 3 3 0 0 0 3 3 Vancouver - Westside 21 5 24 0 0 0 45 5Vancouver Total 73 131 202 106 0 0 275 237West Vancouver 10 3 0 0 0 0 10 3White Rock 5 7 0 0 0 0 5 7Vancouver CMA 433 540 945 1,071 10 7 1,388 1,618
Source: CM HC (Starts and Completions Survey)
Submarket
Housing Now - Vancouver and Abbotsford - Date Released: May 2007
Canada Mortgage and Housing Corporation32
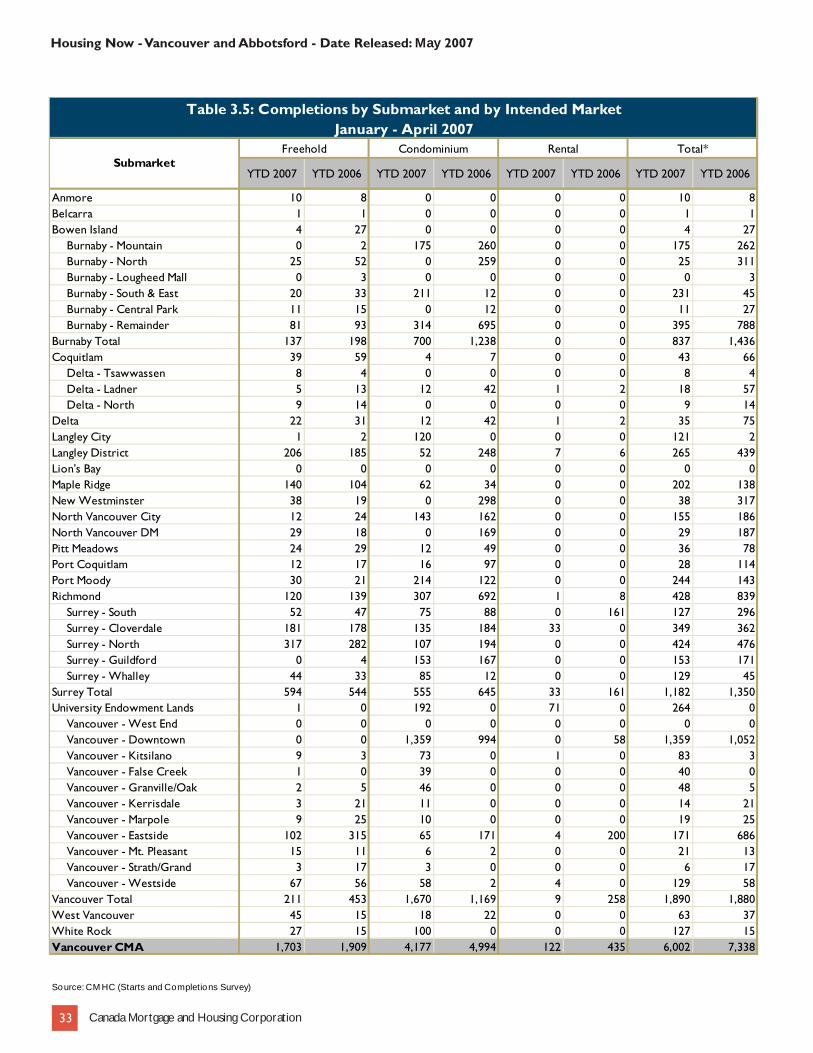
Table 3.5: Completions by Submarket and by Intended MarketJanuary - April 2007
Freehold Condominium Rental Total*
YTD 2007 YTD 2006 YTD 2007 YTD 2006 YTD 2007 YTD 2006 YTD 2007 YTD 2006
Anmore 10 8 0 0 0 0 10 8Belcarra 1 1 0 0 0 0 1 1Bowen Island 4 27 0 0 0 0 4 27 Burnaby - Mountain 0 2 175 260 0 0 175 262 Burnaby - North 25 52 0 259 0 0 25 311 Burnaby - Lougheed Mall 0 3 0 0 0 0 0 3 Burnaby - South & East 20 33 211 12 0 0 231 45 Burnaby - Central Park 11 15 0 12 0 0 11 27 Burnaby - Remainder 81 93 314 695 0 0 395 788Burnaby Total 137 198 700 1,238 0 0 837 1,436Coquitlam 39 59 4 7 0 0 43 66 Delta - Tsawwassen 8 4 0 0 0 0 8 4 Delta - Ladner 5 13 12 42 1 2 18 57 Delta - North 9 14 0 0 0 0 9 14Delta 22 31 12 42 1 2 35 75Langley City 1 2 120 0 0 0 121 2Langley District 206 185 52 248 7 6 265 439Lion's Bay 0 0 0 0 0 0 0 0Maple Ridge 140 104 62 34 0 0 202 138New Westminster 38 19 0 298 0 0 38 317North Vancouver City 12 24 143 162 0 0 155 186North Vancouver DM 29 18 0 169 0 0 29 187Pitt Meadows 24 29 12 49 0 0 36 78Port Coquitlam 12 17 16 97 0 0 28 114Port Moody 30 21 214 122 0 0 244 143Richmond 120 139 307 692 1 8 428 839 Surrey - South 52 47 75 88 0 161 127 296 Surrey - Cloverdale 181 178 135 184 33 0 349 362 Surrey - North 317 282 107 194 0 0 424 476 Surrey - Guildford 0 4 153 167 0 0 153 171 Surrey - Whalley 44 33 85 12 0 0 129 45Surrey Total 594 544 555 645 33 161 1,182 1,350University Endowment Lands 1 0 192 0 71 0 264 0 Vancouver - West End 0 0 0 0 0 0 0 0 Vancouver - Downtown 0 0 1,359 994 0 58 1,359 1,052 Vancouver - Kitsilano 9 3 73 0 1 0 83 3 Vancouver - False Creek 1 0 39 0 0 0 40 0 Vancouver - Granville/Oak 2 5 46 0 0 0 48 5 Vancouver - Kerrisdale 3 21 11 0 0 0 14 21 Vancouver - Marpole 9 25 10 0 0 0 19 25 Vancouver - Eastside 102 315 65 171 4 200 171 686 Vancouver - Mt. Pleasant 15 11 6 2 0 0 21 13 Vancouver - Strath/Grand 3 17 3 0 0 0 6 17 Vancouver - Westside 67 56 58 2 4 0 129 58Vancouver Total 211 453 1,670 1,169 9 258 1,890 1,880West Vancouver 45 15 18 22 0 0 63 37White Rock 27 15 100 0 0 0 127 15Vancouver CMA 1,703 1,909 4,177 4,994 122 435 6,002 7,338
Source: CM HC (Starts and Completions Survey)
Submarket
Housing Now - Vancouver and Abbotsford - Date Released: May 2007
Canada Mortgage and Housing Corporation33

Table 4: Absorbed Single-Detached Units by Price RangeApril 2007
Price Ranges
< $400,000$400,000 - $499,999
$500,000 - $599,999
$600,000 - $749,999
$750,000 +
Units Share (%)
Units Share (%)
Units Share (%)
Units Share (%)
Units Share (%)
AnmoreApril 2007 0 0.0 0 0.0 0 0.0 0 0.0 1 100.0 1 -- --April 2006 0 n/a 0 n/a 0 n/a 0 n/a 0 n/a 0 -- --Year-to-date 2007 0 0.0 0 0.0 0 0.0 0 0.0 9 100.0 9 -- --Year-to-date 2006 0 0.0 0 0.0 0 0.0 0 0.0 6 100.0 6 -- --BelcarraApril 2007 0 0.0 0 0.0 0 0.0 0 0.0 1 100.0 1 -- --April 2006 0 n/a 0 n/a 0 n/a 0 n/a 0 n/a 0 -- --Year-to-date 2007 0 0.0 0 0.0 0 0.0 0 0.0 1 100.0 1 -- --Year-to-date 2006 0 0.0 0 0.0 0 0.0 0 0.0 1 100.0 1 -- --Bowen IslandApril 2007 0 0.0 0 0.0 0 0.0 2 100.0 0 0.0 2 -- --April 2006 0 0.0 0 0.0 2 100.0 0 0.0 0 0.0 2 -- --Year-to-date 2007 0 0.0 0 0.0 0 0.0 2 66.7 1 33.3 3 -- --Year-to-date 2006 2 7.4 5 18.5 10 37.0 4 14.8 6 22.2 27 585,000 631,200 BurnabyApril 2007 0 0.0 0 0.0 0 0.0 5 83.3 1 16.7 6 -- --April 2006 0 0.0 0 0.0 16 29.6 25 46.3 13 24.1 54 633,000 697,296 Year-to-date 2007 0 0.0 0 0.0 3 4.6 23 35.4 39 60.0 65 775,000 805,477 Year-to-date 2006 2 1.5 13 9.7 40 29.9 52 38.8 27 20.1 134 618,500 654,694 CoquitlamApril 2007 4 66.7 0 0.0 1 16.7 0 0.0 1 16.7 6 -- --April 2006 0 0.0 0 0.0 0 0.0 5 100.0 0 0.0 5 -- --Year-to-date 2007 4 22.2 0 0.0 1 5.6 2 11.1 11 61.1 18 775,000 694,533 Year-to-date 2006 2 13.3 0 0.0 3 20.0 9 60.0 1 6.7 15 620,000 601,063 DeltaApril 2007 0 0.0 0 0.0 0 0.0 1 14.3 6 85.7 7 -- --April 2006 1 6.7 3 20.0 4 26.7 3 20.0 4 26.7 15 575,000 653,850 Year-to-date 2007 0 0.0 0 0.0 5 17.2 7 24.1 17 58.6 29 750,000 762,100 Year-to-date 2006 3 6.7 7 15.6 20 44.4 8 17.8 7 15.6 45 550,000 605,198 Langley CityApril 2007 0 0.0 0 0.0 0 0.0 1 100.0 0 0.0 1 -- --April 2006 0 n/a 0 n/a 0 n/a 0 n/a 0 n/a 0 -- --Year-to-date 2007 0 0.0 0 0.0 0 0.0 2 100.0 0 0.0 2 -- --Year-to-date 2006 0 n/a 0 n/a 0 n/a 0 n/a 0 n/a 0 -- --Langley DistrictApril 2007 0 0.0 14 30.4 20 43.5 10 21.7 2 4.3 46 561,450 576,061 April 2006 2 7.7 24 92.3 0 0.0 0 0.0 0 0.0 26 457,200 460,125 Year-to-date 2007 21 9.3 79 34.8 97 42.7 25 11.0 5 2.2 227 529,900 533,994 Year-to-date 2006 26 13.1 141 71.2 29 14.6 2 1.0 0 0.0 198 458,450 460,656
Source: CM HC (M arket Absorption Survey)
Average Price ($)
Submarket TotalMedian
Price ($)
Housing Now - Vancouver and Abbotsford - Date Released: May 2007
Canada Mortgage and Housing Corporation34

Table 4: Absorbed Single-Detached Units by Price RangeApril 2007
Price Ranges
< $400,000$400,000 - $499,999
$500,000 - $599,999
$600,000 - $749,999
$750,000 +
Units Share (%)
Units Share (%)
Units Share (%)
Units Share (%)
Units Share (%)
Lion's BayApril 2007 0 n/a 0 n/a 0 n/a 0 n/a 0 n/a 0 -- --April 2006 0 n/a 0 n/a 0 n/a 0 n/a 0 n/a 0 -- --Year-to-date 2007 0 n/a 0 n/a 0 n/a 0 n/a 0 n/a 0 -- --Year-to-date 2006 0 n/a 0 n/a 0 n/a 0 n/a 0 n/a 0 -- --Maple RidgeApril 2007 1 2.2 19 42.2 23 51.1 2 4.4 0 0.0 45 520,000 515,610 April 2006 0 0.0 14 51.9 13 48.1 0 0.0 0 0.0 27 499,900 509,248 Year-to-date 2007 2 1.5 57 42.9 64 48.1 8 6.0 2 1.5 133 515,000 522,168 Year-to-date 2006 40 32.3 57 46.0 19 15.3 7 5.6 1 0.8 124 450,000 457,510 New WestminsterApril 2007 0 0.0 0 0.0 4 66.7 2 33.3 0 0.0 6 -- --April 2006 0 n/a 0 n/a 0 n/a 0 n/a 0 n/a 0 -- --Year-to-date 2007 0 0.0 0 0.0 18 69.2 5 19.2 3 11.5 26 588,900 595,892 Year-to-date 2006 10 47.6 10 47.6 1 4.8 0 0.0 0 0.0 21 415,000 408,557 North Vancouver CityApril 2007 0 0.0 0 0.0 0 0.0 0 0.0 4 100.0 4 -- --April 2006 0 0.0 0 0.0 0 0.0 0 0.0 2 100.0 2 -- --Year-to-date 2007 0 0.0 0 0.0 0 0.0 0 0.0 12 100.0 12 1,289,500 1,240,083 Year-to-date 2006 0 0.0 0 0.0 0 0.0 0 0.0 8 100.0 8 -- --North Vancouver DMApril 2007 0 0.0 0 0.0 0 0.0 0 0.0 8 100.0 8 -- --April 2006 0 0.0 0 0.0 0 0.0 0 0.0 6 100.0 6 -- --Year-to-date 2007 1 3.4 0 0.0 0 0.0 0 0.0 28 96.6 29 1,320,000 1,270,655 Year-to-date 2006 0 0.0 0 0.0 0 0.0 0 0.0 18 100.0 18 1,200,000 1,113,250 Pitt MeadowsApril 2007 0 0.0 2 18.2 9 81.8 0 0.0 0 0.0 11 572,000 562,745 April 2006 0 0.0 7 87.5 1 12.5 0 0.0 0 0.0 8 -- --Year-to-date 2007 0 0.0 5 20.8 19 79.2 0 0.0 0 0.0 24 570,950 553,473 Year-to-date 2006 5 13.9 30 83.3 1 2.8 0 0.0 0 0.0 36 429,500 431,803 Port CoquitlamApril 2007 0 0.0 0 0.0 0 0.0 0 0.0 1 100.0 1 -- --April 2006 0 0.0 2 50.0 1 25.0 1 25.0 0 0.0 4 -- --Year-to-date 2007 0 0.0 2 33.3 3 50.0 0 0.0 1 16.7 6 -- --Year-to-date 2006 0 0.0 11 73.3 2 13.3 2 13.3 0 0.0 15 460,000 471,933 Port MoodyApril 2007 0 0.0 0 0.0 0 0.0 0 0.0 1 100.0 1 -- --April 2006 0 0.0 0 0.0 8 57.1 6 42.9 0 0.0 14 575,000 569,286 Year-to-date 2007 0 0.0 0 0.0 0 0.0 8 27.6 21 72.4 29 800,000 825,782 Year-to-date 2006 0 0.0 0 0.0 23 71.9 8 25.0 1 3.1 32 575,000 611,454 RichmondApril 2007 0 0.0 0 0.0 4 17.4 4 17.4 15 65.2 23 845,000 845,109 April 2006 4 9.1 9 20.5 9 20.5 4 9.1 18 40.9 44 690,000 748,233 Year-to-date 2007 0 0.0 0 0.0 11 8.7 36 28.6 79 62.7 126 920,500 880,480 Year-to-date 2006 10 6.8 17 11.6 23 15.6 32 21.8 65 44.2 147 716,800 747,519
Source: CM HC (M arket Absorption Survey)
Average Price ($)
Submarket TotalMedian
Price ($)
Housing Now - Vancouver and Abbotsford - Date Released: May 2007
Canada Mortgage and Housing Corporation35

Table 4: Absorbed Single-Detached Units by Price RangeApril 2007
Price Ranges
< $400,000$400,000 - $499,999
$500,000 - $599,999
$600,000 - $749,999
$750,000 +
UnitsShare (%)
UnitsShare (%)
UnitsShare (%)
UnitsShare (%)
UnitsShare (%)
SurreyApril 2007 1 0.8 30 24.0 37 29.6 39 31.2 18 14.4 125 598,000 648,655 April 2006 25 11.5 88 40.6 63 29.0 25 11.5 16 7.4 217 499,000 536,113 Year-to-date 2007 2 0.4 149 28.3 147 27.9 124 23.6 104 19.8 526 579,900 645,953 Year-to-date 2006 94 15.3 231 37.6 166 27.0 76 12.4 48 7.8 615 499,000 541,872 University Endowment LandsApril 2007 0 n/a 0 n/a 0 n/a 0 n/a 0 n/a 0 -- --April 2006 0 n/a 0 n/a 0 n/a 0 n/a 0 n/a 0 -- --Year-to-date 2007 0 n/a 0 n/a 0 n/a 0 n/a 0 n/a 0 -- --Year-to-date 2006 0 0.0 0 0.0 0 0.0 0 0.0 1 100.0 1 -- --Vancouver CityApril 2007 0 0.0 0 0.0 1 2.0 7 14.0 42 84.0 50 1,033,000 1,269,500 April 2006 0 0.0 0 0.0 7 8.3 47 56.0 30 35.7 84 699,500 791,932 Year-to-date 2007 0 0.0 1 0.5 3 1.4 53 24.8 157 73.4 214 898,000 1,205,065 Year-to-date 2006 0 0.0 2 0.7 22 7.4 154 51.7 120 40.3 298 700,000 880,923 West VancouverApril 2007 0 0.0 0 0.0 0 0.0 0 0.0 10 100.0 10 2,690,000 2,926,600 April 2006 0 0.0 0 0.0 0 0.0 0 0.0 4 100.0 4 -- --Year-to-date 2007 0 0.0 0 0.0 0 0.0 0 0.0 51 100.0 51 2,450,000 2,868,103 Year-to-date 2006 0 0.0 0 0.0 0 0.0 0 0.0 18 100.0 18 2,400,000 2,552,222 White RockApril 2007 0 0.0 0 0.0 0 0.0 0 0.0 1 100.0 1 -- --April 2006 0 0.0 0 0.0 0 0.0 0 0.0 4 100.0 4 -- --Year-to-date 2007 0 0.0 0 0.0 0 0.0 2 40.0 3 60.0 5 -- --Year-to-date 2006 0 0.0 0 0.0 1 10.0 0 0.0 9 90.0 10 1,014,500 1,038,090 Vancouver CMAApril 2007 6 1.7 65 18.3 99 27.9 73 20.6 112 31.5 355 619,000 815,125 April 2006 32 6.2 147 28.5 124 24.0 116 22.5 97 18.8 516 575,000 644,159 Year-to-date 2007 30 2.0 293 19.1 371 24.2 297 19.3 544 35.4 1,535 649,000 821,514 Year-to-date 2006 194 11.0 524 29.6 360 20.4 354 20.0 337 19.1 1,769 550,000 643,792
Source: CM HC (M arket Absorption Survey)
Average Price ($)
Submarket TotalMedian
Price ($)
Housing Now - Vancouver and Abbotsford - Date Released: May 2007
Canada Mortgage and Housing Corporation36

Table 4.1: Average Price ($) of Absorbed Single-detached UnitsApril 2007
Submarket April 2007 April 2006 % Change YTD 2007 YTD 2006 % Change
Anmore -- -- n/a -- -- n/aBelcarra -- -- n/a -- -- n/aBowen Island -- -- n/a -- 631,200 n/aBurnaby Total -- 697,296 n/a 805,477 654,694 23.0Coquitlam -- -- n/a 694,533 601,063 15.6Delta -- 653,850 n/a 762,100 605,198 25.9Langley City -- -- n/a -- -- n/aLangley District 576,061 460,125 25.2 533,994 460,656 15.9Lion's Bay -- -- n/a -- -- n/aMaple Ridge 515,610 509,248 1.2 522,168 457,510 14.1New Westminster -- -- n/a 595,892 408,557 45.9North Vancouver City -- -- n/a 1,240,083 -- n/aNorth Vancouver DM -- -- n/a 1,270,655 1,113,250 14.1Pitt Meadows 562,745 -- n/a 553,473 431,803 28.2Port Coquitlam -- -- n/a -- 471,933 n/aPort Moody -- 569,286 n/a 825,782 611,454 35.1Richmond 845,109 748,233 12.9 880,480 747,519 17.8Surrey Total 648,655 536,113 21.0 645,953 541,872 19.2University Endowment Lands -- -- n/a -- -- n/aVancouver City 1,269,500 791,932 60.3 1,205,065 880,923 36.8West Vancouver 2,926,600 -- n/a 2,868,103 2,552,222 12.4White Rock -- -- n/a -- 1,038,090 n/aVancouver CMA 815,125 644,159 26.5 821,514 643,792 27.6
Source: CM HC (M arket Absorption Survey)
Housing Now - Vancouver and Abbotsford - Date Released: May 2007
Canada Mortgage and Housing Corporation37
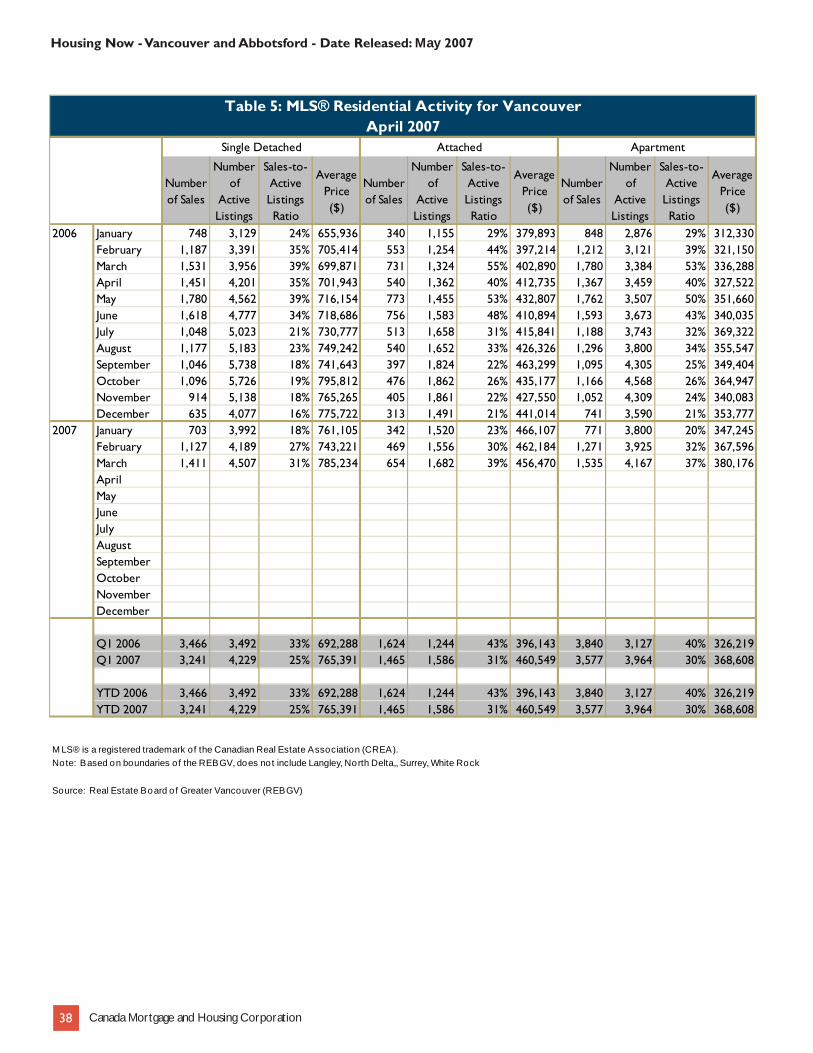
Number of Sales
Number of
Active Listings
Sales-to-Active Listings Ratio
Average Price ($)
Number of Sales
Number of
Active Listings
Sales-to-Active Listings Ratio
Average Price ($)
Number of Sales
Number of
Active Listings
Sales-to-Active Listings Ratio
Average Price ($)
2006 January 748 3,129 24% 655,936 340 1,155 29% 379,893 848 2,876 29% 312,330February 1,187 3,391 35% 705,414 553 1,254 44% 397,214 1,212 3,121 39% 321,150March 1,531 3,956 39% 699,871 731 1,324 55% 402,890 1,780 3,384 53% 336,288April 1,451 4,201 35% 701,943 540 1,362 40% 412,735 1,367 3,459 40% 327,522May 1,780 4,562 39% 716,154 773 1,455 53% 432,807 1,762 3,507 50% 351,660June 1,618 4,777 34% 718,686 756 1,583 48% 410,894 1,593 3,673 43% 340,035July 1,048 5,023 21% 730,777 513 1,658 31% 415,841 1,188 3,743 32% 369,322August 1,177 5,183 23% 749,242 540 1,652 33% 426,326 1,296 3,800 34% 355,547September 1,046 5,738 18% 741,643 397 1,824 22% 463,299 1,095 4,305 25% 349,404October 1,096 5,726 19% 795,812 476 1,862 26% 435,177 1,166 4,568 26% 364,947November 914 5,138 18% 765,265 405 1,861 22% 427,550 1,052 4,309 24% 340,083December 635 4,077 16% 775,722 313 1,491 21% 441,014 741 3,590 21% 353,777
2007 January 703 3,992 18% 761,105 342 1,520 23% 466,107 771 3,800 20% 347,245February 1,127 4,189 27% 743,221 469 1,556 30% 462,184 1,271 3,925 32% 367,596March 1,411 4,507 31% 785,234 654 1,682 39% 456,470 1,535 4,167 37% 380,176AprilMayJuneJulyAugustSeptemberOctoberNovemberDecember
Q1 2006 3,466 3,492 33% 692,288 1,624 1,244 43% 396,143 3,840 3,127 40% 326,219Q1 2007 3,241 4,229 25% 765,391 1,465 1,586 31% 460,549 3,577 3,964 30% 368,608
YTD 2006 3,466 3,492 33% 692,288 1,624 1,244 43% 396,143 3,840 3,127 40% 326,219YTD 2007 3,241 4,229 25% 765,391 1,465 1,586 31% 460,549 3,577 3,964 30% 368,608
M LS® is a registered trademark of the Canadian Real Estate Association (CREA).
Source: Real Estate Board o f Greater Vancouver (REBGV)
Note: Based on boundaries o f the REBGV, does not include Langley, North Delta,, Surrey, White Rock
Table 5: MLS® Residential Activity for VancouverApril 2007
Single Detached Attached Apartment
Housing Now - Vancouver and Abbotsford - Date Released: May 2007
Canada Mortgage and Housing Corporation38

Number of Sales
Number of
Active Listings
Sales-to-Active Listings Ratio
Average Price ($)
Number of Sales
Number of
Active Listings
Sales-to-Active Listings Ratio
Average Price ($)
Number of Sales
Number of
Active Listings
Sales-to-Active Listings Ratio
Average Price ($)
2006 Q1 3,466 3,492 33% 692,288 1,624 1,244 43% 396,143 3,840 3,127 40% 326,219Q2 4,849 4,513 36% 712,746 2,069 1,467 47% 419,561 4,722 3,546 44% 340,750Q3 3,271 5,315 21% 740,896 1,450 1,711 28% 432,739 3,579 3,949 30% 358,240Q4 2,645 4,980 18% 780,433 1,194 1,738 23% 434,120 2,959 4,156 24% 353,310
2007 Q1 3,241 4,229 25% 765,391 1,465 1,586 31% 460,549 3,577 3,964 30% 368,608Q2Q3Q4
YTD 2006 3,466 3,492 33% 692,288 1,624 1,244 43% 396,143 3,840 3,127 40% 326,219YTD 2007 3,241 4,229 25% 765,391 1,465 1,586 31% 460,549 3,577 3,964 30% 368,608
M LS® is a registered trademark o f the Canadian Real Estate Association (CREA).
Source: Real Estate Board of Greater Vancouver (REBGV)
Note: Based on boundaries o f the REBGV, does not include Langley, North Delta,, Surrey, White Rock
Table 5: MLS® Residential Activity for VancouverFirst Quarter 2007
Single Detached Attached Apartment
Housing Now - Vancouver and Abbotsford - Date Released: May 2007
Canada Mortgage and Housing Corporation39

Table 6: Economic IndicatorsApril 2007
Interest Rates
Mortage Rates (%)
1 Yr. Term
5 Yr. Term
2006 January 658 5.80 6.30 108.6 126.0 1,168 4.9 66.6 738 February 667 5.85 6.45 109.5 126.1 1,161 4.8 66.1 737 March 667 6.05 6.45 109.9 126.8 1,162 4.7 65.9 741 April 685 6.25 6.75 110.9 127.6 1,174 4.3 66.2 742 May 685 6.25 6.75 111.2 128.6 1,181 4.2 66.5 741 June 697 6.60 6.95 111.4 128.5 1,186 4.1 66.6 741 July 697 6.60 6.95 112.0 128.8 1,192 4.1 66.8 739 August 691 6.40 6.85 114.8 129.0 1,197 4.0 66.9 743 September 682 6.40 6.70 115.4 128.5 1,201 4.2 67.1 746 October 688 6.40 6.80 116.0 128.6 1,205 4.2 67.2 748 November 673 6.40 6.55 116.1 129.1 1,202 4.4 67.2 750 December 667 6.30 6.45 116.1 129.4 1,200 4.7 67.1 752
2007 January 679 6.50 6.65 116.1 129.3 1,199 4.8 67.0 752 February 679 6.50 6.65 116.1 129.6 1,210 4.2 67.2 751 March 669 6.40 6.49 117.4 130.0 1,221 3.6 67.3 753 April 678 6.60 6.64 130.5 1,220 3.7 67.2 758 May June July August September October November December
"P & I" means Principal and Interest (assumes $100,000 mortgage amortized over 25 years using current 5 year interest rate)"NHPI" means New Housing Price Index"CPI" means Consumer Price Index"SA" means Seasonally Adjusted
Source: CM HC, adapted from Statistics Canada (CANSIM ), CREA (M LS®), Statistics Canada (CANSIM )
P & I Per
$100,000
Employment SA (,000)
Unemployment Rate (%) SA
Participation Rate (%) SA
NHPI, Total,
Vancouver CMA
1997=100
Vancouver Labour Market
Average Weekly
Earnings ($)
CPI, 1992 =100
Housing Now - Vancouver and Abbotsford - Date Released: May 2007
Canada Mortgage and Housing Corporation40

HOUSING NOW REPORT TABLES Available in ALL reports: 1 Housing Activity Summary of CMA 2 Starts by Submarket and by Dwelling Type – Current Month or Quarter 2.1 Starts by Submarket and by Dwelling Type – Year-to-Date 3 Completions by Submarket and by Dwelling Type – Current Month or Quarter 3.1 Completions by Submarket and by Dwelling Type – Year-to-Date 4 Absorbed Single-Detached Units by Price Range 5 MLS® Residential Activity 6 Economic Indicators Available in SELECTED Reports: 1.1 Housing Activity Summary by Submarket 1.2 History of Housing Activity (once a year) 2.2 Starts by Submarket, by Dwelling Type and by Intended Market – Current Month or Quarter 2.3 Starts by Submarket, by Dwelling Type and by Intended Market – Year-to-Date 2.4 Starts by Submarket and by Intended Market – Current Month or Quarter 2.5 Starts by Submarket and by Intended Market – Year-to-Date 3.2 Completions by Submarket, by Dwelling Type and by Intended Market – Current Month or Quarter 3.3 Completions by Submarket, by Dwelling Type and by Intended Market – Year-to-Date 3.4 Completions by Submarket and by Intended Market – Current Month or Quarter 3.5 Completions by Submarket and by Intended Market – Year-to-Date 4.1 Average Price ($) of Absorbed Single-Detached Units SYMBOLS n/a Not applicable * Totals may not add up due to co-operatives and unknown market types ** Percent change > 200% - Nil or zero -- Amount too small to be expressed SA Monthly figures are adjusted to remove normal seasonal variation
Housing Now - Vancouver and Abbotsford - Date Released: May 2007
Canada Mortgage and Housing Corporation41

Table 1: Housing Activity Summary of Abbotsford CMAApril 2007
Ownership
Freehold Condominium
Single SemiRow, Apt. & Other
SingleRow and
SemiApt. & Other
Single, Semi, and
Row
Apt. & Other
STARTSApril 2007 45 0 24 0 31 0 0 0 100April 2006 22 0 14 6 0 0 0 0 42% Change 104.5 n/a 71.4 -100.0 n/a n/a n/a n/a 138.1Year-to-date 2007 144 0 80 3 63 216 0 0 506Year-to-date 2006 104 0 54 13 6 194 0 0 371% Change 38.5 n/a 48.1 -76.9 ** 11.3 n/a n/a 36.4UNDER CONSTRUCTIONApril 2007 237 0 122 17 112 689 0 0 1,177April 2006 199 0 84 18 60 335 0 82 778% Change 19.1 n/a 45.2 -5.6 86.7 105.7 n/a -100.0 51.3COMPLETIONSApril 2007 26 0 6 2 0 47 0 0 81April 2006 24 0 14 3 0 0 0 0 41% Change 8.3 n/a -57.1 -33.3 n/a n/a n/a n/a 97.6Year-to-date 2007 129 4 105 10 44 129 0 0 421Year-to-date 2006 106 0 62 9 5 40 0 0 222% Change 21.7 n/a 69.4 11.1 ** ** n/a n/a 89.6COMPLETED & NOT ABSORBEDApril 2007 72 2 12 5 0 5 0 0 96April 2006 57 0 24 0 3 5 0 0 89% Change 26.3 n/a -50.0 n/a -100.0 0.0 n/a n/a 7.9ABSORBEDApril 2007 23 0 14 2 3 45 0 0 87April 2006 33 0 14 4 0 8 0 0 59% Change -30.3 n/a 0.0 -50.0 n/a ** n/a n/a 47.5Year-to-date 2007 131 2 101 8 44 124 0 0 410Year-to-date 2006 127 0 78 12 6 46 0 0 269% Change 3.1 n/a 29.5 -33.3 ** 169.6 n/a n/a 52.4
Source: CM HC (Starts and Completions Survey, M arket Absorption Survey)
Rental
Total*
Housing Now - Vancouver and Abbotsford - Date Released: May 2007
Canada Mortgage and Housing Corporation42

Table 1.1: Housing Activity Summary by SubmarketApril 2007
Ownership
Freehold Condominium
Single SemiRow, Apt. & Other
SingleRow and
SemiApt. & Other
Single, Semi, and
Row
Apt. & Other
STARTSAbbotsford CityApril 2007 33 0 24 0 31 0 0 0 88April 2006 15 0 14 5 0 0 0 0 34Fraser Valley H RDAApril 2007 0 0 0 0 0 0 0 0 0April 2006 0 0 0 0 0 0 0 0 0Mission DMApril 2007 12 0 0 0 0 0 0 0 12April 2006 7 0 0 1 0 0 0 0 8Abbotsford CMAApril 2007 45 0 24 0 31 0 0 0 100April 2006 22 0 14 6 0 0 0 0 42UNDER CONSTRUCTIONAbbotsford CityApril 2007 157 0 122 16 112 619 0 0 1,026April 2006 155 0 84 12 60 210 0 82 603Fraser Valley H RDAApril 2007 1 0 0 0 0 0 0 0 1April 2006 0 0 0 0 0 0 0 0 0Mission DMApril 2007 79 0 0 1 0 70 0 0 150April 2006 44 0 0 6 0 125 0 0 175
Abbotsford CMA
April 2007 237 0 122 17 112 689 0 0 1,177
April 2006 199 0 84 18 60 335 0 82 778
COMPLETIONSAbbotsford CityApril 2007 13 0 6 2 0 47 0 0 68April 2006 18 0 14 0 0 0 0 0 32Fraser Valley H RDAApril 2007 0 0 0 0 0 0 0 0 0April 2006 2 0 0 0 0 0 0 0 2Mission DMApril 2007 13 0 0 0 0 0 0 0 13April 2006 4 0 0 3 0 0 0 0 7Abbotsford CMAApril 2007 26 0 6 2 0 47 0 0 81April 2006 24 0 14 3 0 0 0 0 41
Source: CM HC (Starts and Completions Survey, M arket Absorption Survey)
Rental
Total*
Housing Now - Vancouver and Abbotsford - Date Released: May 2007
Canada Mortgage and Housing Corporation43
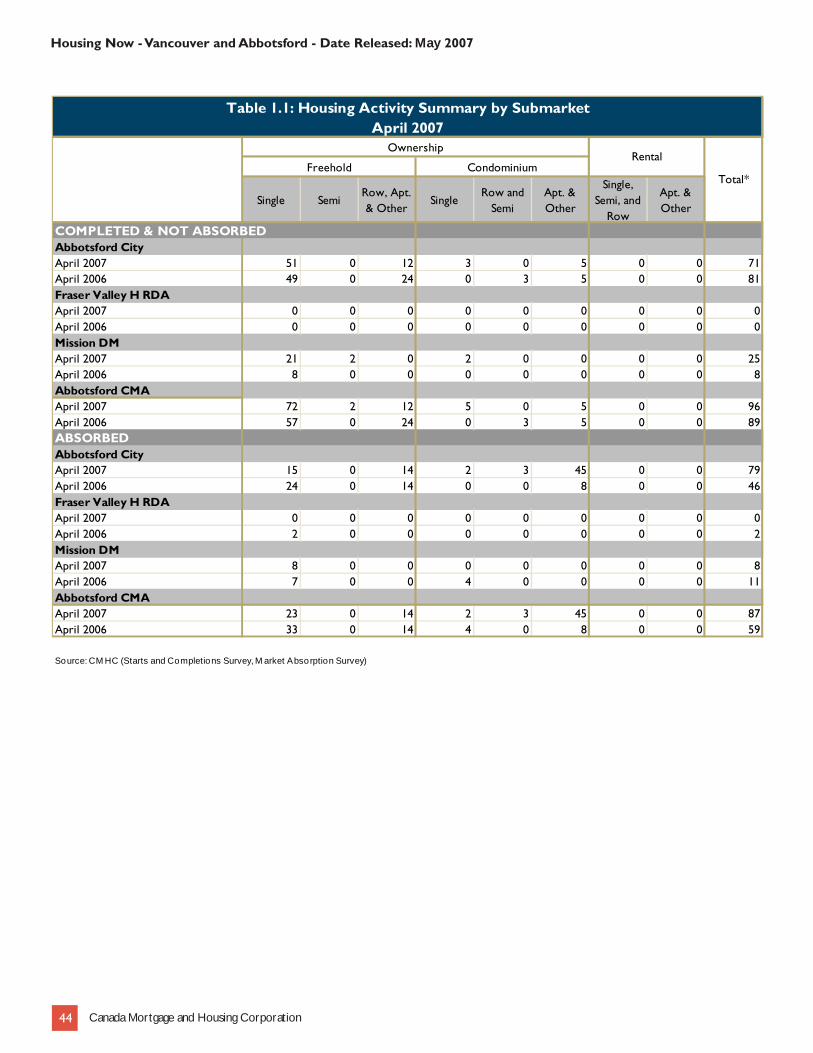
Table 1.1: Housing Activity Summary by SubmarketApril 2007
Ownership
Freehold Condominium
Single SemiRow, Apt. & Other
SingleRow and
SemiApt. & Other
Single, Semi, and
Row
Apt. & Other
COMPLETED & NOT ABSORBEDAbbotsford CityApril 2007 51 0 12 3 0 5 0 0 71April 2006 49 0 24 0 3 5 0 0 81Fraser Valley H RDAApril 2007 0 0 0 0 0 0 0 0 0April 2006 0 0 0 0 0 0 0 0 0Mission DMApril 2007 21 2 0 2 0 0 0 0 25April 2006 8 0 0 0 0 0 0 0 8Abbotsford CMAApril 2007 72 2 12 5 0 5 0 0 96April 2006 57 0 24 0 3 5 0 0 89ABSORBEDAbbotsford CityApril 2007 15 0 14 2 3 45 0 0 79April 2006 24 0 14 0 0 8 0 0 46Fraser Valley H RDAApril 2007 0 0 0 0 0 0 0 0 0April 2006 2 0 0 0 0 0 0 0 2Mission DMApril 2007 8 0 0 0 0 0 0 0 8April 2006 7 0 0 4 0 0 0 0 11Abbotsford CMAApril 2007 23 0 14 2 3 45 0 0 87April 2006 33 0 14 4 0 8 0 0 59
Source: CM HC (Starts and Completions Survey, M arket Absorption Survey)
Rental
Total*
Housing Now - Vancouver and Abbotsford - Date Released: May 2007
Canada Mortgage and Housing Corporation44

Table 1.2A: History of Housing Starts of Abbotsford CMA1997 - 2006
Ownership
Freehold Condominium
Single SemiRow, Apt. & Other
SingleRow and
SemiApt. & Other
Single, Semi, and
Row
Apt. & Other
2006 391 4 132 36 95 549 0 0 1,207% Change -12.1 100.0 -42.1 176.9 61.0 200.0 n/a -100.0 19.32005 445 2 228 13 59 183 0 82 1,012% Change -25.0 0.0 4.6 -7.1 -13.2 ** n/a -37.9 -6.62004 593 2 218 14 68 56 0 132 1,083% Change -6.0 -80.0 -20.7 ** -11.7 n/a n/a 120.0 2.62003 631 10 275 3 77 0 0 60 1,056% Change 14.3 ** 78.6 -50.0 18.5 -100.0 n/a -73.8 1.72002 552 2 154 6 65 28 0 229 1,038% Change 34.6 0.0 n/a 200.0 ** n/a n/a n/a 148.32001 410 2 0 2 4 0 0 0 418% Change 9.9 0.0 n/a 100.0 -81.8 n/a -100.0 n/a 3.22000 373 2 0 1 22 0 6 0 405% Change -6.3 -50.0 n/a -50.0 -68.6 n/a n/a -100.0 -28.41999 398 4 0 2 70 0 0 92 566% Change 2.8 -33.3 n/a -93.9 42.9 n/a -100.0 67.3 5.61998 387 6 0 33 49 0 6 55 536% Change -24.4 -40.0 n/a 200.0 -18.3 -100.0 50.0 0.0 -38.51997 512 10 0 11 60 219 4 55 871
Source: CM HC (Starts and Completions Survey)
Rental
Total*
Housing Now - Vancouver and Abbotsford - Date Released: May 2007
Canada Mortgage and Housing Corporation45

Table 2: Starts by Submarket and by Dwelling TypeApril 2007
Submarket Single Semi Row Apt. & Other TotalApril 2007
April 2006
April 2007
April 2006
April 2007
April 2006
April 2007
April 2006
April 2007
April 2006
% Change
Abbotsford City 33 20 0 0 31 0 24 14 88 34 158.8Fraser Valley H RDA 0 0 0 0 0 0 0 0 0 0 n/aMission DM 12 8 0 0 0 0 0 0 12 8 50.0
Abbotsford CMA 45 28 0 0 31 0 24 14 100 42 138.1
Table 2.1: Starts by Submarket and by Dwelling TypeJanuary - April 2007
Single Semi Row Apt. & Other TotalYTD 2007
YTD 2006
YTD 2007
YTD 2006
YTD 2007
YTD 2006
YTD 2007
YTD 2006
YTD 2007
YTD 2006
% Change
Abbotsford City 89 86 0 0 63 6 296 193 448 285 57.2Fraser Valley H RDA 1 0 0 0 0 0 0 0 1 0 n/aMission DM 57 31 0 0 0 0 0 55 57 86 -33.7
Abbotsford CMA 147 117 0 0 63 6 296 248 506 371 36.4
Source: CM HC (Starts and Completions Survey)
Submarket
Housing Now - Vancouver and Abbotsford - Date Released: May 2007
Canada Mortgage and Housing Corporation46

Table 2.2: Starts by Submarket, by Dwelling Type and by Intended MarketApril 2007
Row Apt. & OtherFreehold and Condominium
RentalFreehold and Condominium
Rental
April 2007 April 2006 April 2007 April 2006 April 2007 April 2006 April 2007 April 2006Abbotsford City 0 0 0 0 0 0 0 0Fraser Valley H RDA 0 0 0 0 0 0 0 0Mission DM 31 0 0 0 24 14 0 0
Abbotsford DM 0 0 0 0 0 0 0 0
Table 2.3: Starts by Submarket, by Dwelling Type and by Intended MarketJanuary - April 2007
Row Apt. & OtherFreehold and Condominium
RentalFreehold and Condominium
Rental
YTD 2007 YTD 2006 YTD 2007 YTD 2006 YTD 2007 YTD 2006 YTD 2007 YTD 2006Abbotsford City 0 0 0 0 0 0 0 0Fraser Valley H RDA 0 0 0 0 0 55 0 0Mission DM 63 6 0 0 296 248 0 0
Abbotsford CMA 0 0 0 0 0 0 0 0
Table 2.4: Starts by Submarket and by Intended MarketApril 2007
Freehold Condominium Rental Total*
April 2007 April 2006 April 2007 April 2006 April 2007 April 2006 April 2007 April 2006Abbotsford City 57 29 31 5 0 0 88 34Fraser Valley H RDA 0 0 0 0 0 0 0 0Mission DM 12 7 0 1 0 0 12 8
Abbotsford CMA 69 36 31 6 0 0 100 42
Table 2.5: Starts by Submarket and by Intended MarketJanuary - April 2007
Freehold Condominium Rental Total*
YTD 2007 YTD 2006 YTD 2007 YTD 2006 YTD 2007 YTD 2006 YTD 2007 YTD 2006Abbotsford City 166 132 282 153 0 0 448 285Fraser Valley H RDA 1 0 0 0 0 0 1 0Mission DM 57 26 0 60 0 0 57 86
Abbotsord CMA 224 158 282 213 0 0 506 371
Source: CM HC (Starts and Completions Survey)
Submarket
Submarket
Submarket
Submarket
Housing Now - Vancouver and Abbotsford - Date Released: May 2007
Canada Mortgage and Housing Corporation47

Table 3: Completions by Submarket and by Dwelling TypeApril 2007
Submarket Single Semi Row Apt. & Other TotalApril 2007
April 2006
April 2007
April 2006
April 2007
April 2006
April 2007
April 2006
April 2007
April 2006
% Change
Abbotsford City 15 18 0 0 0 0 53 14 68 32 112.5Fraser Valley H RDA 0 2 0 0 0 0 0 0 0 2 -100.0Mission DM 13 7 0 0 0 0 0 0 13 7 85.7
Abbotsford CMA 28 27 0 0 0 0 53 14 81 41 97.6
Table 3.1: Completions by Submarket and by Dwelling TypeJanuary - April 2007
Single Semi Row Apt. & Other TotalYTD 2007
YTD 2006
YTD 2007
YTD 2006
YTD 2007
YTD 2006
YTD 2007
YTD 2006
YTD 2007
YTD 2006
% Change
Abbotsford City 90 74 2 0 42 5 179 102 313 181 72.9Fraser Valley H RDA 0 2 0 0 0 0 0 0 0 2 -100.0Mission DM 49 39 4 0 0 0 55 0 108 39 176.9
Abbotsford CMA 139 115 6 0 42 5 234 102 421 222 89.6
Source: CM HC (Starts and Completions Survey)
Submarket
Housing Now - Vancouver and Abbotsford - Date Released: May 2007
Canada Mortgage and Housing Corporation48

Table 3.2: Completions by Submarket, by Dwelling Type and by Intended MarketApril 2007
Row Apt. & OtherFreehold and Condominium
RentalFreehold and Condominium
Rental
April 2007 April 2006 April 2007 April 2006 April 2007 April 2006 April 2007 April 2006Abbotsford City 0 0 0 0 0 0 0 0Fraser Valley H RDA 0 0 0 0 0 0 0 0Mission DM 0 0 0 0 53 14 0 0
Abbotsford DM 0 0 0 0 0 0 0 0
Table 3.3: Completions by Submarket, by Dwelling Type and by Intended MarketJanuary - April 2007
Row Apt. & OtherFreehold and Condominium
RentalFreehold and Condominium
Rental
YTD 2007 YTD 2006 YTD 2007 YTD 2006 YTD 2007 YTD 2006 YTD 2007 YTD 2006Abbotsford City 0 0 0 0 0 0 0 0Fraser Valley H RDA 0 0 0 0 55 0 0 0Mission DM 42 5 0 0 234 102 0 0
Abbotsford CMA 0 0 0 0 0 0 0 0
Table 3.4: Completions by Submarket and by Intended MarketApril 2007
Freehold Condominium Rental Total*
April 2007 April 2006 April 2007 April 2006 April 2007 April 2006 April 2007 April 2006Abbotsford City 19 32 49 0 0 0 68 32Fraser Valley H RDA 0 2 0 0 0 0 0 2Mission DM 13 4 0 3 0 0 13 7
Abbotsford CMA 32 38 49 3 0 0 81 41
Table 3.5: Completions by Submarket and by Intended MarketJanuary - April 2007
Freehold Condominium Rental Total*
YTD 2007 YTD 2006 YTD 2007 YTD 2006 YTD 2007 YTD 2006 YTD 2007 YTD 2006Abbotsford City 137 136 176 45 0 0 313 181Fraser Valley H RDA 0 2 0 0 0 0 0 2Mission DM 101 30 7 9 0 0 108 39
Abbotsord CMA 238 168 183 54 0 0 421 222
Source: CM HC (Starts and Completions Survey)
Submarket
Submarket
Submarket
Submarket
Housing Now - Vancouver and Abbotsford - Date Released: May 2007
Canada Mortgage and Housing Corporation49

Table 4: Absorbed Single-Detached Units by Price RangeApril 2007
Price Ranges
< $400,000 $400,000 - $499,999
$500,000 - $599,999
$600,000 - $749,999
$750,000 +
UnitsShare (%)
UnitsShare (%)
UnitsShare (%)
UnitsShare (%)
UnitsShare (%)
Abbotsford CityApril 2007 0 0.0 3 17.6 9 52.9 1 5.9 4 23.5 17 540,000 598,406 April 2006 2 8.3 16 66.7 0 0.0 0 0.0 0 0.0 24 454,450 465,308 Year-to-date 2007 1 1.0 47 48.5 8 8.2 7 7.2 8 8.2 97 510,000 535,792 Year-to-date 2006 11 12.8 50 58.1 2 2.3 3 3.5 2 2.3 86 457,000 470,591 Fraser Valley H RDAApril 2007 0 n/a 0 n/a 0 n/a 0 n/a 0 n/a 0 -- --April 2006 2 100.0 0 0.0 0 0.0 0 0.0 0 0.0 2 -- --Year-to-date 2007 0 n/a 0 n/a 0 n/a 0 n/a 0 n/a 0 -- --Year-to-date 2006 2 100.0 0 0.0 0 0.0 0 0.0 0 0.0 2 -- --Mission DMApril 2007 0 0.0 5 62.5 0 0.0 0 0.0 0 0.0 8 -- --April 2006 6 54.5 4 36.4 0 0.0 0 0.0 0 0.0 11 398,000 431,173 Year-to-date 2007 3 7.1 32 76.2 0 0.0 0 0.0 0 0.0 42 439,500 459,424 Year-to-date 2006 38 74.5 12 23.5 0 0.0 0 0.0 0 0.0 51 379,900 387,908 Abbotsford CMAApril 2007 0 0.0 8 32.0 4 16.0 1 4.0 4 16.0 25 510,000 563,392 April 2006 10 27.0 20 54.1 0 0.0 0 0.0 0 0.0 37 449,900 443,516 Year-to-date 2007 4 2.9 79 56.8 8 5.8 7 5.0 8 5.8 139 489,900 512,717 Year-to-date 2006 51 36.7 62 44.6 2 1.4 3 2.2 2 1.4 139 420,000 437,078
Source: CM HC (Starts and Completions Survey)
Submarket TotalMedian
Price ($)Average Price ($)
Housing Now - Vancouver and Abbotsford - Date Released: May 2007
Canada Mortgage and Housing Corporation50

Table 4.1: Average Price ($) of Absorbed Single-detached UnitsApril 2007
Submarket April 2007 April 2006 % Change YTD 2007 YTD 2006 % Change
Abbotsford City 598,406 465,308 28.6 535,792 470,591 13.9Fraser Valley H RDA -- -- n/a -- -- n/aMission DM -- 431,173 n/a 459,424 387,908 18.4Abbotsford CMA 563,392 443,516 27.0 512,717 437,078 17.3
Source: CM HC (M arket Absorption Survey)
Housing Now - Vancouver and Abbotsford - Date Released: May 2007
Canada Mortgage and Housing Corporation51

Table 5: MLS® Residential Activity for Fraser ValleyApril 2007
Number of
Sales1 Yr/Yr2 (%) Sales SA1
Number of New
Listings1
New
Listings SA1
Sales-to-New
Listings SA2
Average
Price1 ($)Yr/Yr2 (%)
Average
Price1 ($) SA
2006 January 1,089 37.8 1,734 1,928 2,049 84.6 371,058 25.6 368,302 February 1,583 17.3 1,683 2,317 2,286 73.6 348,935 12.0 359,509 March 1,959 12.5 1,630 2,353 2,058 79.2 373,986 18.9 373,748 April 1,798 -2.2 1,618 2,189 2,120 76.3 392,465 23.7 387,707 May 2,141 9.2 1,676 2,587 2,087 80.3 407,628 22.5 399,792 June 2,025 -16.1 1,620 2,724 2,254 71.9 408,467 28.4 399,616 July 1,581 -19.3 1,467 2,459 2,299 63.8 403,913 22.8 402,537 August 1,590 -26.8 1,435 2,386 2,344 61.2 405,293 26.3 414,964 September 1,242 -23.1 1,346 2,261 2,259 59.6 407,850 17.0 410,516 October 1,193 -29.4 1,279 2,553 2,426 52.7 399,503 19.9 418,941 November 1,112 -26.3 1,307 1,733 2,321 56.3 407,461 19.0 423,149 December 780 -28.2 1,298 797 1,784 72.8 381,446 9.6 374,676
2007 January 936 -14.0 1,454 2,165 2,273 64.0 387,113 4.3 393,476 February 1,359 -14.2 1,440 2,277 2,343 61.5 406,086 16.4 421,690 March 1,660 -15.3 1,457 3,097 2,606 55.9 420,696 12.5 419,769 April 1,695 -5.7 1,446 2,729 2,552 56.7 427,481 8.9 423,302 May June July August September October November December
Q1 2006 4,631 19.3 6,598 364,734 17.8Q1 2007 3,955 -14.6 7,539 407,728 11.8
YTD 2006 6,429 12.4 8,787 372,490 19.4YTD 2007 5,650 -12.1 10,268 413,654 11.1
8.0494634 -19.41882721 -25.46274 7.1999812 10.077473 13.101074M LS® is a registered trademark of the Canadian Real Estate Association (CREA).All figures contained in this publication are smoothed data, except for sales and active listingsRaw data: data observed fo r the current quarter Smoothed data: average for the last four quarters, to reduce strong variations from one quarter to another and give a clearer trend* Single-family homes: detached, semi-detached and row homes** At the end o f the quarter***: observed change greater than 100%n/a: data not available when fewer than 8 sales are recorded during the quarterNote: Fraser Valley Real Estate Board includes North Delta, Surrey, Langley, White Rock
Source: CREA
Housing Now - Vancouver and Abbotsford - Date Released: May 2007
Canada Mortgage and Housing Corporation52

Table 6: Economic IndicatorsApril 2007
Interest Rates
Mortage Rates (%)
1 Yr. Term
5 Yr. Term
2006 January 658 5.80 6.30 109.5 125.6 82 5.4 68.9 665 February 667 5.85 6.45 110.3 125.8 83 4.8 68.8 669 March 667 6.05 6.45 110.7 126.3 83 4.8 68.3 680 April 685 6.25 6.75 111.6 127.1 81 4.7 67.0 691 May 685 6.25 6.75 111.9 128.1 80 5.9 66.6 689 June 697 6.60 6.95 112.2 128.1 80 5.1 66.0 685 July 697 6.60 6.95 112.6 128.2 81 4.6 66.0 675 August 691 6.40 6.85 115.2 128.4 81 3.7 66.1 672 September 682 6.40 6.70 115.8 127.8 82 4.1 66.6 669 October 688 6.40 6.80 116.2 127.7 83 4.2 66.8 670 November 673 6.40 6.55 116.3 128.1 84 3.9 67.3 685 December 667 6.30 6.45 116.3 128.3 85 4.2 68.3 693
2007 January 679 6.50 6.65 116.3 128.4 86 4.2 68.9 709 February 679 6.50 6.65 116.3 128.6 85 4.5 68.4 714 March 669 6.40 6.49 117.5 129.1 84 4.7 67.3 721 April 678 6.60 6.64 129.5 83 4.9 67.0 726 May June July August September October November December
"P & I" means Principal and Interest (assumes $100,000 mortgage amortized over 25 years using current 5 year interest rate)"NHPI" means New Housing Price Index"CPI" means Consumer Price Index"SA" means Seasonally Adjusted
Source: CM HC, adapted from Statistics Canada (CANSIM ), CREA (M LS®), Statistics Canada (CANSIM )
P & I Per
$100,000
Employment SA (,000)
Unemployment Rate (%) SA
Participation Rate (%) SA
NHPI, Total,
1997=100 (B.C.)
CPI, 1992 =100 (B.C.)
Abbotsford Labour Market
Average Weekly
Earnings ($)
Housing Now - Vancouver and Abbotsford - Date Released: May 2007
Canada Mortgage and Housing Corporation53

Methodology
Starts & Completions Survey Methodology The Starts and Completions Survey is conducted by way of site visits which are used to confirm that new units have reached set stages in the construction process. Since most municipalities in the country issue building permits, these are used as an indication of where construction is likely to take place. In areas where there are no permits, reliance has to be placed either on local sources or searching procedures.
The Starts and Completions Survey is carried out monthly in urban areas with population in excess of 50,000, as defined by the 2001 Census. In urban areas with populations of 10,000 to 49,999, all Starts are enumerated in the last month of the quarter (i.e. four times a year, in March, June, September and December). In these centres with quarterly enumeration, Completion activity is modelled based on historical patterns. Monthly Starts and Completions activity in these quarterly locations are statistically estimated at a provincial level for single and multi categories. Centres with populations below 10,000 are enumerated on a sample basis, also in the last month of each quarter (i.e. four times a year, in March, June, September and December).
The Starts and Completions Survey enumerates dwelling units in new structures only, designed for non-transient and year-round occupancy.
Mobile homes are included in the surveys. A mobile home is a type of manufactured house that is completely assembled in a factory and then moved to a foundation before it is occupied.
Trailers or any other movable dwelling (the larger often referred to as a mobile home) with no permanent foundation are excluded from the survey.
Conversions and/or alterations within an existing structure are excluded from the surveys as are seasonal dwellings, such as: summer cottages, hunting and ski cabins, trailers and boat houses; and hostel accommodations, such as: hospitals, nursing homes, penal institutions, convents, monasteries, military and industrial camps, and collective types of accommodation such as: hotels, clubs, and lodging homes.
Market Absorption Survey Methodology The Market Absorption Survey is carried out in conjunction with the Starts and Completions Survey in urban areas with populations in excess of 50,000. When a structure is recorded as completed, an update is also made as units are sold or rented. The dwellings are then enumerated each month until such time as full absorption occurs.
STARTS AND COMPLETIONS SURVEY AND MARKET ABSORPTION SURVEY DEFINITIONS A “dwelling unit”, for purposes of the Starts and Completions Survey, is defined as a structurally separate set of self-contained living premises with a private entrance from outside the building or from a common hall, lobby, or stairway inside the building. Such an entrance must be one that can be used without passing through another separate dwelling unit.
A “start”, for purposes of the Starts and Completions Survey, is defined as the beginning of construction work on a building, usually when the concrete has been poured for the whole of the footing around the structure, or an equivalent stage where a basement will not be part of the structure.
The number of units “under construction” as at the end of the period shown, takes into account certain adjustments which are necessary for various reasons. For example, after a start on a dwelling has commenced construction may cease, or a structure, when completed, may contain more or fewer dwelling units than were reported at start.
A “completion”, for purposes of the Starts and Completions Survey, is defined as the stage at which all the proposed construction work on a dwelling unit has been performed, although under some circumstances a dwelling may be counted as completed where up to 10 per cent of the proposed work remains to be done.
The term “absorbed” means that a housing unit is no longer on the market (i.e. has been sold or rented). This usually happens when a binding contract is secured by a non-refundable deposit and has been signed by a qualified purchaser. The purpose of the Market Absorption Survey is to measure the rate at which units are sold or rented after they are completed, as well as collect prices.
Housing Now - Vancouver and Abbotsford - Date Released: May 2007
Canada Mortgage and Housing Corporation54
DWELLING TYPES:
A “Single-Detached” dwelling (also referred to as “Single”) is a building containing only one dwelling unit, which is completely separated on all sides from any other dwelling or structure. Includes link homes, where two units may share a common basement wall but are separated above grade. Also includes cluster-single developments. A “Semi-Detached (Double)” dwelling (also referred to as “Semi”) is one of two dwellings located side-by-side in a building, adjoining no other structure and separated by a common or party wall extending from ground to roof. A “Row (Townhouse)” dwelling is a one family dwelling unit in a row of three or more attached dwellings separated by a common or party wall extending from ground to roof. The term “Apartment and other” includes all dwellings other than those described above, including structures commonly known as stacked townhouses, duplexes, triplexes, double duplexes and row duplexes.
Geographical terms:
A census metropolitan area (CMA) or a census agglomeration (CA) is formed by one or more adjacent municipalities centred on a large urban area (known as the urban core). The census population count of the urban core is at least 10,000 to form a census agglomeration and at least 100,000 to form a census metropolitan area. To be included in the CMA or CA, other adjacent municipalities must have a high degree on integration with the central urban area, as measured by commuting flows derived from census place of work data. CMAs and CAs contain whole municipalities or Census Subdivisions. A “Rural” area, for the purposes of this publication, is a centre with a population less than 10,000.
All data presented in this publication is based on Statistics Canada’s 2001 Census area definitions.
Intended market:
The “intended market” is the tenure in which the unit is being marketed. This includes the following categories: Freehold: A residence where the owner owns the dwelling and lot outright.
Condominium (including Strata-Titled): An individual dwelling which is privately owned, but where the building and/or the land are collectively owned by all dwelling unit owners. A condominium is a form of ownership rather than a type of house.
Rental: Dwelling constructed for rental purposes regardless of who finances the structure.
Housing Now - Vancouver and Abbotsford - Date Released: May 2007
Canada Mortgage and Housing Corporation55

CMHC—Home to Canadians
Canada Mortgage and Housing Corporation (CMHC) has been Canada’s national housing agency for more than 60 years.
Together with other housing stakeholders, we help ensure that Canada maintains one of the best housing systems in the world. We are committed to helping Canadians access a wide choice of quality, affordable homes, while making vibrant, healthy communities and cities a reality across the country.
For more information, visit our website at http://www.cmhc.ca/
You can also reach us by phone at 1-800-668-2642 or by fax at 1-800-245-9274.
Outside Canada call 613-748-2003 or fax to 613-748-2016.
Canada Mortgage and Housing Corporation supports the Government of Canada policy on access to information for people with disabilities. If you wish to obtain this publication in alternative formats, call 1-800-668-2642.
The Market Analysis Centre’s (MAC) electronic suite of national standardized products is now available for free on CMHC’s website. You can now view, print, download or subscribe to future editions and get market information e-mailed automatically to you the same day it is released. It’s quick and convenient! Go to http://www.cmhc.ca/housingmarketinformation
For more information on MAC and the wealth of housing market information available to you, visit us today at http://www.cmhc.ca/housingmarketinformation
To subscribe to priced, printed editions of the national standardized product suite or regional specialty publications, call 1 800 668-2642.
©2007 Canada Mortgage and Housing Corporation. All rights reserved. CMHC grants reasonable rights of use of this publica-tion’s content solely for personal, corporate or public policy research, and educational purposes. This permission consists of the right to use the content for general reference purposes in written analyses and in the reporting of results, conclusions, and forecasts including the citation of limited amounts of supporting data extracted from this publication. Reasonable and limited rights of use are also permitted in commercial publications subject to the above criteria, and CMHC’s right to request that such use be discontinued for any reason.
Any use of the publication’s content must include the source of the information, including statistical data, acknowledged as follows:
Source: CMHC (or “Adapted from CMHC,” if appropriate), name of product, year and date of publication issue.
Other than as outlined above, the content of the publication cannot be reproduced or transmitted to any person or, if acquired by an organization, to users outside the organization. Placing the publication, in whole or part, on a website accessible to the public or on any website accessible to persons not directly employed by the organization is not permitted. To use the content of any CMHC Market Analysis publication for any purpose other than the general reference purposes set out above or to request permission to reproduce large portions of, or entire CMHC Market Analysis publications, please contact: the Canadian Housing Information Centre (CHIC) at mailto:[email protected]; (613) 748-2367 or 1 800 668-2642
For permission, please provide CHIC with the following information: Publication’s name, year and date of issue.
Without limiting the generality of the foregoing, no portion of the content may be translated from English or French into any other language without the prior written permission of Canada Mortgage and Housing Corporation.
The information, analyses and opinions contained in this publication are based on various sources believed to be reliable, but their accuracy cannot be guaranteed. The information, analyses and opinions shall not be taken as representations for which Canada Mortgage and Housing Corporation or any of its employees shall incur responsibility.
Housing Now - Vancouver and Abbotsford - Date Released: May 2007
Canada Mortgage and Housing Corporation56

Find out More!
Throughout 2007, CMHC will continue to enhance its suite of surveys and analyticalreports to better serve you. Visit www.cmhc.ca/housingmarketinformation regularly tofind out more about our product updates and to subscribe to our FREE electronic reports.
NEW MarketAnalysis ReportsSubscribe Now!
Just Released!Housing Market Outlook – Canada and Regional Highlights ReportsNorthern Housing Outlook Report
Coming Soon!Spring Rental Market Survey Results
Rental Market Report – Canada and Provincial HighlightsRental Market Statistics
Renovation and Home Purchase ReportCoverage of additional centres:
- Abbotsford - Barrie- Kingston - Guelph- Peterborough - Brantford