valuing ecosystem services provided by lakes: insights...
TRANSCRIPT

Valuing Ecosystem Services Provided by Lakes:
Insights from a Meta-Analysis∗
By
The values of ecosystem services provided by lakes and reser-
voirs are examined through a meta-analysis on an expanded world-
wide database. The study assesses the socio-economic values at-
tributable to the hydrological, biogeochemical and ecological func-
tions provided by lakes and reservoirs (either natural or artificial).
Based on the most extensive global database of non-market and
market valuations of ecosystem services provided by artificial and
natural lakes, we provide an estimation of the average value of a
lake per household (84 USD$2010 per respondent and per year)
and we offer some insights on how people value eleven different
lake ecosystem services. A particular a high valuation is found for
lake amenities whereas a low value is documented for the spiritual
or symbolic appreciation of the lake. An interesting result is the
fact that some interactions between ecosystem services appear to
be significant for explaining lake values. This reflects some trade-
offs, synergies and antagonisms between ecosystem services. As a
result, the value for a specific lake ecosystem service is shown to
depend upon other ecosystem services provided by this lake. Key-
words: Meta-Analysis, Lake, Ecosystem services, Environmental
Valuation
I. Introduction
Lakes are one of the most important source of water available for human and
economic use. It is considered that at the world level 90% of liquid water is con-
∗ This work is a part of the FP7 European Mars project.
1

2
tained in natural and artificial lakes and, according to Shiklomanov and Rodda
(2003), the estimated area of all lakes in the world is about 2 million km2 repre-
senting about 1.5% of the total land area.1
Lakes (and more generally freshwater resources) provide many services. Some
of them are directly valued by humans (increased water quantity, reduced damage
due to flooding) whereas others benefit mainly to environment (reduced erosion,
improved habitat for species). Since most of these services are not traded on
markets, their economic valuation is not straightforward. As a result a wide
non-market valuation literature has developed in the last decades and numerous
lake valuation studies have been performed.2 Due to the wide range of valuation
methods, characteristics of lakes and value estimates, it is very difficult to assess
whether any systematic trends can be distilled from this literature and to shed
light on what factors determine a lake’s value.3 Trying to identify if there exists
an unobserved valuation function that determines a lake’s value given its physical,
economic and geographic characteristics is the main objective of our paper.
We propose here to conduct a meta-analysis on the value of ecosystem services
provided by lakes. The term meta-analysis was coined by Glass (1976) to refer
to “the statistical analysis of a large collection of analysis results from individ-
ual studies for the purpose of integrating the findings” (p. 3).4 This approach
allows us to synthesize information regarding to the value of ecosystem services
from selected studies in a systematic way, and to test some hypotheses on the
determinants of these estimates.
In the field of economic valuation of environmental resources, several meta-
analyses published are related to water resources. These meta-analyses include
for wetlands (Brouwer, Langford, Bateman, and Turner 1999, Brander, Florax,
1This percentage varies highly according to the country considered, up to 8.6 and 9.4% for Swedenand for Finland, respectively.
2See Artell (2014), Abbott and Klaiber (2013) or Abidoye, Herriges, and Tobias (2012) for somerecent examples of this literature.
3A similar point has been made by Woodward and Wui (2001) for wetlands.4Originally used in experimental medical treatment and psychotherapy, meta-analyzes have been
playing an increasingly important role in environmental economics research since the beginning of the1990s, Brouwer, Langford, Bateman, and Turner (1999).
3
and Vermaat 2006, Ghermandi, van den Bergh, Brander, de Groot, and Nunes
2010, Brander, Bruer, Gerdes, Ghermandi, Kuik, Markandya, Navrud, Nunes,
Schaafsma, Vos, and Wagtendonk 2012, Eppink, Brander, and Wagtendonk 2014),
coastal recreation (Ghermandi and Nunes 2013), coral reef recreation (Brander,
Beukering, and Cesar 2007, Londono and Johnston 2012), lake amenities (Braden,
Feng, Freitas, and Won 2010), aquatic resources (Johnston, Besedin, Iovanna,
Miller, Wardwell, and Ranson 2005, Johnston, Ranson, Besedin, and Helm 2006,
Moeltner, Boyle, and Paterson 2007, Johnston and Thomassin 2010), water qual-
ity (Van Houtven, Powers, and Pattanayak 2007) and flood risk (Daniel, Florax,
and Rietveld 2009). To our best knowledge, our meta-analysis is the first one
focusing on ecosystem services provided specifically by lakes.
We argue that the results of a meta-analysis on ecosystem services provided by
lakes might be useful for several reasons. First, as explained above there remain
substantial debates on the economic value of lakes. Understanding of the physi-
cal, economic and geographic characteristics of lakes impact upon their economic
value may inform decisions related to their use, conservation or restoration. Sec-
ond, it is not clear if the relationships obtained with the existing meta-analyses for
other water bodies (rivers, wetlands, coastal water) may by used for lakes espe-
cially because, since some services provided by lakes are quite specific, ecosystem
economic values may differ according to the water body considered.5
The analysis in this paper relies on the most extensive global database of non-
market and market valuations of ecosystem services provided by artificial and nat-
ural lakes.6 In total, we identified and reviewed over 300 publications related to
5Magat, Huber, Viscusi, and Bell (2000) develop a framework for valuing river water quality im-provement. They find that the mean valuation of people for a lake water quality improvement is roughlytwice as valuable as a similar improvement in river water quality, implying that far more people werewilling to pay large amounts to improve lakes over rivers. Working on water quality of water bodies inthe United States, Viscusi, Huber, and Bell (2008) find that people have a significant preference for lakeimprovements over river improvements, a result compatible with a higher valuation attributed to lakes.Using an hedonic price approach, Sander and Polasky (2009) reports significant higher amenity valuesfor houses located at proximity of a lake, compared to a proximity of a river.
6Including artificial lakes (dams and reservoirs) is important due to their environmental impacts.In their mapping of the world’s reservoirs and dams, Lehner, Liermann, Revenga, Vorosmarty, Fekete,Crouzet, Doll, Endejan, Frenken, Magome, Nilsson, Robertson, Rodel, Sindorf, and Wisser (2011) indi-cate that 7.6% of the world’s rivers with average flows above 1 cubic meter per second are affected by a

4
valuations of ecosystem services provided by lakes. Among them, we selected val-
ues from a subset a little bit more than 100 of these studies that were sufficiently
comparable for inclusion in a meta-analysis. We then identify and quantitatively
evaluate the role of income effects, substitution effects, return to scale, population
density, biodiversity and geo-climatic conditions in the formation of lake ecosys-
tem values. Our result show promise for benefit transfer because they suggest that
it may be possible to reliably predict the value of ecosystem services provided by
lakes based on their physical, economic and geographic characteristics. This opens
the door to some value upscaling approaches as the ones proposed by Brander,
Bruer, Gerdes, Ghermandi, Kuik, Markandya, Navrud, Nunes, Schaafsma, Vos,
and Wagtendonk (2012) or Ghermandi and Nunes (2013).
II. Ecosystem services provided by lakes and reservoirs
This section outlines the definition and typology of lakes and reservoirs used in
this article, the functions that are utilized by humans, and the valuation methods
that are applied to value various lake and wetland services. This section also
discusses the heterogeneity of lake value estimates.
A. Defining lakes
One may think that defining lakes is an easy task but it is not in practice. Quite
simply, lakes are bodies of water that occupy depressions on land surface. There
is however no universally accepted definition of a lake. The International Glossary
of Hydrology briefly defines a lake as an “inland body of water of considerable
size”.7 In the European Water Framework, a lake is defined as a “body of standing
inland surface water” and this will be the definition we will refer to in the rest of
cumulative upstream reservoir capacity that exceeds 2% of their annual flow.7The International Glossary of Hydrology is a joint publication of the United Nations Educational,
Scientific and Cultural Organization and the World Meteorological Organization. It is available athttp://webworld.unesco.org/water/ihp/db/glossary/glu/aglu.htm.

5
this paper.8
We will include both natural and artificial lakes. We will also consider bodies of
water in dams and reservoirs. Indeed, since dams and reservoirs provide several
services including regulation of river flows, water storage, flood control, irrigation
of agricultural lands, navigation and electricity, they may have specific economic
values.9 On the other hand, dams and reservoirs can induce substantial costs to
human societies (population displacement, loss of land) but also to environment,
see Lehner, Liermann, Revenga, Vorosmarty, Fekete, Crouzet, Doll, Endejan,
Frenken, Magome, Nilsson, Robertson, Rodel, Sindorf, and Wisser (2011). Flow
regulation from dams and reservoirs has been shown to lead to numerous physical
and ecological impacts on freshwater ecosystems and on their dependent species.
The fragmentation of aquatic habitats, which limits the movement of species but
also the delivery of nutrients and sediments downstream, is another important
adverse ecological consequence of dams and reservoirs. It has also been debated
recently debated whether dams and reservoirs used for hydroelectric generation
are merely in-stream water users or whether they also consume water in the sense
of taking away water from water bodies.10 Those detrimental impact of dams
and reservoir might result is some negative value premia put by people on these
water bodies. This is an issue we will investigate in the meta-analysis.
Due to their specificities, we will exclude from the scope of our analysis wet-
lands.11 The interested reader mays refer to (Brouwer, Langford, Bateman, and
8One of the most elaborated definition of lakes has been provided by Kuusisto (1985) as “a depressionor a group of depressions partly or fully filled by water, all parts of the water body have the same surface,excluding temporary variability, caused by wind or ice, the ratio between in-flow and volume is smallenough to let most of the suspended, inflowing material to form bottom sediments, and the surface areaexceeds a given minimum value.”
9Mekonnen and Hoekstra (2012) indicate that hydropower accounts for about 16% of the world’selectricity supply and that about 30–40% of irrigated land worldwide relies on water stored behinddams.
10Working on 35 hydropower plants representing 8% of the global installed hydroelectric capacity,Mekonnen and Hoekstra (2012) suggests that hydropower is in fact a large consumptive user of water.The amount of water lost through evaporation annually from the selected reservoirs is equivalent to 10%of the global blue water footprint related to crop production.
11The International Glossary of Hydrology defines wetlands as area of marsh, fen, peatland or water– whether natural or artificial, permanent or temporary – with water that is static or flowing, fresh,brackish or salt, including areas of marine water the depth of which does not exceed six metres at lowtide. Wetlands play a specific role for instance in abating nitrogen load from agricultural sources or in

6
Turner 1999, Brander, Florax, and Vermaat 2006, Ghermandi, van den Bergh,
Brander, de Groot, and Nunes 2010, Brander, Bruer, Gerdes, Ghermandi, Kuik,
Markandya, Navrud, Nunes, Schaafsma, Vos, and Wagtendonk 2012, Eppink,
Brander, and Wagtendonk 2014) for some meta-analyses of values generated by
wetlands, in different part of the world.
B. Identifying, measuring and valuing ecosystem services provided by lakes
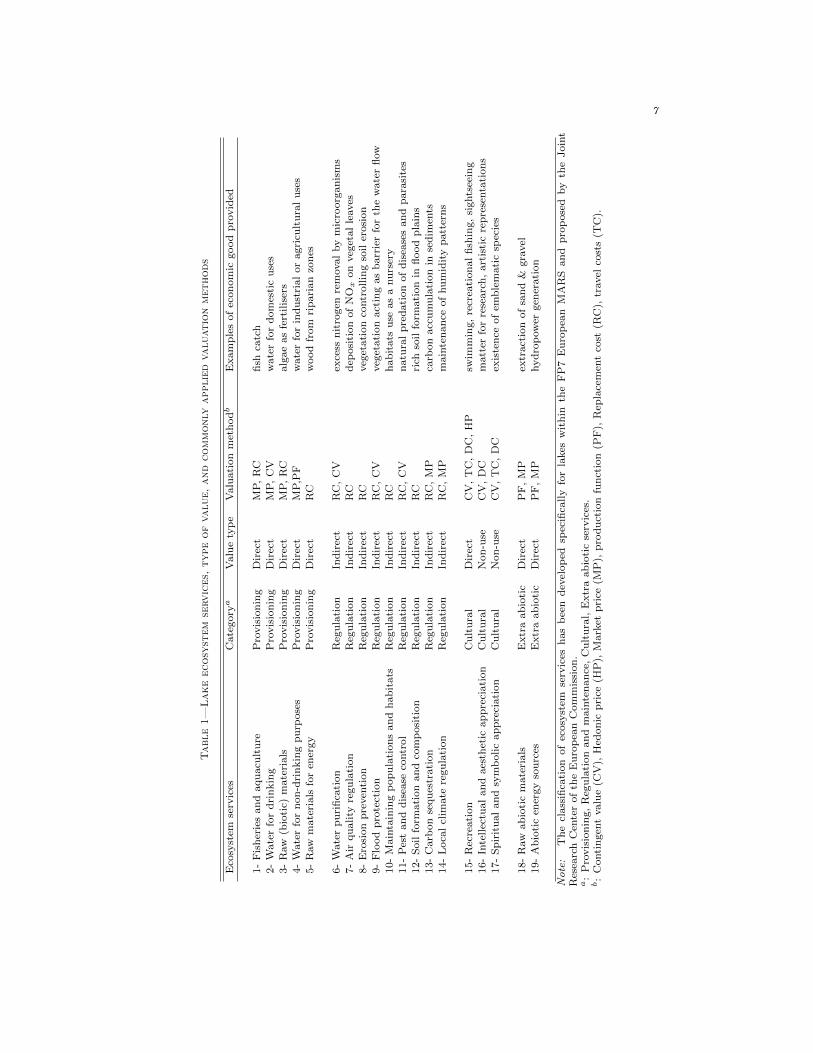
In Table 1, we proposed a classification of ecosystem services provided by lakes.
We also provide the methods most commonly used in their valuation.
The classification of ecosystem services has been developed by the Joint Re-
search Center of the European Commission specifically for lakes within the FP7
European MARS project. The conceptual framework is based on the CICES
v4.3 and has been tested in several pilot studies, including one on freshwater
ecosystems.12
flood protection.12Several classification of ecosystem services have been proposed, the most well-known can be found
in Costanza, d’Arge, de Groot, Farberk, Grasso, Hannon, Limburg, Naeem, O’Neill, Paruelo, Raskin,Suttonkk, and van den Belt (1997), de Groot, Wilson, and Boumans (2002), TEEB (2010), Haines-Youngand Potschin (2011). Some classifications are dedicated to aquatic ecosystem services, see for instanceBrander, Florax, and Vermaat (2006) for wetlands.
7
Table1—
Lakeecosy
stem
services,
typeofvalue,and
commonly
applied
valuationmethods
Eco
syst
emse
rvic
esC
ate
gory
aV
alu
ety
pe
Valu
ati
on
met
hodb
Exam
ple
sof
econ
om
icgood
pro
vid
ed
1-
Fis
her
ies
an
daqu
acu
ltu
reP
rovis
ion
ing
Dir
ect
MP
,R
Cfi
shca
tch
2-
Wate
rfo
rd
rin
kin
gP
rovis
ion
ing
Dir
ect
MP
,C
Vw
ate
rfo
rd
om
esti
cu
ses
3-
Raw
(bio
tic)
mate
rials
Pro
vis
ionin
gD
irec
tM
P,
RC
alg
ae
as
fert
ilis
ers
4-
Wate
rfo
rn
on
-dri
nkin
gp
urp
ose
sP
rovis
ion
ing
Dir
ect
MP
,PF
wate
rfo
rin
du
stri
al
or
agri
cult
ura
lu
ses
5-
Raw
mate
rials
for
ener
gy
Pro
vis
ion
ing
Dir
ect
RC
wood
from
rip
ari
an
zon
es
6-
Wate
rp
uri
fica
tion
Reg
ula
tion
Ind
irec
tR
C,
CV
exce
ssn
itro
gen
rem
oval
by
mic
roorg
an
ism
s
7-
Air
qu
ality
regu
lati
on
Reg
ula
tion
Ind
irec
tR
Cd
eposi
tion
of
NO
xon
veg
etal
leaves
8-
Ero
sion
pre
ven
tion
Reg
ula
tion
Ind
irec
tR
Cveg
etati
on
contr
ollin
gso
iler
osi
on
9-
Flo
od
pro
tect
ion
Reg
ula
tion
Ind
irec
tR
C,
CV
veg
etati
on
act
ing
as
barr
ier
for
the
wate
rfl
ow
10-
Main
tain
ing
pop
ula
tion
san
dh
ab
itats
Reg
ula
tion
Ind
irec
tR
Ch
ab
itats
use
as
anu
rser
y11-
Pes
tan
dd
isea
seco
ntr
ol
Reg
ula
tion
Ind
irec
tR
C,
CV
natu
ral
pre
dati
on
of
dis
ease
san
dp
ara
site
s
12-
Soil
form
ati
on
an
dco
mp
osi
tion
Reg
ula
tion
Ind
irec
tR
Cri
chso
ilfo
rmati
on
infl
ood
pla
ins
13-
Carb
on
sequ
estr
ati
on
Reg
ula
tion
Ind
irec
tR
C,
MP
carb
on
acc
um
ula
tion
inse
dim
ents
14-
Loca
lcl
imate
regu
lati
on
Reg
ula
tion
Ind
irec
tR
C,
MP
main
ten
an
ceof
hu
mid
ity
patt
ern
s
15-
Rec
reati
on
Cu
ltu
ral
Dir
ect
CV
,T
C,
DC
,H
Psw
imm
ing,
recr
eati
on
al
fish
ing,
sights
eein
g
16-
Inte
llec
tual
an
daes
thet
icap
pre
ciati
on
Cu
ltu
ral
Non
-use
CV
,D
Cm
att
erfo
rre
searc
h,
art
isti
cre
pre
senta
tion
s17-
Sp
irit
ual
an
dsy
mb
olic
ap
pre
ciati
on
Cu
ltu
ral
Non
-use
CV
,T
C,
DC
exis
ten
ceof
emb
lem
ati
csp
ecie
s
18-
Raw
ab
ioti
cm
ate
rials
Extr
aab
ioti
cD
irec
tP
F,
MP
extr
act
ion
of
san
d&
gra
vel
19-
Ab
ioti
cen
ergy
sou
rces
Extr
aab
ioti
cD
irec
tP
F,
MP
hyd
rop
ow
ergen
erati
on
Note:
Th
ecl
ass
ifica
tion
of
ecosy
stem
serv
ices
has
bee
nd
evel
op
edsp
ecifi
cally
for
lakes
wit
hin
the
FP
7E
uro
pea
nM
AR
San
dp
rop
ose
dby
the
Join
tR
esea
rch
Cen
ter
of
the
Eu
rop
ean
Com
mis
sion
.a:
Pro
vis
ion
ing,
Reg
ula
tion
an
dm
ain
ten
an
ce,
Cu
ltu
ral,
Extr
aab
ioti
cse
rvic
es.
b:
Conti
ngen
tvalu
e(C
V),
Hed
on
icp
rice
(HP
),M
ark
etp
rice
(MP
),p
rod
uct
ion
fun
ctio
n(P
F),
Rep
lace
men
tco
st(R
C),
travel
cost
s(T
C).
8
As noted above, lake provide a wide range of vital ecosystem services, which
have an equally wide range of value.13 Economists usually decompose the to-
tal economic value of ecosystems into direct use, indirect use and nonuse values.
Direct use values refer to consumptive and non-consumptive uses that entail di-
rect physical interaction with the lakes and their services such as outputs of
fish, fuel wood, recreation, and transport. Indirect use values include regulatory
ecological functions, which lead to indirect benefits such as flood control, storm
protection, nutrient retention, nursery grounds for different species, and erosion
control. Nonuse values include existence and bequest values of lakes.
Methods for valuing ecosystem services vary depending on the nature of the
service, and belong to two main categories namely revealed preference and stated
preference methods. Revealed-preference methods exploit the relationship be-
tween some forms of observed individual behavior (e.g., visiting a lake) and asso-
ciated environmental attributes (e.g., water quality of the lake) to estimate value.
The revealed preference approaches include market price (MP), production func-
tion (PF), hedonic pricing (HP), travel cost (TC), replacement cost (RC), and
damage cost avoidance (DC). On contrary, stated preference methods use survey
questions to have respondents explicitly or implicitly state their preferences and
values for a specific good. Within this category scholars usually make the dis-
tinction between contingent value (CV) and discrete choices (DC). The choice of
valuation method matters and depends upon the context. For instance, revealed
preference cannot be used to estimate nonuse values. While stated preference
techniques can, in principle, be used to value any type of ecosystem service, in
practice there may be cognitive limitations to stating preferences.
13Ecosystem services have been defined as the direct and indirect contributions of ecosystems tohuman well-being in TEEB (2010). The existing literature of ecosystem services provided by lakes hasbeen recently summarized in Schallenberg, de Winton, Verburg, Kelly, Hamill, Hamilton, Dymond, et al.(2013).

9
C. A global assessment of lake ecosystem services
We survey now the existing literature having addressed ecosystem services pro-
vided by lakes and reservoir, following the structure of the classification proposed
in Table 1. When no information is available specifically for lakes and reservoir,
we discuss the ecosystem services for inland waters.
Provisioning services. — Provisioning services are the products provided by
ecosystems, of which freshwater and food are two of the most important.
The Fisheries and aquaculture service corresponds to the ability of an ecosys-
tem to support fish supply. In 2012, it was estimated that 33.8% of world fisheries
and aquaculture production comes from inland water (FAO 2014), and this per-
centage has steadily increased over the last years from 28.4% in 2007. No official
publication allows to make the distinction between fish an aquaculture produced
from lakes and from rivers. Fish and fishery products are of great importance
for since they represent an important source of protein and essential micronu-
trients for human consumption.14 A specific characteristic of this service is its
highly uneven distribution at the global level. Indeed, 90% of the inland fish
catch worldwide is concentrated in Africa and Asia where the direct dependence
on inland fisheries and human well-being is the highest, see Dugan, Delaporte,
Andrew, O’Keefe, and Welcomme (2010).
The Water for drinking service corresponds the ability of an ecosystem to pro-
vide water for domestic use. Inland surface water sources account for a substan-
tial part for providing this service. Using a global-scale assessment model, Doll,
Hoffmann-Dobrev, Portmann, Siebert, Eicker, Rodell, Strassberg, and Scanlon
(2012) indicate for instance that 64% of the water used by domestic users world-
wide comes from surface sources. We may expect that lake will play an even
14According to FAO (2012), fish accounted for 16.6% of the world population’s intake of animal proteinin 2009 and 6.5% of all protein consumed.

10
more important role in the future in securing drinking water supply. Indeed some
global projection models such as Hejazi, Edmonds, Chaturvedi, Davies, and Eom
(2013) predict an increase of municipal water withdrawals from 466 km3 year−1
in 2005 to 1098 km3 year−1 in 2100.
The Raw (biotic) materials service is the capacity for an ecosystem to sustain
the production of biotic resources such as wood and strong fibers (for building),
biochemicals or biodynamic compounds (latex, gums, oils, waxes, tannins, dyes,
hormones, etc.) for all kinds of industrial purposes. Lakes produce a large amount
of biotic resources such as algae (which can be used as fertilisers) or vegetal
compounds (which can be used as cosmetics).
The Water for non-drinking purposes service corresponds to the provision of
water for industrial or agricultural uses.
The Raw materials for energy service include the supply in fuelwood from
riparian zones.
Regulation & Maintenance services. — This category encompasses all benefits
obtained from the regulation of ecosystem processes.
The Water purification service corresponds to the fact that some ecosystems
may allow the sedimentation (retention) of some soil particles. Run-off from city
streets and agricultural fields contain various pollutants such as oil, pesticides,
and fertilizer as well as excess soil. These pollutants are absorbed by the plants
and broken down by plants and bacteria to less harmful substances. Pollutants
attached to suspended soil particles are filtered out by grasses and other plants and
deposited in lakes. This process helps improve water quality. It has been shown
that lakes and reservoirs can contribute substantially to river network nitrogen
retention (Harrison, Maranger, Alexander, Giblin, Jacinthe, Mayorga, Seitzinger,
Sobota, and Wollheim 2009, Powers, Robertson, and Stanley 2013). Powers,
Robertson, and Stanley (2013) present also evidence of long-term retention of

11
phosphorous by lakes and reservoirs.
The Air quality regulation service corresponds to the fact that lakes extract
chemicals from the atmosphere, influencing many aspects of air quality.
The Erosion prevention service corresponds to the fact that the vegetative cover
on lake banks plays an important role in soil retention and the prevention of
landslides. Soil erosion is the most widespread form of soil degradation. 12% of
land area is globally affected by erosion which represents 1094 million ha (Mha).
Flood protection. For both flood formation and the occurrence of droughts,
the storage and retention of water in lakes or reservoirs is of high importance.
Analysing disasters having impacted population over the period 1975–2001, Jonkman
(2005) concludes that floods were the most frequently occurring, followed by wind-
storms. While some other disasters are more significant with respect to numbers
of killed (especially droughts and earthquakes), floods by far affect the most per-
sons, in total almost 2.2 billion over the considered period.
The Maintaining population and habitats service is the fact that an ecosystem
provides living space for all wild plant and animal species.
The Soil formation and composition service corresponds to rock weathering and
organic matter accumulation leading to the formation of productive soils.
Carbon sequestration is the process of capture and long-term storage of at-
mospheric carbon dioxide. It has been estimated that, on a global basis, lakes
and reservoirs sequester around 20% of the carbon transferred from land, re-
ducing carbon losses from inland waters to the atmosphere by around one-third
(Tranvik, Downing, Cotner, Loiselle, Striegl, Ballatore, Dillon, Finlay, Fortino,
Knoll, et al. 2009). Therefore, lakes can perform an important ecosystem service
in reducing the effect of climate warming. It has been however recently shown
that inland waters can be substantial sources of carbon dioxide and methane emis-
sions (Bastviken, Tranvik, Downing, Crill, and Enrich-Prast 2011). Accordingly,
the terrestrial green house gas sink may be smaller than currently believed. Typ-
ically, effects of lakes and reservoirs within river networks have been expressed as

12
changes in flux magnitude, but changes in flux variability may also occur. This
has recently been shown through decreased intra-annual variability of stream dis-
solved organic carbon fluxes downstream of natural lakes (Goodman, Baker, and
Wurtsbaugh 2011).
The Local climate regulation service corresponds to the fact that an ecosystem
may affect climate at the regional scale. Inland waters affect climate at the
regional scale through exchange of heat and water with the atmosphere (Krinner
2003). Inland waters tend to humidify the atmosphere, especially in summer,
and may modify the pattern of precipitations. Inland waters also regulate local
temperatures by absorbing heat in summer time and releasing it in winter (Hardin
and Jensen 2007).
Cultural services. — These are the nonmaterial benefits people obtain from
ecosystems in particular through spiritual enrichment, cognitive development, re-
flection, recreation, and aesthetic experiences. Cultural ecosystem services are
among the most challenging of services to address since they comprise complex
ecological and social properties and interactions.
Extra abiotic environmental services. — Abiotic resources are all products
not from living plants and animals, like minerals, fossil fuels, windand. In build-
ing our classification, we have decided to consider two types of abiotic services
(raw abiotic materials and abiotic energy sources) due to their importance when
considering.15
Raw abiotic materials include mainly extraction of sand & gravel. Globally,
between 47 and 59 billion tonnes of material is mined every year, of which sand
15Some previous ecosystem service classification have excluded abiotic resources based on the groundthat they were usually non-renewable and/or they cannot be attributed to specific ecosystems (de Groot,Wilson, and Boumans 2002).

13
and gravel, hereafter known as aggregates, account for both the largest share
(from 68% to 85%) and the fastest extraction increase (Krausmann, Gingrich,
Eisenmenger, Erb, Haberl, and Fischer-Kowalski 2009).
Abiotic energy sources corresponds to the production of renewable abiotic en-
ergy. Mekonnen and Hoekstra (2012) indicate that hydropower accounts for about
16% of the world’s electricity supply.
D. Valuating ecosystem services provided by lakes at the large scale
Research on the monetary valuation of ecosystem services dates back to the
early 1960s but received wide attention with the publication of Costanza, d’Arge,
de Groot, Farberk, Grasso, Hannon, Limburg, Naeem, O’Neill, Paruelo, Raskin,
Suttonkk, and van den Belt (1997). Surprisingly, whereas an important number
of valuation case studies have been published for lakes ecosystem services (see
following sections), it is quite difficult find some aggregated values at world-wide
level. There are however a few exceptions.
Costanza, d’Arge, de Groot, Farberk, Grasso, Hannon, Limburg, Naeem, O’Neill,
Paruelo, Raskin, Suttonkk, and van den Belt (1997) have estimated the world-
wide economic value of 17 ecosystem services for 16 biomes. They report world-
wide average value for lake and rivers equal to $8,498 per hectare and per year,
64% of this value being provided by the water regulation service.
Another exception is TEEB (2010). Appendix C of this book gives the results of
an analysis of 11 main biomes/ecosystem-complexes (i.e. open ocean, coral reefs,
coastal systems, coastal wetlands, inland wetlands, rivers & lakes, tropical forests,
temperate & boreal forests, woodlands, grasslands and polar & high mountain
systems) and collate their monetary values from different socio-economic con-
texts across the world. For the rivers & lakes biomes, the total monetary value
of the potential sustainable use of all services varies between 1.779 and 13.488
Int.$/ha/year-2007 value. One should however point out that this average value
has been computed based on only 12 points taken from 6 distinct studies.
14
III. Meta-database
We propose to use a meta-analysis as a means to estimate benefit functions that
synthesize information from multiple primary studies having valuated ecosystem
services provided by lakes and reservoirs. We will focus our attention on cultural
services, and within this category more specifically on recreational services.
A. Search protocol
The scientific references have been selected through systematic searches of the
keywords Valuation and Lake, Value and Lake, Willingness to pay or WTP and
Lake, Stated preferences and Lake, on various search engines and on the web sites
of major publishers of academic journals (Scopus, Science Direct, Wiley, Web of
knowledge, RepEc, AgEconSearch, etc.). Similar searches were also conducted on
databases specialized in environmental valuation.16 Lastly, the grey literature was
searched using various search engine including Google Scholar and Science.gov.17
In all, the literature search process took about six months (December 2013 – May
2014).
A three-step procedure has been implemented for each search. Based on the
abstract, studies have been first classified into three categories namely irrelevant
(studies without any reference to one or several lakes or those which did not re-
port any economic valuation results), potentially relevant and relevant. Irrelevant
studies where disregarded at this first step. Second, further investigations were
then conducted on potential relevant studies in order to reclassify them either as
irrelevant or relevant. Third, all studies considered as relevant were downloaded
and an additional screening process was conducted to decide if they had to be
included or not in the final database.18
16We have in particular considered the Environmental Valuation Reference Inventory, the databaseof valuation studies in Southeast Asia, the Nordic Environmental Valuation Database and the GreekEnvironmental Valuation Database.
17This is important to reduce the influence of a potential publication bias in the metaregression analysisbut it implies further search efforts.
18As an example we provide some information on the search with SCOPUS, the largest abstract and

15
Figure 1. Type of study in the meta-analysis
5
11
2
1
92
2
0 20 40 60 80 100frequency
Working paper
Report
Phd Thesis
Other
Journal
Book
The selection procedure led us to retain 101 studies. A vast majority of the
database is made of peer-reviewed articles (86 studies), the second category the
most represented being institutional reports (9 studies).
Studies are quite recent on average. Among the 98 studies of the database,
39 have been published after 2010, 41 between 2000 and 2010 and the remaining
before 2000.
All continents are represented in our database, with an over-representation of
North-America. North-America ranks first with 61 studies (60 studies deal with
United States). The second continent the most represented is Europe with 20
studies. As already mentioned, United States are by far the country for which
we have the most of studies. This may result from a selection bias since our
systematic searches for lake valuation study has been done in English. It may
also reflect the fact that hedonic price approaches have been extensively used in
this country for valuing housing amenities. We will come back to this issue of
citation database of research literature. The first stage of the search resulted in selecting 95 studies (thedomain was restricted to documents in economics or in Social Sciences). Based on the abstract, 44 wereclassified as irrelevant, 13 as potentially relevant and 38 as relevant. After having downloaded the 13potentially relevant studies, only 1 was reclassified from potentially to relevant. The 45 relevant articleswere then downloaded and carefully examined. Following this third screening step, only 31 studies fromthe SCOPUS search have been kept and included in the final database. A similar method has been usedfor other search engines.

16
Figure 2. Repartition of studies per country
642
11
33
23
13
122
12
111
101
31
31
0 20 40 60frequency
United StatesTurkey
ScotlandPolandNorway
New ZealandNetherlands
JapanItaly
IndiaGreece
GermanyFranceFinland
EthiopiaEstonia
EnglandCzech Republic
ChinaChile
CanadaCameroon
AustraliaArmenia
Figure 3. Repartition of observations per country
36526
12
5525
1019
21098
1553163
198
181
144
0 100 200 300 400frequency
United StatesTurkey
ScotlandPolandNorway
New ZealandNetherlands
JapanItaly
IndiaGreece
GermanyFranceFinland
EthiopiaEstonia
EnglandCzech Republic
ChinaChile
CanadaCameroon
AustraliaArmenia

17
sample representativeness in the discussion section.
A given study main report multiple lake values, either because several lakes are
considered or because of use of several valuation methods or scenarios. Due to
multiple values per studies, we have then 563 observations (i.e. lake value) in our
final sample. This represents on average a little bit more than 5.5 observations
per study. Again, United States rank first with 338 observations. They are
followed by Norway (54 observations), Finland (23 observations) and China (22
observations).
B. Description of water bodies
One critical issue when conducting a meta-analysis is the high level of hetero-
geneity and the potentially non-comparability of studies pooled in the metadata.
As a good practice, studies included in the meta-analysis should satisfy a criterion
of minimal consistency for the dependent variable across observations, (Smith and
Pattanayak 2002). This commodity consistency criterion requires in particular a
minimal level of uniformity for the definition of the good that is valued. In our
metadata, the way lakes have been defined varies significantly from one primary
study to another. For instance, some studies refer to a particular lake whereas
others consider all water bodies in a given area. Some studies focus on artificial
lakes whereas other deal with natural ones. All these lake characteristics should
be introduced as moderators in the meta-analysis in order to insure a minimal
level of uniformity for the good valued.
In a vast majority of cases, values are reported for a specific lake. We have
in our meta-database 170 distinct lakes for which, on average, a little bit more
than 3 values are reported. This means that we have mainly in our database a
collection of local valuation studies, which is relevant from the point of view of
conducting a meta-analysis.
Lake can be either natural or artificial, and this distinction may matter since
ecosystem services differ according to this two categories of lakes. Most of the

18
Figure 4. Location and number of observations per lake
!!!!!!!!!!!!!!!!
!
!
!
!
!
!
!
!
!
!
!
!
!
!
!
!
!
!
!
!
!
!
!
!
!
!
!
!
!
!
!
!
!
!
!
!
! !
!
!
!
!
! !
!
!
!
!
!!
!
!
!
!
! !
!
!
!
!
! !
!
!
!
!
! !
!
!
!
!!
! !
!
!
!
!
!!
! !
! !
!
!!
!
!
!
!
!!
!
!
!
!
!
!
!!
!
!
!
!
! !!
!
!
!
!
!!
!
!
!
!
!
!
!!
!
!!
!
!
!
!!
!!
!
!
!
!
! !!
!!
!
!
!
!!
!!
!
!
!
!
!
!
!!
!! !
!
!
!
!!!
!
!
!
!
!
!
!
!
!
!
!
!!
!
!
!
!
!
!
!!!
!
!
!
!
!
!!
!
!
!
!!
!
!
!!
!
!
!
!
!!
!
!
!!!
!
!
!
!
!
!
!!
!
!
!
!!
!
!
!!
!
!
!
!
!!
!
!
!!!
!
!
!
!
!
!
!
!!
!
!
!
!!!
!
!!
!!
!
!
!
!
!!
!
!
!!!!
!
!
!
!
!
!
!
!!
!
!
!
!
!
!!
!
!
!
!!
!!!
!
!
!
!
!
!!
!
!
! !!!
!
!
!
!
!! !
!
!
!
!!
!
!
!
!
!
!
!
!
!
!!
!
!!
!
!
!
!
!
!!
!
!
!
!!
!
!!
!
!
!
!
!
! !
!!
!
!
!
!!
!
!! !
!
!
!
!
!!
!
!
!
!
!
!
!
!
!
!
!!
!
!!
!
!
!!
!!!
!
!
!
!!
!
!
!
!!
!
!
!
!!
! !
!!!
!
!
!
!
!!
!
!
!! !!! ! !
!
!
!
!
!
!!
!
!
!
!!
!
!
!
!
!
!
!
!!
!
!!!
!
!
!
!
!
!
!
!
!
!
!!
!
!
!
!
!
!
!
!
!
!
!
!
!!
!
!
!
!
!
!!!!
!
!!
!
!!! !
!
!
!
!
!!
!
!
!!! !!
!
!! ! !
!
!
!
!
!
!!
!
!
!
!
!
!
!
!
!
!
!
!
!
!
!
!
!
!!
!
!
!
!
!!
!!!
!
!
!
!
!
!
!
!!
!
!
!
!
!!
!
!!
!
!
!
!
!
!
!
!
!
!
!
!
!!
!
!
!
!!
!
!
!
!
!
! !!!
!
!
!!
!
! !!
!
!!!!!
!
!
! !
!
!
!
Obs per studyNum
! 1 - 4
! 5 - 9
! 10 - 15
! 16 - 22
! 23 - 29
! 30 - 37
! 38 - 45
! 46 - 52
lake values have been obtained for natural lakes (405 observations). An artificial
lake is considered for 126 observations whereas for 33 observations both natural
and artificial lakes are included in the valuation exercise (which is conducted in
that case either at a regional or a national level).
When restricting our sample to local lake valuation studies, the average area
of each lake is equal to 5014 km2, varying from 0.02 km2 (Raintree Ranch lake
in Arizona, United States) to 58000 km2 (lake Michigan, United States). The
median lake area is 33 km2 which suggests a very skewed distribution of the lakes
in our sample. If we exclude Lake Michigan for the sample (Lake Michigan is by

19
far the greatest lake in our sample in terms of area), the average area drops to
722 km2, and to 146 km2 if other Great Lakes are taken out. In Figure 5, we
gives the distribution of observations per lake area (restricting our sample to local
lakes).
Figure 5. Repartition of observations per area of the lake
184
200
188
57
0 50 100 150 200frequency
>1000 km2
[20,1000[ km2
[1,20[ km2
< 1 km2
It should be noticed that, when possible, lakes in our database have been geo-
referenced with ArcGIS. This will allow us to add some spatially explicit con-
text variables (such as anthropogenic pressure, climate conditions or GDP in the
considered area) to be accounted for in the meta-regression model. Spatially-
augmented data have been used for a meta-analysis in particular by (Ghermandi,
van den Bergh, Brander, de Groot, and Nunes 2010, Ghermandi and Nunes 2013).
In addition and in order to get additional information on lakes in our database
(type of use, shape, shoreline length, etc.), we have complemented our data with
lake attributes taken from two global lake and reservoir databases, namely the
Global Lakes and Wetlands Database (GLWD)19 and the Global Reservoir and
19The GLWD compiles worldwide data on lakes and reservoirs with an extensive list of attribute foreach. We have used the first level (GLWD–1) which comprises the 3067 largest lakes (area greater than50 km2) and 654 largest reservoirs (storage capacity greater than 0.5 km3) worldwide. The GLWD isjointly developed by WWF and the Center for Environmental Systems Research, University of Kassel inGermany.

20
Dam Database (GRanD)20
C. Valuation methods
An additional consideration for any meta-analysis of nonmarket values is the
degree of consistency in welfare measures (Johnston and Rosenberger 2010).21
In our case, lake value measures have been obtained from the primary studies
through various valuation methods and analytical techniques including travel cost,
choice experiment, contingent valuation and hedonic price methods. This raises
some welfare consistency concern since the measures obtained may not rely on
the same theoretical construct.22
One way to address this issue consists in pooling estimates drawn from the nu-
merous methods (contingent valuation, travel cost, choice experiment, net factor
income, productivity, gross revenue methods, etc.) into a single meta-database
and including dummy variable for the used methods as moderators in the meta-
analysis, see for example (Brander, Beukering, and Cesar 2007). This approaches
still raises some welfare inconsistency concerns, see Nelson and Kennedy (2009).
Another solution adopted by Londono and Johnston (2012) consists in excluding
from the analysis any study which does not comply with a strict application of
the welfare consistency criterion. One drawback of this solution is to exclude de
facto all studies based on methodologies that do not generate well-defined wel-
fare measures (e.g., replacement costs, gross revenues, etc.). There might be also
a selection bias issue if the excluded studies present some systematic character-
istics related to lake values. A third solution consists in estimating separated
meta-regressions for lake values obtained by valuation methods based on differ-
20The GRanD compiles reservoirs with a storage capacity of more than 0.1 km3. it contains 6.862spatially explicit records of reservoirs with their respected dams and gives information on their storagevolume. The development of the GRanD database has been coordinated by the Global Water SystemProject, University of Bonn in Germany.
21Welfare consistency requires that welfare measures represent the same theoretical construct (Smithand Pattanayak 2002).
22It is for instance well-known that contingent valuation and travel cost methods provide Hicksian andMarshallian welfare measures, respectively, so that pooling across these study types violates the strictestform of welfare consistency (Smith and Pattanayak 2002).
21
ent theoretical constructs. This approach however implies to have a sufficient
number of observations for each sub-sample considered. In what follows, we will
implement these three strategies to address this welfare consistency issue.
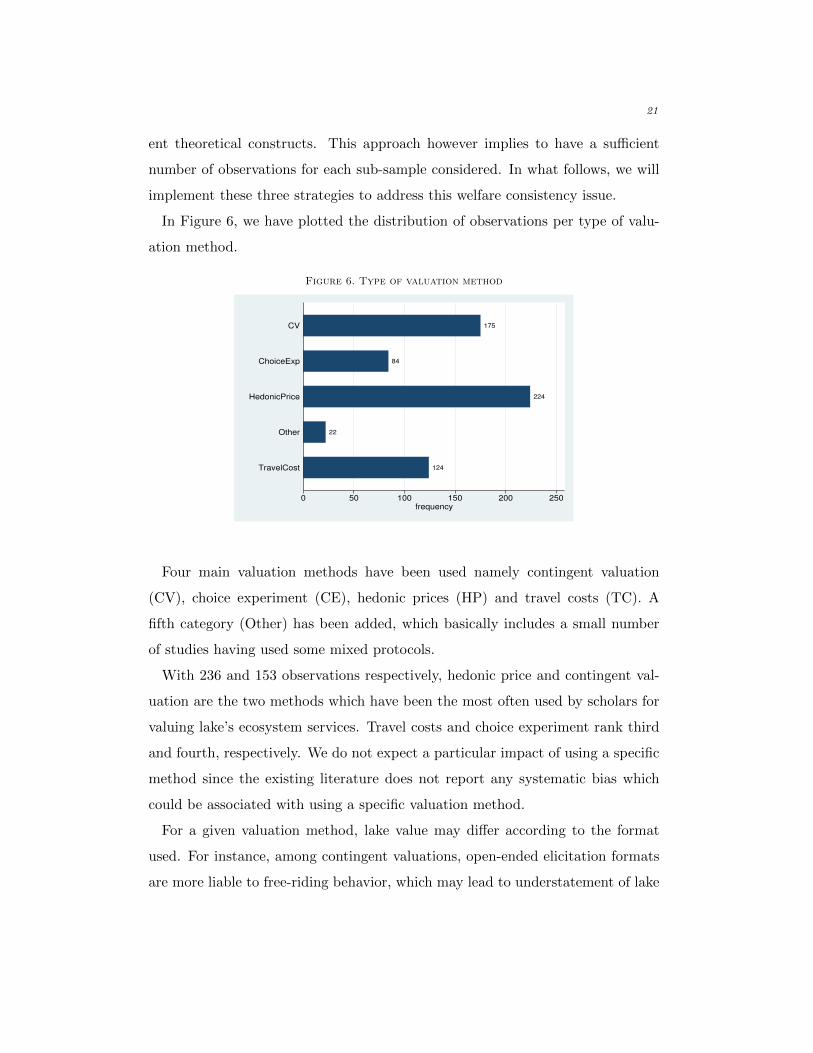
In Figure 6, we have plotted the distribution of observations per type of valu-
ation method.
Figure 6. Type of valuation method
124
22
224
84
175
0 50 100 150 200 250frequency
TravelCost
Other
HedonicPrice
ChoiceExp
CV
Four main valuation methods have been used namely contingent valuation
(CV), choice experiment (CE), hedonic prices (HP) and travel costs (TC). A
fifth category (Other) has been added, which basically includes a small number
of studies having used some mixed protocols.
With 236 and 153 observations respectively, hedonic price and contingent val-
uation are the two methods which have been the most often used by scholars for
valuing lake’s ecosystem services. Travel costs and choice experiment rank third
and fourth, respectively. We do not expect a particular impact of using a specific
method since the existing literature does not report any systematic bias which
could be associated with using a specific valuation method.
For a given valuation method, lake value may differ according to the format
used. For instance, among contingent valuations, open-ended elicitation formats
are more liable to free-riding behavior, which may lead to understatement of lake

22
values. Such value estimates likely lie below those obtained with other elicitation
formats such as payment card and dichotomous choice. Among the 153 observa-
tions based on contingent valuations, 72 use a dichotomous choice format (either
single or double-bounded), 44 a payment card format, 31 an open-ended format
and 6 an iterative bidding approach. The valuation format will be included as a
moderator in the meta-analysis.
D. Ecosystem services provided by lakes
Different ecosystem services have been valued in the literature we have sur-
veyed, although not all of the services identified in Table 1 have been valued
(e.g., carbon sequestration or erosion prevention). In total, we have gathered
some economic values for 11 different ecosystem services provided by lakes ap-
pearing in our database, see Figure 7.
Figure 7. Lake ecosystem services in the valuation studies
20
179
228
199
145
33
174
158
240
26
13
0 50 100 150 200 250frequency
ESS_Spiritual
ESS_PopHabitat
ESS_Amenity
ESS_UnspecRec
ESS_Sightseeing
ESS_Camping
ESS_Boating
ESS_Swiming
ESS_Fishing
ESS_DrinkWater
ESS_Flood
For each lake valuation study (or for each observation in case of multiple ob-
servations par study) we have identified the ecosystem services provided by the
considered lake. They belong to three categories of ecosystem services (provision-
ing services, regulation and maintenance services, cultural services ).

23
We have only 22 observations of economic values for provisioning services and
all these observations correspond to the “water for drinking service”.
We have 174 observations of economic values for regulation and maintenance
services. The majority (163 observations) refers to the “maintaining populations
and habitats” services (ESS PopHabita), whereas the remaining observations
deal with the “flood protection” service (ESS Flood).
Not surprisingly, the vast majority of ecosystem services for which a lake value
is associated with corresponds to the cultural service category. In order to reflect
the distinctions that are generally made between cultural services of lakes in the
valuation literature, we have categorized these services in our database slightly
differently from the list in Table 1. In particular, the “recreation service” has
been split into several sub-services (e.g., fishing, boating, swimming, camping,
sightseeing and unspecified recreational service). In addition, the “Amenity”
sub-service has been created for valuation studies based on the hedonic price
approach.23 Among the cultural service category, the “amenity service” ranks
first (244 observations for ESS Amenity) followed by the different recreational
services such as “fishing” (192 observations for ESS Fishing) or “boating” (144
observations for ESS Boating).
Some studies value only one particular lake ecosystem, but a significant num-
ber of them provides values for two or more services, Figure 8. The number of
ecosystem services valued in each study varies from 1 to 7, with an average a lit-
tle bit higher than 2. This raises an interesting identification issue since in most
cases a direct mapping between a particular service and its associated economic
value does not exist. This identification issue might be particularly relevant to
address in case of complementarity or substitutability relationships among ser-
23As explained in (Lansford and Jones 1995), an hedonic study of shoreline and “near-the-lake” prop-erties capture an important component of the recreational and “amenity” (aesthetic) values that areprovided by the existence of such a lake. There is however no direct mapping between these amenitiesand the cultural service category as defined in Table 1. In fact to obtain the total recreational andaesthetic value, other components must be added to the value of amenities. These include the value topersons living outside the immediate area who travel to the lake to enjoy its benefits and componentsfor existence, bequest, and option value by those who never visit the lake yet believe it to be beneficial.

24
Figure 8. Number of ecosystem services valued in each study
12
61
47
38
19
69
383
0 100 200 300 400frequency
7
6
5
4
3
2
1
vices. Indeed, in all previous meta-analysis on water ecosystem services, it has
been assumed that the economic value of a water body is a linear function of the
ecosystem services provided by a lake.24 We argue that such a specification could
be questioned in case of trade-offs, synergies and antagonisms between ecosystem
services. Since there are complex relationships among ecosystem services (Fu, Su,
Wei, Willett, L, and Liu 2011, Raudsepp-Hearne, Peterson, and Bennett 2010)25,
the value for a specific ecosystem services might depend upon the other ecosys-
tem services provided by a lake. Not introducing interactions across ecosystem
services may then lead to biased estimates in the meta-analysis. It also raises
some concerns with respect to using a “value catalog approach” for doing some
transfer of values for ecosystem services.
24In existing meta-analyses, ecosystem services are accounted for by a set of binary variables indicatingthe ecosystem services valued (Brander, Bruer, Gerdes, Ghermandi, Kuik, Markandya, Navrud, Nunes,Schaafsma, Vos, and Wagtendonk 2012). In their meta-analysis of values of natural and human-madewetlands, (Ghermandi, van den Bergh, Brander, de Groot, and Nunes 2010) estimate an extended modelthat includes a series of cross-effect variables. These variables capture the relationship between theprovision of a specific wetland service and the type of wetland that provides it, but not the relationshipsamong services.
25In their analysis of provision of multiple ecosystem services across landscapes, Raudsepp-Hearne,Peterson, and Bennett (2010) report that among the 66 possible pairs of ecosystem services they haveconsidered, 34 pairs have appeared to be significantly correlated either positively (synergies and comple-mentarities) or negatively (tradeoffs). At the landscape scale, they typically observe a pattern of tradeoffsbetween provisioning ecosystem services and both regulating and cultural ecosystem services. On con-trary they document synergies across regulating ecosystem services, all regulating ecosystem servicesbeing positively correlated with each other.
25
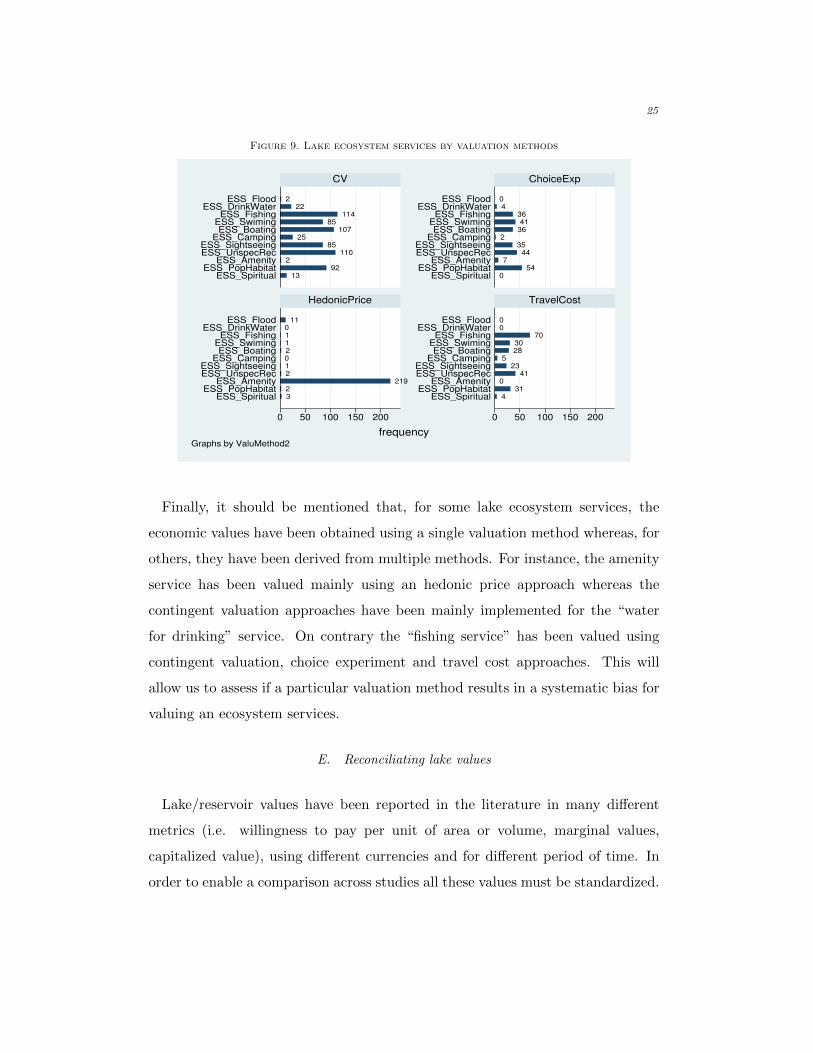
Figure 9. Lake ecosystem services by valuation methods
1392
2110
8525
10785
11422
2
054
744
352
3641
3640
32
2192102110
11
431
041
235
2830
7000
0 50 100 150 200 0 50 100 150 200
ESS_SpiritualESS_PopHabitat
ESS_AmenityESS_UnspecRecESS_Sightseeing
ESS_CampingESS_Boating
ESS_SwimingESS_Fishing
ESS_DrinkWaterESS_Flood
ESS_SpiritualESS_PopHabitat
ESS_AmenityESS_UnspecRecESS_Sightseeing
ESS_CampingESS_Boating
ESS_SwimingESS_Fishing
ESS_DrinkWaterESS_Flood
ESS_SpiritualESS_PopHabitat
ESS_AmenityESS_UnspecRecESS_Sightseeing
ESS_CampingESS_Boating
ESS_SwimingESS_Fishing
ESS_DrinkWaterESS_Flood
ESS_SpiritualESS_PopHabitat
ESS_AmenityESS_UnspecRecESS_Sightseeing
ESS_CampingESS_Boating
ESS_SwimingESS_Fishing
ESS_DrinkWaterESS_Flood
CV ChoiceExp
HedonicPrice TravelCost
frequencyGraphs by ValuMethod2
Finally, it should be mentioned that, for some lake ecosystem services, the
economic values have been obtained using a single valuation method whereas, for
others, they have been derived from multiple methods. For instance, the amenity
service has been valued mainly using an hedonic price approach whereas the
contingent valuation approaches have been mainly implemented for the “water
for drinking” service. On contrary the “fishing service” has been valued using
contingent valuation, choice experiment and travel cost approaches. This will
allow us to assess if a particular valuation method results in a systematic bias for
valuing an ecosystem services.
E. Reconciliating lake values
Lake/reservoir values have been reported in the literature in many different
metrics (i.e. willingness to pay per unit of area or volume, marginal values,
capitalized value), using different currencies and for different period of time. In
order to enable a comparison across studies all these values must be standardized.

26
As explained by Ghermandi et al. (2010) or by Londono and Johnston (2012),
the standardization of different and heterogenous metrics used to value ecosystem
services is a difficult and controversial task. We explain here how ecosystem
services values from the original studies have been normalized.
Accounting for heterogeneity in space and in time . — In our meta-database,
lake/reservoir values have been obtained for different countries (21 countries) and
for different period of time (from 1957 to 2012). This requires some normal-
ization procedures. First, to account for differences in purchasing power among
countries, a purchasing power parity indexes has to be used. Following Gher-
mandi et al. (2010), differences in purchasing power among countries have been
accounted for by using the purchasing power parity (PPP) index provided by the
PennWorld Table. As a result, all currency have been converted in USD PPP.
Second, the problem of having different years of observation is usually solved by
using appropriate price deflators, see Ghermandi and Nunes (2013) for a recent
example. Values reported for price levels other than 2010 have been converted
using national customer price indexes (CPI) provided by International Monetary
Fund (World Economic Outlook 2014). As a result, all ecosystem services values
are computed on an annual basis and they have been expressed in 2010 US$.
Similar transformations have been done for the other economic variables to be
used in the meta-regression (household income for example).
Applying the commodity and welfare consistency principles. — Based on
the requirement to work on estimates satisfying both the property of commodity
consistency for the dependent variable across observations and the property of
consistency of the welfare measure, we have decided to split our meta-dataset
into two sub-samples. The first sub-sample will include all observations for which
lake values have been obtained by an hedonic price approach. The second sub-
sample include all other remaining observations.

27
Normalized lake value for hedonic price studies. — Restricting the sub-
sample to hedonic price studies is a way to satisfy the requirement of working
on quite homogenous data in terms of good valued and welfare measure. Indeed,
the good which is valued is well identified (a property sold on a market) and,
under some assumptions on the functioning of the property market, the implicit
marginal price obtained from hedonic price studies is directly related to a measure
of consumer welfare. One specific issue with hedonic price studies is that they
give a capitalized value whereas the other valuation methods typically provide a
value estimate per unit of time. Additional data management is then required
for making estimates obtained with these different methods more comparable. In
our case, the capitalized values obtained from hedonic price studies have been
annualized assuming constant value per year, using the 30-year fixed mortgage
rate as a discount factor (for the year of the study) and considering a 30-year time
horizon.26 In our meta-analysis all values obtained from hedonic price studies have
then been normalized and expressed in monetary units per sold property and per
year.
Normalized lake value for other valuation studies. — Lake values reported
in studies which are not based on an hedonic price approach are expressed in very
different metrics including monetary units per unit of lake area per unit of time
or monetary value per household/person/trip per unit of time. Rationalizing the
use of a normalized is quite difficult is this case.
Some previous studies have used a normalized value expressed in monetary
units per unit of area per unit of time Woodward and Wui (2001), Ghermandi
et al. (2010), Brander et al. (2012), Ghermandi and Nunes (2013). When an
aggregated value for the investigated ecosystems is provided in the primary study,
26A similar procedure has been used by Woodward and Wui (2001) or Ghermandi and Nunes (2013)using the discount factors provided directly in the studies (or a 6% rate in the two studies in Woodwardand Wui (2001) that did not state any discount rate). In the empirical analysis we will test the robustnessof our annualization procedure, in particular by considering other time horizons (20 or 25 years).

28
such a normalization procedure is easy to implement.27 When no aggregated value
is provided, the study must be disregarded.
This is why some meta-analysis of ecosystem service values have excluded stud-
ies in which values are estimated per unit of area (Londono and Johnston 2012).
In that case values are usually expressed in monetary units per visit per unit of
time (Brander, Beukering, and Cesar 2007, Johnston and Rosenberger 2010) or
in monetary units per household/respondent per unit of time (Brouwer, Lang-
ford, Bateman, and Turner 1999, Johnston, Besedin, Iovanna, Miller, Wardwell,
and Ranson 2005, Johnston, Ranson, Besedin, and Helm 2006, Londono and
Johnston 2012, Ge, Kling, and Herriges 2013). We have opted for this later
normalization procedure and expressed all the values from primary studies in
monetary units per household/respondent per year. In some cases, the reported
primary study results needed to be adapted to fit the required format. For ex-
ample, values per person/visit were to be transformed into values per person
per year using data on number of visit/duration of visit. Such adjustments are
required to reconcile variable definitions across sites (commodity consistency re-
quirement), and are nearly universal in valuation meta-analyses (Johnston and
Rosenberger 2010, Nelson and Kennedy 2009).
As discussed above, it is clear that not all values reported within this category
rely on the same theoretical construct. This is for instance the case for contingent
valuation and travel cost methods which provide Hicksian and Marshallian wel-
fare measures. The welfare requirement issue will be discussed in the empirical
analysis.
A preliminary view of lake values. — For studies using an hedonic price
approach, we find a mean value of a lake equal to 769 USD$2010 per property per
year. The median value is 215 USD$2010 per property per year, showing that the
27It simply requires to divide the total value of the ecosystem by its area. Notice however thatthe methods for computing the aggregated value of ecosystems might differ from one primary study toanother. This may raise some concerns with respect to the commodity consistency requirement.

29
distribution of values is skewed with a long tail of high values. For other studies
(i.e studies not relying on an hedonic price approach), we find an annual value of
a lake equal to 348 USD$2010 per respondent and per year with a median value
equal to 106 USD$2010 per respondent and per year. A first result is that hedonic
price studies result in significantly higher lake values, compared to studies using
other valuation methods.
It might be interesting to compare the mean lake values obtained from our meta-
database with those obtained form similar/comparable meta-analysis. Brouwer,
Langford, Bateman, and Turner (1999) have conducted a meta-analysis for the
use and non-use values generated by wetlands across North America and Europe.
On average, the values we find for ecosystem services provided by lakes are higher
than the ones reported by Brouwer, Langford, Bateman, and Turner (1999) for
wetlands. Their average willingness to pay for wetland function preservation
found in all studies taken together is 134 USD$2010 per respondent and per
year.28 The median is considerably lower, namely 74 USD$2010 per respondent
and per year.
We discuss now the breakdown of lake values according to a number of possible
explanatory factors. Mean lake values have been calculated (1) by countries, (2)
by lake size classes and (3) by ecosystem services. Results are presented separately
for studies using an hedonic price approach and for studies using another type of
valuation method.
Figure 10 presents the mean annual value of lakes per country (in USD$2010 per
property per year for studies using an hedonic price approach and in USD$2010
per respondent per year for studies using another type of valuation method).
When considering hedonic price studies, United States rank first with a mean
annual value of lakes per property equal to 816 USD$2010. The following countries
in terms of values are Finland, Ireland Canada and Netherlands with 552, 543, 387
28The willingness to pay in Brouwer, Langford, Bateman, and Turner (1999) is expressed in Interna-tional Monetary Fund’s Special Drawing Rights for 1995. It has been converted in USD$2010 using anappropriate discount factor (US CPI).

30
Figure 10. Mean annual value of lakes per country and per valuation method
0 200 400 600 8002010 USD PPP
United StatesTurkey
ScotlandPolandNorway
New ZealandNetherlands
JapanItaly
IndiaGreece
GermanyFranceFinland
EthiopiaEstonia
EnglandCzech Republic
ChinaChile
CanadaCameroon
AustraliaArmenia
LakeValueHedonic LakeValueOther
and 284 USD$2010, respectively. When considering studies using another type of
valuation method, Switzerland ranks first with a mean annual value of lakes per
respondent equal to 765 USD$2010. The following countries are France, United
States and Australia. For countries where lake values are available both with an
hedonic price approach and with another valuation approach (i.e. China, England,
Finland, Netherlands, United States), we observed some significant differences
across lake values by method of valuation. This indicates that the valuation
method used in the primary study is likely to have an impact.
Another lake characteristic that we may expect to determine its value is its
size (area). There is no clear a priori expectation of the sign of this relation-
ship given on the one hand that there may be diminishing marginal returns to
most lake services as lake size increases, but on the other hand some ecological
functions require minimum thresholds of habitat area which suggests that lake
values may increase with size, see (Brander, Florax, and Vermaat 2006). For he-
donic price studies, no monotonic relationship seems to emerge between the lake
31
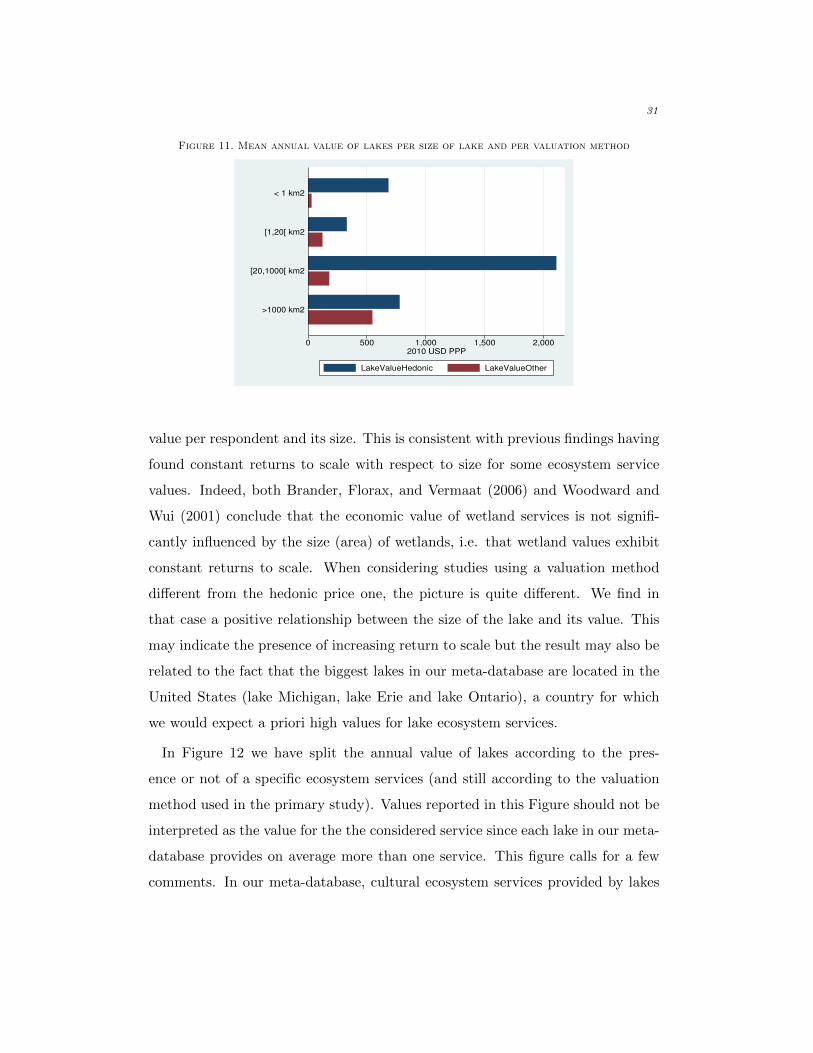
Figure 11. Mean annual value of lakes per size of lake and per valuation method
0 500 1,000 1,500 2,0002010 USD PPP
>1000 km2
[20,1000[ km2
[1,20[ km2
< 1 km2
LakeValueHedonic LakeValueOther
value per respondent and its size. This is consistent with previous findings having
found constant returns to scale with respect to size for some ecosystem service
values. Indeed, both Brander, Florax, and Vermaat (2006) and Woodward and
Wui (2001) conclude that the economic value of wetland services is not signifi-
cantly influenced by the size (area) of wetlands, i.e. that wetland values exhibit
constant returns to scale. When considering studies using a valuation method
different from the hedonic price one, the picture is quite different. We find in
that case a positive relationship between the size of the lake and its value. This
may indicate the presence of increasing return to scale but the result may also be
related to the fact that the biggest lakes in our meta-database are located in the
United States (lake Michigan, lake Erie and lake Ontario), a country for which
we would expect a priori high values for lake ecosystem services.
In Figure 12 we have split the annual value of lakes according to the pres-
ence or not of a specific ecosystem services (and still according to the valuation
method used in the primary study). Values reported in this Figure should not be
interpreted as the value for the the considered service since each lake in our meta-
database provides on average more than one service. This figure calls for a few
comments. In our meta-database, cultural ecosystem services provided by lakes

32
Figure 12. Mean annual value of lakes per ecosystem services and per valuation method
0 1,000 2,000 3,000 4,0002010 USD PPP
Flood
0 1,000 2,000 3,000 4,0002010 USD PPP
DrinkWater
0 1,000 2,000 3,000 4,0002010 USD PPP
Fishing
0 1,000 2,000 3,000 4,0002010 USD PPP
Swiming
0 1,000 2,000 3,000 4,0002010 USD PPP
Boating
0 1,000 2,000 3,000 4,0002010 USD PPP
Camping
0 1,000 2,000 3,000 4,0002010 USD PPP
Sightseeing
0 1,000 2,000 3,000 4,0002010 USD PPP
UnspecRec
0 1,000 2,000 3,000 4,0002010 USD PPP
Amenity
0 1,000 2,000 3,000 4,0002010 USD PPP
PopHabitat
0 1,000 2,000 3,000 4,0002010 USD PPP
Spiritual
LakeValueHedonic LakeValueOther

33
are highly valued. This is particularly true for the “spiritual and symbolic ap-
preciation” and for the “amenity” services. Interestingly, the two regulation and
maintenance services in our meta-database (i.e. “flood protection” and “maintain-
ing populations and habitats”. this is quite consistent with previous findings on
wetland ecosystem services. Indeed, in their meta-analysis of values for wetland
ecosystem services, Brouwer, Langford, Bateman, and Turner (1999) report that
the wetland function which generates the highest value is flood control, followed
by wildlife habitat provision and landscape structural diversity. More recently,
Brander, Florax, and Vermaat (2006) also report high values for biodiversity,
amenity and flood protection services of wetlands.29
IV. Meta-analysis specification and results
The above analysis of the available data in the lake valuation literature does
not allow for interactions between the various potential explanatory variables. In
order to attain marginal effects – given the interference of potentially relevant
intervening characteristics – we will use a meta-regression analysis to assess the
relative importance of all potentially relevant factors simultaneously.
A. Non-independence of estimates from primary studies
The non-independence of estimates from primary studies has been recognized
has a crucial methodological issue in the meta-analysis literature, Nelson and
Kennedy (2009). There are two main reasons why primary estimates may not be
independent of one another.
The most common one is the use by researchers of multiple estimates from the
same primary study, which implies within-study autocorrelation. Within-study
correlation is usually not the most difficult problem to solve. One simple way
to address this issue is the use of regression weighting observations (generalized
29Brander, Florax, and Vermaat (2006) indicate for instance an average annual value equal to 17000US$ for the biodiversity service of wetlands.

34
least-squares) in which each study in the data set receives equal weight, instead
of each observation as in ordinary least squares (Ghermandi, van den Bergh,
Brander, de Groot, and Nunes 2010). Another common treatment consists in
selecting a single observation per primary study. In their review of meta-analysis
in environmental economics, Nelson and Kennedy (2009) indicate that the most
common treatment for data dependencies or correlation is the use of a single
observation per primary study (30 studies over a total of 140 studies reviewed).
A second reason is that the primary studies (from which primary estimates are
taken from) may not be independent of each other, which implies between-study
autocorrelation. Nelson and Kennedy (2009) mentions several potential sources
for between-study correlation: (1) some primary studies may utilize the same
data sources or may have conducted on the same area, (2) the analyst may apply
a similar adjustment to the primary data, (3) some primary studies may share
an unobservable characteristic such as similar management of an environmental
commodity at different locations, or (4) several primary studies may share an
observable characteristic, such as an identical functional form, omission of a key
explanatory variable, or data drawn from the same study location.
There are various ways to address the issue of between-study correlated observa-
tions. A first solution consists in using specific panel data models, see Rosenberger
and Loomis (2000). A second approaches is to rely on a multilevel modelling ap-
proach (MLM) which allows the regression coefficients to vary randomly across
groups, creating composite errors see Brouwer, Langford, Bateman, and Turner
(1999), Bateman and Jones (2003), Londono and Johnston (2012) among others.
It should be stressed that the random-effect model for panel data matches the
multilevel model with random intercept commonly used in this literature. Its
estimation via panel-data software produces results that are virtually identical to
its estimation using hierarchical/multilevel software, Nelson and Kennedy (2009).
This is the approach we have chosen to follows here.
35
B. Empirical specification and estimation strategy
The dependent variable in our regression equation is is the natural logarithm
lake values in USD per year in 2010 prices, labelled ln y. The explanatory variables
are grouped in different matrices that include the ecosystem services provided by
the lake (with potential interactions across ecosystem services) in ES, the water
body characteristics in Xb (i.e., type of water body, size of water body, etc.),
the study characteristics in Xs (i.e., survey method, payment vehicle, elicitation
format, etc.) and context-specific explanatory variables in Xc.
There are two popular panel-data models which can be used for estimating
the meta-regression model, e.g. the fixed-effect model and the random-effects
model. The crucial difference between these two models lies on the assumptions
used to define the error variance. In the fixed-effect model it is assumed that all
studies included in the meta-analysis share a common true effect size, differences
in observed effects arise only due to sampling error. However because studies
commonly differ in implementation and underlying population, among others,
the assumption of the fixed-effect model is often implausible. The random-effects
model allows the true effect size to differ from study to study and this is the
approach we have chosen to follows here. The base meta-analytical regression
model is specified as follows:
(1) ln yij = α+ γESij + βbXbij + βsXs
ij + βcXcij + µi + εij
where the subscript i takes values from 1 to the number of studies and subscript
j takes values from 1 to the number of observations, α is the constant term,
µj is an error term at the second (study) level, εij is an error term at the first
(observation) level and the vectors βb, βs, βc, γ contain coefficients to be estimated
by the model on explanatory variables inXb, Xs, Xc, ES, respectively. We assume
that µj and εij follow a normal distribution with means equal to zero and that
they are uncorrelated, so that it is sufficient to estimate their variances, σ2µ and

36
σ2ε , respectively.
The first group of moderators, ES, consists in a set of dummy variables rep-
resenting all ecosystem services provided by the lake under consideration (Flood,
DrinkWater, Fishing, Swimming, Boating, Camping, Sightseeing, UnspecRec,
Amenity, PopHabitat, Spiritual). We also include a set of dummy variables
when two ecosystem services are jointly provided by the lake (PopHabitat ×
Fishing, PopHabitat×Swimming, PopHabitat×Boating, PopHabitat×Sightseeing).
The second set of moderators, Xb, include some characteristics of the water
body. Natural is a dummy variable equal to 1 if the water body is natural. In
order to capture a size effect, a set of dummy variables depending on the water
area of the lake has been included. The reference category is lake with a water
area lower than 1 km2.
The third group of moderator variables, Xs, control for specific characteris-
tics of the primary studies. As a proxy for quality of the study, we include
a dummy variable (PeerReviewed) which takes the value of one to distinguish
studies that have been published in refereed journals from those published as
book chapters, dissertations, working papers or conference proceedings. We also
introduce a set of dummy variables depending upon the valuation method used in
the primary study (ChoiceExp,HedonicPrice, T ravelCost,Other), the reference
category being contingent valuation.
The last group of moderator variables Xc, includes some context variable which
were not directly available from the primary studies. GDPcapita gives the GDP
per capita based on annual and country-level figures provided by the World Bank.
Three variables have been introduced to capture water scarcity within the river
basin of each study site (Water Stress, Water Variability and Drought Index).
These variables are based from the GIS datasets developed within the Aqueduc
project. In addition we make use of a GIS to compute a spatially explicit vari-
able (Lakeabundance) representing lake and wetland abundance for each primary
study site. Using the Global Lakes and Wetlands Database we compute the lake
37
and wetland abundance as the share of lake and wetland area within a 100 km
radius. This variable is intended to capture the availability of substitute or com-
plementary sites within the vicinity of each study site.
C. Meta-regression results
As a starting point of the analysis, we provide in Table 2 some estimates of the
meta-analytical models using random-effects approach, for primary studies which
have not used an hedonic price approach (i.e for primary studies relying on choice
experiments, contingent valuation, travel cost and other methods).

38
Table2—
Est
imatesofthemeta-analy
ticalwithrandom-effects–Nonhedonic
pricest
udies
Mod
el1
Mod
el2
Mod
el3
Mod
el4
Mod
el5
Coeff
.S
td.
err.
Coeff
.S
td.
err.
Coeff
.S
td.
err.
Coeff
.S
td.
err.
Coeff
.S
td.
err.
Eco
syst
emse
rvic
es
Flo
od
0.0
61.4
5-0
.49
1.4
50.1
51.3
21.2
71.2
8
Dri
nkW
ate
r1.2
3**
0.5
21.6
4***
0.5
61.0
2*
0.5
31.0
3*
0.5
6F
ish
ing
0.5
8**
0.2
30.1
90.2
8-0
.10
0.2
6-0
.30
0.2
6
Sw
imm
ing
-0.0
80.3
0-0
.49
0.3
8-0
.56
0.3
4-0
.13
0.3
4
Boati
ng
0.4
40.3
10.2
20.3
8-0
.25
0.3
4-0
.26
0.3
3C
am
pin
g0.3
00.3
90.2
50.4
10.3
00.3
70.3
20.3
6
Sig
hts
eein
g1.5
9***
0.3
60.9
1*
0.5
11.0
9**
0.4
80.7
80.4
9
Un
spec
Rec
-0.1
80.2
2-0
.14
0.2
3-0
.19
0.2
10.1
30.2
1A
men
ity
4.5
9***
0.6
54.1
9***
0.6
54.4
9***
0.6
43.5
2***
0.6
4
Pop
Hab
itat
-0.6
0**
0.2
6-1
.65***
0.3
7-1
.77***
0.3
6-1
.54***
0.3
5
Sp
irit
ual
-0.5
20.4
9-0
.68
0.4
9-0
.11
0.4
70.2
20.4
9
Eco
syst
emse
rvic
ein
tera
ctio
ns
Pop
Hab
itat×
Fis
hin
g0.0
60.6
71.0
30.6
31.5
5**
0.6
2P
op
Hab
itat×
Sw
imm
ing
0.8
00.6
80.9
30.6
31.2
4**
0.6
0
Pop
Hab
itat×
Boati
ng
0.4
70.6
31.2
0**
0.5
80.6
80.5
8
Pop
Hab
itat×
Sig
hts
eein
g1.1
8*
0.6
81.5
6**
0.6
60.7
10.6
5
Ch
ara
cter
isti
csof
the
wate
rb
od
y
Natu
ral
-0.9
9***
0.2
7-1
.24***
0.2
8[1,2
0[
km
21.1
3**
0.5
0-0
.17
0.5
5
[20,1
000[
km
20.6
90.5
2-0
.09
0.5
1>
1000
km
20.9
2*
0.5
00.4
20.4
9
Ch
ara
cter
isti
csof
the
stu
dy
Ch
oic
eExp
-0.7
3***
0.2
6-0
.80***
0.2
5H
edon
icP
rice
0.0
0.
0.0
0.
Oth
er-1
.61***
0.4
3-1
.80***
0.4
7T
ravel
Cost
0.4
4*
0.2
30.3
9*
0.2
3P
eerR
evie
w1.6
8***
0.2
71.0
6***
0.2
9
Conte
xt
vari
ab
les
GD
Pca
pit
a0.3
0***
0.1
0
Wate
rst
ress
0.0
5**
0.0
3W
ate
rvari
ab
ilit
y-0
.14
0.4
4D
rou
ght
ind
ex0.0
00.0
2
Lake
ab
un
dan
ce7.0
9***
1.4
4
Con
stant
3.9
7***
0.1
13.0
8***
0.2
03.5
6***
0.2
62.0
7***
0.6
40.1
01.2
5
R-s
qu
are
d0.0
00.2
60.2
90.4
60.5
2N
385.0
0385.0
0385.0
0384.0
0384.0
0
***,
**,
*fo
rsi
gn
ifica
nt
at
the
1,
5,
10
per
cent
level
,re
spec
tivel
y.
39
The results obtained for different specifications of the basic metaregression
model described in Equation (1) are presented in Table 2. For all estimates
in Table 2, a series of diagnostic tests were performed.
Model 1 does not include any explanatory variable. In Model 2, only dummy
variables for the ecosystem services provided are included. The set of explanatory
variable is augmented in Model 3 by added some variables describing interaction
across ecosystem services. In Model 4 we add some variables describing the water
body and the study from which values are obtained. Lastly, context variables
are included in Model 5. After having conducted some specification tests, we
estimate the basic metaregression model described in Equation (1) using a log-
linear specification.
The first model provides an estimation of the average value of a lake per respon-
dent (84 USD$2010 per respondent and per year). The second model provides
some indications on how people value lake ecosystem services. Interestingly, six
ecosystem services (among the eleven specified) appear to be significant namely
drinking water, fishing, sightseeing, amenity, maintenance of populations and
habitats and spiritual or symbolic appreciation. A particular high value is found
for amenity (+51.4 USD$2010 per respondent and per year) whereas a low value
is documented for spiritual or symbolic appreciation.
An interesting result from Model 3 and 4 is the fact that some interactions
between ecosystem services appears to be significant. In Model 3, the inter-
action between the “maintenance of populations and habitats” service and the
“recreational sightseeing” service appears to be significant at 10% with a positive
sign, which suggests some complementarities among services. This means that
there is a particularly high value for a lake jointly providing these two services.
More specifically, the added value of a lake jointly providing these two service is
estimated to be 15.5 USD$2010 per respondent and per year. This is not sur-
prising given the potentially high level of complementarity between a providing
a high level of maintenance of populations and habitats, and the provision of a

40
recreational service like sightseeing. In Model 4, we also document some com-
plementarity between the “maintenance of populations and habitats” service and
the “recreational swimming” service.
In model 4, we have added some characteristics describing the type of water
body (natural versus artificial, size of the water body) and the study from which
a value is obtained (valuation methods). We do not find any specific premium
for natural lakes compared to artificial ones. Although some artificial lakes may
have been constructed without fully replacing natural lakes ecological functions
or without fully supporting recreational activities or aesthetic services, it appears
that they are valued by people in the same way as natural lake are. We also
find a significant impact of the valuation method used to obtain lake values. In
particular, the value obtained with a travel cost approach results in a higher lake
value (2.8 USD$2010 per respondent and per year). The impact of the valuation
method has already been document in some previous meta-analysis of ecosystem
services value, but with contrasting results. For instance for value of wetlands,
(Woodward and Wui 2001) have found positive and significant coefficients for
replacement cost and hedonic pricing, while (Brander, Florax, and Vermaat 2006)
have reported a positive coefficient for contingent valuation.
Next, in Table 3, we provide some estimates of the meta-analytical models
using random-effects approach, for primary studies having used an hedonic price
approach.
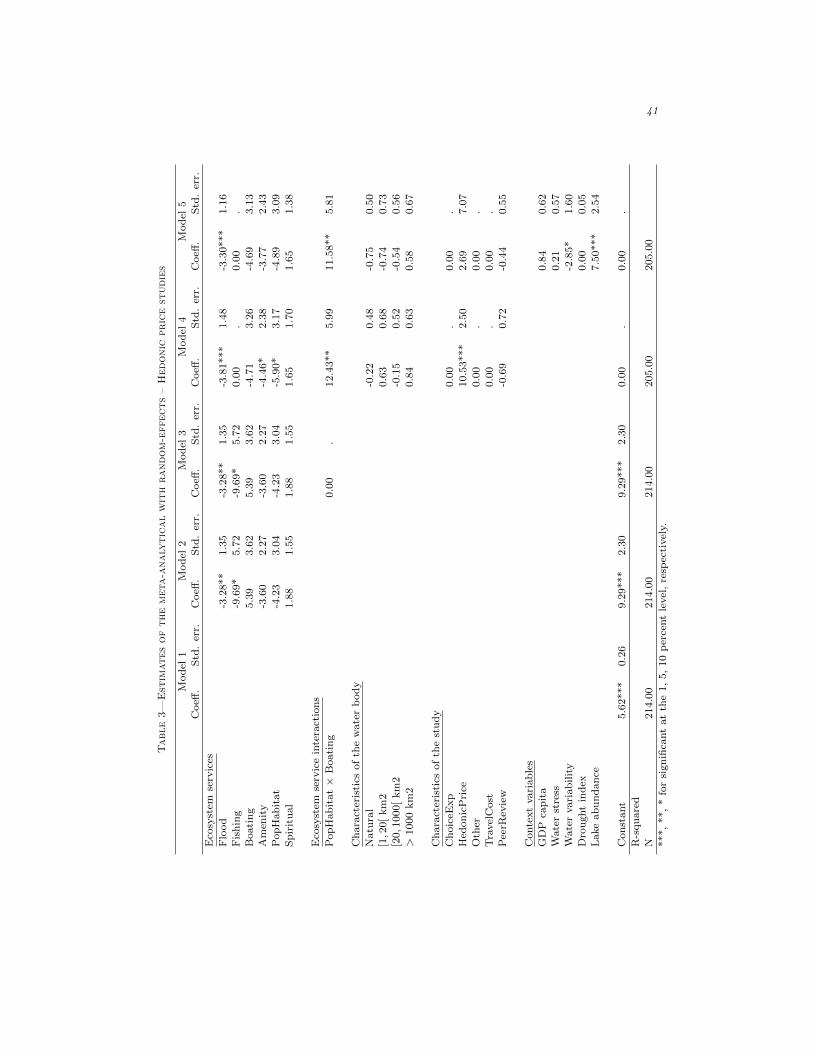
41
Table3—
Est
imatesofthemeta-analy
ticalwithrandom-effects–Hedonic
pricest
udies
Mod
el1
Mod
el2
Mod
el3
Mod
el4
Mod
el5
Coeff
.S
td.
err.
Coeff
.S
td.
err.
Coeff
.S
td.
err.
Coeff
.S
td.
err.
Coeff
.S
td.
err.
Eco
syst
emse
rvic
es
Flo
od
-3.2
8**
1.3
5-3
.28**
1.3
5-3
.81***
1.4
8-3
.30***
1.1
6
Fis
hin
g-9
.69*
5.7
2-9
.69*
5.7
20.0
0.
0.0
0.
Boati
ng
5.3
93.6
25.3
93.6
2-4
.71
3.2
6-4
.69
3.1
3
Am
enit
y-3
.60
2.2
7-3
.60
2.2
7-4
.46*
2.3
8-3
.77
2.4
3
Pop
Hab
itat
-4.2
33.0
4-4
.23
3.0
4-5
.90*
3.1
7-4
.89
3.0
9S
pir
itu
al
1.8
81.5
51.8
81.5
51.6
51.7
01.6
51.3
8
Eco
syst
emse
rvic
ein
tera
ctio
ns
Pop
Hab
itat×
Boati
ng
0.0
0.
12.4
3**
5.9
911.5
8**
5.8
1
Ch
ara
cter
isti
csof
the
wate
rb
od
y
Natu
ral
-0.2
20.4
8-0
.75
0.5
0[1,2
0[
km
20.6
30.6
8-0
.74
0.7
3
[20,1
000[
km
2-0
.15
0.5
2-0
.54
0.5
6
>1000
km
20.8
40.6
30.5
80.6
7
Ch
ara
cter
isti
csof
the
stu
dy
Ch
oic
eExp
0.0
0.
0.0
0.
Hed
on
icP
rice
10.5
3***
2.5
02.6
97.0
7
Oth
er0.0
0.
0.0
0.
Tra
vel
Cost
0.0
0.
0.0
0.
Pee
rRev
iew
-0.6
90.7
2-0
.44
0.5
5
Conte
xt
vari
ab
les
GD
Pca
pit
a0.8
40.6
2W
ate
rst
ress
0.2
10.5
7W
ate
rvari
ab
ilit
y-2
.85*
1.6
0
Dro
ught
ind
ex0.0
00.0
5L
ake
ab
un
dan
ce7.5
0***
2.5
4
Con
stant
5.6
2***
0.2
69.2
9***
2.3
09.2
9***
2.3
00.0
0.
0.0
0.
R-s
qu
are
dN
214.0
0214.0
0214.0
0205.0
0205.0
0
***,
**,
*fo
rsi
gn
ifica
nt
at
the
1,
5,
10
per
cent
level
,re
spec
tivel
y.

42
D. Valuing some hypothetical lakes
Table 4—Valuation of hypothetical lakes
Lake A Lake B Lake C
Ecosystem services providedFloodDrinkWater × × ×FishingSwimming × ×BoatingCamping ×Sightseeing × ×UnspecRecAmenityPopHabitat × ×Spiritual
Lake characteristicsNatural × × ×[20, 1000[ km2 × × ×
Value of the lake295.9* 223.6* 340.4*
*(in USD$2010 per respondent and per year.
In this paragraph, we demonstrate how the results of the meta-analysis may be
used to provide some predictions for the value of some hypothetical lakes. We will
consider three different lakes for which we would like to predict the value (with
a travel costs approach). Lake A is a natural lake with a total area belonging
to the second size class ([20, 1000[ km2). This lake is supposed to provide two
ecosystem services namely drinking water and maintenance of populations and
habitats. Applying the valuation function from Model 4 in Table 2, the predicted
value of this lake is estimated to be 295.6 USD$2010 per household and per year.
Next, we consider another lake (lake B) similar to lake A except that instead of
providing the “maintenance of populations and habitats” service, it provide two
recreational services namely “sightseeing” and “swimming”. Applying again the
valuation function from Model 4 in Table 2, we obtain a predicted value for this
lake equal to 223.6 USD$2010 per household and per year. Comparing lake A and
B value, we can conclude that the loss of the “maintenance of populations and

43
habitats” service is not fully compensated by the gain of the “sightseeing” and
“swimming” recreational services, for the lake characteristics we have consider
here. This very simple simulation exercise allows to quantity the relative benefit
of each ecosystem service. If we add the “camping” service to lake B (i.e we
pass from lake B to lake C), then the predicted value is estimated to be 340.4
USD$2010 per household and per year. Allowing people to benefit from the
three recreational services “sightseeing”, “swimming” and “camping” cancels out
the loss of welfare resulting from loosing the “maintenance of populations and
habitats”.
V. Conclusion
Today, while there is now widespread recognition that lakes provide valuable
ecological services, there remain substantial debates on their economic value. As
a result, lake ecosystems are often undervalued in decisions related to their use,
conservation or restoration.
In this paper, estimates for values attached to different ecosystem services pro-
vided by lakes and reservoirs have been compared and synthesised in a meta-
analysis. The meta-analysis provides insights into the factors that have to be
considered when attempting to transfer lake values on the basis of the valuation
studies. We have provided some preliminary estimates first using OLS.
We provide an estimation of the average value of a lake per household (84
USD$2010 per respondent and per year) and we offer some insights on how peo-
ple value different lake ecosystem services. A particular high value is found for
lake amenity whereas a low value is documented for spiritual or symbolic appreci-
ation of the lake. An interesting result is the fact that some interactions between
ecosystem services appear to be significant for enplaning lake values. This tra-
duces some trade-offs, synergies and antagonisms between ecosystem services as
already documented by (Fu, Su, Wei, Willett, L, and Liu 2011, Raudsepp-Hearne,
Peterson, and Bennett 2010) for landscape. We then show that the value of a

44
specific lake ecosystem service might depend upon other ecosystem services pro-
vided by this lake. Not introducing the potential interactions across ecosystem
services may then lead to biased estimates of ecosystem service values.
The work presented in this paper is in progress. More variables describing
lake’s characteristics and methodologies used in the primary studies should be
introduced. A more substantial comparison of our meta-regression results and
the existing meta-analyses in this field is planned to be carried out to extend the
paper (in particular by including the different lake values we have mentioned in
the descriptive part of the paper). Another step in the analysis presented here
will be to test the performance of in and out of sample transfers based on the
estimated meta-regression model. This implies that additional control factors
should be included for the countries and regions in which the valuation studies
were conducted in the spirit of what has been done by (Brander, Bruer, Gerdes,
Ghermandi, Kuik, Markandya, Navrud, Nunes, Schaafsma, Vos, and Wagtendonk
2012) for wetlands (Ghermandi and Nunes 2013) for costal areas.

45
REFERENCES
Abbott, J. K., and H. A. Klaiber (2013): “The value of water as an urban
club good: A matching approach to community-provided lakes,” Journal of
Environmental Economics and Management, 65(2), 208 – 224.
Abidoye, B. O., J. A. Herriges, and J. L. Tobias (2012): “Controlling for
Observed and Unobserved Site Characteristics in RUM Models of Recreation
Demand,” American Journal of Agricultural Economics.
Artell, J. (2014): “A spatial hedonic approach to water recreation value,”
Discussion paper, MTT Agrifood Research Finland.
Bastviken, D., L. J. Tranvik, J. A. Downing, P. M. Crill, and
A. Enrich-Prast (2011): “Freshwater Methane Emissions Offset the Conti-
nental Carbon Sink,” Science, 331(6013), 50.
Bateman, I. J., and A. P. Jones (2003): “Contrasting Conventional with Multi-
Level Modeling Approaches to Meta-Analysis: Expectation Consistency in U.K.
Woodland Recreation Values,” Land Economics, 79(2), 235–258.
Braden, J. B., X. Feng, L. Freitas, and D. Won (2010): “Meta-functional
transfer of hedonic property values: Application to Great Lakes areas of con-
cern,” Agricultural & Resource Economics Review, 39(1), 101.
Brander, L., R. Florax, and J. Vermaat (2006): “The Empirics of Wetland
Valuation: A Comprehensive Summary and a Meta-Analysis of the Literature,”
Environmental and Resource Economics, 33(2), 223–250.
Brander, L. M., P. V. Beukering, and H. S. Cesar (2007): “The recre-
ational value of coral reefs: A meta-analysis,” Ecological Economics, 63(1), 209
– 218.
Brander, L. M., I. Bruer, H. Gerdes, A. Ghermandi, O. Kuik,
A. Markandya, S. Navrud, P. Nunes, M. Schaafsma, H. Vos, and
A. Wagtendonk (2012): “Using Meta-Analysis and GIS for Value Transfer
and Scaling Up: Valuing Climate Change Induced Losses of European Wet-

46
lands,” Environmental and Resource Economics, 52(3), 395–413.
Brouwer, R., I. H. Langford, I. J. Bateman, and R. K. Turner (1999):
“A Meta-Analysis of Wetland Contingent Valuation Studies,” Regional Environ-
mental Change, 1(1), 47–57.
Costanza, R., R. d’Arge, R. de Groot, S. Farberk, M. Grasso, B. Han-
non, K. Limburg, S. Naeem, R. O’Neill, J. Paruelo, R. Raskin, P. Sut-
tonkk, and M. van den Belt (1997): “The Value of the World’s Ecosystem
Services and Natural Capital,” Nature, 387, 253–260.
Daniel, V. E., R. J. Florax, and P. Rietveld (2009): “Flooding risk and
housing values: An economic assessment of environmental hazard,” Ecological
Economics, 69(2), 355–365.
de Groot, R. S., M. A. Wilson, and R. M. Boumans (2002): “A typology
for the classification, description and valuation of ecosystem functions, goods
and services,” Ecological Economics, 41(3), 393 – 408.
Doll, P., H. Hoffmann-Dobrev, F. Portmann, S. Siebert, A. Eicker,
M. Rodell, G. Strassberg, and B. Scanlon (2012): “Impact of water with-
drawals from groundwater and surface water on continental water storage vari-
ations,” Journal of Geodynamics, 59-60(0), 143–156.
Dugan, P., A. Delaporte, N. Andrew, M. O’Keefe, and R. Welcomme
(2010): “Blue harvest: inland fisheries as an ecosystem service,” The WorldFish
Center Working Papers.
Eppink, F. V., L. M. Brander, and A. J. Wagtendonk (2014): “An Initial
Assessment of the Economic Value of Coastal and Freshwater Wetlands in West
Asia,” Land, 3(3), 557–573.
FAO (2012): “The State of World Fisheries and Aquaculture 2012,” Discussion
paper, Food and Agriculture Organization of the United Nations.
(2014): “The State of World Fisheries and Aquaculture 2014. Opportu-
nities and challenges,” Discussion paper, Food and Agriculture Organization of

47
the United Nations.
Fu, B.-J., C.-H. Su, Y.-P. Wei, I. R. Willett, Y.-H. L, and G.-H. Liu
(2011): “Double Counting in Ecosystem Services Valuation: Causes and Coun-
termeasures,” Ecological Research, 26(1), 1–14.
Ge, J., C. L. Kling, and J. A. Herriges (2013): “How Much is Clean Water
Worth? Valuing Water Quality Improvement Using A Meta Analysis,” Working
Paper No. 13016, Iowa State University.
Ghermandi, A., and P. A. Nunes (2013): “A Global Map of Coastal Recreation
Values: Results From a Spatially Explicit Meta-Analysis,” Ecological Economics,
86(0), 1 – 15.
Ghermandi, A., J. C. J. M. van den Bergh, L. M. Brander, H. L. F.
de Groot, and P. A. L. D. Nunes (2010): “Values of Natural and Human-
Made Wetlands: A Meta-Analysis,” Water Resources Research, 46(12).
Glass, G. V. (1976): “Primary, Secondary, and Meta-Analysis of Research,”
Educational Researcher, 5(10), 3–8.
Goodman, K. J., M. A. Baker, and W. A. Wurtsbaugh (2011): “Lakes as
buffers of stream dissolved organic matter (DOM) variability: Temporal patterns
of DOM characteristics in mountain stream-lake systems,” Journal of Geophys-
ical Research: Biogeosciences, 116(G4), n/a–n/a.
Haines-Young, R., and M. Potschin (2011): “Common international classi-
fication of ecosystem services (CICES): 2011 Update,” Nottingham: Report to
the European Environmental Agency.
Hardin, P. J., and R. R. Jensen (2007): “The effect of urban leaf area on
summertime urban surface kinetic temperatures: A Terre Haute case study,”
Urban Forestry & Urban Greening, 6(2), 63 – 72.
Harrison, J. A., R. J. Maranger, R. B. Alexander, A. E. Giblin, P.-
A. Jacinthe, E. Mayorga, S. P. Seitzinger, D. J. Sobota, and W. M.
Wollheim (2009): “The regional and global significance of nitrogen removal in

48
lakes and reservoirs,” Biogeochemistry, 93(1-2), 143–157.
Hejazi, M., J. Edmonds, V. Chaturvedi, E. Davies, and J. Eom (2013):
“Scenarios of global municipal water-use demand projections over the 21st cen-
tury,” Hydrological Sciences Journal, 58(3), 519–538.
Johnston, R. J., E. Y. Besedin, R. Iovanna, C. J. Miller, R. F. Ward-
well, and M. H. Ranson (2005): “Systematic variation in willingness to pay
for aquatic resource improvements and implications for benefit transfer: A meta-
analysis,” Canadian Journal of Agricultural Economics, 53(2-3), 221–248.
Johnston, R. J., M. H. Ranson, E. Y. Besedin, and E. C. Helm (2006):
“What determines willingness to pay per fish? A meta-analysis of recreational
fishing values,” Marine Resource Economics, 21(1).
Johnston, R. J., and R. S. Rosenberger (2010): “Methods, trends and
controversies in contemporary benefit transfer,” Journal of Economic Surveys,
24(3), 479–510.
Johnston, R. J., and P. J. Thomassin (2010): “Willingness to Pay for Water
Quality Improvements in the United States and Canada: Considering Possi-
bilities for International Meta-Analysis and Benefit Transfer,” Agricultural and
Resource Economics Review, 39(1), 114–131.
Jonkman, S. (2005): “Global Perspectives on Loss of Human Life Caused by
Floods,” Natural Hazards, 34(2), 151–175.
Krausmann, F., S. Gingrich, N. Eisenmenger, K.-H. Erb, H. Haberl,
and M. Fischer-Kowalski (2009): “Growth in global materials use, {GDP}
and population during the 20th century,” Ecological Economics, 68(10), 2696 –
2705.
Krinner, G. (2003): “Impact of lakes and wetlands on boreal climate,” Journal
of Geophysical Research: Atmospheres, 108(D16), n/a–n/a.
Kuusisto, E. (1985): Lakes: Their Physical Aspects, vol. II. John Wiley & Sons
Ltd.

49
Lansford, N. H., and L. L. Jones (1995): “Recreational and Aesthetic Value
of Water Using Hedonic Price Analysis,” Journal of Agricultural and Resource
Economics, 20(02).
Lehner, B., C. R. Liermann, C. Revenga, C. Vorosmarty, B. Fekete,
P. Crouzet, P. Doll, M. Endejan, K. Frenken, J. Magome, C. Nils-
son, J. C. Robertson, R. Rodel, N. Sindorf, and D. Wisser (2011):
“Primary, Secondary, and Meta-Analysis of Research,” Frontiers in Ecology and
the Environment, 9(9), 494–502.
Londono, L. M., and R. J. Johnston (2012): “Enhancing the Reliability of
Benefit Transfer Over Heterogeneous Sites: A Meta-Analysis of International
Coral Reef Values,” Ecological Economics, 78, 80 – 89.
Magat, W. A., J. Huber, W. K. Viscusi, and J. Bell (2000): “An Iterative
Choice Approach to Valuing Clean Lakes, Rivers, and Streams,” Journal of Risk
and Uncertainty, 21(1), 7–43.
Mekonnen, M. M., and A. Y. Hoekstra (2012): “The blue water footprint
of electricity from hydropower,” Hydrology and Earth System Sciences, 16(1),
179–187.
Moeltner, K., K. J. Boyle, and R. W. Paterson (2007): “Meta-analysis
and benefit transfer for resource valuation-addressing classical challenges with
Bayesian modeling,” Journal of Environmental Economics and Management,
53(2), 250–269.
Nelson, J. P., and P. E. Kennedy (2009): “The Use (and Abuse) of Meta-
Analysis in Environmental and Natural Resource Economics: An Assessment,”
Environmental and Resource Economics, 42(3), 345–377.
Powers, S. M., D. M. Robertson, and E. H. Stanley (2013): “Effects of
lakes and reservoirs on annual river nitrogen, phosphorus, and sediment export
in agricultural and forested landscapes,” Hydrological Processes, pp. n/a–n/a.
Raudsepp-Hearne, C., G. D. Peterson, and E. M. Bennett (2010):

50
“Ecosystem Service Bundles for Analyzing Tradeoffs in Diverse Landscapes,”
Proceedings of the National Academy of Sciences.
Rosenberger, R. S., and J. B. Loomis (2000): “Panel Stratification in Meta-
Analysis of Economic Studies: An Investigation of Its Effects in the Recreation
Valuation Literature,” Journal of Agricultural and Applied Economics, 32(03).
Sander, H. A., and S. Polasky (2009): “The Value of Views and Open Space:
Estimates From a Hedonic Pricing Model for Ramsey County, Minnesota, USA,”
Land Use Policy, 26, 837–845.
Schallenberg, M., M. D. de Winton, P. Verburg, D. J. Kelly, K. D.
Hamill, D. P. Hamilton, J. Dymond, et al. (2013): “Ecosystem of Lakes,”
Ecosystem services in New Zealand: conditions and trends, pp. 203–225.
Shiklomanov, I. A., and J. C. Rodda (2003): World water resources at the
beginning of the twenty-first century, vol. 13. Cambridge University Press, Cam-
bridge.
Smith, V., and S. Pattanayak (2002): “Is Meta-Analysis a Noah’s Ark for Non-
Market Valuation?,” Environmental and Resource Economics, 22(1-2), 271–296.
TEEB (2010): The Economics of Ecosystems and Biodiversity: Ecological and
Economic Foundation. Earthscan, London and Washington.
Tranvik, L. J., J. A. Downing, J. B. Cotner, S. A. Loiselle, R. G.
Striegl, T. J. Ballatore, P. Dillon, K. Finlay, K. Fortino, L. B.
Knoll, et al. (2009): “Lakes and reservoirs as regulators of carbon cycling
and climate,” Limnology and Oceanography, 54(6), 2298–2314.
Van Houtven, G., J. Powers, and S. K. Pattanayak (2007): “Valuing
water quality improvements in the United States using meta-analysis: Is the
glass half-full or half-empty for national policy analysis?,” Resource and Energy
Economics, 29(3), 206–228.
Viscusi, W. K., J. Huber, and J. Bell (2008): “The Economic Value of Water
Quality,” Environmental and Resource Economics, 41(2), 169–187.

51
Woodward, R. T., and Y.-S. Wui (2001): “The Economic Value of Wetland
Services: a Meta-Analysis,” Ecological Economics, 37(2), 257 – 270.