methods valuing ecosystem goods and services: a …esanalysis.colmex.mx/sorted papers/2004/2004 aus...
TRANSCRIPT
www.elsevier.com/locate/ecolecon
Ecological Economics 50 (2004) 163–194
METHODS
Valuing ecosystem goods and services: a new approach using a
surrogate market and the combination of a multiple criteria analysis
and a Delphi panel to assign weights to the attributes
Ian A. Curtis*
School of Environmental Studies and Geography, Faculty of Science and Engineering, James Cook University,
P.O. Box 6811 Cairns, Queensland 4870, Australia
Received 22 February 2003; received in revised form 5 February 2004; accepted 20 February 2004
Available online 25 September 2004
Abstract
A new approach to valuing ecosystem goods and services (EGS) is described which incorporates components of the
economic theory of value, the theory of valuation (USf appraisal), a multi-model multiple criteria analysis (MCA) of
ecosystem attributes, and a Delphi panel of experts to assign weights to the attributes. The total value of ecosystem goods
and services in the various tenure categories in the Wet Tropics World Heritage Area (WTWHA) in Australia was found
to be in the range AUD$188 to $211 million year� 1, or AUD$210 to 236 ha� 1 year� 1 across tenures, as at 30 June
2002. Application of the weightings assigned by the Delphi panelists and assessment of the ecological integrity of the
various tenure categories resulted in values being derived for individual ecosystem services in the World Heritage Area.
Biodiversity and refugia were the two attributes ranked most highly at AUD$18.6 to $20.9 million year� 1 and AUD$16.6
to $18.2 million year� 1, respectively.
D 2004 Elsevier B.V. All rights reserved.
Keywords: Valuing; Ecosystem services; Economics; Surrogate market; Shadow prices; Delphi; Multiple criteria analysis
1. Introduction pear or be converted to secondary forests within the
Ecosystems are being degraded and destroyed
worldwide due to human activities at a rate unprec-
edented in human history (Daily, 1997; Ponting,
1998). Closed tropical rainforests only occupy 7%
of the earth’s land surface yet they contain more
than half the world’s biota. They will mostly disap-
0921-8009/$ - see front matter D 2004 Elsevier B.V. All rights reserved.
doi:10.1016/j.ecolecon.2004.02.003
* Tel.: +61-207-4042-1389; fax: +61-207-4042-1284.
E-mail address: [email protected] (I.A. Curtis).
next century (Wilson, 1988a). Habitats are being
clear-felled, paved over, flooded, ploughed under,
rained on with acid, invaded by exotic organisms,
overgrazed, and having their climate changed (Ehr-
lich, 1988). Destruction of forests also causes
changes in the hydrological cycle leading to desert-
ification, soil salinity, floods and erosion (Winpenny,
1991). Wholesale eradication of populations and
species of organisms have a critical and fundamental
impact on the provision of ecosystem goods and
services that are essential as planetary life support
Table 1
Ecosystem attributes used in the multi-model multiple criteria
analysis (adapted and modified after Costanza et al., 1997a; Cork
and Shelton, 2000)
Group Type
Stabilisation Gas regulation (atmospheric composition)
services Climate regulation (temperature, rainfall)
Disturbance regulation (ecosystem resilience)
Water regulation (hydrological cycle)
Erosion control and soil/sediment retention
Biological control (populations, pest/disease
control)
Refugia (habitats for resident and transient
populations)
Regeneration Soil formation
services Nutrient cycling and storage (including
carbon sequestration)
Assimilation of waste and attenuation,
detoxification
Purification (clean water, air)
Pollination (movement of floral gametes)
Biodiversity
Production Water supply (catchment)
of goods Food production (that sustainable portion
of GPP)
Raw materials (that sustainable portion
of GPP, timber, fibre, etc.)
Genetic resources (medicines, scientific and
technological resources
Life fulfilling Recreation opportunities (nature-based tourism)
services Aesthetic, cultural and spiritual
(existence values)
Other non-use values (bequest and quasi
option values)
I.A. Curtis / Ecological Economics 50 (2004) 163–194164
systems, and not only for humans (Nunes and van
den Bergh, 2001). The extraordinary variety of life
on earth had been imagined through the work of
luminaries such as Erwin (1988) and Wilson
(1988b, 2002), however, the growth of the study
of biological diversity as a field of scientific en-
deavour is revealing an even greater variety of life-
forms and inter-connected evolutionary niches. Ig-
norance of these interactions and their connotations
with respect to nature’s services, such as the con-
tribution of soil organisms to atmospheric composi-
tion, indicates that humans still lack basic under-
standing of the contributions made by the natural
environment to planetary life support (Beattie and
Erhlich, 2001). The genetic diversity within species
is declining rapidly and it is largely irreplaceable.
Protected areas or reserves may no longer be the
solution to preserving genetic diversity, as climate
change could cause forest migration and desertifica-
tion and many existing natural populations of wild
organisms will no longer be able to survive within
their present ranges (Peters, 1988). An alternative
would be for human modified areas to be made
more environmentally hospitable and a balance
maintained between wildlife habitat areas and areas
designated for human habitation and food produc-
tion (Winpenny, 1991). Scheffer et al. (2000: 451)
argue that: ‘‘good ecosystem models, institutional-
ised ecosystem valuation, and innovative tax-setting
schedules are essential to achieving a socially fair
and sustainable use of ecosystems by societies’’.
Ecosystem goods and services (EGS) can only
support human life if a well-functioning and rich
variety of systems are spread over most of the
Earth’s surface (Meffe and Carroll, 1997). Impair-
ment of the ability of ecosystems to provide a
sustained flow of beneficial services suggests the
loss of a valuable resource (Howarth and Farber,
2002). Ecosystem services may be defined as the
products of the role that ecological systems play in
providing a sustainable environment for life support,
such as clean air, clean water, food, habitat and
recreational opportunities (Table 1). In this paper, a
new method to value the environment will be
described. Relying on valuation theory and the
property market as a surrogate market, the total
value of the Wet Tropics World Heritage Area
(WTWHA) in Australia is determined. A multiple
criteria analysis (MCA) combined with a Delphi
Inquiry is then used to assign shadow prices to
the individual EGS and groups of goods and serv-
ices provided by the World Heritage Area.
2. Background
There is still a fundamental lack of confidence in
the outcomes of attempts to value the environment.
The seminal paper by Costanza et al. (1997a)
published in Nature pulled together many social
studies of diverse ecosystems to arrive at a gross
value for the earth’s EGS at US$33 trillion. Yet
despite this notable attempt, ecosystems are still
being degraded partly from the want of a simple
and practical method to assign values to individual
I.A. Curtis / Ecological Economics 50 (2004) 163–194 165
EGS. Very few attempts have been made to broadly
value all EGS in a bioregion or whole ecosystems
due to the difficulty in valuing certain aspects of
them (Cork and Shelton, 2000). While the
approaches used in neoclassical and environmental
economics have been the subject of aggressive
controversy for decades, due to continual refine-
ment they still have some merit and application
when it comes to placing value on certain attributes
of the environment, such as recreation (Harrison,
2002). However, Costanza et al. (1997b) claim that
there is now, more than ever, powerful evidence of
the need for an innovative approach to this type of
analysis that will encompass both economics and
ecology. This new approach should require that an
economically efficient allocation of resources be
devised that adequately protects the stock of natural
capital, and at the same time recognises the inter-
relatedness and inter-dependence of all physical and
biophysical components of the earth’s finite ecosys-
tems. Hawken et al. (1999) describe this require-
ment as reconciling economic and ecological goals.
Added to this are the problems of removing the
odium attached to the idea of putting a monetary
value on everything, distributional effects, and
translating and communicating the need for a mar-
ket mechanism to conserve these formerly ‘free’
goods and services. Howarth and Farber (2002)
refer to efforts to place a monetary value on EGS
as having ‘multiple roles’ in linking human and
natural systems, however warn of the ‘well-known’
limitations of the current non-market valuation
methods and further question the equity issues of
such evaluations. A revealed preference or surrogate
market overlooked so far in empirical studies of
environmental valuation, with the exception of
hedonic pricing techniques, is the broader property
market. The property market is notable and validat-
ed by the pivotal role it plays in national admin-
istration, e.g. taxation, and widespread acceptance
by the commercial world, individuals and the judi-
ciary. People reveal their preferences to purchase
property for a multitude of uses. These sales are
then used by state and/or federal agencies to
establish gross valuations that are used as the
taxable base for local governments. This data can
be relatively easily obtained, translated and then
extended to determine the median unimproved
property value (MUV) in a wider geographical
region. The MUV is then applied to public or
unrateable land, national parks, etc., in the same
region to establish a capital value per hectare. The
terms value and valuation theory are used in this
paper to describe the pecuniary worth of EGS and
the associated theory and practice to do with
establishing values for real property. If economic
valuation procedures such as contingent valuation
methods are discussed they are described as such,
as is also the case with intrinsic value (existence
value). The operational definition of value in this
paper is thus that which is normally expressed
through a commercial market (Funtowitz and Rav-
etz, 1994).
2.1. Valuation theory and practice
The principles of land valuation predate modern
economics and consist essentially of precedents in
English Common Law. Now, in Australia it has been
greatly elaborated and replaced by legislation, most
of which was first enacted in the late 19th and early
20th century. By far the majority of this legislation
is to do with taxing laws (Herps, 1942). Current
methods of valuation have been derived largely from
decisions given by eminent judges of the Supreme
Court in various States, the High Court of Australia,
and of the Privy Council (Herps, 1942; Hyams,
1986; Whipple, 1992). These authorities have ruled
that the term value means value in the open market.
The precedent followed by all Courts in Australia
when dealing with the valuation of land is Spencer v
The Commonwealth (Griffith, 1907: 5 CLR 418).
Land (real property or real estate) has long since
been regarded as different from personal property, in
that under common law no person can have an
absolute title to real property (Hyams, 1986). The-
oretically, absolute ownership in Australia vests in
the Crown, who may resume, provided proper com-
pensation is paid, the land and the wealth upon it
(Herps, 1942). Land that is divested from the
Crown, either freehold or leasehold and subject to
local government rates and taxes is described as
alienated.
The utilisation of land in a way that benefits both
the individual owner and society, remains one of the
principal problems in the world today, particularly in

I.A. Curtis / Ecological Economics 50 (2004) 163–194166
developing nations where the poor often have little
choice but to deplete or degrade natural resources to
earn a living (Nations, 1988). Nations, states and the
local authorities have, from time immemorial, pos-
sessed a beneficial interest in all privately owned
lands as being the basis of taxation and for local
rating purposes (Murray, 1954; 1969; Inglis, 1960).
In Australia the basis of rating is the unimproved
value (UV). In order to derive the UV the courts
insist that the improvements on the subject land are
to be ignored, however they also insist that commu-
nal effort, and the presence of Government utilities,
such as transport, water, gas, electricity, and the
proximity of a dense population are all to be con-
sidered (Lambert, 1932; Herps, 1942; Principia,
1958).
The three primary methods used to value real
property are complementary, and lead to convergent
validity (Motha, 1979; Reynolds, 1984). They are
summation, capitalisation and the use of comparable
sales evidence. Summation involves, as the name
suggests, addition of the depreciated value of
improvements to the UV, or in the case of trying
to find UV from comparable sales of improved
property, deduction of the value of improvements
from the improved value. Capitalisation refers to the
application of an interest rate or desired/expected
yield to the capital value of the land or improved
property to arrive at a rent, or the capitalisation of
the rent or net earnings to arrive at a capital value
(AIVLE, 1997). Consideration must be given to the
capitalisation rate as reflecting the elements of risk,
and the return of capital within the life of the
investment. The capitalisation rate is never less than
the rate of bank interest, or at least comparable with
the yield from gilt-edged securities such as long-
dated government bonds (Lambert, 1932). The Val-
uer General for Ireland and founder of ‘Political
Arithmetic’ in the 17th Century, Sir William Petty,
was first credited with the theory of capitalisation of
the usus fructus per annum (L. ususf use; fruc-
tusf fruit) or production function of the land, with
capitalisation rates varying with risk (Murray, 1954).
The Oxford Dictionary (Simpson and Weiner, 1989:
361) defines usufruct as: (1) Law. ‘‘The right of
temporary possession, use, or enjoyment of the
advantages of property belonging to another, so far
as may be had without causing damage or prejudice
to this. Usufruct is the power of disposal of the use
and fruits, saving the substance of the thing’’. The
Oxford Dictionary also cites Marsh (1864: 35), ‘Man
in Nature’, wherein it is stated: ‘‘Man has too long
forgotten that the earth was given to him for usufruct
alone, not for consumption’’ (Simpson and Weiner,
1989: 362). Petty believed that capitalisation of all of
the profit and benefits produced by land held in the
public domain was a logical economic step to take to
determine capital value, or vice versa. The correct
rate of capitalisation at any point in time can only be
discovered by a study of the market (Ab Initio, 1949;
Else-Mitchell, 1963).
Comparable sales provide the additional evidence
upon which buyers, sellers, valuers and the courts
rely on to establish a parity or consensus of opinion
of value, which can be averaged to ascertain ‘the
capital sum which similar land might be expected to
realise’ (Lambert, 1932: 17). McNamara (1983)
described the use of comparable sales data as a
fundamental activity in valuation work. Land under
public utilities continues to have a potential for other
uses, and the economic cost to society of dedication
to use for a public purpose is the opportunity cost
foregone, as is the case for resources generally. ‘The
relative scarcity of resources is ranked in the market
place by price’ (Rowles et al., 1998: 261), and in the
case of public land the relative scarcity has to be
determined in an indirect way by use of a ‘surrogate
market’ or ‘shadow price’. Valuers have proposed a
number of techniques, including comparable sales of
adjoining land, rating values of adjoining land and
average municipal rateable value. The latter two
techniques are regarded as the most suitable to
provide a shadow price, due to their ability to rank
relative scarcity, and ease of application (Rowles et
al., 1998).
Conceptually, market value can be regarded as the
equivalent of the current worth of future anticipated
benefits (Reynolds, 1984). Rich et al. (1934: 51 CLR
509) in the full High Court of Australia stated that:
‘‘. . .market value is not an absolute, but a relative
term, expressing the relationship of value existing at
the date of valuation between the land in question and
other similar land, with land generally, and further,
with all other avenues of investment in the economic
system’’ The concept of ‘highest and best use’ auto-
matically extends to the ‘highest and best legal use’,

I.A. Curtis / Ecological Economics 50 (2004) 163–194 167
for example compliance with zoning laws and local
authority regulations (Whipple, 1962; Spencer, 1984),
and now federal and state environmental laws (Hem-
mings, 1996). Liability for environmental harm can
arise from common law or from statute, and as a
valuer has a duty to make all prudent enquiries and
take into account all matters that affect value, laws
that are designed to protect the environment can have
a significant impact (Hemmings, 1996). Putting aside
the legal determinants of ‘highest and best use’,
Whipple (1962) suggests that if a development
achieves maximum acceptability in the marketplace,
then the land has been put to its ‘highest and best use’.
If it is valid to equate the concept of ‘highest and best
use’ with maximum acceptability in the market place,
it must satisfy human social and economic preferen-
ces, and these are manifest in the development and
evolution of communities in time and space (Whipple,
1962). Radcliffe (1972: 525) stressed that establishing
a market value is a prediction of an economic event,
and suggested that ‘‘no such thing as ‘true’ or ‘real’
value for a property exists’’, leading to the practise of
establishing a range of values (Boyd, 1990; West-
wood, 1993).
One of the difficulties in environmental valuation is
the decreasing tangibility from direct use, to say exis-
tence values, or use and non-use values. However, there
does not appear to be much difference between the
economist’s concept of total economic value (TEV) and
the concept of market value, as the latter is simply made
up of varying degrees of use and non-use values (Lally,
1998; Sarpong-Oti, 1998). In some situations the mar-
ket value concept would take precedence over the TEV
concept, particularly when assessing natural resource
values. The difficulties when trying to assess these
values from the point of view of all members of society
are formidable, however the United Nations (SNA93)
recommended that for national balance sheet purposes,
valuation of natural resources should be: ‘‘. . .on the
basis of current observable market prices as this is the
basis on which decisions by producers, consumers,
investors and other economic agents are made’’ (p. xi
cited in Sarpong-Oti, 1998). This recognition of the role
of market value in valuing natural resources, was then
sanctioned by the publication of ‘Experimental Esti-
mates of Values of Natural Resources Covering Forests,
Land and Subsoil’, by the Australian Bureau of Statis-
tics in 1995, which stated: ‘‘. . .the values for both urban
and rural lands were based on land values for rating and
taxation purposes provided by state valuation agencies’’
(Sarpong-Oti, 1998: 339). Moreover, this application
was transferred to land under public utilities, and by
implication to public reserves by the introduction of
Australian Accounting Standard AAS27 (Rowles et al.,
1998). More recently, Australian Accounting Standard
AASB1041 was introduced which specifically applied
to non-current assets, with strict guidelines as to how the
assets were to be valued (Reed, 2003). It would thus
appear clear that there is not only wide acceptance and
support for the empirical method of valuation, but that it
is the preference of both national governments and
supra-national agencies.
2.2. The wet tropics of Queensland world heritage
area
The Wet Tropics World Heritage Area (WTWHA)
comprises about 48% of the Wet Tropics Bioregion in
Queensland, Australia, which is described in the Inter-
im Biogeographic Regionalisation for Australia
(IBRA), as having an area of 18,497 km2 and a
protected status of greater than 10%. The WTWHA
comprises tropical wet coastal ranges and plains, rain-
forests and forests. The dominant condition is de-
scribed as ‘modified ecosystems’, i.e. very little
natural ecosystems remain, and/or natural ecosystems
present, but co-existing with pastoral and timber in-
dustries. The dominant limiting factors and constraint
codes in IBRA are ‘cropping, urbanisation, tourism’.
However, the Wet Tropics Bioregion has the highest
levels of biological diversity of any region in Australia
(WTMA, 2001), and Australia is included in the 12
‘mega-diverse’ countries of the world with collectively
75% of the total global biodiversity (EPA, 1999). The
WTWHA was listed in 1988 as international recogni-
tion that the area is an outstanding example of the
world’s natural or cultural heritage, having satisfied all
four of the natural heritage criteria. The WTWHA
comprises some 8,944 km2 and is totally contained
within the Wet Tropics Bioregion (Fig. 1), and consists
of a variety of tenures (Table 2). TheWet TropicsWorld
Heritage Protection and Management Act 1993 pro-
vides for a management plan (The Wet Tropics Man-
agement Plan 1998) that divides the WTWHA into
zones based on a ‘distance from disturbance’ model
where various types of activities are either allowed or
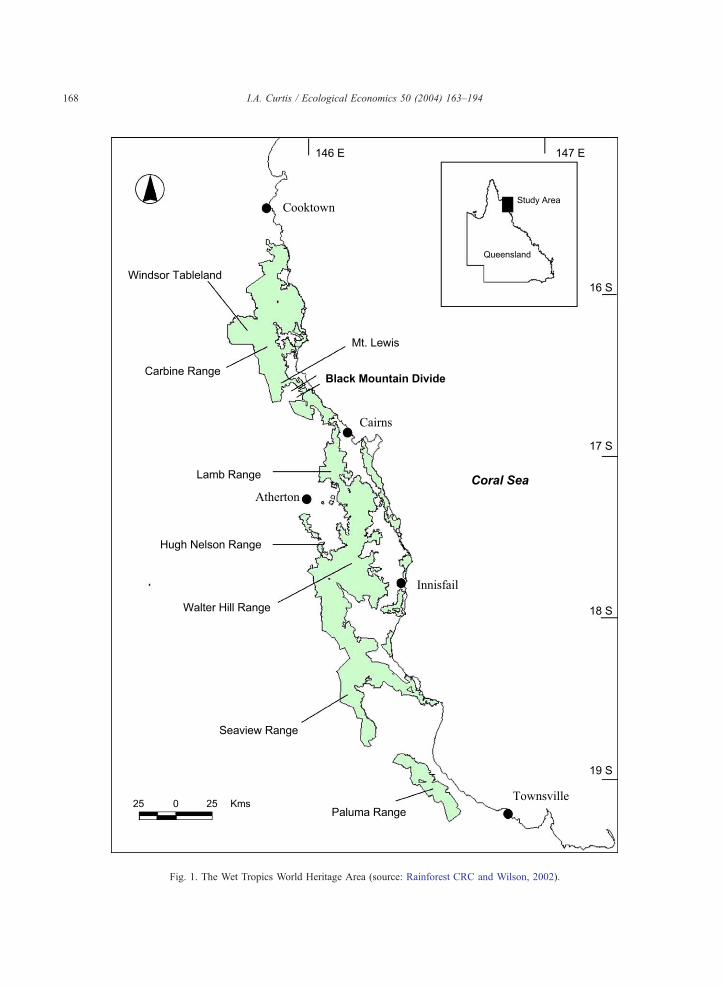
Fig. 1. The Wet Tropics World Heritage Area (source: Rainforest CRC and Wilson, 2002).
I.A. Curtis / Ecological Economics 50 (2004) 163–194168
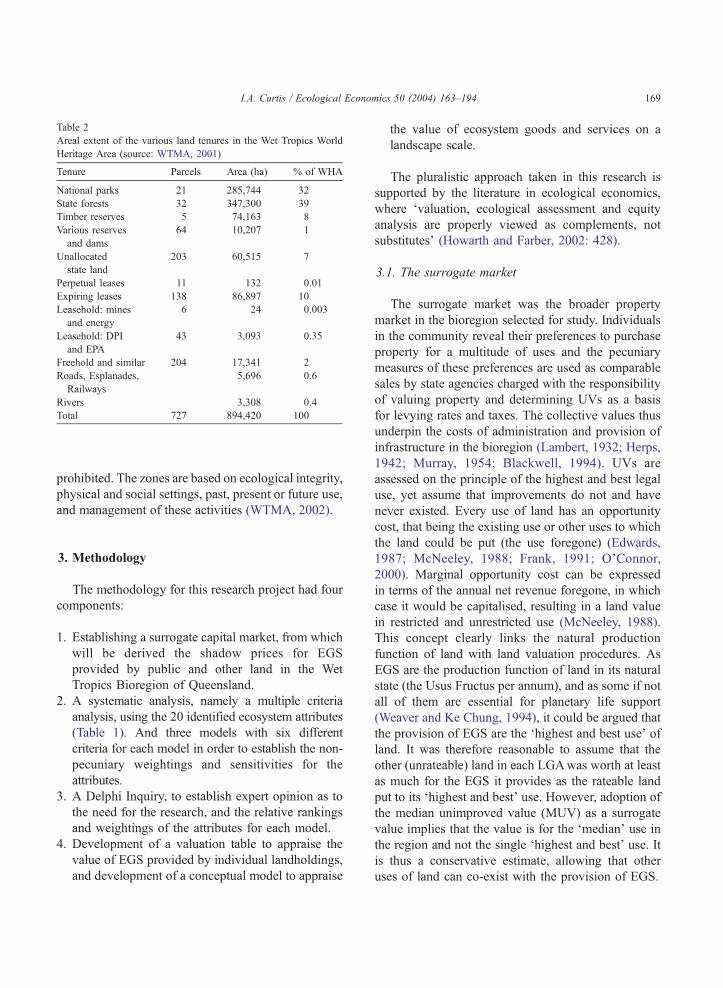
Table 2
Areal extent of the various land tenures in the Wet Tropics World
Heritage Area (source: WTMA, 2001)
Tenure Parcels Area (ha) % of WHA
National parks 21 285,744 32
State forests 32 347,300 39
Timber reserves 5 74,163 8
Various reserves
and dams
64 10,207 1
Unallocated
state land
203 60,515 7
Perpetual leases 11 132 0.01
Expiring leases 138 86,897 10
Leasehold: mines
and energy
6 24 0.003
Leasehold: DPI
and EPA
43 3,093 0.35
Freehold and similar 204 17,341 2
Roads, Esplanades,
Railways
5,696 0.6
Rivers 3,308 0.4
Total 727 894,420 100
I.A. Curtis / Ecological Economics 50 (2004) 163–194 169
prohibited. The zones are based on ecological integrity,
physical and social settings, past, present or future use,
and management of these activities (WTMA, 2002).
3. Methodology
The methodology for this research project had four
components:
1. Establishing a surrogate capital market, from which
will be derived the shadow prices for EGS
provided by public and other land in the Wet
Tropics Bioregion of Queensland.
2. A systematic analysis, namely a multiple criteria
analysis, using the 20 identified ecosystem attributes
(Table 1). And three models with six different
criteria for each model in order to establish the non-
pecuniary weightings and sensitivities for the
attributes.
3. A Delphi Inquiry, to establish expert opinion as to
the need for the research, and the relative rankings
and weightings of the attributes for each model.
4. Development of a valuation table to appraise the
value of EGS provided by individual landholdings,
and development of a conceptual model to appraise
the value of ecosystem goods and services on a
landscape scale.
The pluralistic approach taken in this research is
supported by the literature in ecological economics,
where ‘valuation, ecological assessment and equity
analysis are properly viewed as complements, not
substitutes’ (Howarth and Farber, 2002: 428).
3.1. The surrogate market
The surrogate market was the broader property
market in the bioregion selected for study. Individuals
in the community reveal their preferences to purchase
property for a multitude of uses and the pecuniary
measures of these preferences are used as comparable
sales by state agencies charged with the responsibility
of valuing property and determining UVs as a basis
for levying rates and taxes. The collective values thus
underpin the costs of administration and provision of
infrastructure in the bioregion (Lambert, 1932; Herps,
1942; Murray, 1954; Blackwell, 1994). UVs are
assessed on the principle of the highest and best legal
use, yet assume that improvements do not and have
never existed. Every use of land has an opportunity
cost, that being the existing use or other uses to which
the land could be put (the use foregone) (Edwards,
1987; McNeeley, 1988; Frank, 1991; O’Connor,
2000). Marginal opportunity cost can be expressed
in terms of the annual net revenue foregone, in which
case it would be capitalised, resulting in a land value
in restricted and unrestricted use (McNeeley, 1988).
This concept clearly links the natural production
function of land with land valuation procedures. As
EGS are the production function of land in its natural
state (the Usus Fructus per annum), and as some if not
all of them are essential for planetary life support
(Weaver and Ke Chung, 1994), it could be argued that
the provision of EGS are the ‘highest and best use’ of
land. It was therefore reasonable to assume that the
other (unrateable) land in each LGAwas worth at least
as much for the EGS it provides as the rateable land
put to its ‘highest and best’ use. However, adoption of
the median unimproved value (MUV) as a surrogate
value implies that the value is for the ‘median’ use in
the region and not the single ‘highest and best’ use. It
is thus a conservative estimate, allowing that other
uses of land can co-exist with the provision of EGS.
I.A. Curtis / Ecological Economics 50 (2004) 163–194170
The local government areas (LGAs) that are
contained wholly within or that administer parts
of the Wet Tropics Bioregion were ascertained from
public records and maps. These local governments
were consulted as to the total rateable value of
alienated land within their jurisdiction, and the total
area of that land. A dollar value per hectare was
calculated for each LGA and descriptive statistics
were derived for the set of values. Owing to the
variability in the data due to varying degrees of
urbanisation, development, use, distance from serv-
ices, and average parcel size, the data set was
expected to have a high degree of positive skew-
ness. The measure of central tendency most com-
monly accepted for this type of skewed data set is
the ‘median’ (Zar, 1996; Hicks, 1999). The skew-
ness attributable to a high degree of development
(disturbance) is also indicative of smaller lot sizes,
which are least conducive to the provision of a
suite of ecosystem goods and services. Hence, the
median unimproved value (MUV) is the measure
that will provide the best approximation of all of
the uses to which land is put in the bioregion on a
broadacre basis and will take into account all of
the various principles and factors that affect the
value of land. The MUV (ha� 1) of the alienated
(rateable) land in the bioregion was then used as a
surrogate for the MUV (ha� 1) of the un-alienated
(public or unrateable) land. This is consistent with
valuation practice (use of comparable sales is a
fundamental activity).
Sir William Petty, Valuer General for Ireland and
one of the founders of the Royal Society in 1662,
was well aware of the valuation theory to do with
the differential element in rent when he enunciated
it, although it was later attributed to Ricardo
(Murray, 1954). However, Roll (1961) in his His-
tory of Economic Thought pointed out that it was
Petty, and not Ricardo, who evolved the theory.
Murray (1954:40) puts the theory succinctly:
‘‘. . .the value of land could be ascertained by the
capitalisation of the ‘Usus Fructus per annum’, and
added that it is ‘‘. . .a process which is known today
as the productivity method of valuation’’ (Murray)
1954:40). Petty was also well aware that capital-
isation rates varied with risk, stating in 1661 that
lands in Ireland were worth ‘but seven years
purchase’ (indicating a capitalisation rate of about
14.3%), without elaborating on the reason for the
heightened risk (Murray, 1954:40). The theory is
both applicable to derivation of land value from
rent and to derivation of rent, or the ‘‘Usus Fructus
per annum’’, by the use of comparable sales data
for land. Earlier, Petty was uncertain as to how to
determine the rate of return from land and came up
with an ingenious solution. Petty determined that
the rights to the usufruct of land of three gener-
ations of humans would be a reasonable estimate,
and computed the value of land at 21 year’s
purchase of its annual rent, or in money-capital
terms 4.76% (Roll, 1961).
An appropriate capitalisation rate was derived
from a study of the market and applied to the
median capital unimproved value (MUV) per hect-
are, producing a value for the flow of ecosystem
benefits from land (the Usus Fructus per annum).
Care was taken that the capitalisation rate chosen
was low enough to satisfy ‘Hotelling’s rule’ without
being too low to ensure that the ‘Hotelling rent’
(also known as ‘Ricardian rent’ or ‘scarcity rent’)
generated a flow of benefits of a value undiminished
into the future (Hotelling, 1931; Hackett, 2001). The
Usus Fructus per annum (UFpa) was thus repre-
sented by the equation:
UFpað$=haÞ ¼ MUVð$=haÞ � crð%Þ ð1Þ
where cr is the capitalisation rate.
As both alienated and un-alienated land provide
EGS it was important to be able to estimate the extent
to which the land contributed to the overall contribu-
tion. Depending on the level of disturbance, other
human activities on the land can co-exist with the
provision of EGS. Therefore on a landscape scale,
total value of a whole ecosystem (TVw) is represented
by the equation:
TVw ¼ UFpa� areaðhaÞ � esið%Þ ð2Þ
where esi is the extent to which ecosystem services
are intact.
In order to distinguish between the value of indi-
vidual EGS that may or may not be present in a given
situation, or that may be present but only to a limited
extent, and to be able to account for them separately,
weightings for the individual ecosystem attributes
need to be derived. Then the total value or shadow

I.A. Curtis / Ecological Economics 50 (2004) 163–194 171
price of an individual ecosystem attribute (TVi) is
represented by the equation:
TVi ¼ UFpa� areaðhaÞ � esið%Þ � wt: ð3Þ
where wt is the final weighting of the attribute,
expressed as a decimal.
A diagrammatical representation of the methodol-
ogy is shown in Fig. 2.
3.2. The systematic analysis
A three-model multiple criteria analysis (MCA)
of ecosystem attributes was designed in conjunction
with the Delphi Inquiry using a panel of experts to
assign appropriate weightings and sensitivities to the
attributes. Munda (1996) describes ‘weak compara-
bility’ (strong conflictual consequences of actions)
as the philosophical foundation of multicriteria anal-
ysis. However, MCA does have the ability to
incorporate information about alternatives from a
variety of sources, convert it to standard units of
measure, weight the data according to magnitude
and significance, test for sensitivity, and rank alter-
native options. Environmental, social and cultural
trade-offs become more explicit and can be consid-
ered in the process (Blalock and Blalock, 1968;
Fig.2. Diagrammatic representation of the derivation of the values.
The multi-criteria analytical component of the Delphi only provides
input to individual EGS (TVi). The conceptual models provide the
level (%) of ecosystem integrity and control the capitalisation rate,
which derives UFpa for both TVw and TVi.
Rietveld, 1980; Dick, 1990; More et al., 1996;
Hicks, 1999; KPMG, 2000; Rivett, 2000). MCA
has broad application as a multi-attribute decision-
making method (MADM), which was evaluated for
this research project, along with the analytical hier-
archical process (AHP), rank-order centroid method
and the fuzzy method. The Department for Trans-
port, Local Government and the Regions (DTLR,
2002) used MCA to appraise all transport projects,
including proposals for all road schemes in the
United Kingdom, and the National Audit Office in
the UK did likewise to analyse the cost effectiveness
of the Department of Trade’s Overseas Trade Serv-
ices export services (DTLR, 2002). Noh and Lee
(2003) used criteria of time, area, irreversibility and
scientific uncertainty to evaluate eight alternative
impact categories, namely: abiotic resources deple-
tion; global warming; ozone layer depletion; eutro-
phication; acidification; photochemical oxidant
creation; ecotoxicity; and, human toxicity. Rivett
(2000) used MCA to decide between four alternate
options for the Kuranda Range Road upgrade in Far
North Queensland. Using environmental sustainabil-
ity, transport efficiency, social/amenity, and cost as
criteria, weightings were applied through community
and expert consultation for attributes including:
important area for plants; ecological processes; con-
struction issues; accommodate freight efficient
vehicles; closures, delays; important areas for scenic
amenity; noise environment; and, net present cost on
a whole-of-project basis (Rivett, 2000). The general
approach for MCA is as follows (some steps do not
apply in this case, e.g. 2):
1. Identify overall desired outcomes for the project;
2. Identify alternative solutions including the no-go
option;
3. Identify and measure values that may be impacted
upon by the options and convert these to
evaluation criteria (present in the form of pack-
ages of criteria, attributes and elements);
4. Measure the impact of the project on these values
or packages of attributes by way of technical
studies or preference surveys;
5. Score and weight the impacts relative to a
particular characteristic of the evaluation criteria,
e.g. Area of native forest and relative significance
of the species affected;

Table 3
Multiple criteria analysis (MCA) models 1, 2 and 3 with selected
criteria and maximum weightings allocated (panelists could choose
a lesser weight than that suggested but not a greater weight)
Maximum weight
Model 1 criteria ‘Anthropocentric’
Essential to human life 6
Essential component of
ecosystem health
4
Essential for maintenance
of natural capital
2
Desirable but not essential
for human well-being
5
Desirable but not essential
for ecosystem health
3
Desirable but not essential
for maintenance of natural capital
1
Model 2 criteria ‘Utilitarian’
Direct use value 6
Indirect use value 4
Option use value 2
Option non-use value 5
Bequest non-use value 3
Existence non-use value 1
Model 3 criteria ‘Balanced Sensitivity’
Threats � 4
Risk � 3
Uncertainty � 2
Precaution � 1
Ecosystem resistance 7.5
Ecosystem resilience 7.5
I.A. Curtis / Ecological Economics 50 (2004) 163–194172
6. Standardise the scores (e.g. � 5 to + 5. with � 5
being the worst, and 0, no change), the sign
indicating the direction of the impact, and the
integer the relative magnitude of the impact;
7. Determine overall scores for each option;
8. Undertake a sensitivity analysis including weight-
ings of each package of criteria (a positive
fraction adding up to one) to test robustness;
9. Iteration in order to refine alternatives; and,
10. Results (decision-making) (Rivett, 2000: 4–7).
These steps were followed as much as was consis-
tent with the evaluation of individual EGS within an
overall suite of EGS, rather than choosing between
alternate policies or proposals, as is the main appli-
cation of MCA. The MCA application in this study
could thus be described as more closely resembling
multi-attribute utility theory.
The models were in Microsoft Exceln format
and each consisted of 20 ecosystem attributes
(Table 1) with six criteria and suggested maximum
weightings (Table 3), generating a matrix of 120
cells for each model (see e.g. Appendix A). The
criteria for Model 1 were anthropocentric, economic
and ecological. ‘Essential’ or ‘desirable’ for human
life support were given the maximum weightings in
this model, followed by the ecological criteria, and
then economic. These criteria were cognitive, that is
to say, inductive reasoning was used to determine
appropriate choices after a study of the literature
(see for example: Hawken, 1995; Meffe and Car-
roll, 1999). There were 20 ecosystem attributes, and
in order to get a total of 100, or 100% of EGS, the
nominal weight for each of them had to be 5. The
panel was told that they could ascribe a lesser
weight than that nominated to any attribute, but
not a greater weight. Irrespective of what weight
the panelist ascribed to an attribute, they were
normalised to 5, and then 1, thus providing impor-
tance rankings. In the first model, ‘Essential for
human life’, although an anthropocentric view is
clearly more important than ‘desirable for ecosys-
tem health’. Criteria for Model 2 were economic, to
do with intergenerational equity (bequest), and
spiritual, aesthetic (existence value). These criteria
are the main components of the economic approach
to environmental valuation, hence the utilitarian
model was reductionist rather than holistic in rank-
ing criteria in terms of tangibility, i.e. use>non-use
(see Nunes and van den Bergh, 2001). Model 3 had
criteria that were essentially to do with risk and
uncertainty, which are important elements of sys-
tematic analysis. Risk is best dealt with by a
sensitivity analysis, however uncertainty is some-
what more complex. In this model the criteria of
‘threats’ and ‘precaution’ were included to ‘round
off’ the negative values or deleterious criteria in the
model, which were then offset by the positive
qualities of ‘resistance’ and ‘resilience’. Hence the
sensitivity model ranked the negative aspects in
order of their prominence in ecology, clearly a
threat is greater than a risk, and a risk greater than
an uncertainty. This model had negative weights for
the negative criteria, and equal positive weights for
ecosystem resistance and resilience, however selec-
tion of maximum weights for all criteria would still

I.A. Curtis / Ecological Economics 50 (2004) 163–194 173
result in the nominal weight of + 5. The selection
of criteria for this model (3) could be argued to be
the essential criteria for ecosystem sustainability
(Appendix B).
The results for each model were subjected to
statistical analysis using Kendall’s Coefficient of
Concordance (Blalock and Blalock, 1968; Hicks,
1999; Zar, 1996). The coefficient W permits the
evaluation of the extent of concordance or agreement
between three or more sets of data. It has the value 1.0
if the groups agree perfectly and 0.0 if they disagree
maximally. A more common use of Kendall’s W is to
express the intensity of agreement among several
rankings or as a measure of the agreement of rankings
within blocks. To determine if a calculated sample W
is significant, i.e. if it represents an association dif-
ferent from zero in concordance, the relationship
between the Kendall Coefficient of Concordance
(W) and the Friedman chi-square v r2 is used:
v2r ¼ Mðn� 1ÞW :
where M= the number of variables, n= the size of the
sample, and employing the table of critical values for
vr2 (Zar, 1996).
For the models, each panelists’ set of total weight-
ings for each of the 20 attributes in each model was
statistically analysed for the coefficient of concor-
dance with every other panelists’ set of weightings
(all disciplines), in addition to those of each disci-
pline, ‘all economists’ and ‘all natural scientists’. For
Models 1 and 2, where all values were positive, the
coefficient of variance of the mean values of all
panelists’ weightings was also calculated. On the
proviso that there was significant concordance be-
tween the sets of weightings provided by the expert
panel for the attribute/criteria in each model, the mean
weighting of the panelists’ weightings for each attri-
bute in models one and two was then normalised to a
total of 100 (20 attributes multiplied by a nominal
weighting of + 5). The mean results of Model 3
(sensitivity) were then ranked as continuous positive
scores and normalised for each attribute to a decimal
totalling one for all attributes. Finally the mean result
for each attribute for Models 1 and 2 was multiplied
by the normalised score for Model 3 to reflect
sensitivity. The final result was carried forward to
the valuation table as the ‘final weight’ for each
attribute in the full suite of ecosystem services.
4. The Delphi Inquiry
The Delphi Technique was first used by the Rand
Corporation in the USA in the early 1950s as a futures
forecasting tool (Cunliffe, 2002), and has since then
been extensively used by researchers, where it is, as
described by Kaynak and Macauley (1984, p. 88): ‘‘a
unique method of eliciting and refining group judge-
ment based on the rationale that a group of experts is
better than one expert when exact knowledge is not
available’’. Miller (2001) used a Delphi survey to
develop indicators for sustainable tourism, and Cun-
liffe (2002) used the technique to forecast risks in the
tourism industry. A Kantian, or ‘contributory’ Delphi,
attempts to design a structure that allows many
‘informed’ individuals in different disciplines or spe-
cialties to contribute information or judgements to a
problem area that is much broader in scope than the
knowledge that any one of the individuals possesses.
It is therefore a form of utilisation of the collective
human intelligence capability that includes attitudes
and feelings, and is part of the process of human
motivation and action (Linstone and Turoff, 1975;
Helmer, 1975; Mitroff and Turoff, 1975; Scheele,
1975; Dick, 1990; Miller, 2001; Cunliffe, 2002).
Some situations where Delphi is useful, features of
Delphi and the phases of the Inquiry are shown in
Table 4.
A group of about 50 ‘experts’ were recruited on
the basis of a ‘stated’ interest in the topic from the
disciplines of neo-classical economics; environmen-
tal economics; ecological economics; geography;
natural resource management; ecology, and environ-
mental science. The panelists were asked to confirm
the category under which they nominated, and there
was a degree of overlapping disciplines, which
explains the apparent discrepancy in N in later tables
in the results section. The Delphi Inquiry was
conducted over a 6-month period ending October
2002, using a purpose-designed web site, which
required the panelist to log-in with user-name and
password, and preserved individual anonymity. The
Delphi comprised four rounds where the panelists
were required to contribute, followed by feedback

Table 4
Situations where a Delphi Inquiry is useful, features and phases of Delphi
Where Delphi is useful Features of Delphi Four distinct phases
The problem does not lend itself to
precise analytical techniques but
can benefit from subjective
judgements on a collective basis
Some feedback of individual
contributions of information
and knowledge
Exploration of the subject under discussion,
each member of the panel contributes
additional information pertinent to the issue
More individuals are needed than
can effectively and cost-efficiently
interact face to face.
Some assessment of the
group judgement or view
Process of reaching an understanding as to
how the group views the issue, including
agreement or not and meaning of any
relative terms (i.e. significance)
Refereeing and anonymity ensure
minimal bias
Some opportunity for
individuals to revise views
Address any disagreement, underlying
reasons, evaluate them
Heterogeneity of the participants is
preserved to avoid the bandwagon effect.
Some degree of anonymity
for the individual responses
Final phase. All previous information
analysed and feedback has taken place.
Source: Linstone and Turoff, 1975; Helmer, 1975; Mitroff and Turoff, 1975; Scheele, 1975; Dick, 1990; Miller, 2001; Cunliffe, 2002.
I.A. Curtis / Ecological Economics 50 (2004) 163–194174
immediately after each round was closed, or includ-
ed in the preamble to the next round. Two further
rounds followed where there was no requirement to
contribute. In addition to a series of both open-
ended and closed-ended questions/statements to do
with the topic, the panelists were presented with the
three MCA models outlined previously. The intro-
ductory round one consisted of 41 questions; round
2, 9 questions and model 1; round 3, 10 questions
and model 2; and round 4, no questions and model
3. The questions or statements generally came from
the literature, and either required a true or false
response or a text response.
The panelists’ responses were again tested for
the level of consensus by way of Kendall’s Coef-
ficient of Concordance (Kendall’s W). For the
questionnaires, the panelists were grouped into the
seven nominated disciplinary categories and fre-
quencies of ‘true’ responses for each set of ques-
tions for each panelist and for each disciplinary
category were calculated and the level of agreement
tested using Kendall’s W. Each pair of disciplines’
set of responses was also tested using the Wilcoxon
Signed Ranks test to show the highest significance
(by way of) extent of agreement, between the
disciplines.
4.1. The conceptual model
Indicators for ecological integrity at the most
obvious level are the naturalness of the environment,
i.e. spatial and temporal distance from disturbance
and the health of vegetation. At the less obvious
level, indicators such as feeding guilds or functional
groups of saproxylic insects may have relevance to
understanding the relationship between ecosystem
function and biodiversity (Grove, 2000). For exam-
ple, the emerging pattern from studies is that in
general logged forests support less species-rich
assemblages, with fewer individuals overall, and also
a different species composition compared to old
growth forest. The purpose of this research is to
develop a new or modified approach to valuing the
environment that will have wide application and can
be readily implemented when it is necessary to
consider the value of intangibles in systematic anal-
yses to do with development. The time-frame for
this type of analysis, depending on the scale of
development is usually measured in weeks to
months. It would thus be counterproductive to
suggest that the less obvious indicators of ecosystem
integrity, such as saproxylic beetle assemblages be
used. This type of study requires a dedicated re-
searcher and assistants for an extended period of
about 3–4 years. The development of the valuation
table and conceptual models in this section are
postulated on this assumption, and that of Lugo
(1988), and the work of Holdridge (1967) and
Holdridge et al. (1971) and Lugo’s (1988) work
with Brown. ‘‘Statistically significant relationships
suggest that life zone conditions relate to character-
istic numbers of tree species, biomass and rate of
primary productivity, and capacity to resist and
recover from disturbance’’ (Lugo, 1988:61). The

I.A. Curtis / Ecological Economics 50 (2004) 163–194 175
theory of island biogeography poses similar condi-
tions such as local extinction risk, rate of colonisa-
tion and species richness to habitat size and isolation
(MacArthur and Wilson, 1967; Dreschler and Wat-
zold, 2001). Focussing on general properties of
ecosystems such as species richness, common scales
that allow comparison between ecosystem integrity
in different ecosystems do exist. MacArthur and
Wilson (1967) related the species richness of an
island or in a habitat patch to the area, in the
function:
B ¼ S ¼ aAz
where the benefit (B) of an ecosystem is measured
by the species richness (S), which is itself a function
of area (A), with a some positive constant and the
exponent of A in the range 0.15–0.35, subject to
habitat type and taxonomy (MacArthur and Wilson,
1967; Dreschler and Watzold, 2001).
A valuation table was developed to determine the
level to which EGS were intact, for use with both
individual landholdings and landscapes. The former
was based upon observation, historical records and
empirical evidence from the proprietor or management
agency; and the latter requiring a conceptual model
based upon the literature as to what the defining
parameters were. An example of a completed valuation
table for one tenure category in the WTWHA (State
Forests) is included as Appendix B. It should be noted
that it is the valuer’s responsibility to determine, using
all means available, the appropriate and correct input to
Table 5
Results of Kendall’s W for Models 1, 2 and 3
Discipline Model 1 M
W N Sig. W
All disciplines 0.339 24 0.000 0
Neoclassical economists 0.589 4 0.001 0
Environmental economists 0.466 4 0.012 0
Ecological economists 0.246 8 0.007 0
All economists 0.331 16 0.000 0
Geographers and natural
resource managers
0.315 8 0.002 0
Ecologists 0.289 11 0.000 0
Environmental scientists 0.392 10 0.000 0
All natural scientists 0.298 29 0.000 0
The coefficient W permits the evaluation of the extent of concordance or ag
groups agree perfectly and 0.0 if they disagree maximally. The apparent d
the columns within an acceptable margin. From obser-
vation and consultation the valuer determines if the
individual ecosystem attribute is present or not present.
If it is not present, whether the absence is temporary or
permanent, and the type of disturbance, and if it is
present, the degree (upper limit and lower limit %) to
which it is intact or productive in the sense of provision
of EGS (esi in Eqs. (2) and (3)). The conceptual model
was developed using species richness, vegetation cov-
er, and/or either the Level of Protection (LOP model:
national park, conservation covenant, etc., Appendix
C), or the Land Use Characteristic (LUC model: open
forest, rangelands, etc., Appendix D), as measures of
how productive or intact the ecosystem services are on
a landscape scale (Holdridge, 1967; Holdridge et al.,
1971; Lugo, 1988; Mooney, 1988; WTMA, 2001).
In this new conceptual model the apex represents
100% (of species richness and vegetation cover) and
the basal apices, 0%. The level of protection decreases
towards each basal apex, as the level of disturbance
increases towards each basal apex. In order to reflect
the economic concept of scarcity, capitalisation rates
increased as the level of protection decreased and the
level of disturbance increased from the centre of the
base outwards to the basal apices. The defining
parameters for both the individual model and the
landscape model were:
1. The highest vegetation cover (closed canopy
forest) and hence species richness is in tropical
rainforest;
odel 2 Model 3
N Sig. W N Sig.
.134 20 0.000 0.295 25 0.000
.289 5 0.094 0.262 5 0.165
.320 5 0.047 0.246 8 0.007
.147 9 0.156 0.479 8 0.000
.175 19 0.000 0.331 16 0.000
.464 8 0.000 0.338 7 0.001
.129 8 0.420 0.333 11 0.000
.230 9 0.004 0.355 11 0.000
.206 25 0.000 0.319 29 0.000
reement between three or more sets of data. It has the value 1.0 if the
iscrepancy in N values is due to discipline overlap.

Table 6
Results of Kendall’s coefficient of concordance for the mean of each
discipline’s weightings for the attributes/criteria in each model
Discipline Friedmans v2 Kendall’s W N Significance
Model 1 Anthropocentric Perspective
All disciplines 109.638 0.824 7 0.000
All economists 48.748 0.856 3 0.000
All scientists 66.365 0.873 4 0.000
Model 2 Utilitarian Perspective
All disciplines 101.130 0.760 7 0.000
All economists 49.145 0.862 3 0.000
All scientists 60.017 0.790 4 0.000
Model 3 Balanced Sensitivity
All disciplines 98.697 0.742 7 0.000
All economists 39.570 0.694 3 0.004
All scientists 66.581 0.876 4 0.000
I.A. Curtis / Ecological Economics 50 (2004) 163–194176
2. As the canopy cover decreases so also does species
richness. The following approximate relationships
apply (in comparison to tropical rainforests):� moist tropical forestfspecies richness: 60–
80%� dry tropical forestf species richness: 30–50%
Table 7
Final weights for the ecosystem attributes (goods and services)
Attribute Model 1 Model 2 Mean 1 and 2
Biodiversity 5.46 5.34 5.40
Refugia 4.92 4.79 4.86
Erosion control 5.02 4.91 4.97
Genetic resources 4.75 5.26 5.01
Gas regulation 6.22 5.79 6.01
Climate regulation 5.80 5.17 5.49
Biological control 4.89 4.81 4.85
Purification 5.44 5.36 5.40
Disturbance regulation 5.14 4.66 4.90
Aesthetics 3.71 4.85 4.28
Assimilation of waste 5.19 5.08 5.14
Water supply 5.68 5.53 5.61
Nutrient cycling 5.66 5.04 5.35
Pollination 5.02 4.44 4.73
Other non-use values 3.00 3.63 3.32
Raw materials 4.70 5.23 4.97
Recreation opportunities 3.49 4.96 4.23
Food production 5.29 5.06 5.18
Water regulation 5.75 5.32 5.54
Soil formation 4.87 4.78 4.83
101 102.1 100.01
The nominal weighting of 5 for each ecosystem attribute adds up to 100 fo
the weightings ascribed by the panelists for each model were also norma
� temperate zonef species richness: 20–40%� Mediterranean zonef species richness:
40–60%;
3. The ratio of species richness to vegetation cover is
generally 2:3, with the exception of Mediterranean
zones, where it is generally 1:1;
4. The lowest level of provision of ecosystem services in
the models on a landscape scale is 39%, which
includes urban landscapes and deserts (Mooney,
1988).
The alternate conceptual model (LUC) should yield
similar results to the LOPmodel, however allows wider
application with choices of land use characteristic
along the base of the triangle from the centre towards
the basal apices, due to either human-induced or
climate-induced modification (Appendix D).
5. Results and discussion
In the first three rounds of the Delphi the frequency
of ‘true’ answers to the questionnaire were highly
Model 3 Importance/
rank Model 3
Normalised
rank
Weight Final
weight
� 2.62 9.14 0.092 0.497 0.099
� 2.30 8.82 0.089 0.431 0.086
� 0.74 7.26 0.073 0.363 0.073
� 0.68 7.20 0.072 0.363 0.073
0.82 5.70 0.057 0.345 0.069
0.34 6.18 0.062 0.341 0.068
0.04 6.48 0.065 0.316 0.063
1.20 5.32 0.054 0.289 0.058
0.90 5.62 0.057 0.277 0.055
0.20 6.32 0.064 0.272 0.054
1.62 4.90 0.049 0.253 0.051
2.70 3.82 0.038 0.216 0.043
2.88 3.64 0.037 0.196 0.039
2.78 3.74 0.038 0.178 0.036
1.60 4.92 0.050 0.164 0.033
3.60 2.92 0.029 0.146 0.029
3.60 2.92 0.029 0.124 0.025
4.18 2.34 0.024 0.122 0.024
5.52 1.00 0.010 0.056 0.011
5.44 1.08 0.011 0.052 0.010
99.32 1.000 5.003 1.001
r all 20 attributes, or 100% of the full suite of services. Accordingly,
lised to a total of 100.

Table 8
Relative rankings of the attributes for each of the models
Attribute Model
1
Model
2
Mean
Models
1 and 2
Model
3
Final
importance
rank
Stabilisation services
Gas regulation 1 1 1 8 5
Climate
regulation
2 8 4 7 6
Disturbance
regulation
10 18 13 9 9
Water regulation
(hydrological
cycle)
3 5 3 20 19
Erosion control
and soil
retention
11 13 12 3 3
Biological control 14 15 15 5 7
Refugia 13 16 14 2 2
Regeneration services
Soil formation 15 17 16 19 20
Nutrient cycling
and storage
5 11 7 15 13
Assimilation
of waste
9 9 9 12 11
Purification
(clean air, water)
7 3 5 10 8
Pollination
(movement
of gametes)
12 19 17 14 14
Biodiversity 6 4 6 1 1
Production of goods
Water supply
(catchment)
4 2 2 13 12
Food production 8 10 8 18 18
Raw materials 17 7 11 16 16
Genetic resources 16 6 10 4 4
Life fulfilling services
Recreation
opportunities
19 12 19 17 17
Aesthetic, cultural
and spiritual
18 14 18 6 10
Other non-use
values
(bequest, etc.)
20 20 20 11 15
I.A. Curtis / Ecological Economics 50 (2004) 163–194 177
significant (P < 0.000. Kendall’s W= 0.814; 0.747;
0.868).
More than 80% of respondents thought that there
was a justifiable lack of confidence in past and current
methods used to value the environment. Ninety four
percent of the panelists agreed that human activities
were beginning to affect ecological life support sys-
tems, and 91% answered true to statements to do with
the merit of inclusion of ecosystem goods and services
in the market system. The group was also in favour of
market-based instruments and policy measures to
address global inequities. Answers to the open-ended
questions (text answers) showed very strong support
for attempts to value the environment, yet recognised
the difficulties inherent in using people’s expressed
preferences as a measure. The most important issues
raised to do with placing a value on the environment
were education, knowledge, information and under-
standing. Future trading markets in EGS were seen by
most to be an aid to financing conservation provided
they were set up properly, with a division of opinion
as to whether global markets would capture them, and
if that was a good thing. Testing each pair of sets of
responses to the closed-ended questions using the
Wilcoxon Signed Ranks test showed the highest
significance (by way of) extent of agreement, between
Natural Resource Managers and Ecologists (P>
0.002); followed by Ecological Economists and Ecol-
ogists (P>0.033); Neoclassical Economists and Eco-
logical Economists ( P>0.035); Geographers and
Ecologists (P>0.043) and finally Environmental
Economists and Ecological Economists (P>.045).
The other 16 pairings were not significant. The 60
questions and the true/false and text responses from
the panel are too extensive for inclusion in this paper
and will be published separately.
For the three multiple criteria models, Kendall’s W
revealed a significant level of agreement between the
panelists in all but a few cases where N was small
(Table 5). However, the individual panelist’s set of
weightings for each attribute in the models was
analysed for concordance with every other panelists’
set of weightings, resulting in lower levels of concor-
dance, although still significantly different to ‘no
agreement’. Taking the mean of the panelists’ weight-
ings for the attributes in each model, and comparing
the level of agreement between disciplines, resulted in
levels of concordance much closer to one. The effect
of ‘smoothing’ the data by taking the mean reflects the
group’s collective weighting for the attribute, and not
the individual’s weighting, and the significance of the
statistical comparison between disciplines of their
mean weighting, reflects the group concordance,
which was very high (Table 6).

I.A. Curtis / Ecological Economics 50 (2004) 163–194178
In Model 1 the coefficient of variance was lowest
for gas regulation, and highest for the three life-
fulfilling attributes, recreation, aesthetics and other
non-use values (bequest, existence, option). In model
2 the coefficient of variance was lowest for gas
regulation and biodiversity, and highest for pollina-
tion, aesthetics and other non-use values. While in
model 3, which had some negative values and the
coefficient of variance statistic did not apply: the
range was smallest for erosion control, biological
control and biodiversity, and largest for climate
regulation, recreation and other non-uses values.
Clearly a higher degree of uncertainty existed with
the panelists when it came to providing weightings,
or ranking attributes, when they were most intangi-
ble such as the life-fulfilling services, although
recreation is possibly the one EGS that has been
most valued. One could conclude from these results,
one or all of three things: In the absence of complete
information it is not possible to make a rational
judgement; that humans are more certain about the
services that provide ‘real’ benefits, rather than those
that provide ‘psychological’ benefits; and that there
is still a lack of confidence in past methods used to
value the environment, with recreation being the
most valued attribute using neo-classical methods,
yet the panelists showed a higher degree of uncer-
tainty in weighting this attribute than most other
attributes that have never been valued by any
previous method. The final weighting for each
attribute for each model, and final overall weight
calculated in accordance with the methodology are
given in Table 7.
The weights were expressed as final ranks for
each attribute for each model and final overall rank
Table 9
Capitalisation rates and conceptual models used to determine upper and l
Tenure category Capitalisation
rate (%)
Co
National parks 6.50 LO
State forests 7.00 LO
Timber reserves 7.50 LO
Various reserves and dams 7.50 LO
Unallocated state land 7.75 LO
Leasehold land 8.00 LO
Freehold and similar 8.25 LO
Roads, esplanades, railways 9.00 LO
Rivers 7.50 LO
in Table 8 for discussion purposes. Criteria for the
first model were anthropocentric, biophysical and
economic, however, the maximum weights were
assigned to the anthropocentric criteria (Essential
for human life, and desirable but not essential for
human life). Ecosystem health was ranked second
most important as being essential for planetary life
support, and maintenance of natural capital, a
surrogate for intergenerational equity. Model 1
results indicate that humans ascribe most value to
a stable atmosphere and climate, clean air and
water, the capacity of the environment to cycle
and assimilate nutrients and pollutants, biodiversity
and food production. Model 2 criteria consisted of
direct and indirect use, non-use, option, bequest and
existence values. In this model, while the results
are similar in many ways, climate was seen to be
less important, and raw materials and genetic
resources more important, which is consistent with
the utilitarian perspective. Model 3, which dealt
with threats, risk, uncertainty, precaution and the
resistance and resilience of ecosystems, provides a
rather different perspective, with higher importance
given to biodiversity, refugia, biological control,
genetic resources, and erosion control and soil
retention. These are clearly ecosystem attributes that
are endangered in one way or another. Finally the
result of the sensitivity analysis qualifies the results
in terms of the non-pecuniary preference values
ascribed by the panelists with the highest ranking
given to attributes that are either endangered or
essential for human life, or both. Interestingly an
insight into human value preferences for the present
as opposed to the future is also evidenced here,
with attributes such as ‘soil formation’ shown as
ower limits of provision of ecosystem services
nceptual models used (Appendix E) Upper and lower
limits (%)
P E1 and E2 99 and 92
P E2 and E3 92 and 84
P E3 and E4, LUC E5 and E6 84 and 66
P E4, LUC E5 79 and 66
P E7, LOP E4, LUC E5 72 and 56
P E4 and E7 66 and 56
P E4 and E8, LUC E9 66 and 48
P E8 and E10, LUC E9 and E11 48 and 39
P E3 and E8, LUC E9 84 and 48
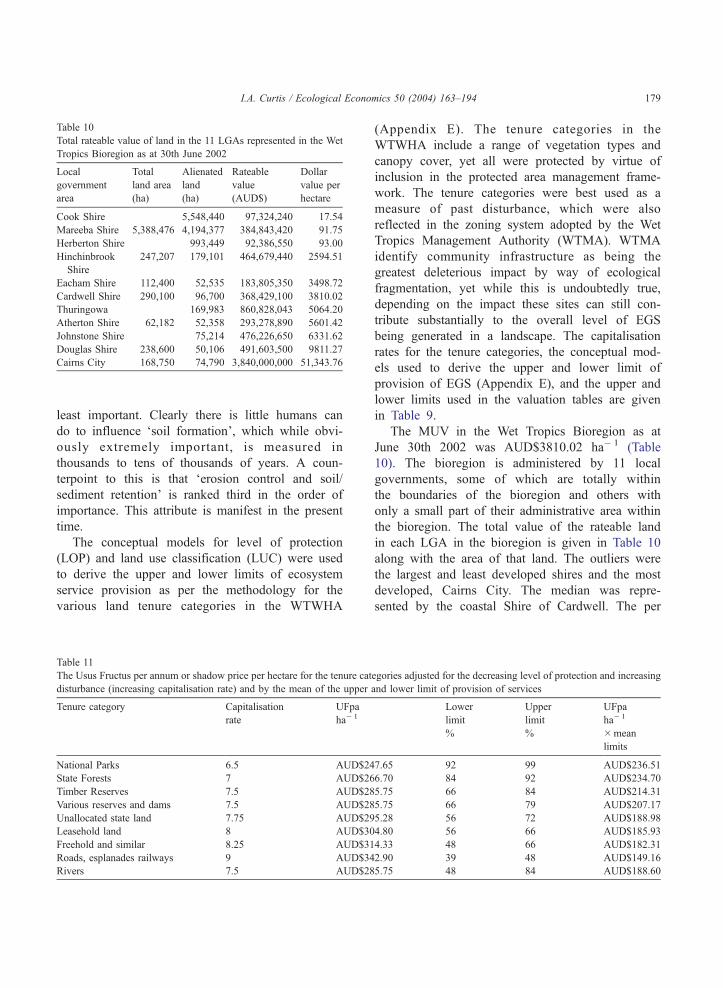
Table 10
Total rateable value of land in the 11 LGAs represented in the Wet
Tropics Bioregion as at 30th June 2002
Local
government
area
Total
land area
(ha)
Alienated
land
(ha)
Rateable
value
(AUD$)
Dollar
value per
hectare
Cook Shire 5,548,440 97,324,240 17.54
Mareeba Shire 5,388,476 4,194,377 384,843,420 91.75
Herberton Shire 993,449 92,386,550 93.00
Hinchinbrook
Shire
247,207 179,101 464,679,440 2594.51
Eacham Shire 112,400 52,535 183,805,350 3498.72
Cardwell Shire 290,100 96,700 368,429,100 3810.02
Thuringowa 169,983 860,828,043 5064.20
Atherton Shire 62,182 52,358 293,278,890 5601.42
Johnstone Shire 75,214 476,226,650 6331.62
Douglas Shire 238,600 50,106 491,603,500 9811.27
Cairns City 168,750 74,790 3,840,000,000 51,343.76
I.A. Curtis / Ecological Economics 50 (2004) 163–194 179
least important. Clearly there is little humans can
do to influence ‘soil formation’, which while obvi-
ously extremely important, is measured in
thousands to tens of thousands of years. A coun-
terpoint to this is that ‘erosion control and soil/
sediment retention’ is ranked third in the order of
importance. This attribute is manifest in the present
time.
The conceptual models for level of protection
(LOP) and land use classification (LUC) were used
to derive the upper and lower limits of ecosystem
service provision as per the methodology for the
various land tenure categories in the WTWHA
Table 11
The Usus Fructus per annum or shadow price per hectare for the tenure cat
disturbance (increasing capitalisation rate) and by the mean of the upper
Tenure category Capitalisation
rate
UFpa
ha� 1
National Parks 6.5 AUD$24
State Forests 7 AUD$26
Timber Reserves 7.5 AUD$28
Various reserves and dams 7.5 AUD$28
Unallocated state land 7.75 AUD$29
Leasehold land 8 AUD$30
Freehold and similar 8.25 AUD$31
Roads, esplanades railways 9 AUD$34
Rivers 7.5 AUD$28
(Appendix E). The tenure categories in the
WTWHA include a range of vegetation types and
canopy cover, yet all were protected by virtue of
inclusion in the protected area management frame-
work. The tenure categories were best used as a
measure of past disturbance, which were also
reflected in the zoning system adopted by the Wet
Tropics Management Authority (WTMA). WTMA
identify community infrastructure as being the
greatest deleterious impact by way of ecological
fragmentation, yet while this is undoubtedly true,
depending on the impact these sites can still con-
tribute substantially to the overall level of EGS
being generated in a landscape. The capitalisation
rates for the tenure categories, the conceptual mod-
els used to derive the upper and lower limit of
provision of EGS (Appendix E), and the upper and
lower limits used in the valuation tables are given
in Table 9.
The MUV in the Wet Tropics Bioregion as at
June 30th 2002 was AUD$3810.02 ha� 1 (Table
10). The bioregion is administered by 11 local
governments, some of which are totally within
the boundaries of the bioregion and others with
only a small part of their administrative area within
the bioregion. The total value of the rateable land
in each LGA in the bioregion is given in Table 10
along with the area of that land. The outliers were
the largest and least developed shires and the most
developed, Cairns City. The median was repre-
sented by the coastal Shire of Cardwell. The per
egories adjusted for the decreasing level of protection and increasing
and lower limit of provision of services
Lower
limit
%
Upper
limit
%
UFpa
ha� 1
�mean
limits
7.65 92 99 AUD$236.51
6.70 84 92 AUD$234.70
5.75 66 84 AUD$214.31
5.75 66 79 AUD$207.17
5.28 56 72 AUD$188.98
4.80 56 66 AUD$185.93
4.33 48 66 AUD$182.31
2.90 39 48 AUD$149.16
5.75 48 84 AUD$188.60

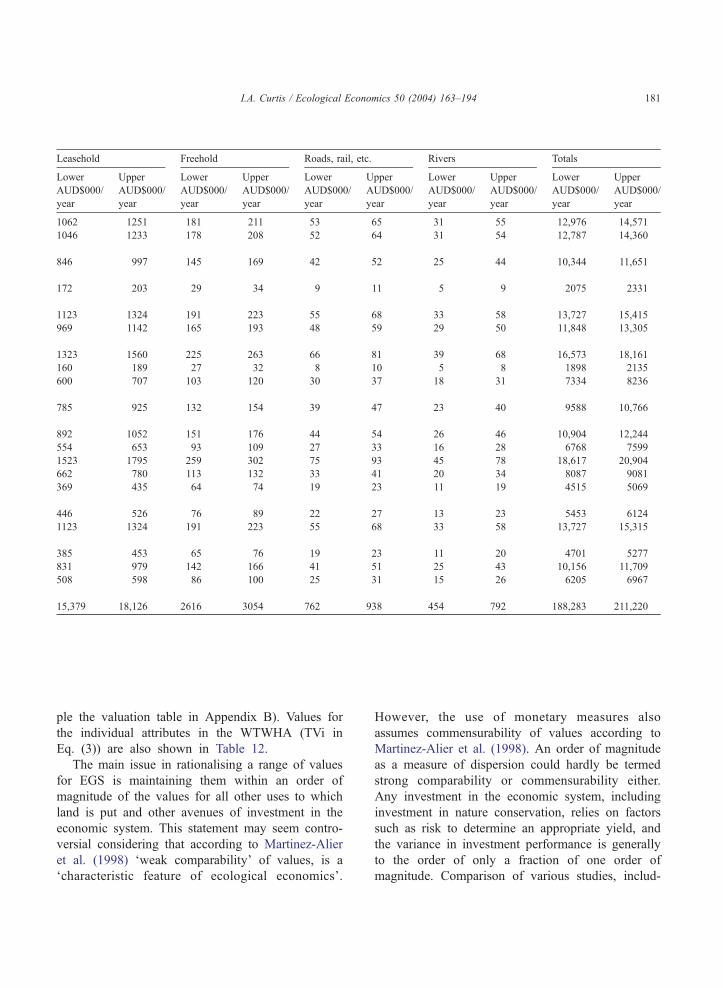
Table 12
Annual values or shadow prices of the individual ecosystem goods and services (attributes) totaled for all the tenure categories in the WTWHA
Ecosystem National Parks State Forests Timber Reserves Var Res and dams Unallocated land
good or
service/
attribute
Lower
AUD$000/
year
Upper
AUD$000/
year
Lower
AUD$000/
year
Upper
AUD$000/
year
Lower
AUD$000/
year
Upper
AUD$000/
year
Lower
AUD$000/
year
Upper
AUD$000/
year
Lower
AUD$000/
year
Upper
AUD$000/
year
Gas regulation 4492 4834 5369 5880 965 1228 133 159 690 888
Climate
regulation
4427 4764 5291 5795 951 1210 131 157 680 875
Disturbance
regulation
3581 3853 4279 4721 769 979 107 128 550 708
Water
regulation
716 771 856 937 154 196 22 26 112 144
Erosion control 4753 5114 5680 6221 1021 1300 141 168 730 939
Biological
control
4102 4414 4902 5369 881 1121 122 146 630 811
Refugia 5999 6025 6691 7329 1203 1531 166 198 861 1106
Soil formation 651 701 778 852 145 185 20 24 104 134
Nutrient
cycling
2539 2732 3034 3323 545 694 75 90 390 502
Assimilation
of waste
3321 3573 3968 4346 713 908 97 117 510 656
Purification 3776 4063 4513 4942 811 1032 111 133 580 746
Pollination 2344 2522 2801 3068 504 641 69 82 360 463
Biodiversity 6445 6936 7703 8436 1385 1762 191 228 991 1274
Water supply 2799 3012 3346 3664 601 765 83 100 430 553
Food
production
1562 1681 1867 2045 336 427 47 56 240 309
Raw materials 1888 2032 2256 2471 406 516 56 67 290 373
Genetic
resources
4753 5114 5680 6221 1021 1200 141 168 730 939
Recreation 1628 1751 1945 2130 350 445 48 57 250 322
Aesthetic, 3516 3783 4201 4636 755 961 105 125 540 965
Other non-use
values
2148 2312 2568 2812 462 587 63 76 330 425
Totals 65,440 69,987 77,728 85,198 13,978 17,688 1928 2305 9998 13,132
This table should be read in conjunction with Tables 2 and 11, which provide the area (ha) of the tenure categories, the capitalisation rate, the
UFpa, the upper and lower limits (%) and the UFpa adjusted for the level of provision of ecosystem services. The UFpa across tenures thus
ranges from AUD$210 to AUD$236 per ha pa, and within tenures from AUD$247.65 to 342.90 per ha pa before adjustment (i.e. 100%
provision), and AUD$149.16 to AUD$236.51 per ha pa after adjustment.
I.A. Curtis / Ecological Economics 50 (2004) 163–194180
hectare value or shadow price for the full suite
of ecosystem goods and services, or UFpa ha� 1
(Eq. (1)) , s tar ts a t AUD$247.65 year� 1
(AUD$3810.02� 6.5%) for the National Parks,
and increases for the tenure categories with in-
creasing capitalisation rates to reflect scarcity as
the level of protection decreases, disturbance
increases and the level of provision of EGS
decreases (Table 11). The level of provision of
EGS (or the extent to which they are intact) was
determined using the conceptual models. It should
be noted, however, that higher capitalisation rates
are offset by lower levels of provision of EGS, e.g.
remnant vegetation is most at risk, but by defini-
tion, there is less of it. Finally, using the valuation
tables and the complete methodology, the total
value of ecosystem goods and services in the
WTWHA (TVw in Eq. (2)) was determined to
be in the range AUD$188 million to AUD$211
million year� 1 (Table 12). Values for individual
attributes, if present, depend on the weight
assigned and the level of provision (see for exam-
Leasehold Freehold Roads, rail, etc. Rivers Totals
Lower
AUD$000/
year
Upper
AUD$000/
year
Lower
AUD$000/
year
Upper
AUD$000/
year
Lower
AUD$000/
year
Upper
AUD$000/
year
Lower
AUD$000/
year
Upper
AUD$000/
year
Lower
AUD$000/
year
Upper
AUD$000/
year
1062 1251 181 211 53 65 31 55 12,976 14,571
1046 1233 178 208 52 64 31 54 12,787 14,360
846 997 145 169 42 52 25 44 10,344 11,651
172 203 29 34 9 11 5 9 2075 2331
1123 1324 191 223 55 68 33 58 13,727 15,415
969 1142 165 193 48 59 29 50 11,848 13,305
1323 1560 225 263 66 81 39 68 16,573 18,161
160 189 27 32 8 10 5 8 1898 2135
600 707 103 120 30 37 18 31 7334 8236
785 925 132 154 39 47 23 40 9588 10,766
892 1052 151 176 44 54 26 46 10,904 12,244
554 653 93 109 27 33 16 28 6768 7599
1523 1795 259 302 75 93 45 78 18,617 20,904
662 780 113 132 33 41 20 34 8087 9081
369 435 64 74 19 23 11 19 4515 5069
446 526 76 89 22 27 13 23 5453 6124
1123 1324 191 223 55 68 33 58 13,727 15,315
385 453 65 76 19 23 11 20 4701 5277
831 979 142 166 41 51 25 43 10,156 11,709
508 598 86 100 25 31 15 26 6205 6967
15,379 18,126 2616 3054 762 938 454 792 188,283 211,220
I.A. Curtis / Ecological Economics 50 (2004) 163–194 181
ple the valuation table in Appendix B). Values for
the individual attributes in the WTWHA (TVi in
Eq. (3)) are also shown in Table 12.
The main issue in rationalising a range of values
for EGS is maintaining them within an order of
magnitude of the values for all other uses to which
land is put and other avenues of investment in the
economic system. This statement may seem contro-
versial considering that according to Martinez-Alier
et al. (1998) ‘weak comparability’ of values, is a
‘characteristic feature of ecological economics’.
However, the use of monetary measures also
assumes commensurability of values according to
Martinez-Alier et al. (1998). An order of magnitude
as a measure of dispersion could hardly be termed
strong comparability or commensurability either.
Any investment in the economic system, including
investment in nature conservation, relies on factors
such as risk to determine an appropriate yield, and
the variance in investment performance is generally
to the order of only a fraction of one order of
magnitude. Comparison of various studies, includ-
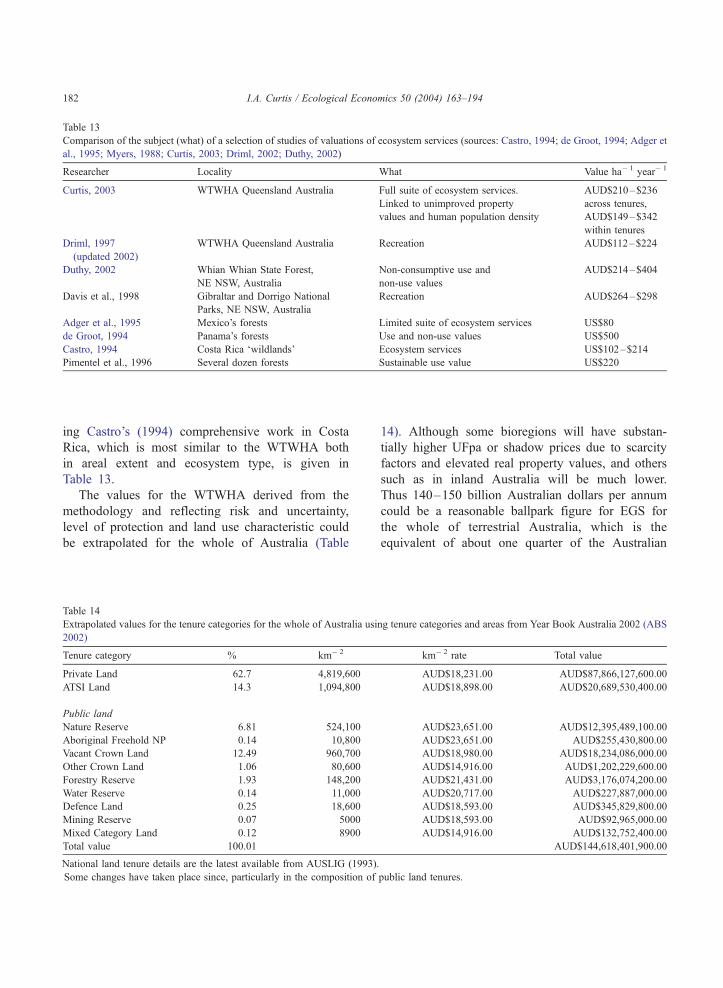
Table 13
Comparison of the subject (what) of a selection of studies of valuations of ecosystem services (sources: Castro, 1994; de Groot, 1994; Adger et
al., 1995; Myers, 1988; Curtis, 2003; Driml, 2002; Duthy, 2002)
Researcher Locality What Value ha� 1 year� 1
Curtis, 2003 WTWHA Queensland Australia Full suite of ecosystem services.
Linked to unimproved property
values and human population density
AUD$210–$236
across tenures,
AUD$149–$342
within tenures
Driml, 1997
(updated 2002)
WTWHA Queensland Australia Recreation AUD$112–$224
Duthy, 2002 Whian Whian State Forest,
NE NSW, Australia
Non-consumptive use and
non-use values
AUD$214–$404
Davis et al., 1998 Gibraltar and Dorrigo National
Parks, NE NSW, Australia
Recreation AUD$264–$298
Adger et al., 1995 Mexico’s forests Limited suite of ecosystem services US$80
de Groot, 1994 Panama’s forests Use and non-use values US$500
Castro, 1994 Costa Rica ‘wildlands’ Ecosystem services US$102–$214
Pimentel et al., 1996 Several dozen forests Sustainable use value US$220
I.A. Curtis / Ecological Economics 50 (2004) 163–194182
ing Castro’s (1994) comprehensive work in Costa
Rica, which is most similar to the WTWHA both
in areal extent and ecosystem type, is given in
Table 13.
The values for the WTWHA derived from the
methodology and reflecting risk and uncertainty,
level of protection and land use characteristic could
be extrapolated for the whole of Australia (Table
Table 14
Extrapolated values for the tenure categories for the whole of Australia usi
2002)
Tenure category % km� 2
Private Land 62.7 4,819,600
ATSI Land 14.3 1,094,800
Public land
Nature Reserve 6.81 524,100
Aboriginal Freehold NP 0.14 10,800
Vacant Crown Land 12.49 960,700
Other Crown Land 1.06 80,600
Forestry Reserve 1.93 148,200
Water Reserve 0.14 11,000
Defence Land 0.25 18,600
Mining Reserve 0.07 5000
Mixed Category Land 0.12 8900
Total value 100.01
National land tenure details are the latest available from AUSLIG (1993)
Some changes have taken place since, particularly in the composition of
14). Although some bioregions will have substan-
tially higher UFpa or shadow prices due to scarcity
factors and elevated real property values, and others
such as in inland Australia will be much lower.
Thus 140–150 billion Australian dollars per annum
could be a reasonable ballpark figure for EGS for
the whole of terrestrial Australia, which is the
equivalent of about one quarter of the Australian
ng tenure categories and areas from Year Book Australia 2002 (ABS
km� 2 rate Total value
AUD$18,231.00 AUD$87,866,127,600.00
AUD$18,898.00 AUD$20,689,530,400.00
AUD$23,651.00 AUD$12,395,489,100.00
AUD$23,651.00 AUD$255,430,800.00
AUD$18,980.00 AUD$18,234,086,000.00
AUD$14,916.00 AUD$1,202,229,600.00
AUD$21,431.00 AUD$3,176,074,200.00
AUD$20,717.00 AUD$227,887,000.00
AUD$18,593.00 AUD$345,829,800.00
AUD$18,593.00 AUD$92,965,000.00
AUD$14,916.00 AUD$132,752,400.00
AUD$144,618,401,900.00
.
public land tenures.

I.A. Curtis / Ecological Economics 50 (2004) 163–194 183
Gross Domestic Product for the year 2000–2001
(ABS, 2002). By comparison Costanza et al.
(1997b) estimated about 12 trillion US dollars for
the world’s terrestrial ecosystems, or about two
thirds of the then World’s GDP. However, this
study was widely criticised for a number of rea-
sons, one being the magnitude of the figure (Cork
and Shelton, 2000). Some of the values ascribed by
different researchers that were extrapolated for Cos-
tanza’s study for particular ecosystems were well
out of the ballpark. For example: wetlands
US$14,785 ha� 1 year� 1, and Lakes/Rivers
US$8,498 ha� 1 year� 1, and even tropical forests,
US$2,007 ha� 1 year� 1. Closer to the mark were
temperate forest US$307 ha� 1 year� 1 and grass/
rangelands US$232 ha� 1 year� 1.
The methods used to derive the values in this
study are in accord with the principles of both the
economic theory of value, which is based on price
theory and human preferences (Frank, 1991) and
the theory of valuation (which is based on actual
interplays in market situations), the combination of
which provides the empirical justification of the
research. Irrespective of whether the values of the
individual ecosystem attributes are adopted, a phil-
Fig. 3. Comparison of the values derived for various suites of
ecosystem services by various researchers (source: Castro, 1994; de
Groot, 1994; Adger et al., 1995; Costanza et al., 1997a; Myers,
1988; Curtis, 2003; Driml, 2002; Duthy, 2002).
osophical link between the value of land and its
productive function (UFpa) as a supplier of plane-
tary life support exists. However, what is less
certain is whether this link supports the values
derived by the very many and diverse contingency
valuation (CVM) and travel cost (TCM) studies, or
if it is the other way around. None of the CVM
and TCM studies have any fixed reference point or
longitudinal data set upon which to rely yet they
generally produce results to the same order of
magnitude as the UFpa in this study (Fig. 4).
How is this? It could mean that the preferences
that people reveal to purchase property for a
multitude of purposes are subconsciously expressed
when asked to bid for environmental protection of
their investment. Yet they are not to know, or be
able to compute the end result from their own
simple bid. It could be that the bid levels are
preordained to elicit a median or ‘expected’ re-
sponse, which will result in a value to the order of
the generally accepted magnitude. Some of the
values of individual attributes of the environment
revealed in this study can be compared with mar-
kets; for example, water, carbon (some trades have
taken place), and they are again to the same order
of magnitude. However, Driml’s (2002) valuation of
recreation in the WTWHA is an order of magnitude
larger than the values for the pertinent life-fulfilling
services (recreation and aesthetics) in this study,
which totalled AUD$15 to AUD$17 million year� 1
for the WTWHA as part of the whole suite of
services worth between AUD$188 and AUD$211
million year� 1. Likewise the benefit transfer of
recreation values derived for the Dorrigo and Gi-
braltar National Parks in northeastern NSW, Aus-
tralia, to Whian Whian State Forest suggested by
Duthy (2002), would have had the effect of dou-
bling the total estimate for all of the other non-
consumptive uses and non-uses in this forest.
Clearly, this one use, recreation, is not worth more
or as much as all of the others. The Delphi panel
was emphatic in this regard. Recreation was ranked
19th in model one, 12th in model two, and 17th in
model three, 17th overall. Aesthetics, cultural and
spiritual values fared better, being ranked 18th in
model one, 14th in model two and 6th in model
three, 10th overall. The TCM uses travel cost to
access a natural area as a surrogate for value.
I.A. Curtis / Ecological Economics 50 (2004) 163–194184
However, this beggars the question: the value of
what? The CVM describes a hypothetical market to
respondents to elicit their response to a scenario
that may impact on a natural area, but are they
being asked to value a specific attribute of the
environment that is being impacted or the whole
basket of EGS? Psychologically it is difficult for
respondents to separate out the, say, recreational
value and nominate a bid level, when in fact they
have absolutely no idea what other attributes there
are, what attributes are valuable and what values
apply to them. As a result, the imputed price
derived from studies of this kind is not just for
say, recreation, but everything the respondent con-
sciously or subconsciously perceives as being part
of the natural environment in question, and as such
it must include non-use values and option values.
The same logic can be applied to the TCM. If
‘weak comparability of values’ is a ‘foundation for
ecological economics’ (Martinez-Alier et al., 1998),
perhaps it is due to this esoteric notion by respond-
ents of what is being valued. The economic values
of the whole suite of EGS are constrained within
measures that are consistent with all other uses to
which land is put and other avenues of investment
in the economic system. The values of individual
EGS are constrained within this overall basket of
goods and services on a landscape or bioregional
scale; however, in some ecosystems certain goods
and services may be worth more than others based
on scarcity or limiting factors.
Transferability of the methodology expounded in
this paper to other bioregions requires advice from
the state agencies or LGs as to the rateable value
(UV) of land in the LGAs, and the area of that land,
as well as a landscape assessment for ecological
integrity. A minimum level of development is re-
quired in a bioregion by way of infrastructure for the
values to be comparable, and as the level of devel-
opment increases so do the values for EGS, which
reflects the economic concept of scarcity. Dobson et
al. (2001:1019–1026) conducted research on ‘under-
lying patterns of species diversity, the distribution of
threats to diversity (such as relative rates of habitat
loss)’, human population density, and the value of
land in different areas in five states in the USA. The
relationship between human population densities and
land values was exponential (R = 0.99; P < 0.001),
and there were similar strong relationships between
human population densities and numbers of endan-
gered species as well as numbers of alien species.
Dobson et al. (2001:1019) concluded that ‘protecting
wilderness is valuable and relatively easy’, however,
greater focus was required on areas that are of most
value to humans. Scott et al. (2001:999) found that
nature reserves are most often dedicated at higher
elevations with less productive soils, while an anal-
ysis of the distribution of plants and animals showed
that the greatest number of species was found at
lower elevations. Patterns of land ownership also
indicated that land at lower elevations was more
productive, and had been ‘extensively converted to
urban and agricultural uses’. The predominantly
private ownership of land at lower elevations and
coastal zones where human population densities were
highest, land values were highest, and thus EGS
more scarce, required that the private sector should
be involved in innovative strategies to capture the
full range of biodiversity. The population density of
the Wet Tropics Bioregion in 2002 was 22 persons
km� 2 (WTMA, 2001). A highly significant relation-
ship was found to exist between the population of
the 11 shires in the bioregion and the mean unim-
proved value of the land in each shire (R = 0.929;
P < 0.000). The comparability of the values for EGS
between and within bioregions using the methodol-
ogy expounded in this thesis is thus linked to human
population density and the level of development.
6. Conclusion
The values only apply to a certain point in time as the
components used to derive them are themselves varia-
bles. TheMUV for each LGAwill vary as to the temporal
regularity of valuations and provision of this information
to the LGAs for rating purposes. UFpa will vary as to the
cost of money and investment in other comparable
securities in the economic system. The measure of
ecosystem integrity, esi, will vary as to condition of the
subject land, level of protection and land use. Theweights
will only change if further studies are done which reflect
other preferences for the relative importance of the
attributes, or environmental conditions change such that
certain attributes become more or less at threat. The area
of the tenure categories may change as some land is

I.A. Curtis / Ecological Economics 50 (2004) 163–194 185
elevated to a higher order tenure (State Forest to National
Park), and other land subverted to a lower order tenure,
such as for increased infrastructure in the region.
The methods chosen for this research were unasham-
edly positivist–rationalist, however, when seeking an
outcome that would have practical application in the real
world, no apology is necessary. The use of an existing
database of property values was complemented by
valuation theory to arrive at the pecuniary value of
EGS. The Delphi panel ascribed non-pecuniary weights
Model 3. ‘Balanced’ sensitivity paradigm/perspective Instruc
Sensitivity
criteria
Max weighteither a
think t
Threats � 4some a
Risk � 3biodive
Uncertainty � 2each at
Precaution � 1or less.
Resistance 7.5Reg: lo
Resilience 7.5high re
low res
Group Type Ecosys
Threats
Stabilisation Gas regulation (atmospheric composition)
services Climate regulation (temperature, rainfall)
Disturbance regulation (ecosystem resilience)
Water regulation (hydrological cycle) � 1
Erosion control and soil/sediment retention
Biological control (populations,
pest/disease control)
Refugia (habitats for resident and
transient populations)
� 4
Regeneration Soil formation
services Nutrient cycling and storage
(including carbon sequestration)
Assimilation of waste and
attenuation, detoxification
Purification (clean water, air)
Pollination (movement of floral gametes)
Biodiversity
Production Water supply (catchment)
of goods Food production (that sustainable portion of GPP)
Raw materials (that sustainable portion
of GPP, timber, fibre, etc.)
Genetic resources (medicines,
scientific and technological resources
Life fulfilling Recreation opportunities (nature-based tourism)
services Aesthetic, cultural and spiritual (existence values)
Other non-use values (bequest, option and quasi
option values)
to the EGS, which were subject to systematic and
statistical analysis. Ecological and land use parameters
were used to determine the extent to which EGS were
intact based on a model of ‘distance from disturbance’.
The result was a simple algorithm. The production
function of land managed for conservation is ecosystem
goods and services (author’s emphasis). The method is
readily transferable across LGA and bioregional borders,
and the variation in UFpa can be used as a relative
measure for impact mitigation across borders.
Appendix A. Multiple criteria/multiple attribute analysis of ecosystem goods and services
tions: For each attribute consider the sensitivity criteria and
ward the maximum weight for that criteria, or less if you
he threat, risk, etc., is less than the maximum, obviously
ttributes are under more threat, etc., than others, e.g.
rsity. Then decide what level of resistance and resilience
tribute has and award a weight accordingly, i.e. 7.5
See the webpage for definitions. Examples below: Water
w threat/risk, zero uncertainty, need for precaution, both
sistence and high resilience. Refugia: max threat/risk/etc,
istence, moderate to high resilience.
tem sustainability
Risk Uncertainty Precaution Resistence Resilience
� 1 0 � 1 6 7
� 3 � 2 � 1 2 5
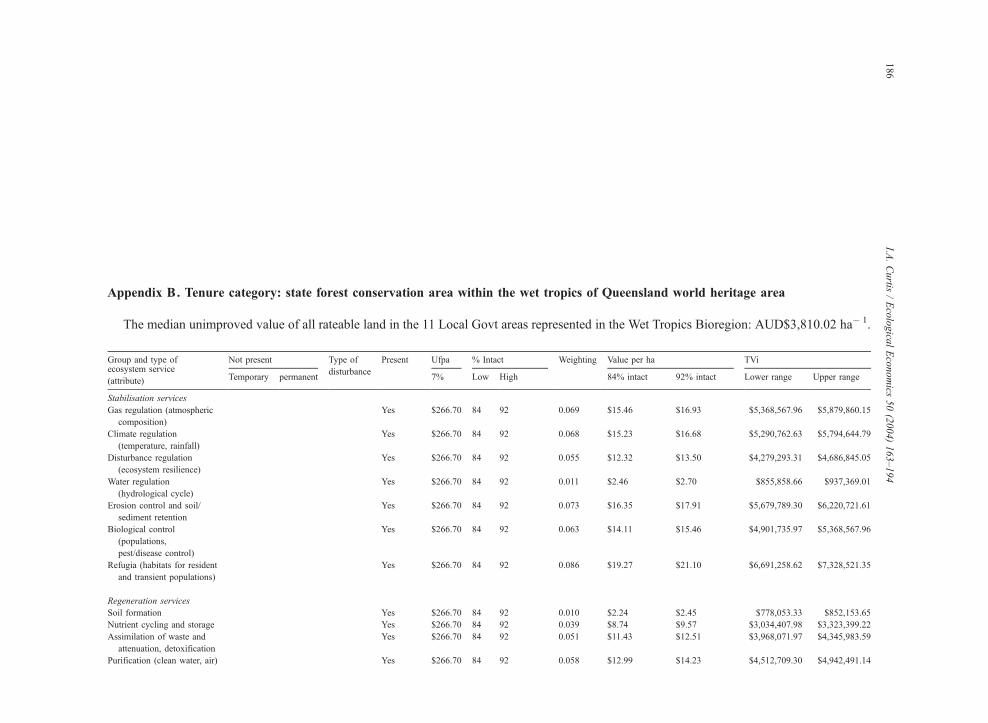
Group and type of Not present Type of Present Ufpa % Intact Weighting Value per ha TViecosystem service
(attribute) Temporary permanentdisturbance
7% Low High 84% intact 92% intact Lower range Upper range
Stabilisation services
Gas regulation (atmospheric
composition)
Yes $266.70 84 92 0.069 $15.46 $16.93 $5,368,567.96 $5,879,860.15
Climate regulation
(temperature, rainfall)
Yes $266.70 84 92 0.068 $15.23 $16.68 $5,290,762.63 $5,794,644.79
Disturbance regulation
(ecosystem resilience)
Yes $266.70 84 92 0.055 $12.32 $13.50 $4,279,293.31 $4,686,845.05
Water regulation
(hydrological cycle)
Yes $266.70 84 92 0.011 $2.46 $2.70 $855,858.66 $937,369.01
Erosion control and soil/
sediment retention
Yes $266.70 84 92 0.073 $16.35 $17.91 $5,679,789.30 $6,220,721.61
Biological control
(populations,
pest/disease control)
Yes $266.70 84 92 0.063 $14.11 $15.46 $4,901,735.97 $5,368,567.96
Refugia (habitats for resident
and transient populations)
Yes $266.70 84 92 0.086 $19.27 $21.10 $6,691,258.62 $7,328,521.35
Regeneration services
Soil formation Yes $266.70 84 92 0.010 $2.24 $2.45 $778,053.33 $852,153.65
Nutrient cycling and storage Yes $266.70 84 92 0.039 $8.74 $9.57 $3,034,407.98 $3,323,399.22
Assimilation of waste and
attenuation, detoxification
Yes $266.70 84 92 0.051 $11.43 $12.51 $3,968,071.97 $4,345,983.59
Purification (clean water, air) Yes $266.70 84 92 0.058 $12.99 $14.23 $4,512,709.30 $4,942,491.14
Appendix B. Tenure category: state forest conservation area within the wet tropics of Queensland world heritage area
The median unimproved value of all rateable land in the 11 Local Govt areas represented in the Wet Tropics Bioregion: AUD$3,810.02 ha� 1.
I.A.Curtis
/Ecologica
lEconomics
50(2004)163–194
186
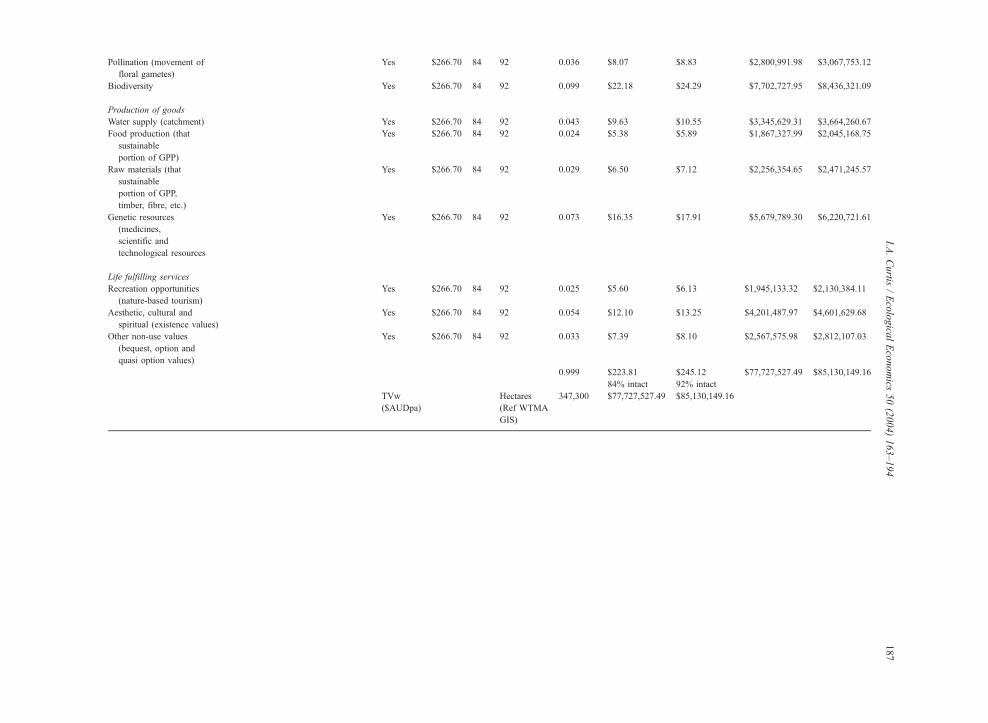
Pollination (movement of
floral gametes)
Yes $266.70 84 92 0.036 $8.07 $8.83 $2,800,991.98 $3,067,753.12
Biodiversity Yes $266.70 84 92 0.099 $22.18 $24.29 $7,702,727.95 $8,436,321.09
Production of goods
Water supply (catchment) Yes $266.70 84 92 0.043 $9.63 $10.55 $3,345,629.31 $3,664,260.67
Food production (that
sustainable
portion of GPP)
Yes $266.70 84 92 0.024 $5.38 $5.89 $1,867,327.99 $2,045,168.75
Raw materials (that
sustainable
portion of GPP,
timber, fibre, etc.)
Yes $266.70 84 92 0.029 $6.50 $7.12 $2,256,354.65 $2,471,245.57
Genetic resources
(medicines,
scientific and
technological resources
Yes $266.70 84 92 0.073 $16.35 $17.91 $5,679,789.30 $6,220,721.61
Life fulfilling services
Recreation opportunities
(nature-based tourism)
Yes $266.70 84 92 0.025 $5.60 $6.13 $1,945,133.32 $2,130,384.11
Aesthetic, cultural and
spiritual (existence values)
Yes $266.70 84 92 0.054 $12.10 $13.25 $4,201,487.97 $4,601,629.68
Other non-use values
(bequest, option and
quasi option values)
Yes $266.70 84 92 0.033 $7.39 $8.10 $2,567,575.98 $2,812,107.03
0.999 $223.81 $245.12 $77,727,527.49 $85,130,149.16
84% intact 92% intact
TVw
($AUDpa)
Hectares
(Ref WTMA
GIS)
347,300 $77,727,527.49 $85,130,149.16
I.A.Curtis
/Ecologica
lEconomics
50(2004)163–194
187

Appendix C. Triangulation model to assess extent of ecosystem services intact under a given level of protection or no protection
Scoring: Calculate the mean of the values within the diamonds included in the selection as well as those the dotted line passes through. This
example, National Park: 92%.
I.A.Curtis
/Ecologica
lEconomics
50(2004)163–194
188

Appendix D. Triangulation model to assess extent of ecosystem services intact under a given land use characteristics
Scoring: Calculate the mean of the values within the diamonds included in the selection as well as those the dotted line passes through. This
example, Dry Sclerophyll Forest: 76%.
I.A.Curtis
/Ecologica
lEconomics
50(2004)163–194
189
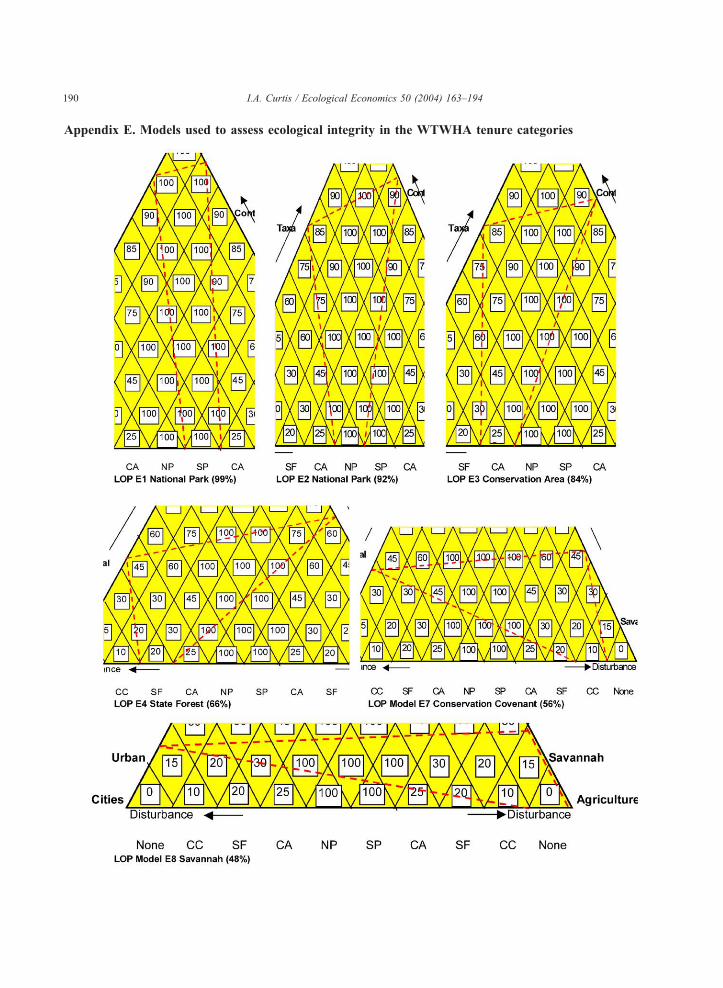
Appendix E. Models used to assess ecological integrity in the WTWHA tenure categories
I.A. Curtis / Ecological Economics 50 (2004) 163–194190

Appendix E (continued ).
I.A. Curtis / Ecological Economics 50 (2004) 163–194 191

I.A. Curtis / Ecological Economics 50 (2004) 163–194192
References
Ab Initio, 1949. Value, with particular regard to ‘‘market value’’.
Valuer 3, 306–312.
Adger, W.N., Brown, R., Cervigni, R., Moran, D., 1995. Total
economic value of forests in Mexico. Ambio 24, 286–296.
Australian Institute of Valuers and Land Economists (AIVLE),
1997. Valuation Principles and Practice, 1st ed. Australian In-
stitute of Valuers and Land Economists, Deakin, ACT.
Australian Bureau of Statistics (ABS), 2002. Australia’s Land
Resources - an overview. Year Book Australia 2002. Accessed
31st December 2002. http://abs.gov.au/Ausstats/.
Beattie, A., Erhlich, P., 2001. Wild Solutions. How Biodiversity is
Money in the Bank. Melbourne University Press, Melbourne,
Australia.
Blackwell, F., 1994. Site Value Taxation. The Valuer and Land
Economist. 33 (1), 133–136, 146.
Blalock, H.M., Blalock, A.B., 1968. Methodology in Social Re-
search. McGraw-Hill, New York.
Boyd, T.P., 1990. The most probable value within a possible range
of ‘‘X’’ per cent. Valuer 31 (1), 100–103.
Castro, R., 1994. The Economics Opportunity Costs of Wildlands
Conservation Areas: The Case of Costa Rica. Department of
Economics, Harvard University, Cambridge, MA.
Cork, S.J., Shelton, D., 2000. The Nature and Value of Australia’s
Ecosystem Services: A Framework for Sustainable Environmen-
tal Solutions. Sustainable Environmental Solutions for Industry
and Government, pp. 151–159. Proceedings of the 3rd Queens-
land Environmental Conference, May 2000. Environmental En-
gineering Society, Queensland Chapter, The Institution of
Engineers, Australia, Queensland Division, and the Queensland
Chamber of Commerce and Industry. pp. 151–159.
Costanza, R., d’Arge, R., de groot, R., Farber, S., Grasso, M.,
Hannon, B., Limburg, K., Naeem, S., O’Neil, R.V.P., Paruello,
J., Raskin, R.G., Sutton, P., van den Belt, M., 1997a. The value
of the world’s ecosystem services and natural capital. Nature
387, 253–260.
Costanza, R., Cumberland, J., Daly, H., Goodland, R., Norgaard,
R., 1997b. An Introduction to ecological economics St Lucie
Press, FL, USA.
Cunliffe, S., 2002. Forecasting risks in the tourism industry using
the Delphi Technique. Tourism 50 (1), 31–41.
Curtis, I.A., 2003. Valuing ecosystem services in a green economy.
PhD Thesis. James Cook University, Queensland, Australia.
Daily, G.C. (Ed.), 1997. Nature’s Services: Societal Dependence on
Natural Ecosystems. Island Press, Washington, DC, USA.
de Groot, R.S., 1994. Environmental functions and the economic
value of natural ecosystems. In: Jansson, A.N., Hammer, M.,
Costanza, R. (Eds.), Investing in Natural Capital: The Ecologi-
cal Economics Approach to Sustainability. Island Press, Wash-
ington, DC, pp. 151–168.
Department of Natural Resources and Mines, 2001. Wet Tropics
Bioregion. Spatial Information Group, Townsville, Australia.
Department for Transport, Local Government and the Regions
(DTLR). 2002. Multi Criteria Analysis: A Manual. http://
www.dtlr.gov.uk/about/multicriteria/06.htm. Accessed 28/02/02.
Dick, R., 1990. Rigour Without Numbers. Interchange, Chapel Hill,
Queensland, Australia.
Dobson, A.P., Rodriguez, J.P., Roberts, W.M., 2001. Synoptic tin-
kering: integrating strategies for large-scale conservation. Eco-
logical Applications 11 (4), 1019–1026.
Dreschler, M., Watzold, F., 2001. The importance of economic costs
in the development of guidelines for spatial conservation man-
agement. Biological Conservation 97, 51–59.
Driml, S., 2002. Travel cost analysis of recreation value in the wet
tropics world heritage area. Economic Analysis and Policy 32
(2), 11–26 (Special Issue).
Duthy, S., 2002. Whian Whian—State Forest or National Park:
community attitudes and economic values. Economic Analysis
and Policy 32 (2), 91–111 (Special Issue).
Edwards, S.F., 1987. An Introduction to Coastal Zone Economics:
Concepts, Methods and Case Studies. Taylor and Francis, New
York, USA.
Ehrlich, P.R., 1988. The loss of biodiversity, causes and consequen-
ces. In: Wilson, E.O. (Ed.), Biodiversity. National Academy of
Sciences. National Academy Press, Washington, DC.
Else-Mitchell, J., 1963. Problems of compensation and valuation
where there is no free market. Valuer 17 (4), 555–561.
Environmental Protection Agency (EPA), 1999. State of the Envi-
ronment Queensland 1999. Environmental Protection Agency,
Brisbane, Queensland.
Erwin, T.L., 1988. The tropical forest canopy. The heart of
biotic diversity. In: Wilson, E.O. (Ed.), Biodiversity. National
Academy of Sciences. National Academy Press, Washington,
DC.
Frank, R.H., 1991. Microeconomics and Behaviour. McGraw-Hill,
New York.
Funtowitz, S.O., Ravetz, J.R., 1994. The worth of a songbird: eco-
logical economics are a post-normal science. Ecological Eco-
nomics 10 (3), 197–207.
Griffith, J., 1907. Spencer v The Commonwealth, 5 CLR 418. High
Court of Australia.
Grove, S., 2000. Impacts of forest management on saproxylic bee-
tles in the Australian lowland tropics and the development of
appropriate indicators of sustainable forest management. PhD
thesis, James Cook University, Cairns, Australia.
Hackett, S.C., 2001. Environment and Natural Resource Econom-
ics. Theory, Policy, and the Sustainable Society M.E. Sharpe,
New York.
Harrison, S., 2002. Visual disamenity in the Queensland wet tropics:
estimating the economic impacts of overhead transmission lines.
Economic Analysis and Policy 32 (2), 173–188 (Special Issue).
Hawken, P., 1995. The ecology of commerce: A declaration of
sustainability. Phoenix, London, UK.
Hawken, P., Lovins, A., Lovins, L.H., 1999. Natural Capitalism.
Creating the Next Industrial Revolution. Little, Brown and
Company, New York.
Helmer, O., 1975. Foreword. The Delphi method: techniques and
applications. In: Linstone, H.A., Turoff, M. (Eds.), The Delphi
Method: Techniques and Applications. Addison Wesley, Boston,
MA, USA.
Hemmings, N.A., 1996. The environment and land value. Valuer
and Land Economist 34, 189–192.

I.A. Curtis / Ecological Economics 50 (2004) 163–194 193
Herps, M.D., 1942. The legal and economic aspects of land valu-
ation. Valuer 7, 103–110.
Hicks, C.M., 1999. Research Methods for Clinical Therapists: Ap-
plied Project Design and Analysis. Churchill Livingstone, Lon-
don, UK.
Holdridge, L.R., 1967. Life Zone Ecology Tropical Science Centre,
San Jose, Costa Rica.
Holdridge, L.R., Grencke, W.C., Hatheway, W.H., Liang, T., Tosi
Jr., J.A., 1971. Forest Environments in Tropical Life Zones: A
Pilot Study. Pergamon, Oxford, UK.
Hotelling, H., 1931. The economy of exhaustible resources. Journal
of Political Economy 39 (2), 137–175.
Howarth, R.B., Farber, S., 2002. Accounting for the value of eco-
system services. Ecological Economics 41, 421–429.
Hyams, A.A., 1986. The Law Affecting the Valuation of Land in
Australia. Law Book, Sydney, Australia.
Inglis, E.R., 1960. Unimproved value: the need for clarification of
the definition. Valuer 16 (3), 138–151.
Kaynak, E., Macauley, J.A., 1984. The Delphi technique in the
measurement of tourism market potential: the case of Nova
Scotia. Tourism Management 5, 87–101.
KPMG Consulting, 2000. Economic and Financial Values of the
Great Barrier Reef Marine Park Great Barrier Reef Marine Park
Authority, Townsville, Australia.
Lally, P., 1998. The role of valuers in an environmentally sensitive
future. Valuer and Land Economist 35 (1), 12–18.
Lambert, W.J., 1932. Initiating a discussion on some of the princi-
ples of land valuation associated with the unimproved value of
land. NSW Valuer 2, 15–24.
Linstone, H.A., Turoff, M., 1975. Introduction. The Delphi Method:
techniques and applications. In: Linstone, H.A., Turoff, M.
(Eds.), The Delphi Method: Techniques and Applications. Addi-
son Wesley, Boston, MA, USA.
Lugo, A.E., 1988. Estimating reductions in the diversity of tropical
forest species. In: Wilson, E.O. (Ed.), Biodiversity. National
Academyof Sciences.NationalAcademyPress,Washington,DC.
MacArthur, R.H., Wilson, E.O., 1967. The Theory of Island Bio-
geography. Princeton University Press, Princeton, USA.
McNamara, J., 1983. Comparable sales. NSW Valuer 28, 447.
McNeeley, J.A., 1988. Economics and biological diversity: devel-
oping and using economic incentives to conserve biological
resources. IUCN. Gland, Switzerland.
Martinez-Alier, J., Munda, G., O’Neill, G., 1998. Weak compara-
bility of values as a foundation for ecological economics. Eco-
logical Economics 26, 277–286.
Meffe, G.K., Carroll, C.R., 1997. Principles of Conservation Bio-
logy, 2nd ed. Sinauer Associates, Sunderland, MA, USA.
Miller, G., 2001. The development of indicators for sustainable
tourism: results of a Delphi survey of tourism researchers. Tour-
ism Management 22, 351–362.
Mitroff, I.I., Turoff, M., 1975. Introduction II: B. Philosophical and
Methodological Foundations of Delphi. In: Linstone, H.A., Tur-
off, M. (Eds.), The Delphi Method: Techniques and Applica-
tions. Addison Wesley, Boston, MA, USA.
Mooney, H.A., 1988. Lessons from Mediterranean-climate regions.
In: Wilson, E.O. (Ed.), Biodiversity. National Academy of Sci-
ences. National Academy Press, Washington, DC.
More, T.A., Averill, J., Glass, R.J., 1996. Noneconomic values in
multiple objective decision making. In: El-Swaify, S.A., Yako-
witz, D.S. (Eds.), Multiple Objective Decision Making for Land,
Water, and Environmental Management. Lewis, Washington,
DC.
Motha, P., 1979. Approaches to Land Valuation. NSW Valuer 25,
444–449.
Munda, G., 1996. Cost–benefit analysis in integrated environmen-
tal assessment: some methodological issues. Ecological Eco-
nomics 19, 157–168.
Murray, J.F.N., 1954. Principles and Practice of Valuation, 3rd ed.
Commonwealth Institute of Valuers, Sydney, Australia.
Murray, J.F.N., 1969. Principles and Practice of Valuation, 4th ed.
Commonwealth Institute of Valuers, Sydney, Australia.
Myers, N., 1988. Tropical forests and their species. Going,
going. . .? In: Wilson, E.O. (Ed.), Biodiversity. National Acad-
emy of Sciences. National Academy Press, Washington, DC.
Nations, J.D., 1988. Deep ecology meets the developing world. In:
Wilson, E.O. (Ed.), Biodiversity. National Academy of Scien-
ces. National Academy Press, Washington, DC.
Noh, J., Lee, K.M., 2003. Application of Multiattribute Decision-
Making Methods for the Determination of Relative Significance
Factor of Impact Categories. Enviroment Managament 31 (5),
633–641.
Nunes, P.A.L.D., van den Bergh, J.C.J.M., 2001. Economic valua-
tion of biodiversity: sense or nonsense? Ecological Economics
39, 203–222.
O’Connor, M., 2000. Pathways for environmental evaluation: a
walk in the (Hanging) Gardens of Babylon. Ecological Econom-
ics 34, 175–193.
Peters, R.L., 1988. The effect of global climatic change on natural
communities. In: Wilson, E.O. (Ed.), Biodiversity. National
Academyof Sciences.NationalAcademyPress,Washington,DC.
Ponting, C., 1998. Progress and Barbarism: The World in the Twen-
tieth Century. Random House, London, UK.
Principia, C., 1958. The Effect of Improvements on ‘‘Unimproved
Value’’. Valuer 15 (2), 113–114.
Radcliffe, R.U., 1972. Is there a ‘New School’ of appraisal thought?
The Appraisal Journal, 522–528 (October).
Rainforest CRC, Wilson, G., 2002. Wet Tropics World Heritage
Area. Rainforest Cooperative Research Centre, James Cook
University, Cairns, Australia.
Reed, R., 2003. Challenges Faced in Valuing National Parks.
Reynolds, A., 1984. Current valuation techniques—a review. Val-
uer 28, 198–204.
Rich, J., Dixon, J., McTiernan, J., 1934. Deputy-Federal Commis-
sioner of Taxation v Gold Estates of Australia, 51 CLR 509.
High Court of Australia.
Rietveld, P., 1980. Multiple Objective Decision Methods and Re-
gional Planning. North Holland, New York, USA.
Rivett, D., 2000. Developing a best-practice environmental solution
for an upgrade of the kuranda range road. Royal Australian
Planning Institute Conference, Cairns, Australia.
Roll, E., 1961. A History of Economic Thought Faber and Faber,
London, UK.
Rowles, T., Hutton, B., Bellamy, S., 1998. Valuation of land under
roads. Australian Property Journal 35 (3), 260–262.

I.A. Curtis / Ecological Economics 50 (2004) 163–194194
Sarpong-Oti, W., 1998. A valuer’s perspective on valuation of nat-
ural resources and environmental quality. Australian Property
Journal 35 (4), 336–340.
Scheele, D.S., 1975. Reality construction as a product of Delphi
interaction. In: Linstone, H.A., Turoff, M. (Eds.), The Delphi
Method: Techniques and Applications. Addison Wesley, Boston,
MA, USA.
Scheffer, M., Brock, W., Westley, F., 2000. Socioeconomic mech-
anisms preventing optimum use of ecosystem services: an inter-
disciplinary theoretical analysis. Ecosystems 3, 451–471.
Scott, J.M., Davis, F.W., McGhie, R.G., Wright, R.G., Groves, C.,
Estes, J., 2001. Nature reserves: do they capture the full range of
America’s biological diversity. Ecological Applications 11 (4),
999–1007.
Simpson, J.A., Weiner, E.S.C., 1989. The Oxford English Dictio-
nary, 2nd ed. Clarendon Press, Oxford, UK.
Spencer, H.M., 1984. Obtaining consent for the highest and best
use: the local government planner’s view. NSW Valuer 28,
287–290.
Weaver, R.D., Ke Chung, K., 1994. Biodiversity and humanity:
toward a new paradigm. In: Ke Chung, K., Weaver, R.D.
(Eds.), Biodiversity and Landscapes: a paradox of humanity.
Cambridge University Press, Cambridge, USA.
Westwood, R., 1993. The definition of market value. Valuer and
Land Economist 32, 326–328.
Wet Tropics Management Authority. 2001. Annual Report 2000/
2001, Wet Tropics Management Authority, Cairns, Queensland.
Wet Tropics Management Authority 2002. Managing a Living Re-
source: Zoning System. WTMA. Accessed March 28, 2002.
http://www.wettropics.gov.au/mlr/zones.htm.
Whipple, R.T.M., 1962. What determines the highest and best use.
Valuer 17 (3), 181–185.
Whipple, R.T.M., 1992. Valuations: a problem solving imperative.
Valuer and Land Economist 32, 18–29.
Wilson, E.O., 1988a. Editor’s foreword. In: Wilson, E.O. (Ed.),
Biodiversity. National Academy of Sciences. National Academy
Press, Washington, DC.
Wilson, E.O., 1988b. The current state of biological diversity. In:
Wilson, E.O. (Ed.), Biodiversity. National Academy of Scien-
ces. National Academy Press, Washington, DC.
Wilson, E.O., 2002. What is nature worth? San Francisco Chroni-
cle., May 5. San Francisco, USA.
Winpenny, J.T., 1991. Values for the Environment. A Guide to
Economic Appraisal HMSO, London, UK.
Zar, J.H., 1996. Biostatistical Analysis, 3rd ed. Prentice Hall, New
Jersey, USA.