validation of high speed earth atmospheric entry … · validation of high speed earth atmospheric...
TRANSCRIPT
Validation of High Speed Earth Atmospheric Entry
Radiative Heating from 9.5 to 15.5 km/s
A. M. Brandis ∗†
AMA Inc at NASA Ames Research Center, Moffett Field, CA, 94035, USA
C. O. Johnston‡
NASA Langley Research Center, Hampton, VA, 23669, USA
B. A. Cruden §¶ and D. K. Prabhu ‖¶
AMA Inc at NASA Ames Research Center, Moffett Field, CA, 94035, USA
This paper presents an overview of the analysis and measurements of equilibrium ra-diation obtained in the NASA Ames Research Center’s Electric Arc Shock Tube (EAST)facility as a part of recent testing aimed at reaching shock velocities up to 15.5 km/s. Thegoal of these experiments was to measure the level of radiation encountered during highspeed Earth entry conditions, such as would be relevant for an asteroid, inter-planetary orlunar return mission. These experiments provide the first spectrally and spatially resolveddata for high speed Earth entry and cover conditions ranging from 9.5 to 15.5 km/s at13.3 and 26.6 Pa (0.1 and 0.2 Torr). The present analysis endeavors to provide a valida-tion of shock tube radiation measurements and simulations at high speed conditions. Acomprehensive comparison between the spectrally resolved absolute equilibrium radiancemeasured in EAST and the predictive tools, NEQAIR and HARA, is presented. In orderto provide a more accurate representation of the agreement between the experimental andsimulation results, the integrated value of radiance has been compared across four spectralregions (VUV, UV/Vis, Vis/NIR and IR) as a function of velocity. Results have generallyshown excellent agreement between the two codes and EAST data for the Vis throughIR spectral regions, however, discrepancies have been identified in the VUV and parts ofthe UV spectral regions. As a result of the analysis presented in this paper, an updatedparametric uncertainty for high speed radiation in air has been evaluated to be [9.0%,-6.3%]. Furthermore, due to the nature of the radiating environment at these high shockspeeds, initial calculations aimed at modeling phenomena that become more significantwith increasing shock speed have been performed. These phenomena include analyzing theradiating species emitting ahead of the shock and the increased significance of radiativecooling mechanisms.
I. Introduction
As radiation may contribute a significant fraction of the heat flux for high speed return to Earth trajecto-ries, detailed simulations and experiments have been undertaken to quantify this radiation and evaluate
associated uncertainties.1,2, 3, 4 Previous studies have identified differences between the experimental mea-surements taken in the Electric Arc Shock Tube (EAST) facility5 at the NASA Ames Research Center andtheoretical models,2 such as Neqair6 and Hara.7,8 Understanding these uncertainties is important forthe selection of the thermal protection system (TPS) material, particularly when the radiative heat flux
∗Research Scientist, Aerothermodynamics Branch, Moffett Field, and Member AIAA. [email protected]†A significant portion of this work for this article was performed while employed by University Affiliated Research Center,
University of California Santa Cruz.‡Research Scientist, Aerothermodynamics Branch , Member AIAA.§Senior Research Scientist, Aerothermodynamics Branch, Moffett Field, and Senior Member AIAA.¶A significant portion of this work for this article was performed while employed by ERC Inc.‖Senior Research Scientist, Aerothermodynamics Branch, Moffett Field, and Associate Fellow AIAA.
1 of 24
American Institute of Aeronautics and Astronautics
https://ntrs.nasa.gov/search.jsp?R=20170000925 2018-09-17T02:42:20+00:00Z
becomes large compared to the convective heat flux. Obtaining radiative heating data from flight missionsis often difficult, and therefore it is important to measure and validate simulation tools with ground testingfacilities. Prior to the high speed EAST measurements presented in this paper, an analysis conducted byJohnston et al.9 calculated the radiative parametric uncertainty for Earth re-entry to be [32%, -21%] at15 km/s excluding the effect of ablation products a. The present analysis will provide a further insight intothe accuracy of theoretical models, and improve understanding of a regime of experimental data that hasnot previously been validated. The validation will comprise of spectral and spatial comparisons of VUV,UV/Vis, Vis/NIR and IR emission data as measured on the EAST facility with predictive modeling tools.
II. Description of the EAST Facility
The EAST facility at NASA Ames Research Center was developed to simulate high-enthalpy, “real gas”phenomena encountered by hypersonic vehicles entering planetary atmospheres. Experiments are performedto match flow parameters relevant to flight, such as velocity, static pressure, and atmospheric composition.The basic principle behind testing in the EAST facility is that the shock-heated test gas in the tube simulatesconditions behind the bow shock of a re-entry vehicle. EAST has the capability of producing superorbitalshock speeds using an electric arc driver with a driven tube diameter of 10.16 cm.10,11 The region of validtest gas lies between the shock front and the contact surface that separates the driver and driven gases.The test duration is defined as the axial distance between these two points divided by the local shockvelocity. The characteristics of the EAST arc driver result in test durations of approximately 4 - 10 µs.Though short, this test duration is often sufficient to capture the peak non-equilibrium shock radiation andthe decay to equilibrium conditions. As the shocked gas arrives at the location of the test section in thetube, spectrometers attached to Charge Coupled Devices (CCDs) are gated and the spectral and spatialemission of the gas are analyzed. EAST utilizes four spectrometers per shot, each associated with fourdifferent wavelength ranges. These cameras are referred to as: VUV (∼ 120 – 215 nm), UV/Vis (∼ 190 nm– 500 nm), Vis/NIR (∼ 480 nm – 900 nm), and IR (∼ 700 nm – 1650 nm).
II.A. Test Conditions
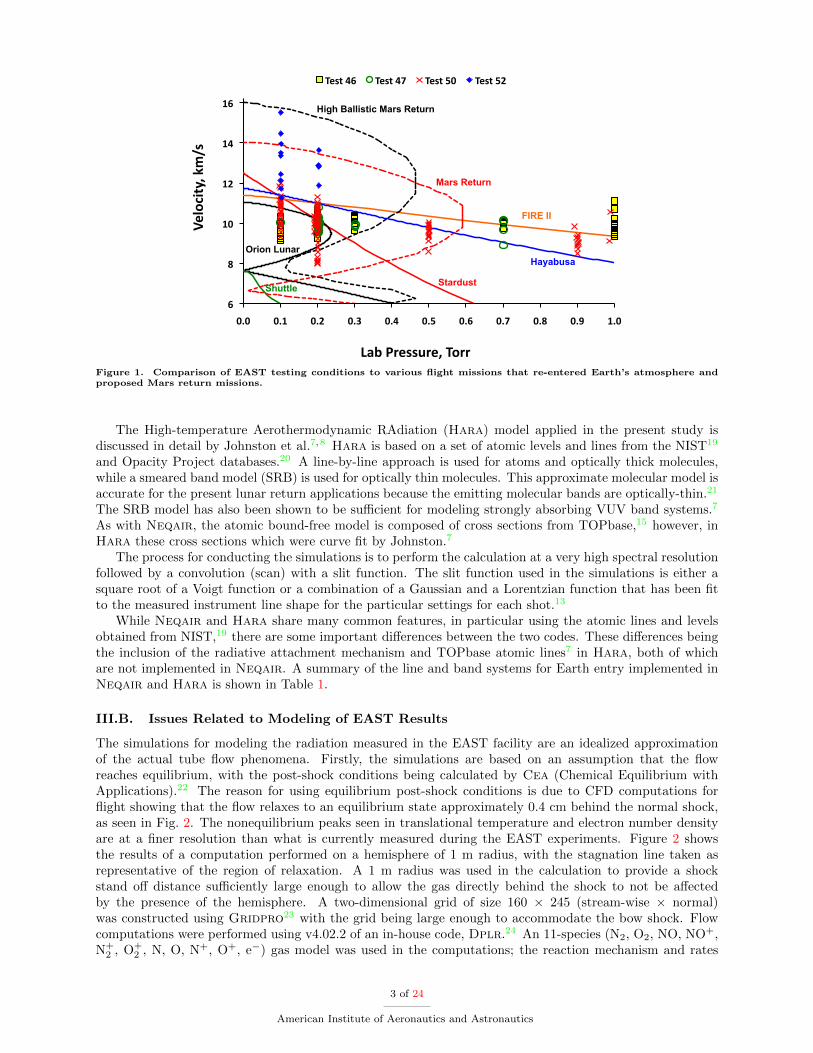
The nominal test conditions were chosen to be representative of the Multi Purpose Crew exploration Vehicle’s(MPCV’s) re-entry into Earth’s atmosphere during a lunar return mission. This corresponds to a shock speedof approximately 10 km/s, free stream pressures ranging from 13.3 Pa (0.1 Torr) to 26.6 Pa (0.2 Torr)12,13 anda test gas composition of 79% N2 and 21% O2 by mole. However, in order to better ascertain the dependencyof the shock speed on radiation, shots were aimed at expanding the testing conditions to encompass speeds upto 15.5 km/s. This expanded data-set provides a more complete picture to analyze the relationship betweenshock speed and emitted radiation and allows for a more robust comparison with simulations. Figure 1 showsa comparison of EAST testing conditions with various flight missions that re-entered Earth’s atmosphere.The flight mission conditions have been scaled to match density by accounting for the difference in ambienttemperature in the upper atmosphere versus the laboratory. Four sets of EAST data are shown, denotedTest 46,10 47,5 5012,13 and 52. Data from these tests may be obtained publicly by contacting the authors.
III. Analysis Approach
III.A. Brief Description of Codes
Non-EQuilibrium AIr Radiation (Neqair) is a line-by-line radiation code which computes spontaneousemission, absorption and stimulated emission due to transitions between various energy states of chemicalspecies along a line-of-sight.6 Individual electronic transitions are considered for atoms and molecules, withthe molecular band systems being resolved for each rotational line. Since the report of Whiting et al.,6
numerous updates have been incorporated into Neqair, such as: using the latest version of the NISTatomic database (version 5.0),14 using the bound-free cross sections from TOPbase15 as opposed to invertingthe absorption cross-sections of Peach,16 incorporating the CO2 database from CDSD-4000,17 parallelizationand improvements to the mechanics of QSS. This latest version of Neqair is known as v14.0.18
aThis uncertainty bound is the sum of all the parametric uncertainties listed in Johnston et al.9 except for those related toablation products.
2 of 24
American Institute of Aeronautics and Astronautics
!"
#"
$%"
$&"
$'"
$!"
%(%" %($" %(&" %()" %('" %(*" %(!" %(+" %(#" %(," $(%"
-./012345"6789"
:;<"=>.99?>.5"@0>>"
@.93"'!" @.93"'+" @.93"*%" @.93"*&"
Stardust
Orion Lunar
FIRE II
Hayabusa
Shuttle
Mars Return
High Ballistic Mars Return
Figure 1. Comparison of EAST testing conditions to various flight missions that re-entered Earth’s atmosphere andproposed Mars return missions.
The High-temperature Aerothermodynamic RAdiation (Hara) model applied in the present study isdiscussed in detail by Johnston et al.7,8 Hara is based on a set of atomic levels and lines from the NIST19
and Opacity Project databases.20 A line-by-line approach is used for atoms and optically thick molecules,while a smeared band model (SRB) is used for optically thin molecules. This approximate molecular model isaccurate for the present lunar return applications because the emitting molecular bands are optically-thin.21
The SRB model has also been shown to be sufficient for modeling strongly absorbing VUV band systems.7
As with Neqair, the atomic bound-free model is composed of cross sections from TOPbase,15 however, inHara these cross sections which were curve fit by Johnston.7
The process for conducting the simulations is to perform the calculation at a very high spectral resolutionfollowed by a convolution (scan) with a slit function. The slit function used in the simulations is either asquare root of a Voigt function or a combination of a Gaussian and a Lorentzian function that has been fitto the measured instrument line shape for the particular settings for each shot.13
While Neqair and Hara share many common features, in particular using the atomic lines and levelsobtained from NIST,19 there are some important differences between the two codes. These differences beingthe inclusion of the radiative attachment mechanism and TOPbase atomic lines7 in Hara, both of whichare not implemented in Neqair. A summary of the line and band systems for Earth entry implemented inNeqair and Hara is shown in Table 1.
III.B. Issues Related to Modeling of EAST Results
The simulations for modeling the radiation measured in the EAST facility are an idealized approximationof the actual tube flow phenomena. Firstly, the simulations are based on an assumption that the flowreaches equilibrium, with the post-shock conditions being calculated by Cea (Chemical Equilibrium withApplications).22 The reason for using equilibrium post-shock conditions is due to CFD computations forflight showing that the flow relaxes to an equilibrium state approximately 0.4 cm behind the normal shock,as seen in Fig. 2. The nonequilibrium peaks seen in translational temperature and electron number densityare at a finer resolution than what is currently measured during the EAST experiments. Figure 2 showsthe results of a computation performed on a hemisphere of 1 m radius, with the stagnation line taken asrepresentative of the region of relaxation. A 1 m radius was used in the calculation to provide a shockstand off distance sufficiently large enough to allow the gas directly behind the shock to not be affectedby the presence of the hemisphere. A two-dimensional grid of size 160 × 245 (stream-wise × normal)was constructed using Gridpro23 with the grid being large enough to accommodate the bow shock. Flowcomputations were performed using v4.02.2 of an in-house code, Dplr.24 An 11-species (N2, O2, NO, NO+,N+
2 , O+2 , N, O, N+, O+, e−) gas model was used in the computations; the reaction mechanism and rates
3 of 24
American Institute of Aeronautics and Astronautics
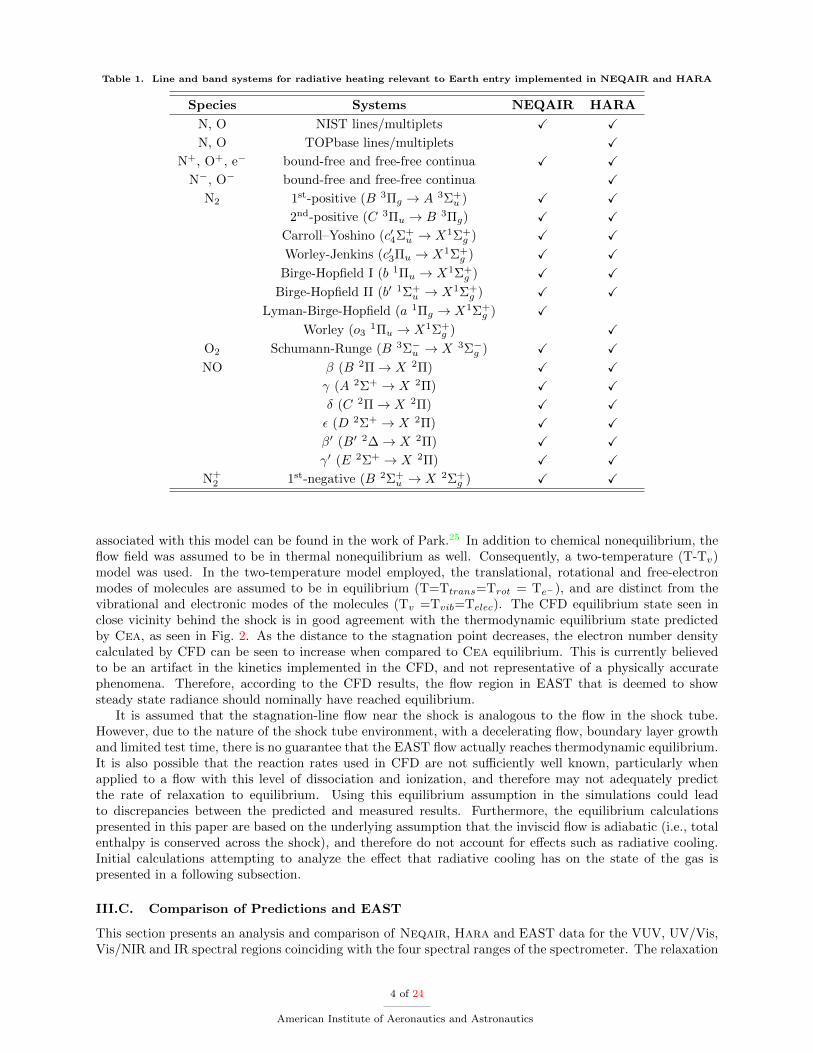
Table 1. Line and band systems for radiative heating relevant to Earth entry implemented in NEQAIR and HARA
Species Systems NEQAIR HARA
N, O NIST lines/multiplets X X
N, O TOPbase lines/multiplets X
N+, O+, e− bound-free and free-free continua X X
N−, O− bound-free and free-free continua X
N2 1st-positive (B 3Πg → A 3Σ+u ) X X
2nd-positive (C 3Πu → B 3Πg) X X
Carroll–Yoshino (c′4Σ+u → X1Σ+
g ) X X
Worley-Jenkins (c′3Πu → X1Σ+g ) X X
Birge-Hopfield I (b 1Πu → X1Σ+g ) X X
Birge-Hopfield II (b′ 1Σ+u → X1Σ+
g ) X X
Lyman-Birge-Hopfield (a 1Πg → X1Σ+g ) X
Worley (o31Πu → X1Σ+
g ) X
O2 Schumann-Runge (B 3Σ−u → X 3Σ−g ) X X
NO β (B 2Π→ X 2Π) X X
γ (A 2Σ+ → X 2Π) X X
δ (C 2Π→ X 2Π) X X
ε (D 2Σ+ → X 2Π) X X
β′ (B′ 2∆→ X 2Π) X X
γ′ (E 2Σ+ → X 2Π) X X
N+2 1st-negative (B 2Σ+
u → X 2Σ+g ) X X
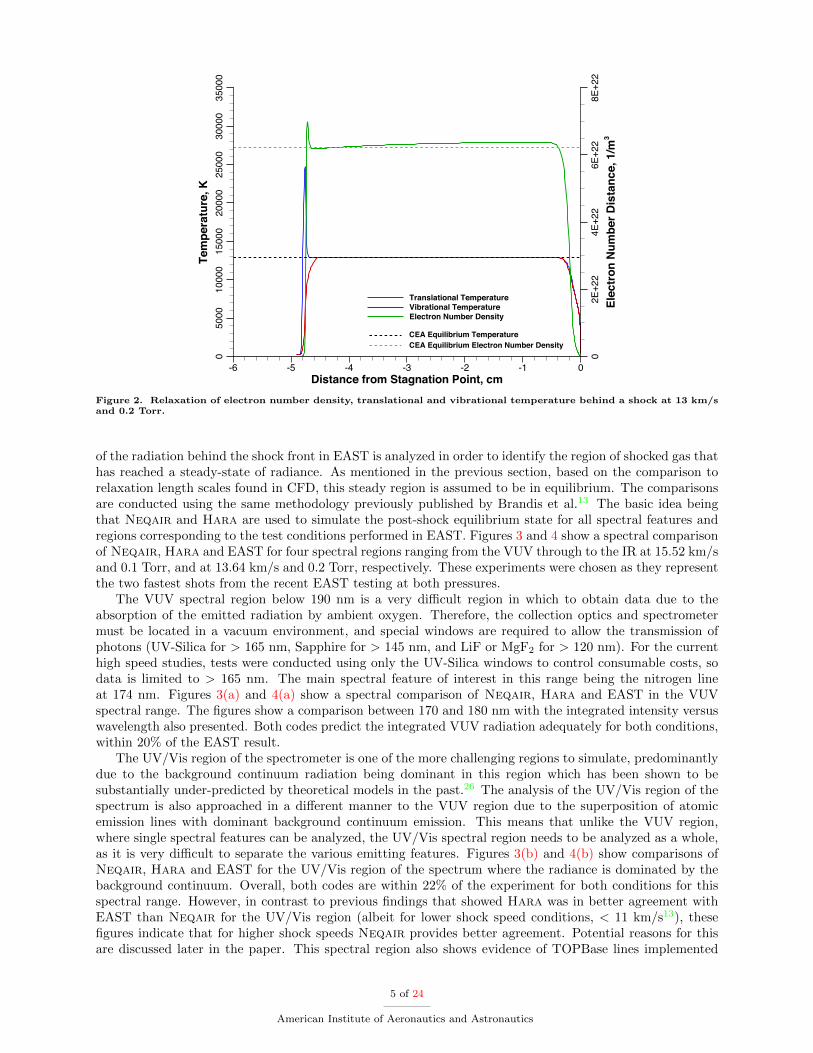
associated with this model can be found in the work of Park.25 In addition to chemical nonequilibrium, theflow field was assumed to be in thermal nonequilibrium as well. Consequently, a two-temperature (T-Tv)model was used. In the two-temperature model employed, the translational, rotational and free-electronmodes of molecules are assumed to be in equilibrium (T=Ttrans=Trot = Te−), and are distinct from thevibrational and electronic modes of the molecules (Tv =Tvib=Telec). The CFD equilibrium state seen inclose vicinity behind the shock is in good agreement with the thermodynamic equilibrium state predictedby Cea, as seen in Fig. 2. As the distance to the stagnation point decreases, the electron number densitycalculated by CFD can be seen to increase when compared to Cea equilibrium. This is currently believedto be an artifact in the kinetics implemented in the CFD, and not representative of a physically accuratephenomena. Therefore, according to the CFD results, the flow region in EAST that is deemed to showsteady state radiance should nominally have reached equilibrium.
It is assumed that the stagnation-line flow near the shock is analogous to the flow in the shock tube.However, due to the nature of the shock tube environment, with a decelerating flow, boundary layer growthand limited test time, there is no guarantee that the EAST flow actually reaches thermodynamic equilibrium.It is also possible that the reaction rates used in CFD are not sufficiently well known, particularly whenapplied to a flow with this level of dissociation and ionization, and therefore may not adequately predictthe rate of relaxation to equilibrium. Using this equilibrium assumption in the simulations could leadto discrepancies between the predicted and measured results. Furthermore, the equilibrium calculationspresented in this paper are based on the underlying assumption that the inviscid flow is adiabatic (i.e., totalenthalpy is conserved across the shock), and therefore do not account for effects such as radiative cooling.Initial calculations attempting to analyze the effect that radiative cooling has on the state of the gas ispresented in a following subsection.
III.C. Comparison of Predictions and EAST
This section presents an analysis and comparison of Neqair, Hara and EAST data for the VUV, UV/Vis,Vis/NIR and IR spectral regions coinciding with the four spectral ranges of the spectrometer. The relaxation
4 of 24
American Institute of Aeronautics and Astronautics
Distance from Stagnation Point, cm
Tem
pera
ture
, K
Elec
tron
Num
ber D
ista
nce,
1/m
3
-6 -5 -4 -3 -2 -1 0
05000
10000
15000
20000
25000
30000
35000
02E+22
4E+22
6E+22
8E+22
Translational TemperatureVibrational TemperatureElectron Number Density
CEA Equilibrium TemperatureCEA Equilibrium Electron Number Density
Figure 2. Relaxation of electron number density, translational and vibrational temperature behind a shock at 13 km/sand 0.2 Torr.
of the radiation behind the shock front in EAST is analyzed in order to identify the region of shocked gas thathas reached a steady-state of radiance. As mentioned in the previous section, based on the comparison torelaxation length scales found in CFD, this steady region is assumed to be in equilibrium. The comparisonsare conducted using the same methodology previously published by Brandis et al.13 The basic idea beingthat Neqair and Hara are used to simulate the post-shock equilibrium state for all spectral features andregions corresponding to the test conditions performed in EAST. Figures 3 and 4 show a spectral comparisonof Neqair, Hara and EAST for four spectral regions ranging from the VUV through to the IR at 15.52 km/sand 0.1 Torr, and at 13.64 km/s and 0.2 Torr, respectively. These experiments were chosen as they representthe two fastest shots from the recent EAST testing at both pressures.
The VUV spectral region below 190 nm is a very difficult region in which to obtain data due to theabsorption of the emitted radiation by ambient oxygen. Therefore, the collection optics and spectrometermust be located in a vacuum environment, and special windows are required to allow the transmission ofphotons (UV-Silica for > 165 nm, Sapphire for > 145 nm, and LiF or MgF2 for > 120 nm). For the currenthigh speed studies, tests were conducted using only the UV-Silica windows to control consumable costs, sodata is limited to > 165 nm. The main spectral feature of interest in this range being the nitrogen lineat 174 nm. Figures 3(a) and 4(a) show a spectral comparison of Neqair, Hara and EAST in the VUVspectral range. The figures show a comparison between 170 and 180 nm with the integrated intensity versuswavelength also presented. Both codes predict the integrated VUV radiation adequately for both conditions,within 20% of the EAST result.
The UV/Vis region of the spectrometer is one of the more challenging regions to simulate, predominantlydue to the background continuum radiation being dominant in this region which has been shown to besubstantially under-predicted by theoretical models in the past.26 The analysis of the UV/Vis region of thespectrum is also approached in a different manner to the VUV region due to the superposition of atomicemission lines with dominant background continuum emission. This means that unlike the VUV region,where single spectral features can be analyzed, the UV/Vis spectral region needs to be analyzed as a whole,as it is very difficult to separate the various emitting features. Figures 3(b) and 4(b) show comparisons ofNeqair, Hara and EAST for the UV/Vis region of the spectrum where the radiance is dominated by thebackground continuum. Overall, both codes are within 22% of the experiment for both conditions for thisspectral range. However, in contrast to previous findings that showed Hara was in better agreement withEAST than Neqair for the UV/Vis region (albeit for lower shock speed conditions, < 11 km/s13), thesefigures indicate that for higher shock speeds Neqair provides better agreement. Potential reasons for thisare discussed later in the paper. This spectral region also shows evidence of TOPBase lines implemented
5 of 24
American Institute of Aeronautics and Astronautics
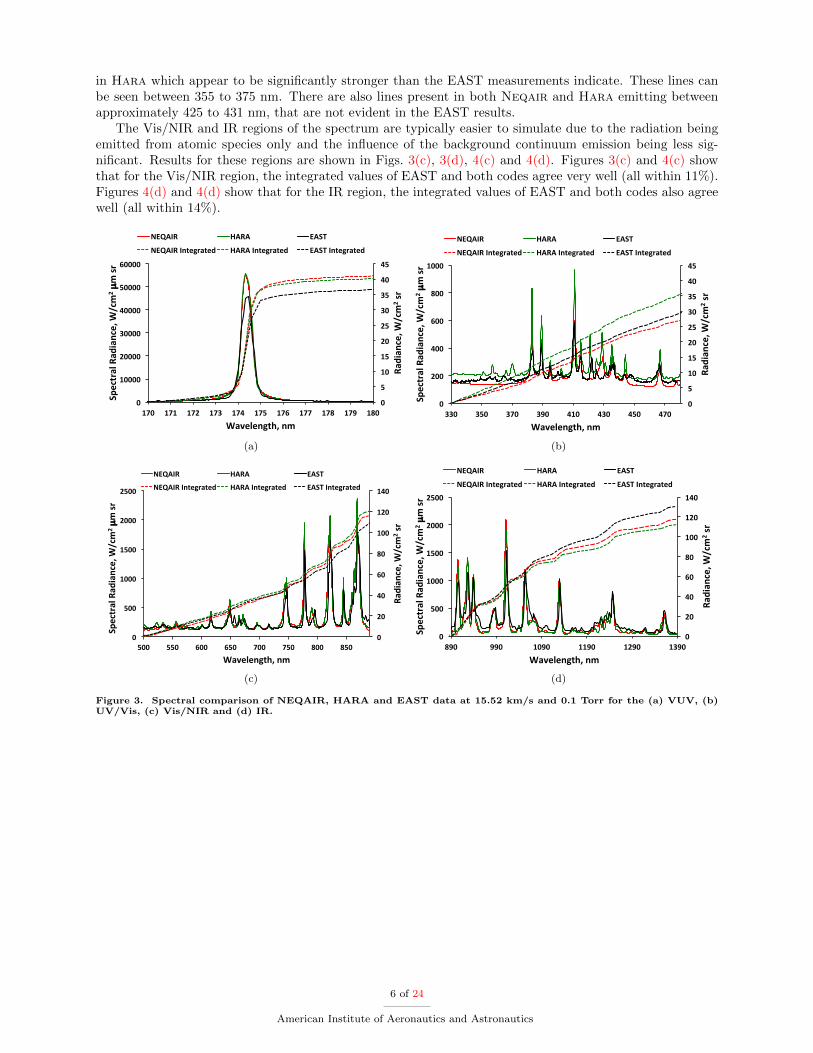
in Hara which appear to be significantly stronger than the EAST measurements indicate. These lines canbe seen between 355 to 375 nm. There are also lines present in both Neqair and Hara emitting betweenapproximately 425 to 431 nm, that are not evident in the EAST results.
The Vis/NIR and IR regions of the spectrum are typically easier to simulate due to the radiation beingemitted from atomic species only and the influence of the background continuum emission being less sig-nificant. Results for these regions are shown in Figs. 3(c), 3(d), 4(c) and 4(d). Figures 3(c) and 4(c) showthat for the Vis/NIR region, the integrated values of EAST and both codes agree very well (all within 11%).Figures 4(d) and 4(d) show that for the IR region, the integrated values of EAST and both codes also agreewell (all within 14%).
0"
5"
10"
15"
20"
25"
30"
35"
40"
45"
0"
10000"
20000"
30000"
40000"
50000"
60000"
170" 171" 172" 173" 174" 175" 176" 177" 178" 179" 180"
Radian
ce,"W
/cm
2 "sr"
Spectral"Rad
iance,"W
/cm
2 "µm"sr"
Wavelength,"nm"
NEQAIR" HARA" EAST"
NEQAIR"Integrated" HARA"Integrated" EAST"Integrated"
(a)
0"
5"
10"
15"
20"
25"
30"
35"
40"
45"
0"
200"
400"
600"
800"
1000"
330" 350" 370" 390" 410" 430" 450" 470"
Radian
ce,"W
/cm
2 "sr"
Spectral"Rad
iance,"W
/cm
2 "µm"sr"
Wavelength,"nm"
NEQAIR" HARA" EAST"
NEQAIR"Integrated" HARA"Integrated" EAST"Integrated"
(b)
0"
20"
40"
60"
80"
100"
120"
140"
0"
500"
1000"
1500"
2000"
2500"
500" 550" 600" 650" 700" 750" 800" 850"
Radian
ce,"W
/cm
2 "sr"
Spectral"Rad
iance,"W
/cm
2 "µm"sr"
Wavelength,"nm"
NEQAIR" HARA" EAST"
NEQAIR"Integrated" HARA"Integrated" EAST"Integrated"
(c)
0"
20"
40"
60"
80"
100"
120"
140"
0"
500"
1000"
1500"
2000"
2500"
890" 990" 1090" 1190" 1290" 1390"
Radian
ce,"W
/cm
2 "sr"
Spectral"Rad
iance,"W
/cm
2 "µm"sr"
Wavelength,"nm"
NEQAIR" HARA" EAST"
NEQAIR"Integrated" HARA"Integrated" EAST"Integrated"
(d)
Figure 3. Spectral comparison of NEQAIR, HARA and EAST data at 15.52 km/s and 0.1 Torr for the (a) VUV, (b)UV/Vis, (c) Vis/NIR and (d) IR.
6 of 24
American Institute of Aeronautics and Astronautics

0"
10"
20"
30"
40"
50"
60"
0"
20000"
40000"
60000"
80000"
170" 172" 174" 176" 178" 180"
Radian
ce,"W
/cm
2 "sr"
Spectral"Rad
iance,"W
/cm
2 "µm"sr"
Wavelength,"nm"
NEQAIR" HARA" EAST"
NEQAIR"Integrated" HARA"Integrated" EAST"Integrated"
(a)
0"
10"
20"
30"
40"
50"
60"
0"
200"
400"
600"
800"
1000"
1200"
1400"
1600"
330" 350" 370" 390" 410" 430" 450" 470"
Radian
ce,"W
/cm
2 "sr"
Spectral"Rad
iance,"W
/cm
2 "µm"sr"
Wavelength,"nm"
NEQAIR" HARA" EAST"
NEQAIR"Integrated" HARA"Integrated" EAST"Integrated"
(b)
0"
50"
100"
150"
200"
0"
500"
1000"
1500"
2000"
2500"
3000"
500" 550" 600" 650" 700" 750" 800" 850"
Radian
ce,"W
/cm
2 "sr"
Spectral"Rad
iance,"W
/cm
2 "µm"sr"
Wavelength,"nm"
NEQAIR" HARA" EAST"
NEQAIR"Integrated" HARA"Integrated" EAST"Integrated"
(c)
0"
50"
100"
150"
200"
0"
1000"
2000"
3000"
4000"
5000"
890" 990" 1090" 1190" 1290" 1390"
Radian
ce,"W
/cm
2 "sr"
Spectral"Rad
iance,"W
/cm
2 "µm"sr"
Wavelength,"nm"
NEQAIR" HARA" EAST"
NEQAIR"Integrated" HARA"Integrated" EAST"Integrated"
(d)
Figure 4. Spectral comparison of NEQAIR, HARA and EAST data at 13.64 km/s and 0.2 Torr for the (a) VUV, (b)UV/Vis, (c) Vis/NIR and (d) IR.
7 of 24
American Institute of Aeronautics and Astronautics
III.D. High Speed Phenomena
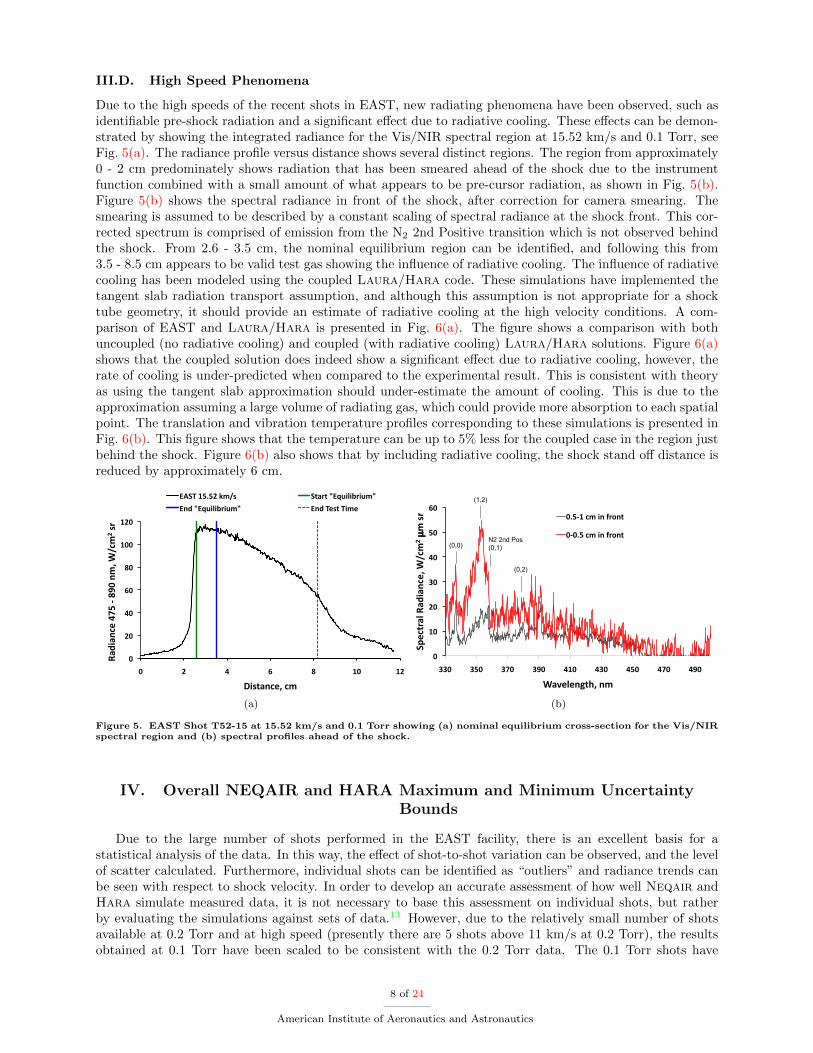
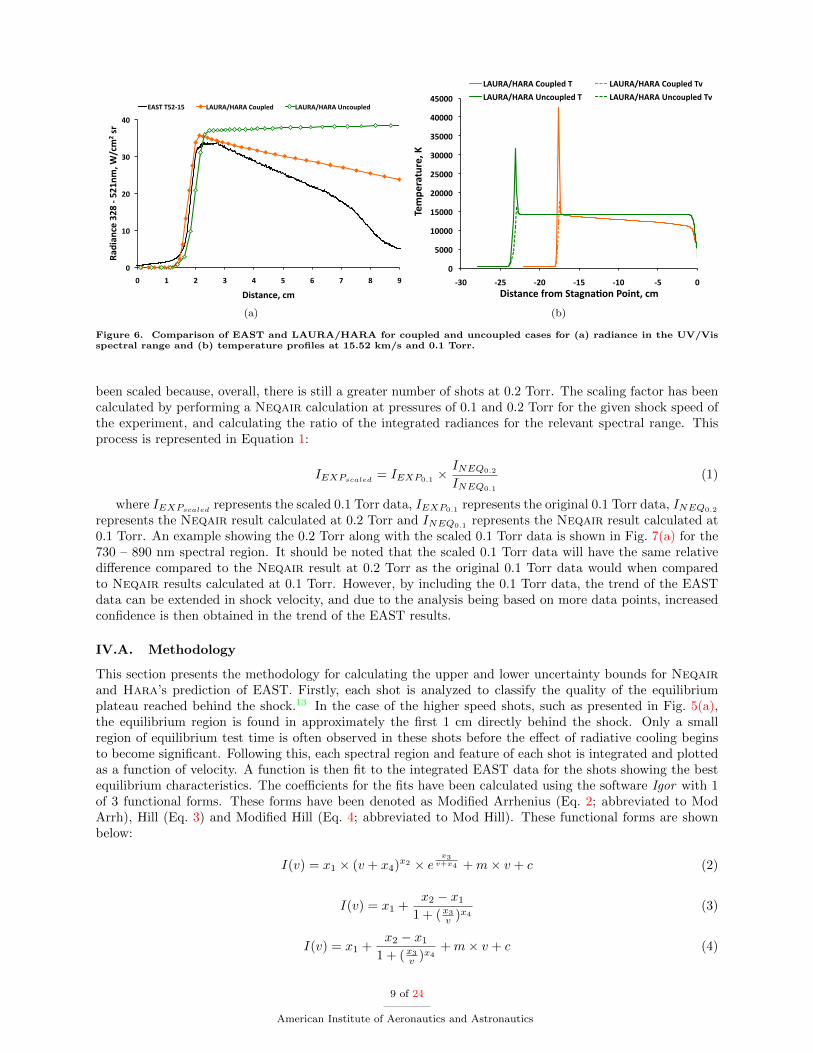
Due to the high speeds of the recent shots in EAST, new radiating phenomena have been observed, such asidentifiable pre-shock radiation and a significant effect due to radiative cooling. These effects can be demon-strated by showing the integrated radiance for the Vis/NIR spectral region at 15.52 km/s and 0.1 Torr, seeFig. 5(a). The radiance profile versus distance shows several distinct regions. The region from approximately0 - 2 cm predominately shows radiation that has been smeared ahead of the shock due to the instrumentfunction combined with a small amount of what appears to be pre-cursor radiation, as shown in Fig. 5(b).Figure 5(b) shows the spectral radiance in front of the shock, after correction for camera smearing. Thesmearing is assumed to be described by a constant scaling of spectral radiance at the shock front. This cor-rected spectrum is comprised of emission from the N2 2nd Positive transition which is not observed behindthe shock. From 2.6 - 3.5 cm, the nominal equilibrium region can be identified, and following this from3.5 - 8.5 cm appears to be valid test gas showing the influence of radiative cooling. The influence of radiativecooling has been modeled using the coupled Laura/Hara code. These simulations have implemented thetangent slab radiation transport assumption, and although this assumption is not appropriate for a shocktube geometry, it should provide an estimate of radiative cooling at the high velocity conditions. A com-parison of EAST and Laura/Hara is presented in Fig. 6(a). The figure shows a comparison with bothuncoupled (no radiative cooling) and coupled (with radiative cooling) Laura/Hara solutions. Figure 6(a)shows that the coupled solution does indeed show a significant effect due to radiative cooling, however, therate of cooling is under-predicted when compared to the experimental result. This is consistent with theoryas using the tangent slab approximation should under-estimate the amount of cooling. This is due to theapproximation assuming a large volume of radiating gas, which could provide more absorption to each spatialpoint. The translation and vibration temperature profiles corresponding to these simulations is presented inFig. 6(b). This figure shows that the temperature can be up to 5% less for the coupled case in the region justbehind the shock. Figure 6(b) also shows that by including radiative cooling, the shock stand off distance isreduced by approximately 6 cm.
!"
#!"
$!"
%!"
&!"
'!!"
'#!"
!" #" $" %" &" '!" '#"
()*+),-."$/0"1"&2!",34"56-3
#"78"
9+7:),-.4"-3"
;<=>"'0?0#"@367" =:)8:"A;BC+D+E8+C3A"
;,*"A;BC+D+E8+C3A" ;,*">.7:">+3."
(a)
!"
#!"
$!"
%!"
&!"
'!"
(!"
%%!" %'!" %)!" %*!" &#!" &%!" &'!" &)!" &*!"
+,-./012"314516.-7"89.:
$"µ:";0"
81<-2-6=/>7"6:"
!?'@#".:"56"A0B6/"
!@!?'".:"56"A0B6/"N2 2nd Pos
(0,1)
(0,2)
(0,0)
(1,2)
(b)
Figure 5. EAST Shot T52-15 at 15.52 km/s and 0.1 Torr showing (a) nominal equilibrium cross-section for the Vis/NIRspectral region and (b) spectral profiles ahead of the shock.
IV. Overall NEQAIR and HARA Maximum and Minimum UncertaintyBounds
Due to the large number of shots performed in the EAST facility, there is an excellent basis for astatistical analysis of the data. In this way, the effect of shot-to-shot variation can be observed, and the levelof scatter calculated. Furthermore, individual shots can be identified as “outliers” and radiance trends canbe seen with respect to shock velocity. In order to develop an accurate assessment of how well Neqair andHara simulate measured data, it is not necessary to base this assessment on individual shots, but ratherby evaluating the simulations against sets of data.13 However, due to the relatively small number of shotsavailable at 0.2 Torr and at high speed (presently there are 5 shots above 11 km/s at 0.2 Torr), the resultsobtained at 0.1 Torr have been scaled to be consistent with the 0.2 Torr data. The 0.1 Torr shots have
8 of 24
American Institute of Aeronautics and Astronautics
!"
#!"
$!"
%!"
&!"
!" #" $" %" &" '" (" )" *" +"
,-./-012"%$*"3"'$#045"6714
$"89"
:/8;-0125"14"
<=>?"?'$3#'" @=A,=7B=,="CDEFG2." @=A,=7B=,="A01DEFG2."
(a)
!"
#!!!"
$!!!!"
$#!!!"
%!!!!"
%#!!!"
&!!!!"
&#!!!"
'!!!!"
'#!!!"
(&!" (%#" (%!" ($#" ($!" (#" !"
)*+,*-./0-*1"2"
345/.67*"8-9+":/.;6.<96"=946/1"7+"
>?@A?BC?A?"D90,E*F")" >?@A?BC?A?"D90,E*F")G"
>?@A?BC?A?"@6790,E*F")" >?@A?BC?A?"@6790,E*F")G"
(b)
Figure 6. Comparison of EAST and LAURA/HARA for coupled and uncoupled cases for (a) radiance in the UV/Visspectral range and (b) temperature profiles at 15.52 km/s and 0.1 Torr.
been scaled because, overall, there is still a greater number of shots at 0.2 Torr. The scaling factor has beencalculated by performing a Neqair calculation at pressures of 0.1 and 0.2 Torr for the given shock speed ofthe experiment, and calculating the ratio of the integrated radiances for the relevant spectral range. Thisprocess is represented in Equation 1:
IEXPscaled= IEXP0.1
× INEQ0.2
INEQ0.1
(1)
where IEXPscaledrepresents the scaled 0.1 Torr data, IEXP0.1
represents the original 0.1 Torr data, INEQ0.2
represents the Neqair result calculated at 0.2 Torr and INEQ0.1 represents the Neqair result calculated at0.1 Torr. An example showing the 0.2 Torr along with the scaled 0.1 Torr data is shown in Fig. 7(a) for the730 – 890 nm spectral region. It should be noted that the scaled 0.1 Torr data will have the same relativedifference compared to the Neqair result at 0.2 Torr as the original 0.1 Torr data would when comparedto Neqair results calculated at 0.1 Torr. However, by including the 0.1 Torr data, the trend of the EASTdata can be extended in shock velocity, and due to the analysis being based on more data points, increasedconfidence is then obtained in the trend of the EAST results.
IV.A. Methodology
This section presents the methodology for calculating the upper and lower uncertainty bounds for Neqairand Hara’s prediction of EAST. Firstly, each shot is analyzed to classify the quality of the equilibriumplateau reached behind the shock.13 In the case of the higher speed shots, such as presented in Fig. 5(a),the equilibrium region is found in approximately the first 1 cm directly behind the shock. Only a smallregion of equilibrium test time is often observed in these shots before the effect of radiative cooling beginsto become significant. Following this, each spectral region and feature of each shot is integrated and plottedas a function of velocity. A function is then fit to the integrated EAST data for the shots showing the bestequilibrium characteristics. The coefficients for the fits have been calculated using the software Igor with 1of 3 functional forms. These forms have been denoted as Modified Arrhenius (Eq. 2; abbreviated to ModArrh), Hill (Eq. 3) and Modified Hill (Eq. 4; abbreviated to Mod Hill). These functional forms are shownbelow:
I(v) = x1 × (v + x4)x2 × ex3
v+x4 +m× v + c (2)
I(v) = x1 +x2 − x1
1 + (x3
v )x4(3)
I(v) = x1 +x2 − x1
1 + (x3
v )x4+m× v + c (4)
9 of 24
American Institute of Aeronautics and Astronautics
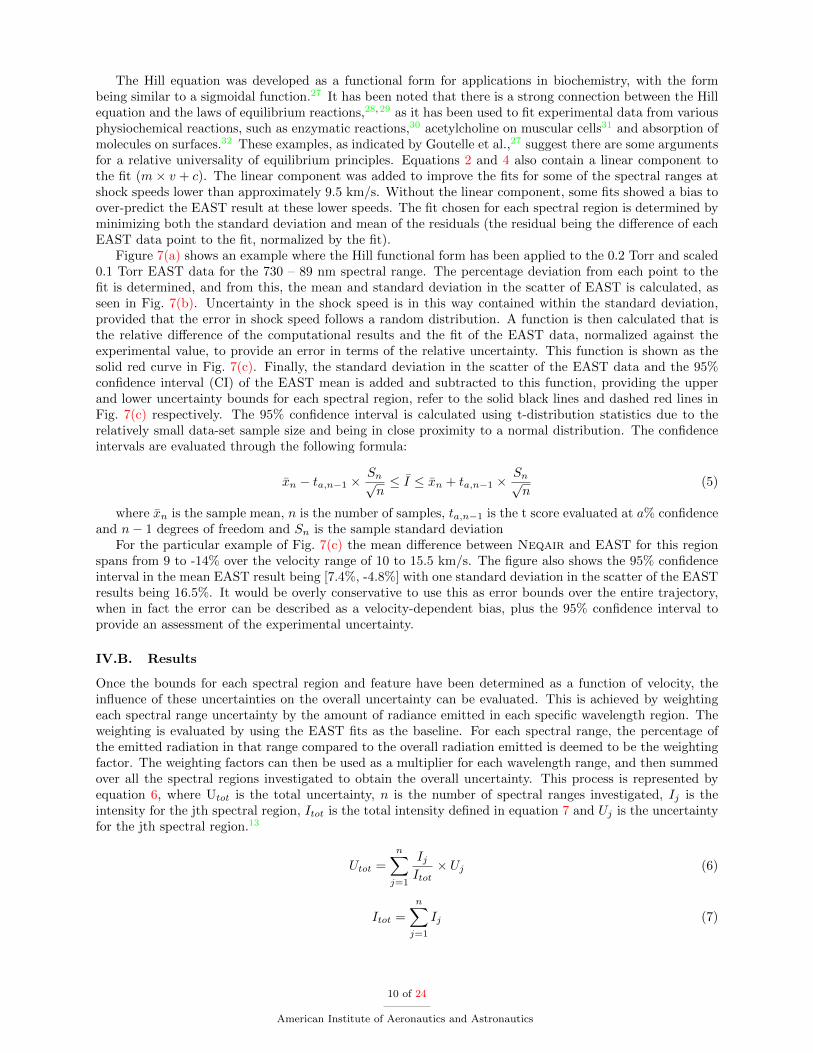
The Hill equation was developed as a functional form for applications in biochemistry, with the formbeing similar to a sigmoidal function.27 It has been noted that there is a strong connection between the Hillequation and the laws of equilibrium reactions,28,29 as it has been used to fit experimental data from variousphysiochemical reactions, such as enzymatic reactions,30 acetylcholine on muscular cells31 and absorption ofmolecules on surfaces.32 These examples, as indicated by Goutelle et al.,27 suggest there are some argumentsfor a relative universality of equilibrium principles. Equations 2 and 4 also contain a linear component tothe fit (m× v + c). The linear component was added to improve the fits for some of the spectral ranges atshock speeds lower than approximately 9.5 km/s. Without the linear component, some fits showed a bias toover-predict the EAST result at these lower speeds. The fit chosen for each spectral region is determined byminimizing both the standard deviation and mean of the residuals (the residual being the difference of eachEAST data point to the fit, normalized by the fit).
Figure 7(a) shows an example where the Hill functional form has been applied to the 0.2 Torr and scaled0.1 Torr EAST data for the 730 – 89 nm spectral range. The percentage deviation from each point to thefit is determined, and from this, the mean and standard deviation in the scatter of EAST is calculated, asseen in Fig. 7(b). Uncertainty in the shock speed is in this way contained within the standard deviation,provided that the error in shock speed follows a random distribution. A function is then calculated that isthe relative difference of the computational results and the fit of the EAST data, normalized against theexperimental value, to provide an error in terms of the relative uncertainty. This function is shown as thesolid red curve in Fig. 7(c). Finally, the standard deviation in the scatter of the EAST data and the 95%confidence interval (CI) of the EAST mean is added and subtracted to this function, providing the upperand lower uncertainty bounds for each spectral region, refer to the solid black lines and dashed red lines inFig. 7(c) respectively. The 95% confidence interval is calculated using t-distribution statistics due to therelatively small data-set sample size and being in close proximity to a normal distribution. The confidenceintervals are evaluated through the following formula:
xn − ta,n−1 ×Sn√n≤ I ≤ xn + ta,n−1 ×
Sn√n
(5)
where xn is the sample mean, n is the number of samples, ta,n−1 is the t score evaluated at a% confidenceand n− 1 degrees of freedom and Sn is the sample standard deviation
For the particular example of Fig. 7(c) the mean difference between Neqair and EAST for this regionspans from 9 to -14% over the velocity range of 10 to 15.5 km/s. The figure also shows the 95% confidenceinterval in the mean EAST result being [7.4%, -4.8%] with one standard deviation in the scatter of the EASTresults being 16.5%. It would be overly conservative to use this as error bounds over the entire trajectory,when in fact the error can be described as a velocity-dependent bias, plus the 95% confidence interval toprovide an assessment of the experimental uncertainty.
IV.B. Results
Once the bounds for each spectral region and feature have been determined as a function of velocity, theinfluence of these uncertainties on the overall uncertainty can be evaluated. This is achieved by weightingeach spectral range uncertainty by the amount of radiance emitted in each specific wavelength region. Theweighting is evaluated by using the EAST fits as the baseline. For each spectral range, the percentage ofthe emitted radiation in that range compared to the overall radiation emitted is deemed to be the weightingfactor. The weighting factors can then be used as a multiplier for each wavelength range, and then summedover all the spectral regions investigated to obtain the overall uncertainty. This process is represented byequation 6, where Utot is the total uncertainty, n is the number of spectral ranges investigated, Ij is theintensity for the jth spectral region, Itot is the total intensity defined in equation 7 and Uj is the uncertaintyfor the jth spectral region.13
Utot =
n∑j=1
IjItot× Uj (6)
Itot =
n∑j=1
Ij (7)
10 of 24
American Institute of Aeronautics and Astronautics
!"
#!"
$!"
%!"
&!"
'!!"
'#!"
'$!"
'%!"
'&!"
#!!"
(" '!" ''" '#" ')" '$" '*" '%"
+,-.,/01"2)!"3"&(!"/45"6704
#"89"
:;<0=">1?<0.@A5"=478"
BC:D"!E#"D<99" BC:D"!E'"D<99":0,?1-" BC:D"F.@"
(a)
!"#$%
!&#$%
!'#$%
#$%
'#$%
&#$%
"#$%
(% )#% ))% )'% )*% )&% )+% )"%
,-./-01%2/34-.5%6*#%!%7(#08%
29:/;%<-=:/>1?@%;8AB%
,-./-01%2/34-.%3.:C0D%EF2G%H>1%
,=CBAI>0CB%)!2>J83%
(+$%K:0LD-0/-%M01-.N3=%>0%I-30%:O%EF2G%
(b)
!30%%
!20%%
!10%%
0%%
10%%
20%%
30%%
9% 10% 11% 12% 13% 14% 15% 16%Percen
t%Differen
ce,%(EA
ST%!%NEQ
AIR)/
EAST,%730%!%890n
m%
Shock%Velocity,%km/s%
Percent%Difference%of%EAST%fit%and%NEQAIR%
Plus/Minus%1!Sigma%of%EAST%
Percent%Difference%of%Plus/Minus%95%%CI%of%EAST%and%NEQAIR%
Perfect%Agreement%Line%
(c)
Figure 7. Method for obtaining upper and lower uncertainty for each spectral feature. (a) Fitting EAST with a function,(b) Calculating standard deviation from scatter of EAST results around the fit, (c) Uncertainty for NEQAIR’s predictionof the 730 - 890 nm spectral region of EAST.
11 of 24
American Institute of Aeronautics and Astronautics
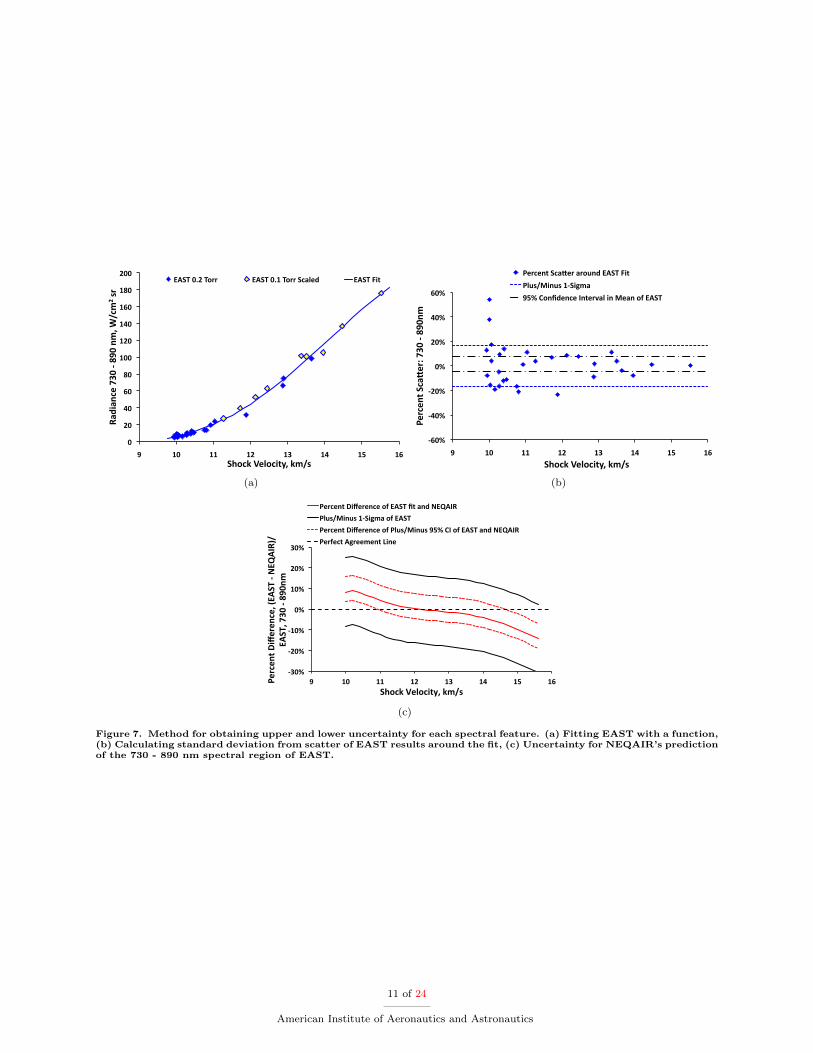
Information regarding the individual spectral regions fits are provided in Tables 2 and 3. Table 2 showsthe coefficients for each fit of each region analyzed. These fits can be used for comparisons of trends foundin the EAST data with other experiments or simulations. There are some gaps in the wavelength regionsanalyzed due to these regions either containing contamination lines (usually H-alpha or carbon), have nosignificant spectral features or having not yet been measured at high speed. The standard deviation of thescatter around the fit and the 95% confidence interval in the mean of the EAST data at 13 km/s is alsopresented in Table 3 to give an idea of the significance of any discrepancies between future comparisonsof simulations with EAST. Finally, the sum of residuals from the fit is provided to give an indication ofany bias in the fit (this value is also the sample mean used in the calculation of the confidence intervals).Figures showing the comparison of Neqair, Hara and EAST with 0.2 Torr and scaled 0.1 Torr EASTdata covering from the VUV to IR spectral regions are shown in Appendix A. For each wavelength range thecomparison is shown on both a log and linear scale. The log scale has been used to highlight the overall trendof the comparison and any discrepancies at the lower speeds. The linear scale has been used to highlight thesignificance of the uncertainty and the 95% confidence intervals, while also showing any discrepancies at thehigher speeds. An example of three such plots is shown in Fig. 8. The reason these three plots have beenused as an example is to show the biggest discrepancy between the codes and EAST (Fig. 8(a)), and thebiggest discrepancy between the two codes (Figs. 8(b) and 8(c)).
Figure 8(a) shows that at speeds around 10 km/s both codes are in close agreement with EAST, however,between 10.5 and 14.5 km/s, there is a substantial over-prediction of the 174 nm nitrogen line. Not onlyis the magnitude not in good agreement, but the trend between the codes and EAST is different. It washypothesized that boundary layer absorption not accounted for in the simulations could be responsible forthe disagreements. Therefore, the potential for boundary layer absorption causing a decrease in the measuredradiation was investigated by approximating the boundary layer as a thin constant property layer, throughwhich the radiation from the core flow must pass. The pressure of this thin layer was assumed equal to thecore flow and in chemical equilibrium at a range of temperatures from 1000 to 8000 K, while the thickness ofthis layer was varied from 0.5 to 2 cm. For all cases, the only noticeable absorption occurred below 140 nmand the boundary layer did not contribute any noticable emission. The influence of the boundary layer onthe present measurements is therefore limited to the decrease in the path length of the core flow, which isequal to twice the boundary layer thickness. For optically thin regions of the spectrum, this path lengthdecrease will result in a proportional decrease in the measured intensity. Without a full CFD solution of theEAST facility available, it is presently assumed that the boundary layer thickness is negligible.
Uncertainty in Stark broadening parameters has previously been shown to influence the intensity of VUVradiance (approximately a 10 – 15% change in intensity when the Stark width is increased or decreased by afactor of 2 at 10.98 km/s and 0.15 Torr).2 However, if it is assumed that this relationship of Stark broadeningand radiative intensity is constant with shock speed, the 15% increase would not be sufficient to provideperfect agreement between the simulations and experiment.
Uncertainty in the flow temperature of EAST could plausibly provide a reason for the discrepancy asthe 174 nm nitrogen line is strongly absorbed (> 99% of the total emission is absorbed), and therefore theintensity is strongly dependent on temperature. According to a calculation performed with Neqair, for thecondition at 13.64 km/s and 0.2 Torr, a decrease of 2% and 5% from the nominal equilibrium temperatureresults in a reduction of the radiance by 15% and 35% respectively. This level of reduction in radianceis similar in magnitude to what would be needed to provide good agreement between the simulations andexperiment. If the temperature is indeed less than equilibrium (as shown in the coupled Laura/Harasolution presented in Fig. 6(b)), it could be an indication of the presence of radiative cooling taking effectin the nominated equilibrium region of the flow.
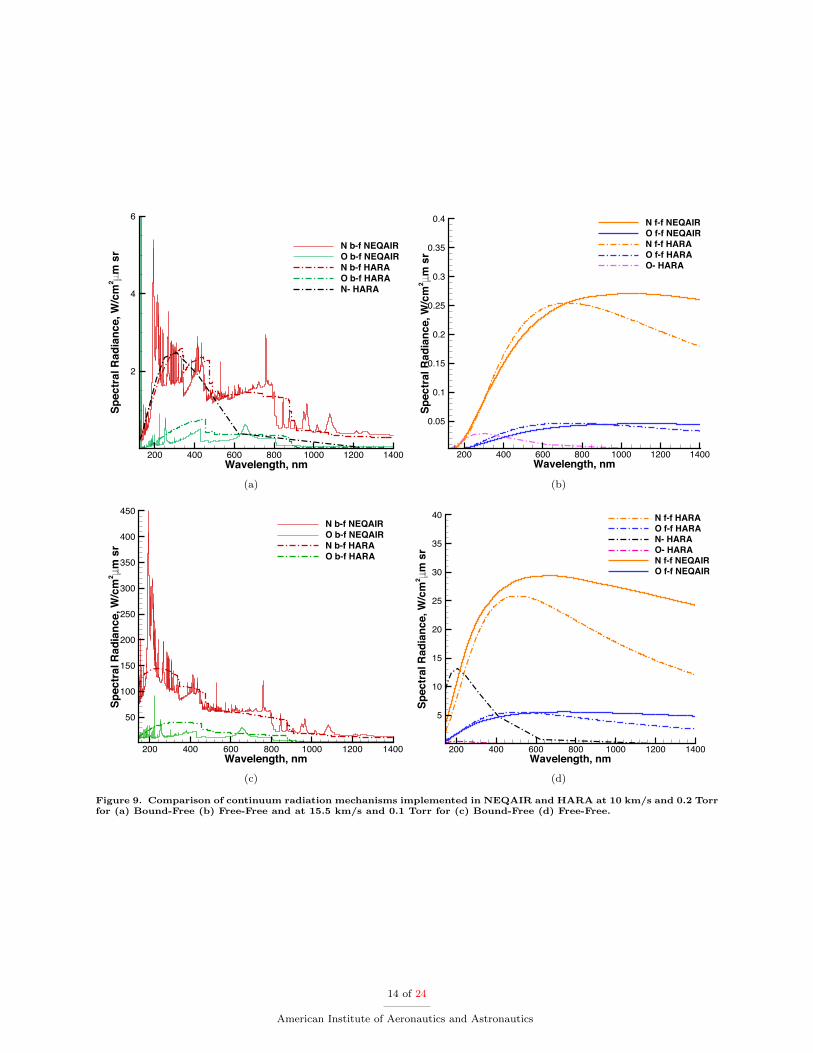
Figures 8(b) and 8(c) shows a comparison between the 2 codes and EAST for a spectral region dominatedby background continuum, and is therefore an example of the biggest discrepancy between Neqair andHara. As previously mentioned, Hara models the contribution to the continuum from electron attachmentwhich is not implemented in Neqair and uses a curve fit for the bound-free where as Neqair implementsthe full TOPBase database. The magnitude in the differences between Neqair and Hara for the variousmechanisms providing continuum radiation is shown in Fig. 9. Figure 9 shows that the most significantcontributor to the background continuum is that resulting from bound-free nitrogen. It is also clear fromthe figure, that by implementing the full cross sections from TOPbase, the nitrogen bound-free continuum issignificantly higher in VUV/UV spectral range (from approximately 200 - 250 nm). Furthermore, Figs. 9(a)and 9(b) show that the continuum resulting from N− is comparable in magnitude to that of the nitrogen
12 of 24
American Institute of Aeronautics and Astronautics
bound-free at 10 km/s. However, at 15.5 km/s, the N− is relatively negligible, as seen in Figs. 9(c) and 9(d).The TOPBase lines implemented in Hara can also clearly be observed in Figs. 3(b) and 4(b) and appearto be significantly stronger than those present in the EAST data. The superposition of these TOPBaselines (and corresponding line wings) may also provide an elevated level of background continuum. If theTOPBase lines were to be removed from the Hara simulation, the integrated intensity in the UV/Vis from330 to 480 nm at 13.64 km/s and 0.2 Torr would decrease from approximately 35 W/cm2 sr to 32 W/cm2 srand therefore be in closer agreement to EAST. These differences in implementation are the source of thediscrepancies seen between the Neqair and Hara results presented in Fig. 8(b) and 8(c). Figure 8(b)shows that Neqair shows very good agreement with EAST while Hara under-predicts this backgroundcontinuum dominated spectral region. The spectral range shown in Fig. 8(c) is a little more complicated asatomic emission is also present. The figure shows that from approximately 10 to 12 km/s, both Neqair andHara are in good agreement with the EAST data. However, from 12 to 15.5 km/s, the Hara result beginsto over predict EAST.
1"
10"
100"
9.5" 10.5" 11.5" 12.5" 13.5" 14.5" 15.5"
Radian
ce"170"2"180"nm
,"W/cm
2 "sr"
Shock"Velocity,"km/s"
EAST"0.2"Torr" EAST"Fit"EAST"0.1"Torr"scaled" EAST"Fit"95%"CI"[26.6%,"9.6%]"NEQAIR" HARA"
(a)
0"
10"
20"
30"
40"
50"
60"
70"
9.6" 10.6" 11.6" 12.6" 13.6" 14.6" 15.6"
Radian
ce"182"4"217"nm
,"W/cm
2 "sr"
Shock"Velocity,"km/s"
EAST"0.2"Torr" EAST"Fit"
EAST"0.1"Torr"Scaled" EAST"Fit"95%"CI"[49.7%,"13.0%]"
NEQAIR" HARA"
(b)
0"
20"
40"
60"
80"
100"
120"
9.5" 10.5" 11.5" 12.5" 13.5" 14.5" 15.5"
Radian
ce"339"3"471"nm
,"W/cm
2 "sr"
Shock"Velocity,"km/s"
EAST"0.2"Torr" EAST"Fit"
EAST"scaled"0.1"Torr" EAST"Fit"95%"CI"[39.1%,"2.7%]"
NEQAIR" HARA"
(c)
Figure 8. Comparison of EAST, NEQAIR and HARA for the (a) 170 – 180 nm spectral region, (b) 182 – 217 nmspectral region and (c) 339 – 471 nm spectral region versus shock velocity.
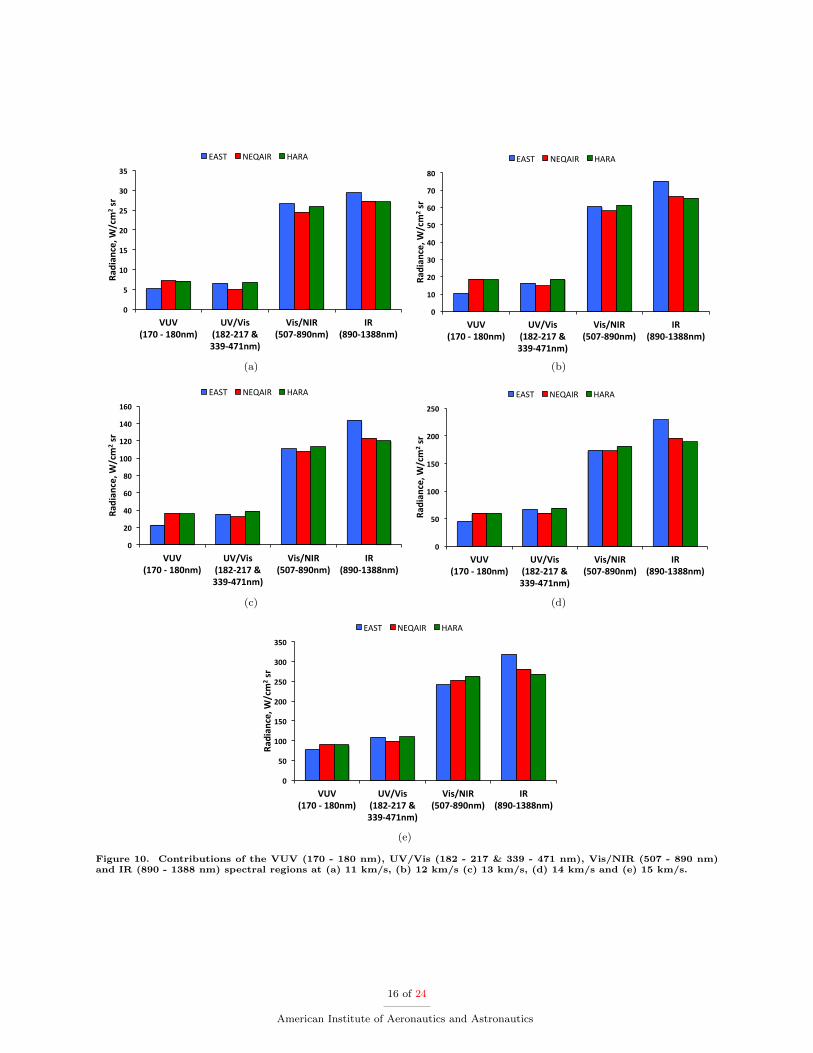
Figure 10 shows a plot of the EAST fits evaluated at shock speeds of 11, 12, 13, 14 and 15 km/s withcomparisons to the results obtained from Neqair and Hara. It should be noted that the significance ofthe VUV is reduced in this figure compared to what has previously been reported,13 and this is due tothe limited wavelength range the data obtained in EAST during the high speed test campaign (Test 52).The previous analysis extended in the VUV down to 129 nm,13 while this analysis only shows data to170 nm. As has been previously mentioned, it was concluded by Brandis et al.13 that EAST shows goodequilibrium characteristics for shock speeds from 10 – 11.5 km/s, and consequently the experimental resultswere shown to be in good agreement with both Neqair and Hara. From the results presented in Fig. 10this good agreement can be seen to continue up to shocks speeds of 15.5 km/s. This would indicate that
13 of 24
American Institute of Aeronautics and Astronautics
Wavelength, nm
Spec
tral R
adia
nce,
W/c
m2
m s
r
200 400 600 800 1000 1200 1400
2
4
6
N b-f NEQAIRO b-f NEQAIRN b-f HARAO b-f HARAN- HARA
(a)
Wavelength, nm
Spec
tral R
adia
nce,
W/c
m2
m s
r
200 400 600 800 1000 1200 1400
0.05
0.1
0.15
0.2
0.25
0.3
0.35
0.4 N f-f NEQAIRO f-f NEQAIRN f-f HARAO f-f HARAO- HARA
(b)
Wavelength, nm
Spec
tral R
adia
nce,
W/c
m2
m s
r
200 400 600 800 1000 1200 1400
50
100
150
200
250
300
350
400
450N b-f NEQAIRO b-f NEQAIRN b-f HARAO b-f HARA
(c)
Wavelength, nm
Spec
tral R
adia
nce,
W/c
m2
m s
r
200 400 600 800 1000 1200 1400
5
10
15
20
25
30
35
40 N f-f HARAO f-f HARAN- HARAO- HARAN f-f NEQAIRO f-f NEQAIR
(d)
Figure 9. Comparison of continuum radiation mechanisms implemented in NEQAIR and HARA at 10 km/s and 0.2 Torrfor (a) Bound-Free (b) Free-Free and at 15.5 km/s and 0.1 Torr for (c) Bound-Free (d) Free-Free.
14 of 24
American Institute of Aeronautics and Astronautics
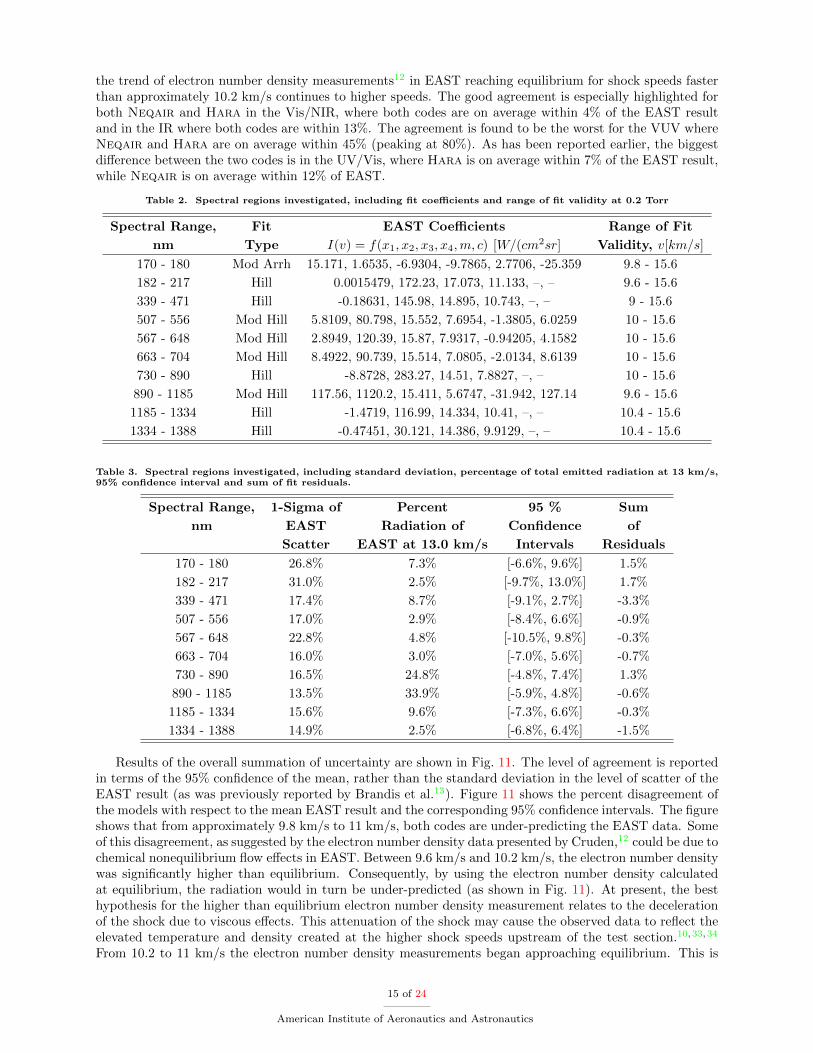
the trend of electron number density measurements12 in EAST reaching equilibrium for shock speeds fasterthan approximately 10.2 km/s continues to higher speeds. The good agreement is especially highlighted forboth Neqair and Hara in the Vis/NIR, where both codes are on average within 4% of the EAST resultand in the IR where both codes are within 13%. The agreement is found to be the worst for the VUV whereNeqair and Hara are on average within 45% (peaking at 80%). As has been reported earlier, the biggestdifference between the two codes is in the UV/Vis, where Hara is on average within 7% of the EAST result,while Neqair is on average within 12% of EAST.
Table 2. Spectral regions investigated, including fit coefficients and range of fit validity at 0.2 Torr
Spectral Range, Fit EAST Coefficients Range of Fit
nm Type I(v) = f(x1, x2, x3, x4,m, c) [W/(cm2sr] Validity, v[km/s]
170 - 180 Mod Arrh 15.171, 1.6535, -6.9304, -9.7865, 2.7706, -25.359 9.8 - 15.6
182 - 217 Hill 0.0015479, 172.23, 17.073, 11.133, –, – 9.6 - 15.6
339 - 471 Hill -0.18631, 145.98, 14.895, 10.743, –, – 9 - 15.6
507 - 556 Mod Hill 5.8109, 80.798, 15.552, 7.6954, -1.3805, 6.0259 10 - 15.6
567 - 648 Mod Hill 2.8949, 120.39, 15.87, 7.9317, -0.94205, 4.1582 10 - 15.6
663 - 704 Mod Hill 8.4922, 90.739, 15.514, 7.0805, -2.0134, 8.6139 10 - 15.6
730 - 890 Hill -8.8728, 283.27, 14.51, 7.8827, –, – 10 - 15.6
890 - 1185 Mod Hill 117.56, 1120.2, 15.411, 5.6747, -31.942, 127.14 9.6 - 15.6
1185 - 1334 Hill -1.4719, 116.99, 14.334, 10.41, –, – 10.4 - 15.6
1334 - 1388 Hill -0.47451, 30.121, 14.386, 9.9129, –, – 10.4 - 15.6
Table 3. Spectral regions investigated, including standard deviation, percentage of total emitted radiation at 13 km/s,95% confidence interval and sum of fit residuals.
Spectral Range, 1-Sigma of Percent 95 % Sum
nm EAST Radiation of Confidence of
Scatter EAST at 13.0 km/s Intervals Residuals
170 - 180 26.8% 7.3% [-6.6%, 9.6%] 1.5%
182 - 217 31.0% 2.5% [-9.7%, 13.0%] 1.7%
339 - 471 17.4% 8.7% [-9.1%, 2.7%] -3.3%
507 - 556 17.0% 2.9% [-8.4%, 6.6%] -0.9%
567 - 648 22.8% 4.8% [-10.5%, 9.8%] -0.3%
663 - 704 16.0% 3.0% [-7.0%, 5.6%] -0.7%
730 - 890 16.5% 24.8% [-4.8%, 7.4%] 1.3%
890 - 1185 13.5% 33.9% [-5.9%, 4.8%] -0.6%
1185 - 1334 15.6% 9.6% [-7.3%, 6.6%] -0.3%
1334 - 1388 14.9% 2.5% [-6.8%, 6.4%] -1.5%
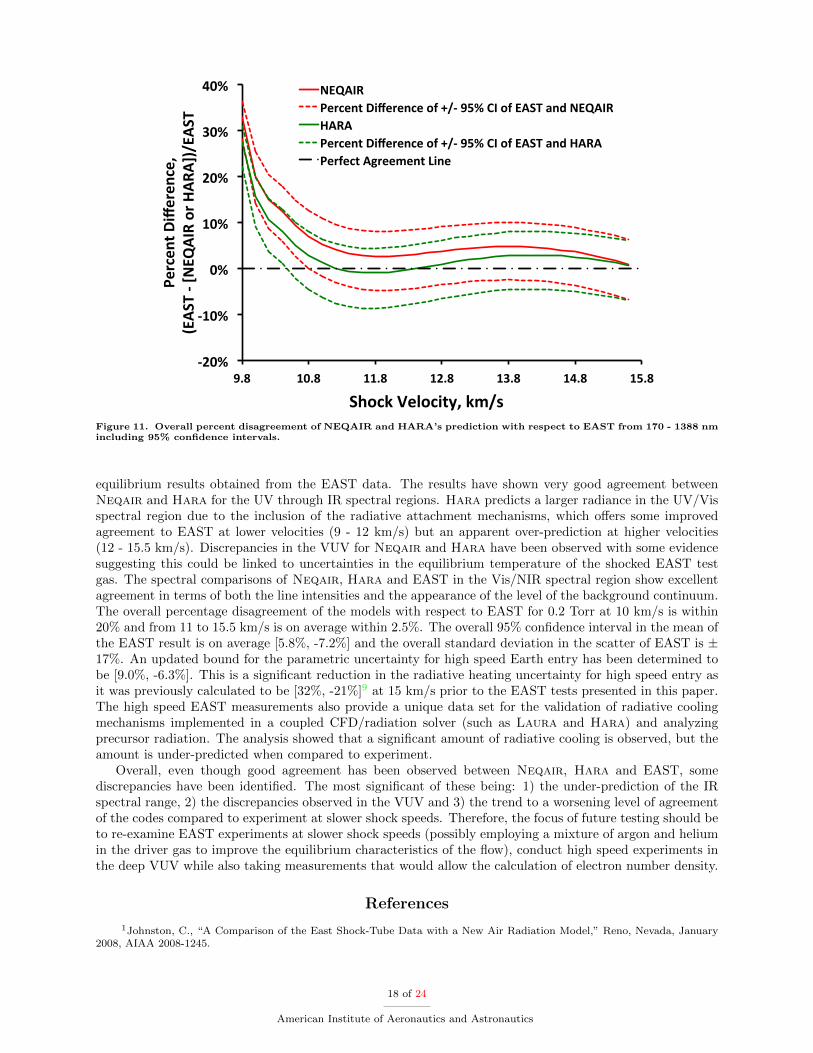
Results of the overall summation of uncertainty are shown in Fig. 11. The level of agreement is reportedin terms of the 95% confidence of the mean, rather than the standard deviation in the level of scatter of theEAST result (as was previously reported by Brandis et al.13). Figure 11 shows the percent disagreement ofthe models with respect to the mean EAST result and the corresponding 95% confidence intervals. The figureshows that from approximately 9.8 km/s to 11 km/s, both codes are under-predicting the EAST data. Someof this disagreement, as suggested by the electron number density data presented by Cruden,12 could be due tochemical nonequilibrium flow effects in EAST. Between 9.6 km/s and 10.2 km/s, the electron number densitywas significantly higher than equilibrium. Consequently, by using the electron number density calculatedat equilibrium, the radiation would in turn be under-predicted (as shown in Fig. 11). At present, the besthypothesis for the higher than equilibrium electron number density measurement relates to the decelerationof the shock due to viscous effects. This attenuation of the shock may cause the observed data to reflect theelevated temperature and density created at the higher shock speeds upstream of the test section.10,33,34
From 10.2 to 11 km/s the electron number density measurements began approaching equilibrium. This is
15 of 24
American Institute of Aeronautics and Astronautics
0"
5"
10"
15"
20"
25"
30"
35"
VUV""""""""""""""(170"+"180nm)"
UV/Vis"""""""""""""""""""(182+217"&"339+471nm)"
Vis/NIR""""""""""(507+890nm)"
IR"""""""""""""(890+1388nm)"
Radian
ce,"W
/cm
2 "sr"
EAST% NEQAIR% HARA%
(a)
0"
10"
20"
30"
40"
50"
60"
70"
80"
VUV""""""""""""""(170"."180nm)"
UV/Vis"""""""""""""""""""(182.217"&"339.471nm)"
Vis/NIR""""""""""(507.890nm)"
IR"""""""""""""(890.1388nm)"
Radian
ce,"W
/cm
2 "sr"
EAST% NEQAIR% HARA%
(b)
0"
20"
40"
60"
80"
100"
120"
140"
160"
VUV""""""""""""""(170","180nm)"
UV/Vis"""""""""""""""""""(182,217"&"339,471nm)"
Vis/NIR""""""""""(507,890nm)"
IR"""""""""""""(890,1388nm)"
Radian
ce,"W
/cm
2 "sr"
EAST% NEQAIR% HARA%
(c)
0"
50"
100"
150"
200"
250"
VUV""""""""""""""(170"*"180nm)"
UV/Vis"""""""""""""""""""(182*217"&"339*471nm)"
Vis/NIR""""""""""(507*890nm)"
IR"""""""""""""(890*1388nm)"
Radian
ce,"W
/cm
2 "sr"
EAST% NEQAIR% HARA%
(d)
0"
50"
100"
150"
200"
250"
300"
350"
VUV""""""""""""""(170"+"180nm)"
UV/Vis"""""""""""""""""""(182+217"&"339+471nm)"
Vis/NIR""""""""""(507+890nm)"
IR"""""""""""""(890+1388nm)"
Radian
ce,"W
/cm
2 "sr"
EAST% NEQAIR% HARA%
(e)
Figure 10. Contributions of the VUV (170 - 180 nm), UV/Vis (182 - 217 & 339 - 471 nm), Vis/NIR (507 - 890 nm)and IR (890 - 1388 nm) spectral regions at (a) 11 km/s, (b) 12 km/s (c) 13 km/s, (d) 14 km/s and (e) 15 km/s.
16 of 24
American Institute of Aeronautics and Astronautics
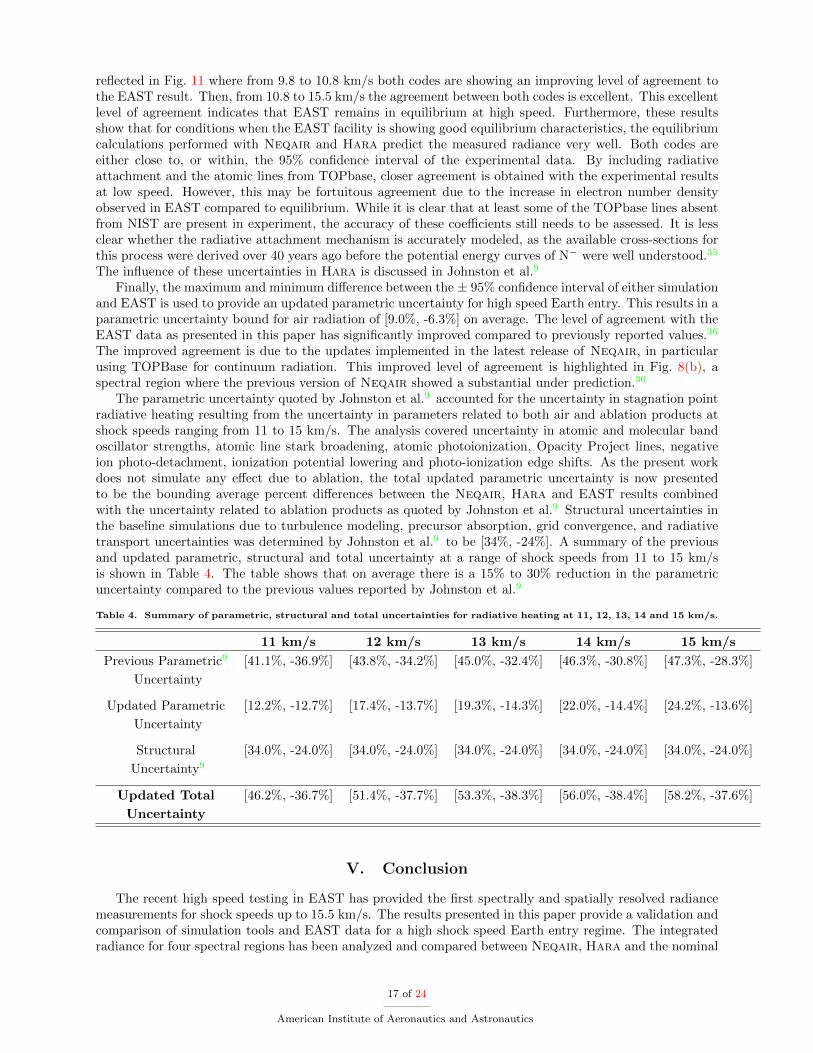
reflected in Fig. 11 where from 9.8 to 10.8 km/s both codes are showing an improving level of agreement tothe EAST result. Then, from 10.8 to 15.5 km/s the agreement between both codes is excellent. This excellentlevel of agreement indicates that EAST remains in equilibrium at high speed. Furthermore, these resultsshow that for conditions when the EAST facility is showing good equilibrium characteristics, the equilibriumcalculations performed with Neqair and Hara predict the measured radiance very well. Both codes areeither close to, or within, the 95% confidence interval of the experimental data. By including radiativeattachment and the atomic lines from TOPbase, closer agreement is obtained with the experimental resultsat low speed. However, this may be fortuitous agreement due to the increase in electron number densityobserved in EAST compared to equilibrium. While it is clear that at least some of the TOPbase lines absentfrom NIST are present in experiment, the accuracy of these coefficients still needs to be assessed. It is lessclear whether the radiative attachment mechanism is accurately modeled, as the available cross-sections forthis process were derived over 40 years ago before the potential energy curves of N− were well understood.35
The influence of these uncertainties in Hara is discussed in Johnston et al.9
Finally, the maximum and minimum difference between the ± 95% confidence interval of either simulationand EAST is used to provide an updated parametric uncertainty for high speed Earth entry. This results in aparametric uncertainty bound for air radiation of [9.0%, -6.3%] on average. The level of agreement with theEAST data as presented in this paper has significantly improved compared to previously reported values.36
The improved agreement is due to the updates implemented in the latest release of Neqair, in particularusing TOPBase for continuum radiation. This improved level of agreement is highlighted in Fig. 8(b), aspectral region where the previous version of Neqair showed a substantial under prediction.36
The parametric uncertainty quoted by Johnston et al.9 accounted for the uncertainty in stagnation pointradiative heating resulting from the uncertainty in parameters related to both air and ablation products atshock speeds ranging from 11 to 15 km/s. The analysis covered uncertainty in atomic and molecular bandoscillator strengths, atomic line stark broadening, atomic photoionization, Opacity Project lines, negativeion photo-detachment, ionization potential lowering and photo-ionization edge shifts. As the present workdoes not simulate any effect due to ablation, the total updated parametric uncertainty is now presentedto be the bounding average percent differences between the Neqair, Hara and EAST results combinedwith the uncertainty related to ablation products as quoted by Johnston et al.9 Structural uncertainties inthe baseline simulations due to turbulence modeling, precursor absorption, grid convergence, and radiativetransport uncertainties was determined by Johnston et al.9 to be [34%, -24%]. A summary of the previousand updated parametric, structural and total uncertainty at a range of shock speeds from 11 to 15 km/sis shown in Table 4. The table shows that on average there is a 15% to 30% reduction in the parametricuncertainty compared to the previous values reported by Johnston et al.9
Table 4. Summary of parametric, structural and total uncertainties for radiative heating at 11, 12, 13, 14 and 15 km/s.
11 km/s 12 km/s 13 km/s 14 km/s 15 km/s
Previous Parametric9 [41.1%, -36.9%] [43.8%, -34.2%] [45.0%, -32.4%] [46.3%, -30.8%] [47.3%, -28.3%]
Uncertainty
Updated Parametric [12.2%, -12.7%] [17.4%, -13.7%] [19.3%, -14.3%] [22.0%, -14.4%] [24.2%, -13.6%]
Uncertainty
Structural [34.0%, -24.0%] [34.0%, -24.0%] [34.0%, -24.0%] [34.0%, -24.0%] [34.0%, -24.0%]
Uncertainty9
Updated Total [46.2%, -36.7%] [51.4%, -37.7%] [53.3%, -38.3%] [56.0%, -38.4%] [58.2%, -37.6%]
Uncertainty
V. Conclusion
The recent high speed testing in EAST has provided the first spectrally and spatially resolved radiancemeasurements for shock speeds up to 15.5 km/s. The results presented in this paper provide a validation andcomparison of simulation tools and EAST data for a high shock speed Earth entry regime. The integratedradiance for four spectral regions has been analyzed and compared between Neqair, Hara and the nominal
17 of 24
American Institute of Aeronautics and Astronautics
!20%%
!10%%
0%%
10%%
20%%
30%%
40%%
9.8% 10.8% 11.8% 12.8% 13.8% 14.8% 15.8%
Percen
t%Differen
ce,%%%%%%%%%%%%%%%%%%%%%%%%%%%%
(EAS
T%!%[NEQ
AIR%or%HAR
A])/EA
ST%
Shock%Velocity,%km/s%
NEQAIR%Percent%Difference%of%+/!%95%%CI%of%EAST%and%NEQAIR%HARA%Percent%Difference%of%+/!%95%%CI%of%EAST%and%HARA%Perfect%Agreement%Line%
Figure 11. Overall percent disagreement of NEQAIR and HARA’s prediction with respect to EAST from 170 - 1388 nmincluding 95% confidence intervals.
equilibrium results obtained from the EAST data. The results have shown very good agreement betweenNeqair and Hara for the UV through IR spectral regions. Hara predicts a larger radiance in the UV/Visspectral region due to the inclusion of the radiative attachment mechanisms, which offers some improvedagreement to EAST at lower velocities (9 - 12 km/s) but an apparent over-prediction at higher velocities(12 - 15.5 km/s). Discrepancies in the VUV for Neqair and Hara have been observed with some evidencesuggesting this could be linked to uncertainties in the equilibrium temperature of the shocked EAST testgas. The spectral comparisons of Neqair, Hara and EAST in the Vis/NIR spectral region show excellentagreement in terms of both the line intensities and the appearance of the level of the background continuum.The overall percentage disagreement of the models with respect to EAST for 0.2 Torr at 10 km/s is within20% and from 11 to 15.5 km/s is on average within 2.5%. The overall 95% confidence interval in the mean ofthe EAST result is on average [5.8%, -7.2%] and the overall standard deviation in the scatter of EAST is ±17%. An updated bound for the parametric uncertainty for high speed Earth entry has been determined tobe [9.0%, -6.3%]. This is a significant reduction in the radiative heating uncertainty for high speed entry asit was previously calculated to be [32%, -21%]9 at 15 km/s prior to the EAST tests presented in this paper.The high speed EAST measurements also provide a unique data set for the validation of radiative coolingmechanisms implemented in a coupled CFD/radiation solver (such as Laura and Hara) and analyzingprecursor radiation. The analysis showed that a significant amount of radiative cooling is observed, but theamount is under-predicted when compared to experiment.
Overall, even though good agreement has been observed between Neqair, Hara and EAST, somediscrepancies have been identified. The most significant of these being: 1) the under-prediction of the IRspectral range, 2) the discrepancies observed in the VUV and 3) the trend to a worsening level of agreementof the codes compared to experiment at slower shock speeds. Therefore, the focus of future testing should beto re-examine EAST experiments at slower shock speeds (possibly employing a mixture of argon and heliumin the driver gas to improve the equilibrium characteristics of the flow), conduct high speed experiments inthe deep VUV while also taking measurements that would allow the calculation of electron number density.
References
1Johnston, C., “A Comparison of the East Shock-Tube Data with a New Air Radiation Model,” Reno, Nevada, January2008, AIAA 2008-1245.
18 of 24
American Institute of Aeronautics and Astronautics
2Bose, D., McCorkle, E., Thompson, C., Bogdanoff, D., Prabhu, D., Allen, G., and Grinstead, J., “Analysis and ModelValidation of Shock Layer Radiation in Air,” AIAA, Reno, Nevada, January 2008, AIAA 2008-1246.
3Panesi, M., Magin, T., Bourdon, A., Bultel, A., and Chazot, O., “Analysis of the Fire II Flight Experiment by means ofa Collisional Radiative Model,” Journal of Thermophysics and Heat Transfer , Vol. 23, No. 2, 2009, pp. 236–248.
4Panesi, M., Magin, T., Bourdon, A., Bultel, A., and Chazot, O., “Study of electronically excited state populations of atomsand molecules predicted by means of a collisional-radiative model for the Fire II flight experiment,” Journal of Thermophysicsand Heat Transfer , Vol. 25, 2011, pp. 361–374.
5Cruden, B., Martinez, R., Grinstead, J., and Olejniczak, J., “Simultaneous Vacuum-Ultraviolet Through Near-IR Ab-solute Radiation Measurement with Spatiotemporal Resolution in An Electric Arc Shock Tube,” 41st AIAA ThermophysicsConference, San Antonio, Texas, 2009, AIAA-2009-4240.
6Whiting, E., Park, C., Yen, L., Arnold, J., and Paterson, J., “NEQAIR96, Nonequilibrium and Equilibrium RadiativeTransport and Spectra Program: User’s Manual,” Technical Report NASA RP-1389, Ames Research Center, Moffett Field,Moffett Field, 1996.
7Johnston, C., Hollis, B., and Sutton, K., “Spectrum Modeling for Air Shock-Layer Radiation at Lunar-Return Condi-tions,” Journal of Spacecraft and Rockets, Vol. 45, No. 5, 2008, pp. 865–878.
8Johnston, C. O., Hollis, B., and Sutton, K., “Non-Boltzmann Modeling for Air Shock Layers at Lunar Return Conditions,”Journal of Spacecraft and Rockets, Sep.-Oct. 2008.
9Johnston, C., Mazaheri, A., Gnoffo, P., Kleb, B., Sutton, K., Prabhu, D., Brandis, A., and Bose, D., “Assessment ofRadiative Heating Uncertainty for Hyperbolic Earth Entry,” 42nd AIAA Thermophysics Conference, Honolulu, 2011.
10Grinstead, J. H., Olejniczak, J., Wilder, M. C., Bogdanoff, D. W., Allen, G. A., and Lilliar, R., “Shock-heated AirRadiation Measurements at Lunar Return Conditions,” 46th AIAA Aerospace Sciences Meeting and Exhibit , 7-10 January2008, Reno, Nevada 2008, AIAA-2008-1244.
11Bogdanoff, D. W., “Shock tube experiments for Earth and Mars entry conditions,” Non-equilibrium gas dynamics, fromphysical models to hypersonic flights, Vol. Von Karman Institute Lecture Series, 2008.
12Cruden, B., “Electron Density Measurement in Re-entry Shocks for Lunar Return,” Journal of Thermophysics and HeatTransfer , Vol. 26, 2012, pp. 222.
13Brandis, A., Johnston, C., Cruden, B., Prabhu, D., and Bose, D., “Uncertainty Analysis and Validation of RadiationMeasurements for Earth Re-Entry,” Journal of Thermophysics and Heat Transfer , Vol. 29, No. 2, 2015, pp. 209–221.
14Kramida, A., Ralchenko, Y., Reader, J., and Team, N. A., “NIST Atomic Spectra Database, Version 5.0.0,”physics.nist.gov/asd/, July 2012, last accessed July, 2012.
15Cunto, W., Mendoza, C., Ochsenbein, F., and Zeippen, C., “TOPbase at the CDS,” Astronomy and Astrophysics,Vol. 275, Aug. 1993, pp. L5–L8, see also http://cdsweb.u-strasbg.fr/topbase/topbase.html.
16Peach, G., “Continuous Absorption Coefficients for Non-hydrogenic Atoms,” Memoirs of the Royal Astronomical Society,Vol. 73, 1970, pp. 1–123.
17Tashkun, S. and Perevalov, V., “CDSD-4000: High-Resolution, High-Temperature Carbon Dioxide Spectroscopic Data-bank,” Journal of Quantitative Spectroscopy and Radiative Transfer , Vol. 112, No. 9, 2011, pp. 1403–1410.
18Cruden, B. and Brandis, A., “Updates to the NEQAIR Radiation Solver,” St. Andrews, Scotland, November 2014.19Ralchenko, Y., “NIST Atomic Spectra Database, Version 3.1.0,” physics.nist.gov/PhysRefData/ASD/, July 2006, last
accessed September 3rd, 2007.20The Opacity Project Team, The Opacity Project , Vol. 1, Bristol and Philadelphia: Institute of Physics Publishing, 1995.21Johnston, C. O., Hollis, B. R., and Sutton, K., “Radiative Heating Methodology for the Huygens Probe,” Journal of
Spacecraft and Rockets, Vol. 44, No. 5, 2007, pp. 993–1002.22McBride, B. and Gordon, S., “Computer Program for Calculation of Complex Chemical Equilibrium Compositions and
Applications I. Analysis,” NASA RP-1311, NASA Glenn, October 1994.23Program Development Company, Tech. rep., 300 Hamilton Avenue,Suite 409, White Plains, NY 10601.24Wright, M., White, T., and Mangini, N., “Data-Parallel Line Relaxation (DPLR) Code User Manual Acadia-Version
4.01.1,” NASA/TM-2009-215388, NASA Ames Research Center, October 2009.25Park, C., “Review of chemical-kinetic problems for future NASA missions, I. Earth entries,” Journal of Thermophysics
and Heat Transfer , Vol. 7, 1993, pp. 385–398.26Bose, D., McCorkle, E., Bogdanoff, D. W., and Allen Jr., G., “Comparisons of air radiation model with shock tube
measurements.” 47th AIAA Aerospace Sciences Meeting, Orlando, Florida, 2009, AIAA-2009-1030.27Goutelle, S., Maurin, M., Rougier, F., Barbaut, X. Bourguignon, L., Ducher, M., and Maire, P., “The Hill equation: a
review of its capabilities in pharmacological modelling,” Societe Francaise de Pharmacologie et de Therapeatique Fundamentaland Clinical Pharmocology, Vol. 22, 2008, pp. 633–648.
28Clark, A., “The mode of action of drugs on cells,” Edward Arnold and Co, London, 1933.29McLean, F., “Application of the law of chemical equilibrium (law of mass action) to biological problems,” Physiology
Review , Vol. 18, 1933, pp. 495–523.30Michaelis, L. and Menten, M., “Die kinetic der Invertinwirkung.” Biochem. Z , Vol. 49, 1913, pp. 333–369.31Clark, A., “The reaction between acetyl choline and muscle cells,” The Journal of Physiology, Vol. 61, 1926, pp. 530–546.32Langmuir, I., “The constitution and fundamental properties of solids and liquids. Part 1 Solids.” Journal of the American
Chemical Society, Vol. 38, 1916, pp. 2221–2295.33Light, G., “Test Gas Properties Behind a Decelerating Shock Wave in a Shock Tube,” The Physics of Fluids, Vol. 16,
No. 5, 1973, pp. 624–628.34Brandis, A., Cruden, B., Prabhu, D., Bose, D., McGilvray, M., and Morgan, R., “Analysis of Air Radiation Measurements
Obtained in the EAST and X2 Shocktube Facilities,” 10th AIAA/ASME Joint Thermophysics and Heat Transfer Conference,Chicago, Illinois, 2010, AIAA 2010-4510.
19 of 24
American Institute of Aeronautics and Astronautics
35Asinovsky, E., Kirillin, A., and Kobzev, G., “Investigation of Continuum Radiation of Nitrogen Plasma,” Journal ofQuantitative Spectroscopy and Radiative Transfer , Vol. 10, No. 3, 1970, pp. 143–164.
36Brandis, A., Johnston, C., Cruden, B., Prabhu, D., and Bose, D., “Validation of High Speed Earth Atmospheric EntryRadiative Heating from 9.5 to 15.5 km/s,” 43rd AIAA Thermophysics Conference, New Orleans, Louisiana, 2012, AIAA-2012-2865.
20 of 24
American Institute of Aeronautics and Astronautics
Appendix A
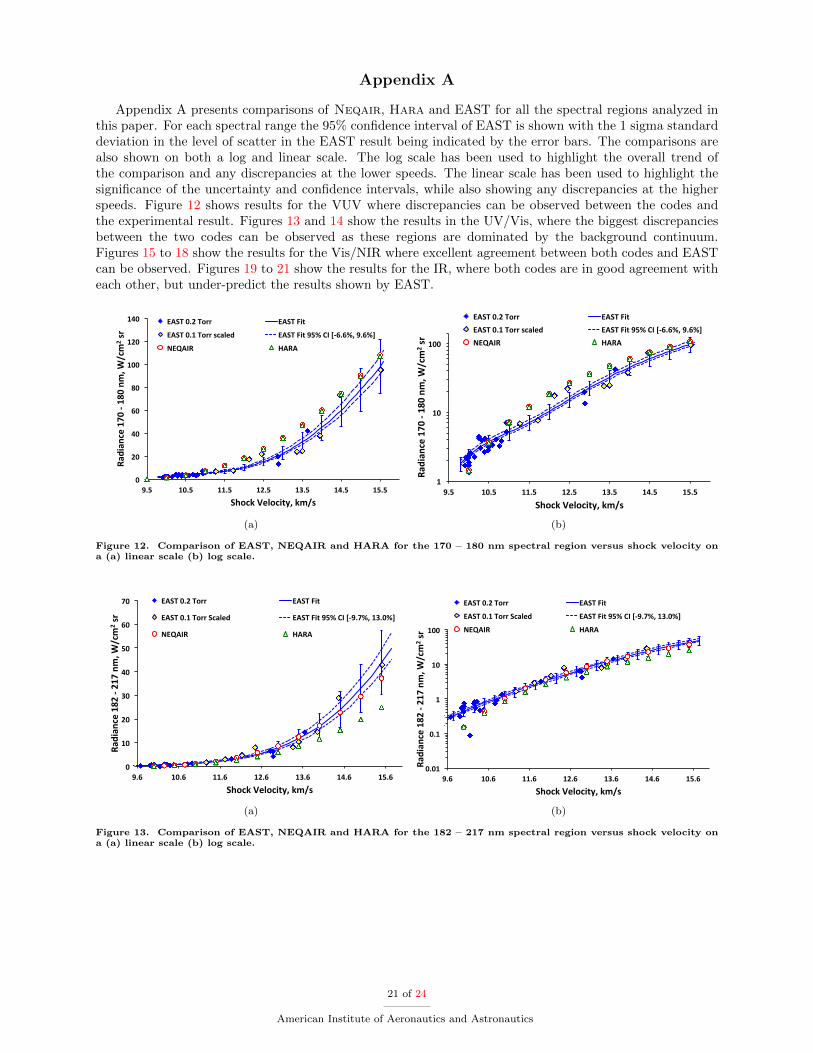
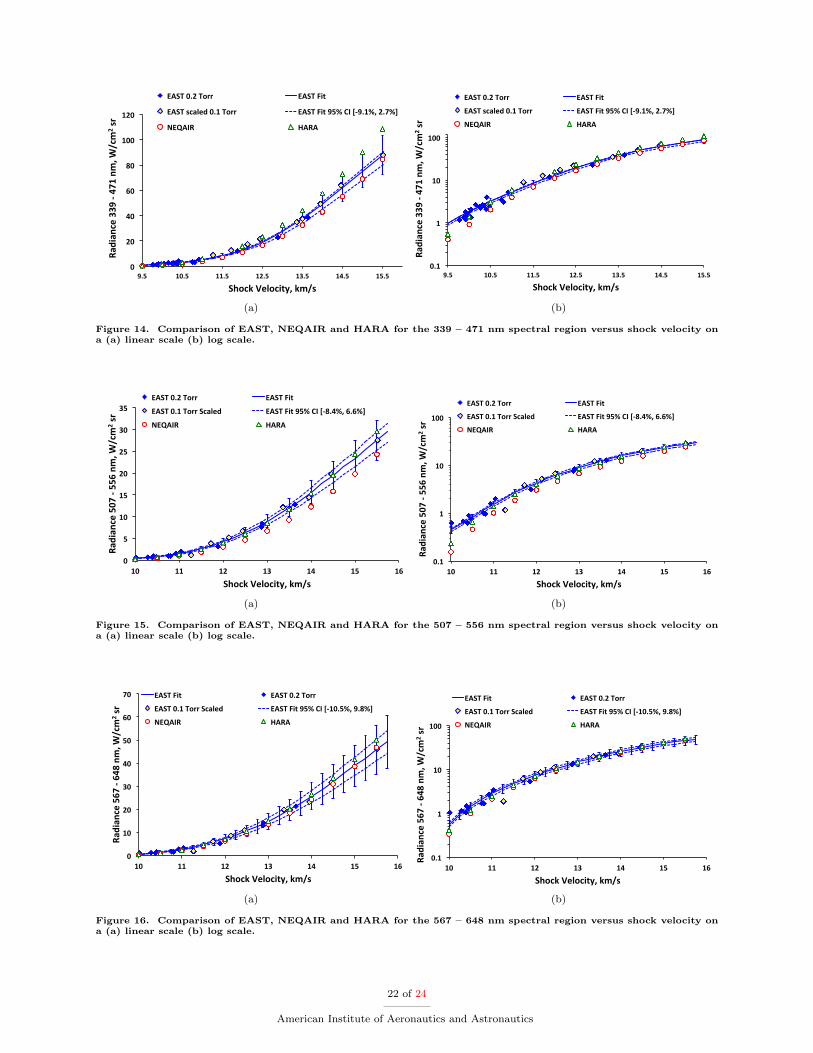
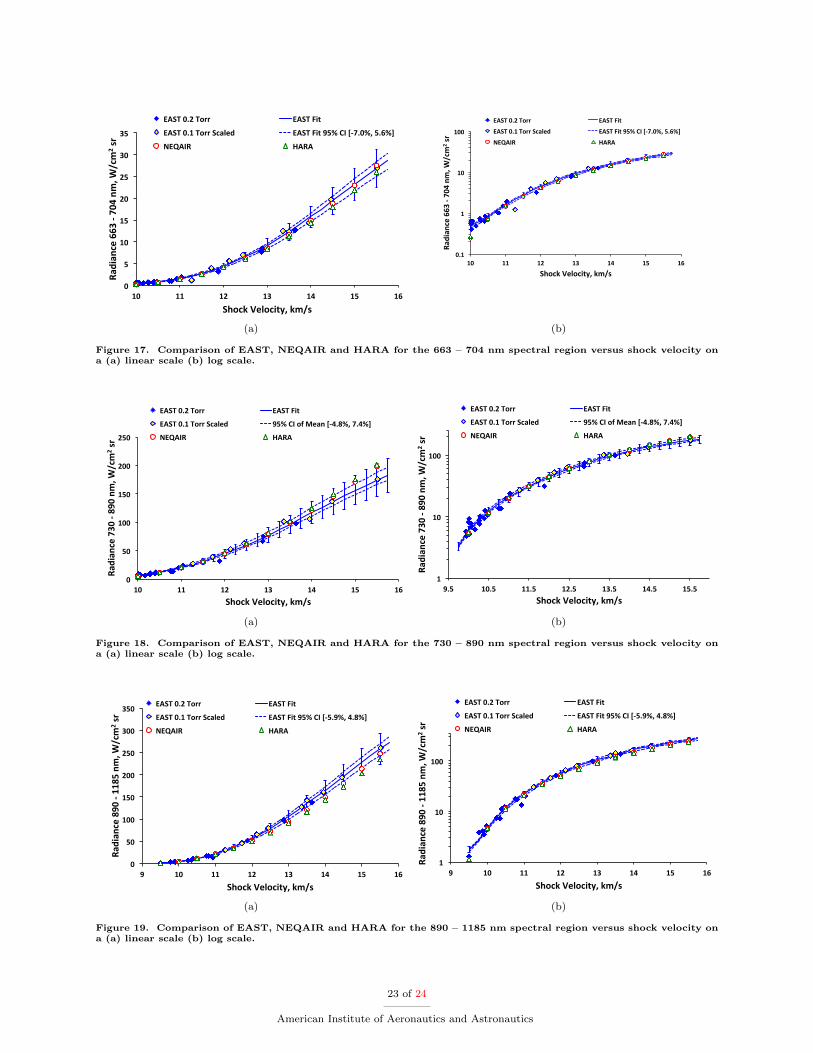
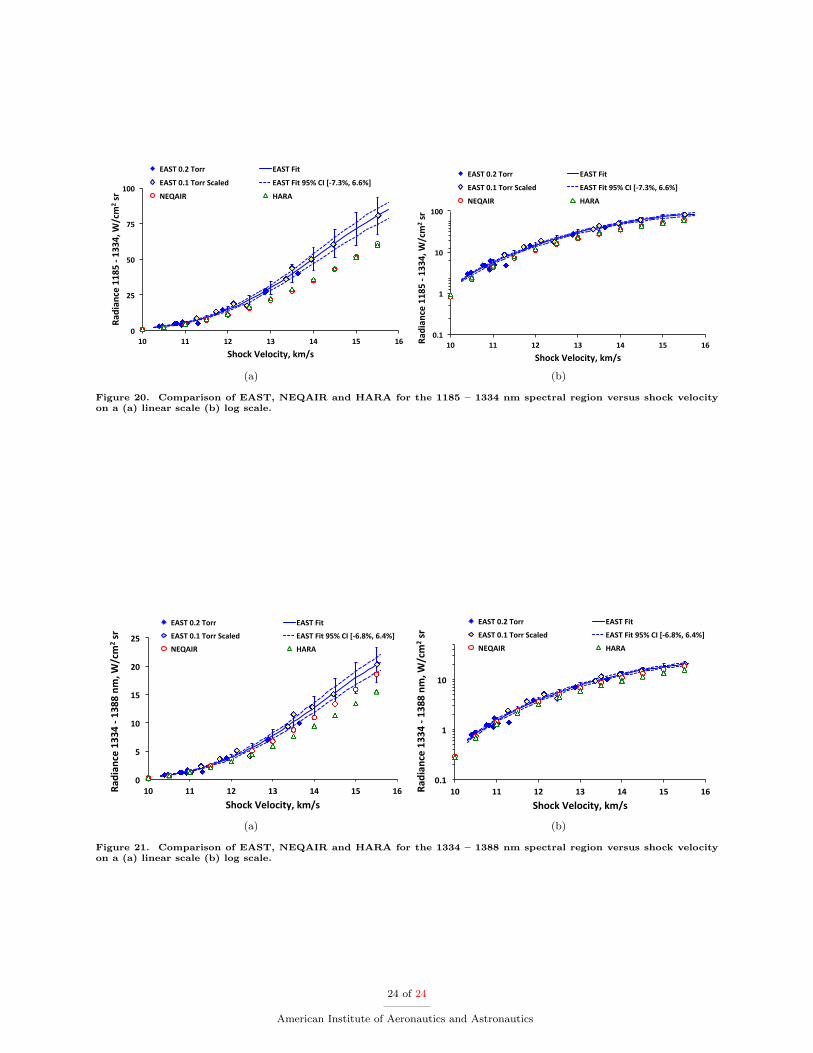
Appendix A presents comparisons of Neqair, Hara and EAST for all the spectral regions analyzed inthis paper. For each spectral range the 95% confidence interval of EAST is shown with the 1 sigma standarddeviation in the level of scatter in the EAST result being indicated by the error bars. The comparisons arealso shown on both a log and linear scale. The log scale has been used to highlight the overall trend ofthe comparison and any discrepancies at the lower speeds. The linear scale has been used to highlight thesignificance of the uncertainty and confidence intervals, while also showing any discrepancies at the higherspeeds. Figure 12 shows results for the VUV where discrepancies can be observed between the codes andthe experimental result. Figures 13 and 14 show the results in the UV/Vis, where the biggest discrepanciesbetween the two codes can be observed as these regions are dominated by the background continuum.Figures 15 to 18 show the results for the Vis/NIR where excellent agreement between both codes and EASTcan be observed. Figures 19 to 21 show the results for the IR, where both codes are in good agreement witheach other, but under-predict the results shown by EAST.
0"
20"
40"
60"
80"
100"
120"
140"
9.5" 10.5" 11.5" 12.5" 13.5" 14.5" 15.5"
Radian
ce"170"4"180"nm
,"W/cm
2 "sr"
Shock"Velocity,"km/s"
EAST"0.2"Torr" EAST"Fit"
EAST"0.1"Torr"scaled" EAST"Fit"95%"CI"[46.6%,"9.6%]"
NEQAIR" HARA"
(a)
1"
10"
100"
9.5" 10.5" 11.5" 12.5" 13.5" 14.5" 15.5"
Radian
ce"170"2"180"nm
,"W/cm
2 "sr"
Shock"Velocity,"km/s"
EAST"0.2"Torr" EAST"Fit"EAST"0.1"Torr"scaled" EAST"Fit"95%"CI"[26.6%,"9.6%]"NEQAIR" HARA"
(b)
Figure 12. Comparison of EAST, NEQAIR and HARA for the 170 – 180 nm spectral region versus shock velocity ona (a) linear scale (b) log scale.
0"
10"
20"
30"
40"
50"
60"
70"
9.6" 10.6" 11.6" 12.6" 13.6" 14.6" 15.6"
Radian
ce"182"4"217"nm
,"W/cm
2 "sr"
Shock"Velocity,"km/s"
EAST"0.2"Torr" EAST"Fit"
EAST"0.1"Torr"Scaled" EAST"Fit"95%"CI"[49.7%,"13.0%]"
NEQAIR" HARA"
(a)
0.01$
0.1$
1$
10$
100$
9.6$ 10.6$ 11.6$ 12.6$ 13.6$ 14.6$ 15.6$
Radian
ce$182$3$217$nm
,$W/cm
2 $sr$
Shock$Velocity,$km/s$
EAST$0.2$Torr$ EAST$Fit$
EAST$0.1$Torr$Scaled$ EAST$Fit$95%$CI$[39.7%,$13.0%]$
NEQAIR$ HARA$
(b)
Figure 13. Comparison of EAST, NEQAIR and HARA for the 182 – 217 nm spectral region versus shock velocity ona (a) linear scale (b) log scale.
21 of 24
American Institute of Aeronautics and Astronautics
0"
20"
40"
60"
80"
100"
120"
9.5" 10.5" 11.5" 12.5" 13.5" 14.5" 15.5"
Radian
ce"339"3"471"nm
,"W/cm
2 "sr"
Shock"Velocity,"km/s"
EAST"0.2"Torr" EAST"Fit"
EAST"scaled"0.1"Torr" EAST"Fit"95%"CI"[39.1%,"2.7%]"
NEQAIR" HARA"
(a)
0.1$
1$
10$
100$
9.5$ 10.5$ 11.5$ 12.5$ 13.5$ 14.5$ 15.5$
Radian
ce$339$1$471$nm
,$W/cm
2 $sr$
Shock$Velocity,$km/s$
EAST$0.2$Torr$ EAST$Fit$
EAST$scaled$0.1$Torr$ EAST$Fit$95%$CI$[19.1%,$2.7%]$
NEQAIR$ HARA$
(b)
Figure 14. Comparison of EAST, NEQAIR and HARA for the 339 – 471 nm spectral region versus shock velocity ona (a) linear scale (b) log scale.
0"
5"
10"
15"
20"
25"
30"
35"
10" 11" 12" 13" 14" 15" 16"
Radian
ce"507"1"556"nm
,"W/cm
2 "sr"
Shock"Velocity,"km/s"
EAST"0.2"Torr" EAST"Fit"
EAST"0.1"Torr"Scaled" EAST"Fit"95%"CI"[18.4%,"6.6%]"
NEQAIR" HARA"
(a)
0.1$
1$
10$
100$
10$ 11$ 12$ 13$ 14$ 15$ 16$
Radian
ce$507$2$556$nm
,$W/cm
2 $sr$
Shock$Velocity,$km/s$
EAST$0.2$Torr$ EAST$Fit$
EAST$0.1$Torr$Scaled$ EAST$Fit$95%$CI$[28.4%,$6.6%]$
NEQAIR$ HARA$
(b)
Figure 15. Comparison of EAST, NEQAIR and HARA for the 507 – 556 nm spectral region versus shock velocity ona (a) linear scale (b) log scale.
0"
10"
20"
30"
40"
50"
60"
70"
10" 11" 12" 13" 14" 15" 16"
Radian
ce"567"1"648"nm
,"W/cm
2 "sr"
Shock"Velocity,"km/s"
EAST"Fit" EAST"0.2"Torr"
EAST"0.1"Torr"Scaled" EAST"Fit"95%"CI"[110.5%,"9.8%]"
NEQAIR" HARA"
(a)
0.1$
1$
10$
100$
10$ 11$ 12$ 13$ 14$ 15$ 16$
Radian
ce$567$2$648$nm
,$W/cm
2 $sr$
Shock$Velocity,$km/s$
EAST$Fit$ EAST$0.2$Torr$
EAST$0.1$Torr$Scaled$ EAST$Fit$95%$CI$[210.5%,$9.8%]$
NEQAIR$ HARA$
(b)
Figure 16. Comparison of EAST, NEQAIR and HARA for the 567 – 648 nm spectral region versus shock velocity ona (a) linear scale (b) log scale.
22 of 24
American Institute of Aeronautics and Astronautics
0"
5"
10"
15"
20"
25"
30"
35"
10" 11" 12" 13" 14" 15" 16"
Radian
ce"663"0"704"nm
,"W/cm
2 "sr"
Shock"Velocity,"km/s"
EAST"0.2"Torr" EAST"Fit"
EAST"0.1"Torr"Scaled" EAST"Fit"95%"CI"[07.0%,"5.6%]"
NEQAIR" HARA"
(a)
0.1
1
10
100
10 11 12 13 14 15 16
Radian
ce 663 -‐ 704 nm
, W/cm
2 sr
Shock Velocity, km/s
EAST 0.2 Torr EAST Fit
EAST 0.1 Torr Scaled EAST Fit 95% CI [-‐7.0%, 5.6%]
NEQAIR HARA
(b)
Figure 17. Comparison of EAST, NEQAIR and HARA for the 663 – 704 nm spectral region versus shock velocity ona (a) linear scale (b) log scale.
0"
50"
100"
150"
200"
250"
10" 11" 12" 13" 14" 15" 16"
Radian
ce"730"1"890"nm
,"W/cm
2 "sr"
Shock"Velocity,"km/s"
EAST"0.2"Torr" EAST"Fit"
EAST"0.1"Torr"Scaled" 95%"CI"of"Mean"[14.8%,"7.4%]"
NEQAIR" HARA"
(a)
1"
10"
100"
9.5" 10.5" 11.5" 12.5" 13.5" 14.5" 15.5"
Radian
ce"730"2"890"nm
,"W/cm
2 "sr"
Shock"Velocity,"km/s"
EAST"0.2"Torr" EAST"Fit"
EAST"0.1"Torr"Scaled" 95%"CI"of"Mean"[24.8%,"7.4%]"
NEQAIR" HARA"
(b)
Figure 18. Comparison of EAST, NEQAIR and HARA for the 730 – 890 nm spectral region versus shock velocity ona (a) linear scale (b) log scale.
0"
50"
100"
150"
200"
250"
300"
350"
9" 10" 11" 12" 13" 14" 15" 16"
Radian
ce"890"2"1185"nm,"W
/cm
2 "sr"
Shock"Velocity,"km/s"
EAST"0.2"Torr" EAST"Fit"
EAST"0.1"Torr"Scaled" EAST"Fit"95%"CI"[25.9%,"4.8%]"
NEQAIR" HARA"
(a)
1"
10"
100"
9" 10" 11" 12" 13" 14" 15" 16"
Radian
ce"890"2"1185"nm,"W
/cm
2 "sr"
Shock"Velocity,"km/s"
EAST"0.2"Torr" EAST"Fit"
EAST"0.1"Torr"Scaled" EAST"Fit"95%"CI"[25.9%,"4.8%]"
NEQAIR" HARA"
(b)
Figure 19. Comparison of EAST, NEQAIR and HARA for the 890 – 1185 nm spectral region versus shock velocity ona (a) linear scale (b) log scale.
23 of 24
American Institute of Aeronautics and Astronautics
0"
25"
50"
75"
100"
10" 11" 12" 13" 14" 15" 16"
Radian
ce"1185"2"1
334,"W
/cm
2 "sr"
Shock"Velocity,"km/s"
EAST"0.2"Torr" EAST"Fit"
EAST"0.1"Torr"Scaled" EAST"Fit"95%"CI"[27.3%,"6.6%]"
NEQAIR" HARA"
(a)
0.1$
1$
10$
100$
10$ 11$ 12$ 13$ 14$ 15$ 16$Radian
ce$1185$2$1
334,$W
/cm
2 $sr$
Shock$Velocity,$km/s$
EAST$0.2$Torr$ EAST$Fit$
EAST$0.1$Torr$Scaled$ EAST$Fit$95%$CI$[27.3%,$6.6%]$
NEQAIR$ HARA$
(b)
Figure 20. Comparison of EAST, NEQAIR and HARA for the 1185 – 1334 nm spectral region versus shock velocityon a (a) linear scale (b) log scale.
0"
5"
10"
15"
20"
25"
10" 11" 12" 13" 14" 15" 16"Radian
ce"1334"0"1
388"nm
,"W/cm
2 "sr"
Shock"Velocity,"km/s"
EAST"0.2"Torr" EAST"Fit"
EAST"0.1"Torr"Scaled" EAST"Fit"95%"CI"[06.8%,"6.4%]"
NEQAIR" HARA"
(a)
0.1$
1$
10$
10$ 11$ 12$ 13$ 14$ 15$ 16$Radian
ce$1334$1$1
388$nm
,$W/cm
2 $sr$
Shock$Velocity,$km/s$
EAST$0.2$Torr$ EAST$Fit$
EAST$0.1$Torr$Scaled$ EAST$Fit$95%$CI$[16.8%,$6.4%]$
NEQAIR$ HARA$
(b)
Figure 21. Comparison of EAST, NEQAIR and HARA for the 1334 – 1388 nm spectral region versus shock velocityon a (a) linear scale (b) log scale.
24 of 24
American Institute of Aeronautics and Astronautics