openfoam simulations of atmospheric-entry … institute of aeronautics and astronautics 1 openfoam...
TRANSCRIPT

American Institute of Aeronautics and Astronautics
1
OpenFOAM Simulations of Atmospheric-Entry Capsules in the Subsonic Regime
Ben E. Nikaido1 Science and Technology Corporation, Moffett Field, CA, 94035
Scott M. Murman2 and Joseph A. Garcia3 NASA Ames Research Center, Moffett Field, CA, 94035
The open-source Computational Fluid Dynamics software OpenFOAM is gaining wider acceptance in industry and academia for incompressible flow simulations. To date, there has been relatively little utilization of OpenFOAM for compressible external aerodynamic applications. The numerous turbulence models available in OpenFOAM makes it an attractive option for evaluating alternate Reynolds-Averaged Navier-Stokes (RANS) turbulent models to assess separated flow on atmospheric entry vehicles in the subsonic regime, where traditional turbulent models show reduced accuracy. This paper presents simulations of an axisymmetric capsule geometry at subsonic conditions using an OpenFOAM compressible flow solver. The results are compared with results from the NASA CFD code OVERFLOW and experimental data. These OpenFOAM simulations serve as a basis to explore OpenFOAM’s extended turbulence models on compressible separated flows such as found on capsules.
α = angle of attack Cp = pressure coefficient D = space capsule diameter M∞ = freestream Mach number ReD = Reynolds number based on space capsule diameter x, y, z = Cartesian coordinates Uτ = friction velocity, u+ = dimensionless velocity, u/Uτ y+ = nondimensional wall distance, (yUτ/ν) ν = kinematic viscosity ρ = density τw = wall shear stress
I. Introduction HE customizability of open-source software, along with the absence of licensing restrictions, is increasing its presence in the engineering and research environments. Open-source Field Operation And Manipulation
(OpenFOAM) is an open-source software package for simulating various continuum mechanics problems. Although its primary application has been CFD, OpenFOAM incorporates specialized solvers for electrodynamics, solid dynamics, and even commodity pricing.1 This versatility is attributed to the steadily expanding presence of OpenFOAM in academia and industry. However, much of the industrial use of the software has focused on incompressible subsonic and low Reynolds number flows such as automobile aerodynamics, two-phase flow around naval vessels, and heat transfer.2,3 In the realm of high-speed compressible flow, most engineering studies using
1 Research Aerospace Engineer, STC, NASA Ames Research Center, Mail Stop 258-1. 2 Aerospace Engineer, NASA Fundamental Modeling and Simulation Branch, Mail Stop 258-5. 3 Aerospace Engineer, NASA Systems Analysis Office, Mail Stop 258-1, Senior Member AIAA.
T
Dow
nloa
ded
by N
ASA
AM
ES
RE
SEA
RC
H C
EN
TE
R o
n Ja
nuar
y 12
, 201
5 | h
ttp://
arc.
aiaa
.org
| D
OI:
10.
2514
/6.2
015-
0313
53rd AIAA Aerospace Sciences Meeting
5-9 January 2015, Kissimmee, Florida
AIAA 2015-0313
Copyright © 2015 by the American Institute of Aeronautics and Astronautics, Inc. The U.S. Government has a royalty-free license to exercise all rights under the copyright claimed herein for Governmental purposes. All other rights are reserved by the copyright owner.
AIAA SciTech

American Institute of Aeronautics and Astronautics
2
OpenFOAM have been focused on benchmark validation cases and two-dimensional simulations.4,5 Here we extend these benchmark studies to three-dimensional external flows and simulate more complex geometries and physics. In this paper, the accuracy, robustness, and efficiency of OpenFOAM for high Reynolds number compressible external flows is investigated. Of particular interest is the subsonic and transonic flow about NASA-relevant flight vehicles such as modern transport aircraft and entry vehicles in the stage prior to parachute deployment. We will focus our efforts on the latter by comparing CFD predictions about a simplified Orion capsule model. This capsule geometry is based on the 120-CA wind tunnel experiment which was specifically designed to provide data to help improve flow simulations around these type of vehicles6. The OpenFOAM solutions are compared with these experimental results as well as solutions from the NASA CFD code OVERFLOW7. A roughness height calibration is performed prior to these comparisons to more accurately model the rough texture of the experimental heat shield. Current Reynolds-Averaged Navier Stokes (RANS) turbulence models in established CFD codes, do not accurately predict the aerodynamic loads in the subsonic and transonic regimes for these type of bluff capsule geometries with massively separated wakes.8-10 Detached eddy simulations (DES) have yielded some accuracy improvement in this flight regime, but they are currently too computationally expensive to be utilized in aerospace vehicle design and analysis.9 In addition to the Spalart-Allmaras (S-A) and Shear Stress Transport (SST) turbulence models common in RANS CFD codes for external aerodynamics, the goal is to get to a point where alternative turbulence models featured in OpenFOAM can be assessed to determine their accuracy on the wake downstream of the these type of bluff body geometries.
OpenFOAM includes several additional features that make it attractive for use in research and analysis at NASA. Being a finite-volume unstructured CFD code, OpenFOAM could potentially simulate complex geometries that are typically more difficult for structured mesh CFD packages. OpenFOAM is also fully parallel, allowing simulations of very large problems with many millions of cells on high performance computing (HPC) architectures.3 Furthermore, the increasingly large user base and contributors frequently release updated versions of OpenFOAM with leading-edge technology and functionality, including additional turbulence model options. Lastly, OpenFOAM is written entirely in object-oriented and modular C++ in a unique syntax that provides relatively simple code modifications and significant extensibility. This could enable OpenFOAM to be used to test novel CFD technologies, including turbulence models, in advance of integrating them into other CFD codes such as OVERFLOW. The following simulations are conducted with OpenFOAM release 2.2.2 with its standard pressure-based solvers. At the time of this writing, a density-based coupled compressible flow solver is being developed as an external package to OpenFOAM.11
II. Verification with NASA Codes A compressible OpenFOAM flow solver is run at subsonic speeds on a two-dimensional flat plate and a three-
dimensional smooth capsule. The OpenFOAM solver rhoLTSPimpleFoam in version 2.2.2 is used to solve the compressible RANS equations via a coupled Pressure Implicit with Splitting Operator (PISO) and Semi-Implicit Method for Pressure-Linked Equation (SIMPLE) solution algorithm. This pseudo-transient solver is relatively robust and provides accelerated convergence to steady-state solutions via local time-stepping for compressible flows.12 To maintain consistency with the S-A turbulence model used in OVERFLOW and other NASA codes, slight modifications to OpenFOAM’s original S-A model were made and implemented into OpenFOAM’s existing turbulence model library.5,13 This variation of S-A is termed “standard” by the NASA Turbulence Model Benchmarking Working Group.14 The confidence built in OpenFOAM from this comparison provides a starting baseline for additional OpenFOAM RANS turbulence models to be explored.
A. 2D Flat Plate A two-dimensional zero-pressure-gradient flat-plate verification case from the NASA Turbulence Model Benchmarking Working Group14 is run with OpenFOAM and compared with results from CFL3D, FUN3D, and OVERFLOW15. A grid refinement study is included in these runs. At each refinement level, the same structured grid is utilized by all codes. Figure 1 shows the lower cell count 69x49 grid. The simulations are run at Mach 0.2 and Reynolds number of 5 million, all Figure 1. 2D zero pressure gradient flat plate grid.14
Dow
nloa
ded
by N
ASA
AM
ES
RE
SEA
RC
H C
EN
TE
R o
n Ja
nuar
y 12
, 201
5 | h
ttp://
arc.
aiaa
.org
| D
OI:
10.
2514
/6.2
015-
0313

American Institute of Aeronautics and Astronautics
3
with the S-A turbulence model. All simulations are converged to steady-state solutions. Figure 2 shows drag convergence for five different levels of grid refinement and Figure 3 shows skin friction coefficient convergence at x=0.97008 for the same refinement study. A plot of skin friction coefficient along the flat plate on the finest 545x385 grid is shown in Figure 4. Figure 5 shows the mean velocity profile on the finest grid. FUN3D data is not available for Figure 5. OpenFOAM shows excellent agreement with the NASA codes. The grid convergence plots in Figs. 2 and 3 indicate that OpenFOAM has lower error in skin friction on coarser grids than the NASA codes.
B. 3D Axisymmetric Capsule An outline of the axisymmetric 120-CA capsule geometry is shown in Fig. 6. As an initial test, the strut supports
from the experimental configuration are not modeled. These are included in subsequent sections. A structured single-block grid is generated to represent the capsule geometry for both OpenFOAM and OVERFLOW simulations as shown in Fig. 7. The identical grid is used in both codes to minimize variations between the two solution approaches. OpenFOAM is able to use structured non-overset meshes without any issues. The grid generation software Pointwise16 is used to convert the PLOT3D17 OVERFLOW grid to the native OpenFOAM unstructured grid format. The initial 5 normal grid lines from the capsule wall have uniform grid spacing in compliance with
Figure 2. Drag coefficient grid convergence. N denotes total number of grid cells.
Figure 3. Grid convergence of skin friction coefficient at x=0.97008. N denotes total number of grid cells.
Figure 4. Skin friction coefficient along length of flat plate.
Figure 5. Inner variable plot at x=0.97008 and x=1.90334.
Dow
nloa
ded
by N
ASA
AM
ES
RE
SEA
RC
H C
EN
TE
R o
n Ja
nuar
y 12
, 201
5 | h
ttp://
arc.
aiaa
.org
| D
OI:
10.
2514
/6.2
015-
0313

American Institute of Aeronautics and Astronautics
4
OVERFLOW best practices and maintains a y+ < 1 for both solvers. The dimensions of the grid are 310x180x100 (streamwise x circumferential x normal) points, totaling 5.5 million primarily hexahedral cells.
OVERFLOW is run with an upwind HLLC scheme while OpenFOAM utilizes a hybrid central/upwind spatial discretization scheme.7,12 Both schemes are 2nd-order accurate. This code-to-code comparison approach minimizes the possible sources of discrepancies and limits the comparison to the CFD solvers. In the following subsections we will provide more details of the approach used. OpenFOAM is compared with OVERFLOW at a freestream Mach number of 0.5, Reynolds number of 24 million, and angle of attack of 160°. The OpenFOAM simulation is partitioned over the number of processors desired with the SCOTCH grid decomposition OpenFOAM routine and run on the Pleiades supercomputer at the NASA Ames Research Center. OVERFLOW converged to a steady-state solution using 100 processors in 45 minutes, while OpenFOAM took 4 hours on the same number of processors. Figure 8 shows Mach contours of the OpenFOAM solution overlaid by black contour lines of the OVERFLOW solution. Coefficient of pressure along the capsule surface centerline at y=0 is plotted in Fig. 9.
Figure 6. Outline of axisymmetric 120-CA capsule. Figure 7. X-Z cut of single-block spherical grid. Domain diameter is 88.5 times capsule diameter D.
Figure 8. OpenFOAM Mach contours overlaid by contour lines (black) from OVERFLOW solution. M∞=0.5, α=160°, ReD=24.2 million.
Dow
nloa
ded
by N
ASA
AM
ES
RE
SEA
RC
H C
EN
TE
R o
n Ja
nuar
y 12
, 201
5 | h
ttp://
arc.
aiaa
.org
| D
OI:
10.
2514
/6.2
015-
0313
American Institute of Aeronautics and Astronautics
5
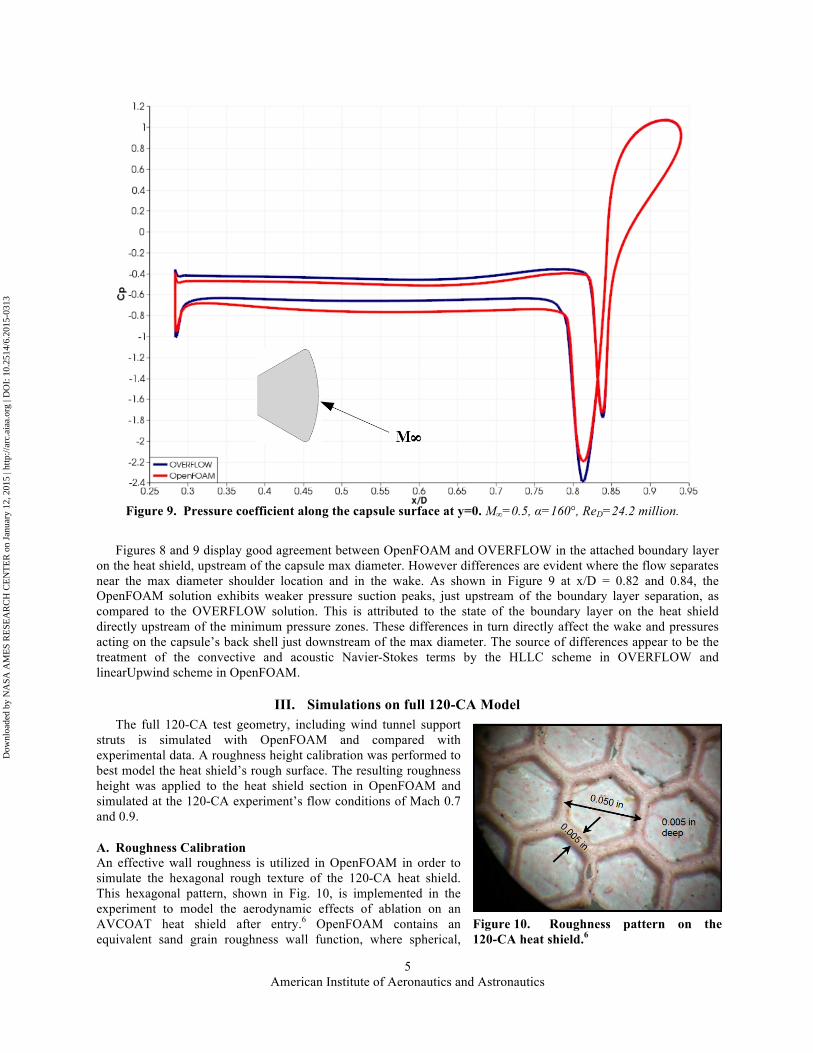
Figures 8 and 9 display good agreement between OpenFOAM and OVERFLOW in the attached boundary layer on the heat shield, upstream of the capsule max diameter. However differences are evident where the flow separates near the max diameter shoulder location and in the wake. As shown in Figure 9 at x/D = 0.82 and 0.84, the OpenFOAM solution exhibits weaker pressure suction peaks, just upstream of the boundary layer separation, as compared to the OVERFLOW solution. This is attributed to the state of the boundary layer on the heat shield directly upstream of the minimum pressure zones. These differences in turn directly affect the wake and pressures acting on the capsule’s back shell just downstream of the max diameter. The source of differences appear to be the treatment of the convective and acoustic Navier-Stokes terms by the HLLC scheme in OVERFLOW and linearUpwind scheme in OpenFOAM.
III. Simulations on full 120-CA Model The full 120-CA test geometry, including wind tunnel support
struts is simulated with OpenFOAM and compared with experimental data. A roughness height calibration was performed to best model the heat shield’s rough surface. The resulting roughness height was applied to the heat shield section in OpenFOAM and simulated at the 120-CA experiment’s flow conditions of Mach 0.7 and 0.9.
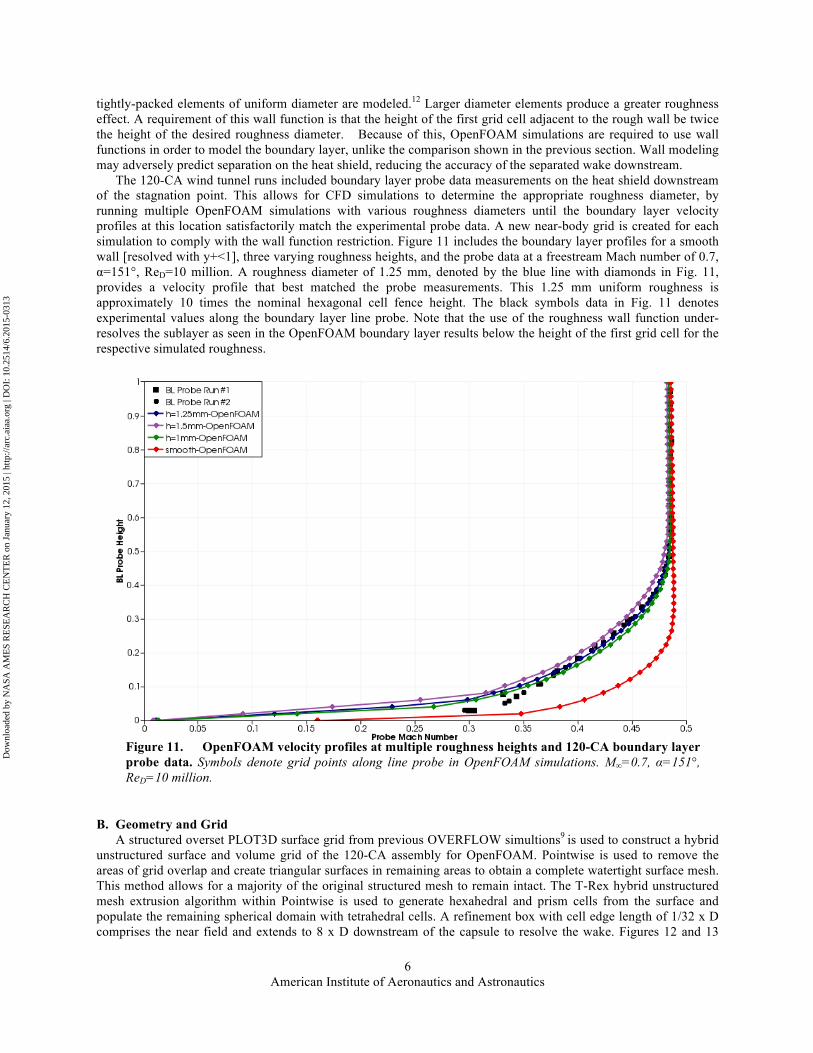
A. Roughness Calibration An effective wall roughness is utilized in OpenFOAM in order to simulate the hexagonal rough texture of the 120-CA heat shield. This hexagonal pattern, shown in Fig. 10, is implemented in the experiment to model the aerodynamic effects of ablation on an AVCOAT heat shield after entry.6 OpenFOAM contains an equivalent sand grain roughness wall function, where spherical,
Figure 9. Pressure coefficient along the capsule surface at y=0. M∞=0.5, α=160°, ReD=24.2 million.
Figure 10. Roughness pattern on the 120-CA heat shield.6
Dow
nloa
ded
by N
ASA
AM
ES
RE
SEA
RC
H C
EN
TE
R o
n Ja
nuar
y 12
, 201
5 | h
ttp://
arc.
aiaa
.org
| D
OI:
10.
2514
/6.2
015-
0313
American Institute of Aeronautics and Astronautics
6
tightly-packed elements of uniform diameter are modeled.12 Larger diameter elements produce a greater roughness effect. A requirement of this wall function is that the height of the first grid cell adjacent to the rough wall be twice the height of the desired roughness diameter. Because of this, OpenFOAM simulations are required to use wall functions in order to model the boundary layer, unlike the comparison shown in the previous section. Wall modeling may adversely predict separation on the heat shield, reducing the accuracy of the separated wake downstream.
The 120-CA wind tunnel runs included boundary layer probe data measurements on the heat shield downstream of the stagnation point. This allows for CFD simulations to determine the appropriate roughness diameter, by running multiple OpenFOAM simulations with various roughness diameters until the boundary layer velocity profiles at this location satisfactorily match the experimental probe data. A new near-body grid is created for each simulation to comply with the wall function restriction. Figure 11 includes the boundary layer profiles for a smooth wall [resolved with y+<1], three varying roughness heights, and the probe data at a freestream Mach number of 0.7, α=151°, ReD=10 million. A roughness diameter of 1.25 mm, denoted by the blue line with diamonds in Fig. 11, provides a velocity profile that best matched the probe measurements. This 1.25 mm uniform roughness is approximately 10 times the nominal hexagonal cell fence height. The black symbols data in Fig. 11 denotes experimental values along the boundary layer line probe. Note that the use of the roughness wall function under-resolves the sublayer as seen in the OpenFOAM boundary layer results below the height of the first grid cell for the respective simulated roughness.
B. Geometry and Grid A structured overset PLOT3D surface grid from previous OVERFLOW simultions9 is used to construct a hybrid
unstructured surface and volume grid of the 120-CA assembly for OpenFOAM. Pointwise is used to remove the areas of grid overlap and create triangular surfaces in remaining areas to obtain a complete watertight surface mesh. This method allows for a majority of the original structured mesh to remain intact. The T-Rex hybrid unstructured mesh extrusion algorithm within Pointwise is used to generate hexahedral and prism cells from the surface and populate the remaining spherical domain with tetrahedral cells. A refinement box with cell edge length of 1/32 x D comprises the near field and extends to 8 x D downstream of the capsule to resolve the wake. Figures 12 and 13
Figure 11. OpenFOAM velocity profiles at multiple roughness heights and 120-CA boundary layer probe data. Symbols denote grid points along line probe in OpenFOAM simulations. M∞=0.7, α=151°, ReD=10 million.
Dow
nloa
ded
by N
ASA
AM
ES
RE
SEA
RC
H C
EN
TE
R o
n Ja
nuar
y 12
, 201
5 | h
ttp://
arc.
aiaa
.org
| D
OI:
10.
2514
/6.2
015-
0313

American Institute of Aeronautics and Astronautics
7
show the 120-CA test apparatus and near-field grid, respectively. The diameter of the capsule in the test and computational model is 16 inches.
C. Solver Approach OpenFOAM’s compressible non-time-accurate flow solver rhoLTSPimpleFoam is used to simulate the 120-CA
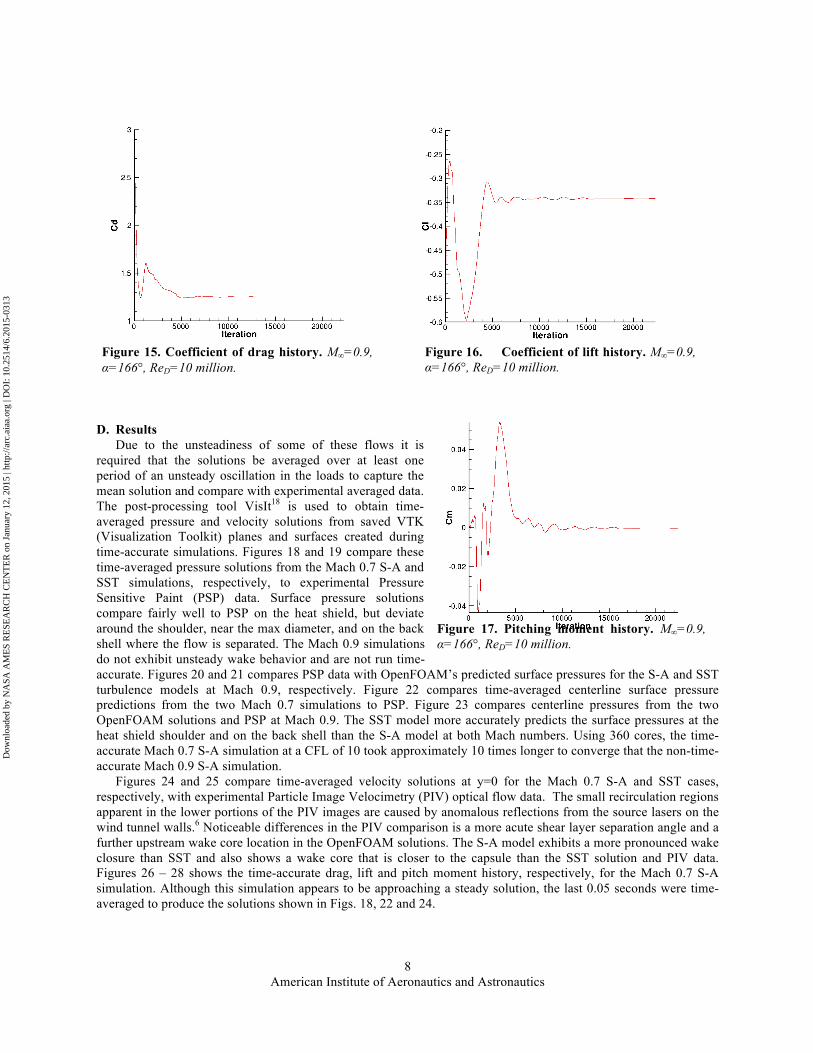
assembly at freestream Mach numbers of 0.7 and 0.9 with both the S-A and SST turbulence models to obtain a steady solution. Figures 14 – 17 show the residual history, drag, lift, and pitch moment, respectively, for the Mach 0.9 S-A simulation. This simulation ran for approximately 20 hours on 360 cores for the aerodynamic loads to converge to a tolerance of +/- 0.01 in drag, +/- 0.004 in lift, and +/- 0.002 in pitching moment. Pitching moment is calculated about the theoretical apex of the capsule’s conical back shell. Initial simulations at Mach 0.9 displayed convergence difficulty with spontaneous unsteadiness identified with rapid disappearance of eddy viscosity in the capsule’s wake. Switching the linear solver from a Preconditioned Bi-Conjugate Gradient (PBiCG) solver to a smoother-type solver mitigated this phenomena and is used for all the solutions presented in this section. OpenFOAM terms this linear solver smoothSolver. Low-level unsteadiness prolonged convergence to a steady-state solution with rhoLTSPimpleFOAM for the Mach 0.9 SST simulation. Restarting this solution with OpenFOAM’s time-independent solver rhoSimplecFoam sufficiently damped the unsteadiness and yielded a very steady solution. In order to resolve the capsule unsteady wake at Mach 0.7, the solutions are partially run out with rhoLTSPimpleFoam and then restarted with the time-accurate solver rhoPimplecFoam. This solver uses a hybrid PISO–SIMPLEC (Semi-Implicit Method for Pressure Linked Equations-Consistent) solution algorithm and is run with 2nd-order time differencing at a CFL (Courant-Friedrichs-Lewy) number of unity based on the smallest cell volume. As the solution progressed, the governing CFL is increased to 10 for in the S-A simulation and 2.5 for the SST simulation. CFL values greater than these cause the simulation to quickly diverge.
Figure 12. Model of 120-CA wind tunnel assembly.6 Capsule is fixed at an angle of attack of 14° relative to freestream.
Figure 13. Near field hybrid unstructured grid used in OpenFOAM simulations.
Figure 14. Residual history. M∞=0.9, α=166°, ReD=10 million.
Dow
nloa
ded
by N
ASA
AM
ES
RE
SEA
RC
H C
EN
TE
R o
n Ja
nuar
y 12
, 201
5 | h
ttp://
arc.
aiaa
.org
| D
OI:
10.
2514
/6.2
015-
0313
American Institute of Aeronautics and Astronautics
8
D. Results Due to the unsteadiness of some of these flows it is
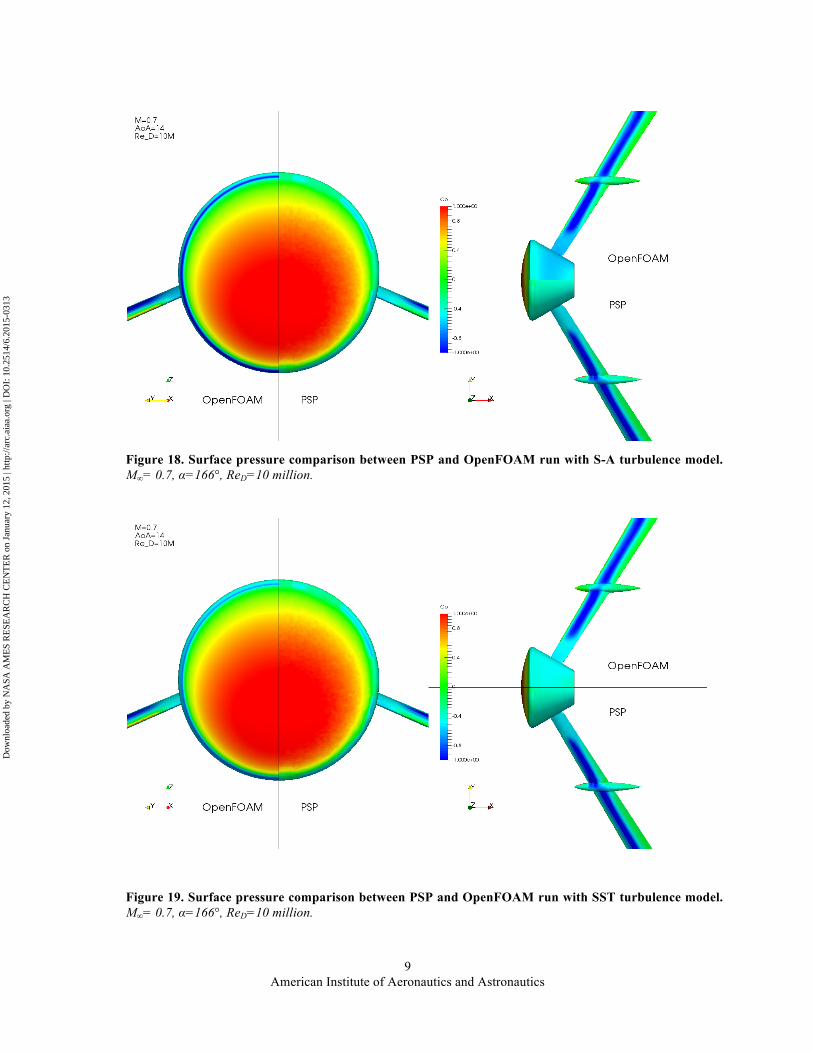
required that the solutions be averaged over at least one period of an unsteady oscillation in the loads to capture the mean solution and compare with experimental averaged data. The post-processing tool VisIt18 is used to obtain time-averaged pressure and velocity solutions from saved VTK (Visualization Toolkit) planes and surfaces created during time-accurate simulations. Figures 18 and 19 compare these time-averaged pressure solutions from the Mach 0.7 S-A and SST simulations, respectively, to experimental Pressure Sensitive Paint (PSP) data. Surface pressure solutions compare fairly well to PSP on the heat shield, but deviate around the shoulder, near the max diameter, and on the back shell where the flow is separated. The Mach 0.9 simulations do not exhibit unsteady wake behavior and are not run time-accurate. Figures 20 and 21 compares PSP data with OpenFOAM’s predicted surface pressures for the S-A and SST turbulence models at Mach 0.9, respectively. Figure 22 compares time-averaged centerline surface pressure predictions from the two Mach 0.7 simulations to PSP. Figure 23 compares centerline pressures from the two OpenFOAM solutions and PSP at Mach 0.9. The SST model more accurately predicts the surface pressures at the heat shield shoulder and on the back shell than the S-A model at both Mach numbers. Using 360 cores, the time-accurate Mach 0.7 S-A simulation at a CFL of 10 took approximately 10 times longer to converge that the non-time-accurate Mach 0.9 S-A simulation.
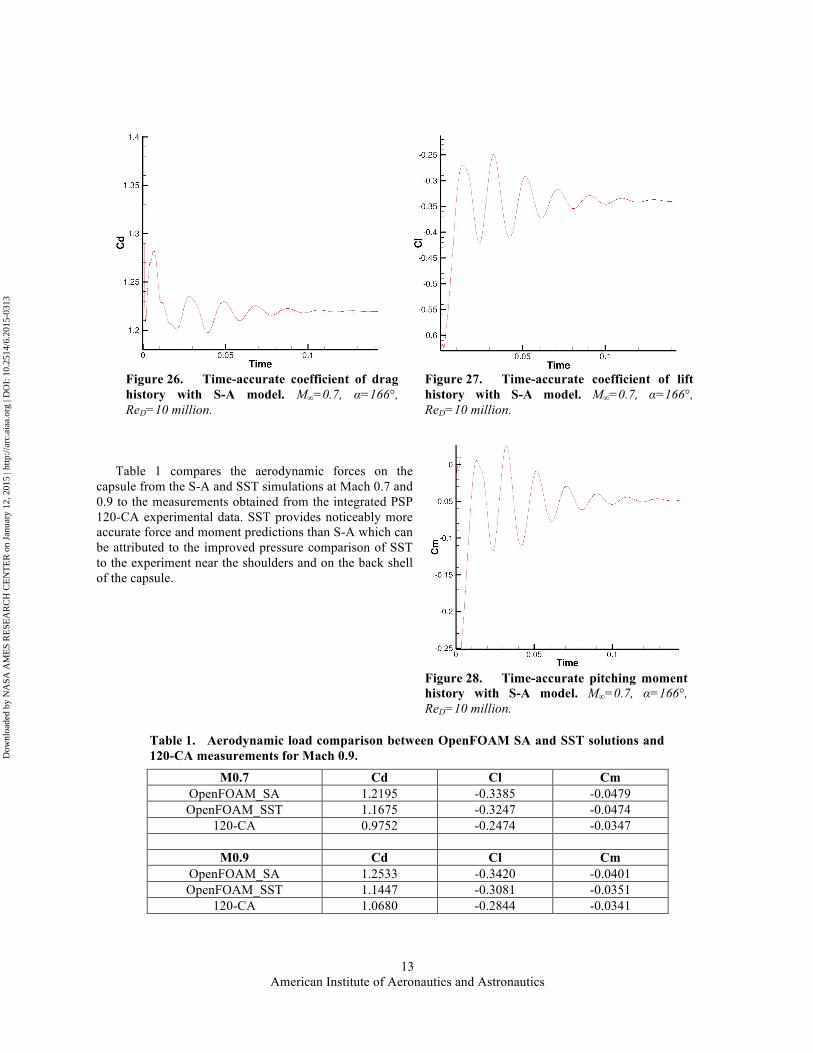
Figures 24 and 25 compare time-averaged velocity solutions at y=0 for the Mach 0.7 S-A and SST cases, respectively, with experimental Particle Image Velocimetry (PIV) optical flow data. The small recirculation regions apparent in the lower portions of the PIV images are caused by anomalous reflections from the source lasers on the wind tunnel walls.6 Noticeable differences in the PIV comparison is a more acute shear layer separation angle and a further upstream wake core location in the OpenFOAM solutions. The S-A model exhibits a more pronounced wake closure than SST and also shows a wake core that is closer to the capsule than the SST solution and PIV data. Figures 26 – 28 shows the time-accurate drag, lift and pitch moment history, respectively, for the Mach 0.7 S-A simulation. Although this simulation appears to be approaching a steady solution, the last 0.05 seconds were time-averaged to produce the solutions shown in Figs. 18, 22 and 24.
Figure 15. Coefficient of drag history. M∞=0.9, α=166°, ReD=10 million.
Figure 16. Coefficient of lift history. M∞=0.9, α=166°, ReD=10 million.
Figure 17. Pitching moment history. M∞=0.9, α=166°, ReD=10 million.
Dow
nloa
ded
by N
ASA
AM
ES
RE
SEA
RC
H C
EN
TE
R o
n Ja
nuar
y 12
, 201
5 | h
ttp://
arc.
aiaa
.org
| D
OI:
10.
2514
/6.2
015-
0313
American Institute of Aeronautics and Astronautics
9
Figure 18. Surface pressure comparison between PSP and OpenFOAM run with S-A turbulence model. M∞= 0.7, α=166°, ReD=10 million.
Figure 19. Surface pressure comparison between PSP and OpenFOAM run with SST turbulence model. M∞= 0.7, α=166°, ReD=10 million.
Dow
nloa
ded
by N
ASA
AM
ES
RE
SEA
RC
H C
EN
TE
R o
n Ja
nuar
y 12
, 201
5 | h
ttp://
arc.
aiaa
.org
| D
OI:
10.
2514
/6.2
015-
0313

American Institute of Aeronautics and Astronautics
10
Figure 20. Surface pressure comparison between PSP and OpenFOAM run with S-A turbulence model. M∞= 0.9, α=166°, ReD=10 million.
Figure 21. Surface pressure comparison between PSP and OpenFOAM run with SST turbulence model. M∞= 0.9, α=166°, ReD=10 million.
Dow
nloa
ded
by N
ASA
AM
ES
RE
SEA
RC
H C
EN
TE
R o
n Ja
nuar
y 12
, 201
5 | h
ttp://
arc.
aiaa
.org
| D
OI:
10.
2514
/6.2
015-
0313

American Institute of Aeronautics and Astronautics
11
Figure 22. Centerline pressures from OpenFOAM S-A and SST solutions and PSP. M∞=0.7, α=166°, ReD=10 million.
Figure 23. Centerline pressures from OpenFOAM S-A and SST solutions and PSP. M∞=0.9, α=166°, ReD=10 million.
Dow
nloa
ded
by N
ASA
AM
ES
RE
SEA
RC
H C
EN
TE
R o
n Ja
nuar
y 12
, 201
5 | h
ttp://
arc.
aiaa
.org
| D
OI:
10.
2514
/6.2
015-
0313

American Institute of Aeronautics and Astronautics
12
Figure 24. Comparison between experimental PIV data6 (above) and time-averaged velocity solutions from OpenFOAM (below) run with S-A. M∞=0.7, α=166°, ReD=10 million.
Figure 25. Comparison between experimental PIV data6 (above) and time-averaged velocity solutions from OpenFOAM (below) run with SST. M∞=0.7, α=166°, ReD=10 million.
Dow
nloa
ded
by N
ASA
AM
ES
RE
SEA
RC
H C
EN
TE
R o
n Ja
nuar
y 12
, 201
5 | h
ttp://
arc.
aiaa
.org
| D
OI:
10.
2514
/6.2
015-
0313
American Institute of Aeronautics and Astronautics
13
Table 1 compares the aerodynamic forces on the
capsule from the S-A and SST simulations at Mach 0.7 and 0.9 to the measurements obtained from the integrated PSP 120-CA experimental data. SST provides noticeably more accurate force and moment predictions than S-A which can be attributed to the improved pressure comparison of SST to the experiment near the shoulders and on the back shell of the capsule.
M0.7 Cd Cl Cm OpenFOAM_SA 1.2195 -0.3385 -0.0479 OpenFOAM_SST 1.1675 -0.3247 -0.0474
120-CA 0.9752 -0.2474 -0.0347
M0.9 Cd Cl Cm OpenFOAM_SA 1.2533 -0.3420 -0.0401 OpenFOAM_SST 1.1447 -0.3081 -0.0351
120-CA 1.0680 -0.2844 -0.0341
Table 1. Aerodynamic load comparison between OpenFOAM SA and SST solutions and 120-CA measurements for Mach 0.9.
Figure 26. Time-accurate coefficient of drag history with S-A model. M∞=0.7, α=166°, ReD=10 million.
Figure 27. Time-accurate coefficient of lift history with S-A model. M∞=0.7, α=166°, ReD=10 million.
Figure 28. Time-accurate pitching moment history with S-A model. M∞=0.7, α=166°, ReD=10 million.
Dow
nloa
ded
by N
ASA
AM
ES
RE
SEA
RC
H C
EN
TE
R o
n Ja
nuar
y 12
, 201
5 | h
ttp://
arc.
aiaa
.org
| D
OI:
10.
2514
/6.2
015-
0313
American Institute of Aeronautics and Astronautics
14
IV. Conclusion The work presented here summarizes multiple OpenFOAM simulations of compressible three-dimensional flow
about an atmospheric entry capsule. Results within an engineering-level of accuracy are obtained and compared satisfactorily with experimental data. Of the two turbulence models simulated, the SST provided more accurate results than the S-A model.
OpenFOAM contains an abundance of capabilities and options, however there is relatively little documentation or published best practices for compressible three-dimensional flows. Prior to obtaining the above results, numerous simulations diverged or produced non-physical results. The computational time required to reach a converged solution on these massively separated three-dimensional flows is also significantly greater than other comparable CFD codes, especially for the unsteady time-accurate simulations. Early attempts of utilizing OpenFOAM’s General Algebraic Multi Grid (GAMG) solver for solution acceleration proved unsuccessful.
Overall, OpenFOAM has proven to be capable of achieving comparable accuracy to OVERFLOW and experiment for compressible atmospheric entry capsule flows. Therefore, even though there are robustness and simulation time concerns, there is the potential that OpenFOAM can be improved for compressible 3D flows allowing for future exploration of alternate turbulence models and use as a production analysis tool. Implementation of the currently developmental density-based solvers may further improve OpenFOAM’s performance and accuracy for these flow types.
Acknowledgments The authors thank Robert Childs of STC for his essential input regarding atmospheric-entry capsule
methodology and techniques.
References 1OpenFOAM Foundation, “Features of OpenFOAM”, OpenFOAM, URL: http://www.openfoam.org/features [cited 10 May
2014]. 2Shan, H., Delaney, K., Kim, S., Rhee, B., Gorski, J., and Ebert, M., “Guide to NavyFOAM”, Naval Surface Warfare
Center, ADA542846, April 2011. 3Islam, M., “Vehicle Aerodynamics & Aeroacoustics Development Using Open-source CFD,” Audi AG, 2013. 4Lysenko, D., Ertesvag, I., Rian, K., “Modeling of turbulent separated flows using OpenFOAM”, Computers & Fluids, Vol.
80, 10 July 2013, pp. 408-422. 5Graves, G., Gomez, S., and Poroseva, S., “On the Accuracy of RANS Simulations of 2D Boundary Layers with
OpenFOAM”, University of New Mexico, AIAA. 6Ross, J., Heineck, J., Halcomb, N., Yamaguchi, G., Garbeff, T., Burnside, N., Kushner, L., and Sellers, M.,
“Comprehensive Study of the Flow Around a Simplified Orion Capsule Model”, 31st AIAA Applied Aerodynamics Conference, 24-27 June 2013, San Diego, CA, AIAA 2013-2815
7 Buning, P. G., Jespersen, D. C., Pulliam, T. H., Klopfer, G. H., Chan, W. M., Slotnick, J. P., Krist, S. E., and Renze, K. J., “Overflow User’s Manual” NASA Langley Research Center, Hampton, VA, 2002.
8Chaderjian, N. M., and Olson, M. E., “Grid Resolution and Turbulence Model Effects on Space Capsule Navier-Stokes Simulations”, 25th AIAA Applied Aerodynamics Conference, 25-28 June 2007, Miami, FL, AIAA 2007-4562.
9Murman, S., Childs, R., and Garcia, J., “Simulation of Atmospheric-Entry Capsules in the Subsonic Regime”, Submitted to AIAA SciTech 2015.
10Stremel, P., McMullen, M., and Garcia, J., “Computational Aerodynamic Simulations of the Orion Crew Module”, 29th AIAA Applied Aerodynamics Conference, 27-30 June 2011, Honolulu, Hawaii, AIAA 2011-3503.
11OpenFOAM Extend Project, “Release Notes for foam-extend-3.1”, foam-extend-3.1 Source Code Documentation, 2014. 12OpenFOAM Foundation, OpenFOAM C++ Documentation, OpenFOAM Version 2.2.2, 2014. 13Spalart, P. R. and Allmaras, S. R., "A One-Equation Turbulence Model for Aerodynamic Flows," Recherche Aerospatiale,
No. 1, 1994, pp. 5-21. 14Rumsey, C., “Turbulence Modeling Resource”, Turbulence Model Benchmarking Working Group, NASA Langley,
http://turbmodels.larc.nasa.gov/, [cited 10 May 2014]. 15Childs, M., Pulliam, T., Jespersen, D., “OVERFLOW Turbulence Model Resource Verification Results”, NASA, NASA
Advanced Supercomputing Division, Technical Report NAS-2014-03, June 2014. 16Pointwise, Software Package, Ver. 17.2R2, Pointwise Inc, Fort Worth, Texas, 2014. 17Walatka, P., Buning, P., Pierce, L., and Elson, P., “PLOT3D User’s Manual”, NASA TM-101067, 1990. 18Childs, H., Brugger, E., Whitlock, B., Meredith, J., Ahern, S., Pugmire, D., Biagas, K., Miller, M., Harrison, C., Weber,
G., Krishnan, H., Fogal, T., Sanderson, A., Garth, C., Bethel, E. W., Camp, D., Durant, O., Durant, M., Favre, J., and Navr, P., “VisIt: An End-User Tool For Visualizing and Analyzing Very Large Data”, High Performance Visualization – Enabling Extreme-Scale Scientific Insight, Oct 2012, pp. 357-372.
Dow
nloa
ded
by N
ASA
AM
ES
RE
SEA
RC
H C
EN
TE
R o
n Ja
nuar
y 12
, 201
5 | h
ttp://
arc.
aiaa
.org
| D
OI:
10.
2514
/6.2
015-
0313