using ornl titan to develop 50k years of flood risk ... · ornl titan used to compute global...
TRANSCRIPT

Using ORNL Titan to develop 50k years of Flood Risk Scenarios (for FEMA / NFIPand other clients)
Dag Lohmann, April 17th 2018
KatRisk LLC752 Gilman St.Berkeley, CA 94710510-984-0056
www.KatRisk.com
KatRisk Deutschland GmbHWilhelmstr. 679098 Freiburg, Germany0761-5146-7600

KatRisk HPC User Forum Agenda
KatRisk introduction
KatRisk cat response and flood maps: why new flood maps?
The core of catastrophe modeling
Using ORNL Titan to compute flood maps
From flood maps to risk models
Coupled tropical cyclone wind, flood and storm surge results for the US

KatRisk Introduction – HPC User Forum Founded in 2012, global flood and wind catastrophe models
Diverse customers– 3 of top 4 insurance brokers
– 2 of top 3 reinsurance companies
– ~ 30 primary insurers
– FEMA (US Hurricane Wind, Storm Surge and Inland Flood) + others
Sea level rise and changing precipitation extremes sensitivity
Heavy compute power needed to compute US on 10m resolution
Hurricane Wind Fields
New Orleans Storm Surge
Detailed Flood (Harvey)
KatRisk utilized resources of the Oak Ridge Leadership Computing Facility at the Oak Ridge National Laboratory, which is supported by the Office of Science of the U.S. Department of Energy under Contract No. DE-AC05-00OR22725.
5 Million hours, 2-d GPU SWE code
Detailed slides on sea level rise and US wide losses on http://www.katrisk.com
KatRisk Cat Response
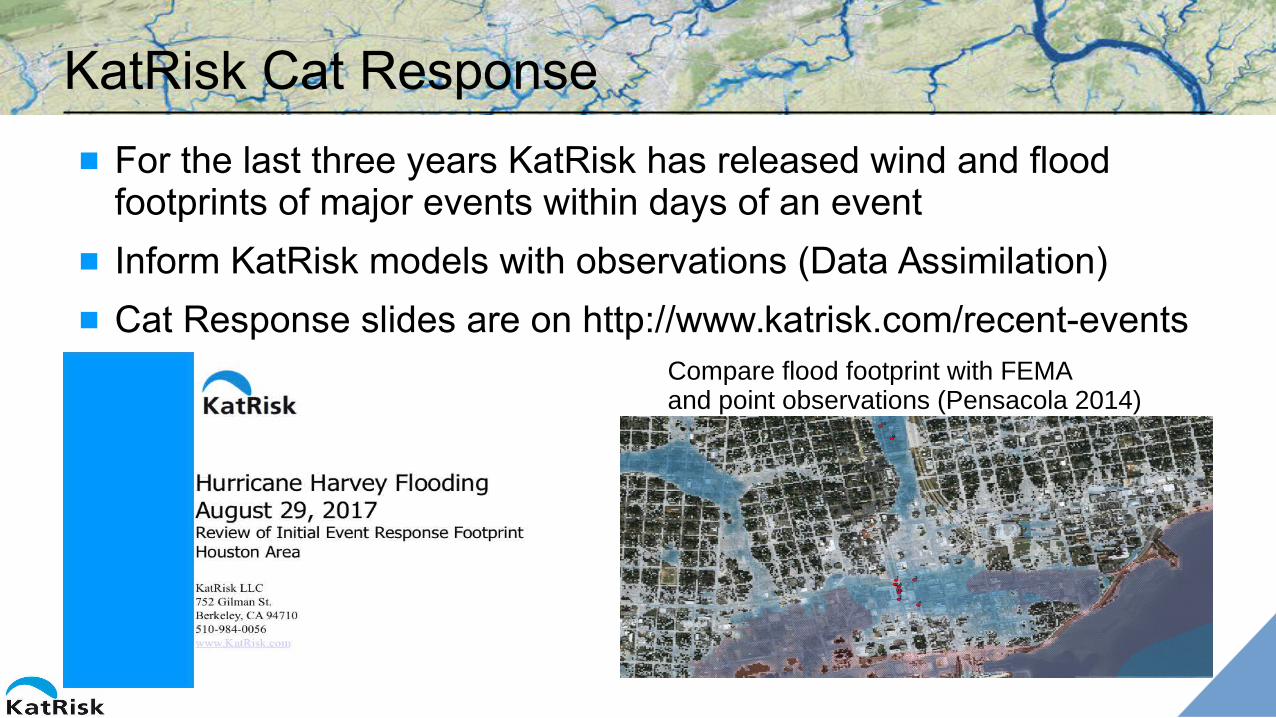
For the last three years KatRisk has released wind and flood footprints of major events within days of an event
Inform KatRisk models with observations (Data Assimilation)
Cat Response slides are on http://www.katrisk.com/recent-eventsCompare flood footprint with FEMAand point observations (Pensacola 2014)

Harvey KatRisk Event Response
http://www.katrisk.com/recent-events

Flooded Downtown Area Outside of FEMA Hazard Zones
Blue Shading – KatRisk Flood ModelRed Hatched – FEMA Zones A and V
Pensacola Flooding April 2014

1
98
5
10
2
7
4 6
Photos Pensacola News Journal
3
Pensacola Flooding April 2014

Why new maps? Coverage and Extent of Modeling
Red outlines – FEMA 100 year flood zones
Blue – high resolution model including pluvial (surface) and fluvial (riverine) flooding
FEMA FIRMs cover much but not all of the US
In many areas they cover the main rivers but not smaller streams and surface water flooding
Need to model the the water getting to the rivers as well as out of the rivers

KatRisk Pluvial / Fluvial Modeling
10
Fluvial Flood Pattern
Pluvial Flood Pattern
Fluvial boundary conditions from upstream catchments
USGS catchment 0101000906
Boundary conditions from storm water runoff input
Combined Flood Footprint
Finite Volume Navier-Stokes Equations
Finite Volume Diffusive Wave
ORNL TITAN used to compute global pluvial and fluvial maps

USA Flood Maps (NY)
NY State FEMA and KatRisk coverage

Zoom into NY Flood Maps
KatRisk Red and White, FEMA Blue
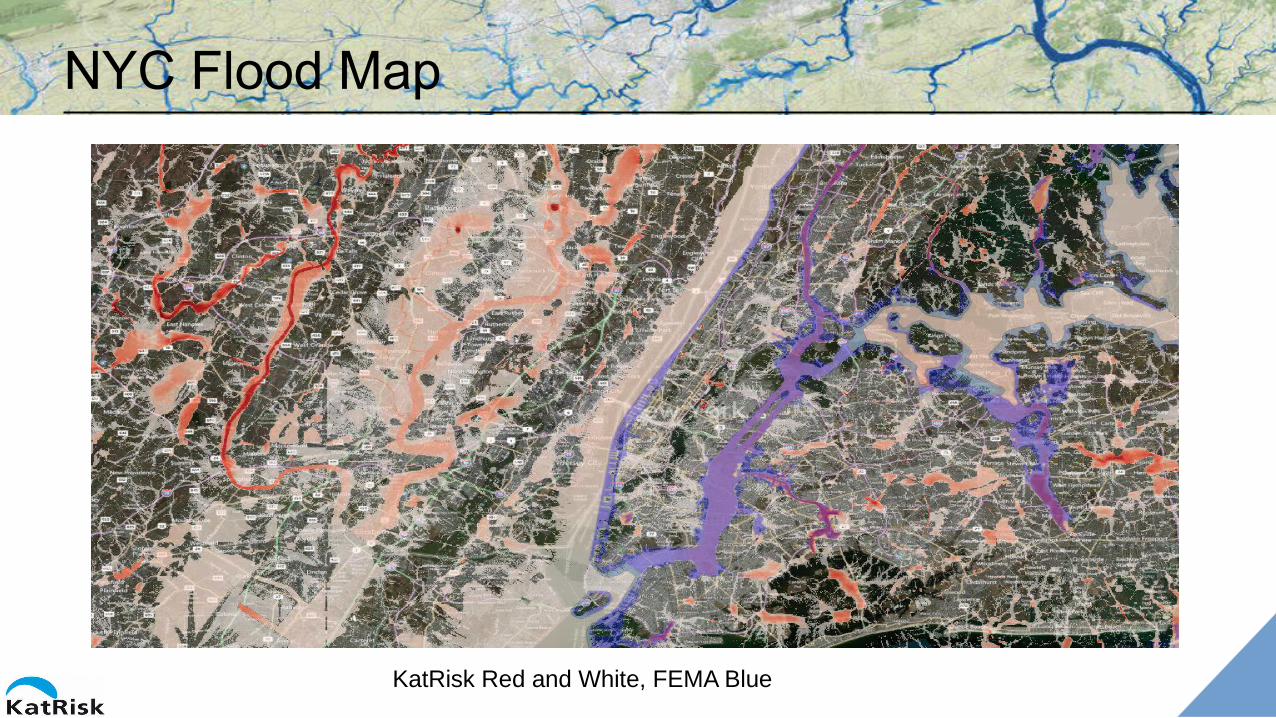
NYC Flood Map
KatRisk Red and White, FEMA Blue

NYC Flood Map
KatRisk Red and White, FEMA Blue

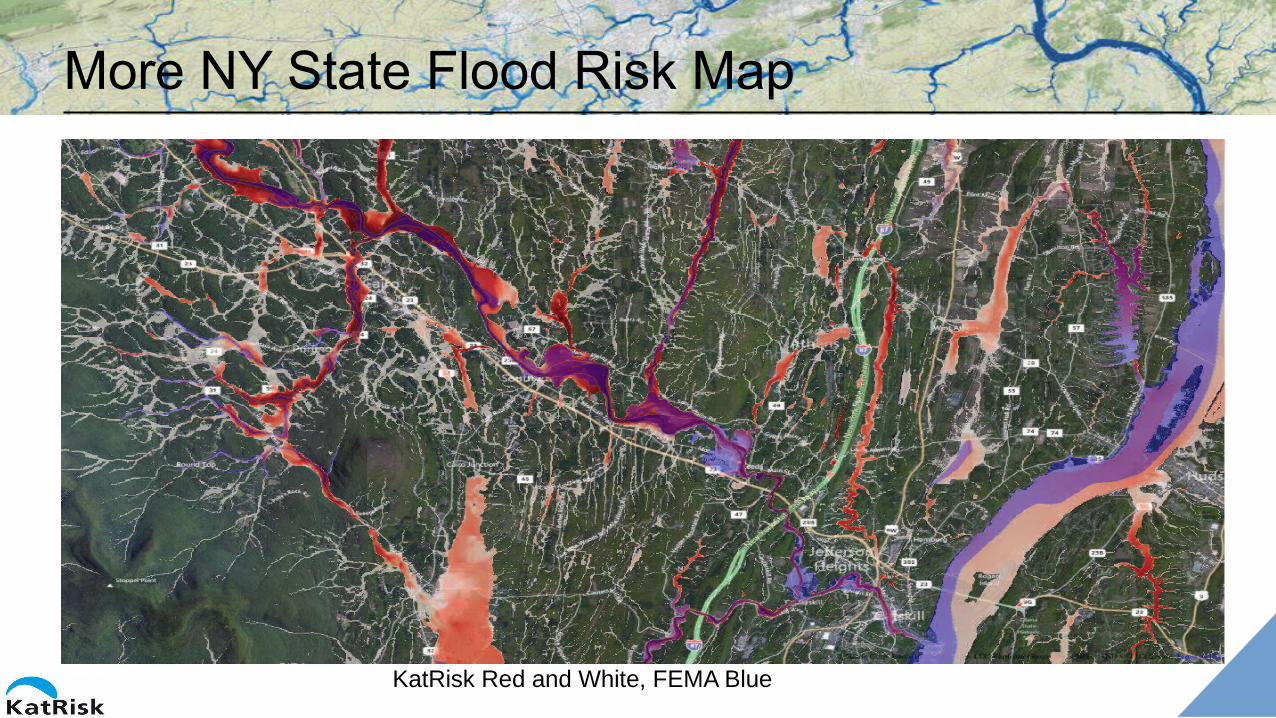
More NY State Flood Risk Map
KatRisk Red and White, FEMA Blue

More NY State Flood Risk Map
KatRisk Red and White, FEMA Blue

More NY State Flood Risk Map
KatRisk Red and White, FEMA Blue
More NY State Flood Risk Map
KatRisk Red and White, FEMA Blue

History of Catastrophe Models AIR (1987) and RMS (1988) founded
– Build first EQ and hurricane models
1992: Hurricane Andrew
– $16B insured losses
– 11 insolvencies
1994: Northridge Earthquake
– $12B insured losses
1996: First cat bonds, Rating Agencies require cat loss information
2001/2002: WTC and first terrorism model
2005: Hurricane Katrina
– $40B insured losses
– 0 insolvencies

What is at the core of catastrophe models?Answer: Quantifying the economic and insured losses of natural catastrophes KatRisk economic losses for US hurricane, storm surge and inland flood: AAL = $39 Bn
Model run with economic exposure–About $80 Trillion insurable–Three Lines of Business (RES, COM, IND)–Average Vulnerability–KatRisk Default Flood Defences–Ran every 10th location–100 Samples (5 Million year EP)–Model IF/SS results sensitive to assumptions of BFE
–SpatialKat run-time GU/GR ~ 80 minon 25 cores Xeon E5-2690
Harvey = $80 Bn
16 Year RP Harvey ($80 Bn) was an event thathas a loss exceedance probabilityof 1/16 ~ 6% in any given year
AAL = Average Annual LossOEP = Occurrence Exceedance ProbabilityAEP = Aggregate Exceedance Probability

KatRisk Simplified Global Workflow
Probabilistic Deterministic Expensive Financial + Analysis + API
Probabilistic VARMA based Ocean SST model
Probabilistic Tropical Cyclone Track Model Probabilistic Precipitation and Temperature Model, Surface Meteorology
TC Precipitation Model
Land Surface Model River Routing Model
Hydraulic 2-d Flood Model
Tropical Cyclone Wind Model
Storm Surge Model, Tidal Model
2-d hydraulic
Exposure and GU Loss Model (API for third party data integration)
Insured Loss Model (Policies, Treaties)
Statistics, Analysis, Maps (WMS), Web Interface (GUI) and Web Service (API)
Probabilistically sampled vulnerability with correlated severity distributions
TITANAWS

2017 KatRisk US Inland Flood, Storm Surge, Hurricane Model
Summary Highlights and some Cat Model Industry Firsts Fully correlated multi-peril 50k year event set (up to 50 Million years
sampled) with TC and non-TC flood events
Groundbreaking low run-times from laptop to server to cloud
2-d hydraulic modeling everywhere (storm surge and inland flood) with user defined inland flood defenses (with KatRisk defaults)
Actuarial coherent view of risk computations with repeatable location aware correlated uncertainty sampling (allows buildings as footprints)
Global correlations through teleconnections and climate change sensitivity
Transparent financial model with multi-peril contracts
Expose key model sensitivities to user (flood defences, correlation, etc.)

KatRisk Hurricane and Storm Surge Model A climate conditioned hurricane track set developed for the Atlantic Basin (1km resolution,
10k * 5 years of events)
Combined with roughness, windfield, and vulnerability models, full wind loss modeling capabilities
Sample Tracks 100 Year Windspeed Map

Storm Surge and Inland Flood Storm surge (SS) has been simulated for the
entire 50k year track set and output on a 10m resolution grid with parametric wave model
Inland flood simulation with TC and non-TC rainfall. 50k years of continuous simulation of pluvial and fluvial flooding (KatRisk US Flood Model 2017)
Correlated Wind fields, storm surge, and TC precipitation
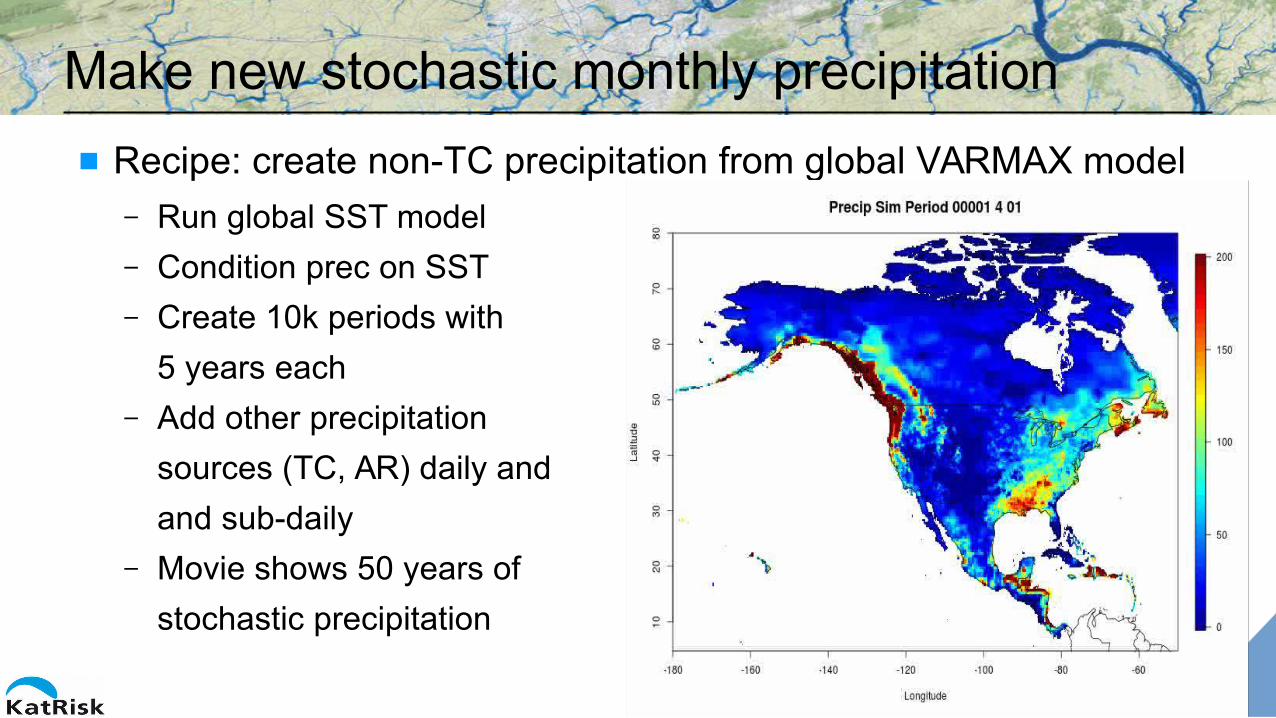
Make new stochastic monthly precipitation
Recipe: create non-TC precipitation from global VARMAX model– Run global SST model
– Condition prec on SST
– Create 10k periods with
5 years each
– Add other precipitation
sources (TC, AR) daily and
and sub-daily
– Movie shows 50 years of
stochastic precipitation

Storm Surge Modeling Storm surge has been analyzed for 50,000 years of hurricane tracks
Houston
Chesapeake Bay
New Orleans
New York
Images show KatRisk Score (1-10)

Peril – Peril Correlation: Harvey
KatRisk released modeled footprint during event, and updated throughout event
Loss estimates based on KatRisk footprints– 8.8 million point IED in Texas
– $40 - $50 Billion GU Texas Inland Flood Loss
– Large demand surge (1.4?) + wind and storm surge (<$2 Billion) + other areas ~ $80 Billion

Overview of US Economic Insurable Losses
USA AAL All Perils (TC, IF, SS) Combined = $39 Billion +- $6 Billion
Model run with economic exposure– About $80 Trillion insurable
– Three LOBs
– Average Vulnerability
– Ran every 10th location
– 100 Samples (5 Million year EP)
– Model IF/SS results sensitive to
assumptions of BFE
– SpatialKat run-time GU/GR ~ 80 min
on 25 cores Xeon E5-2690$80 Billion
16 Year RP
AAL and EP all Perils (Flood, Storm Surge, Wind)
CombinedWind
Inland FloodStorm Surge
CombinedWind
Inland FloodStorm Surge
OEP AEP
$80 Billion
16 Yr RP
77 Yr RP
$80 Billion
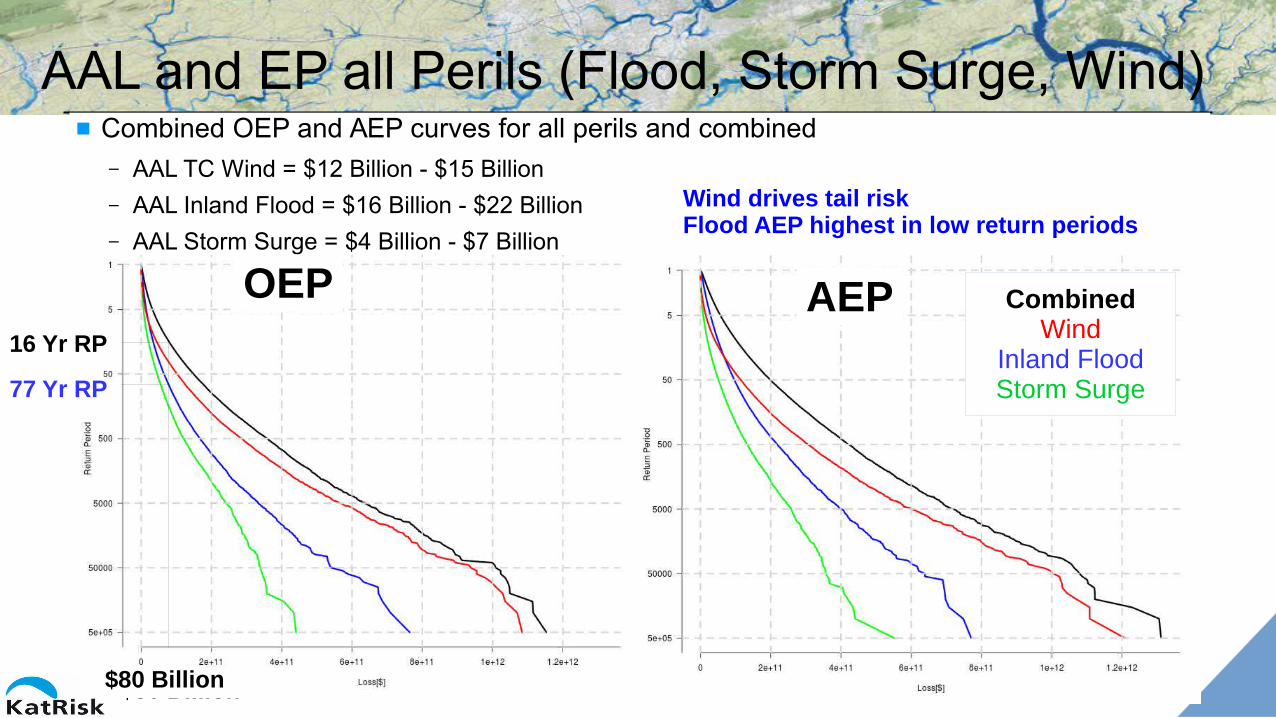
Combined OEP and AEP curves for all perils and combined– AAL TC Wind = $12 Billion - $15 Billion
– AAL Inland Flood = $16 Billion - $22 Billion
– AAL Storm Surge = $4 Billion - $7 Billion
Wind drives tail riskFlood AEP highest in low return periods
OEP

EP all Perils (Flood, Storm Surge, Wind)
Zoom: all perils combined
CombinedWind
Inland FloodStorm Surge
CombinedWind
Inland FloodStorm Surge
OEP AEP
$80 Billion
16 Yr RP
77 Yr RP

Deeper look into TC vs. non-TC losses
CombinedWind
Inland FloodStorm Surge
CombinedWind
Inland FloodStorm Surge
OEP AEP
$80 Billion
420 Yr RP
25 Yr RP
Just TC only, wind, inland flood, storm surge
How special was Harvey for just TC flood? Answer: very

Deeper look into TC vs. non-TC losses
Zoom: Just TC only, wind, inland flood, storm surge
CombinedWind
Inland FloodStorm Surge
CombinedWind
Inland FloodStorm Surge
OEP AEP
420 Yr RP
$80 Billion
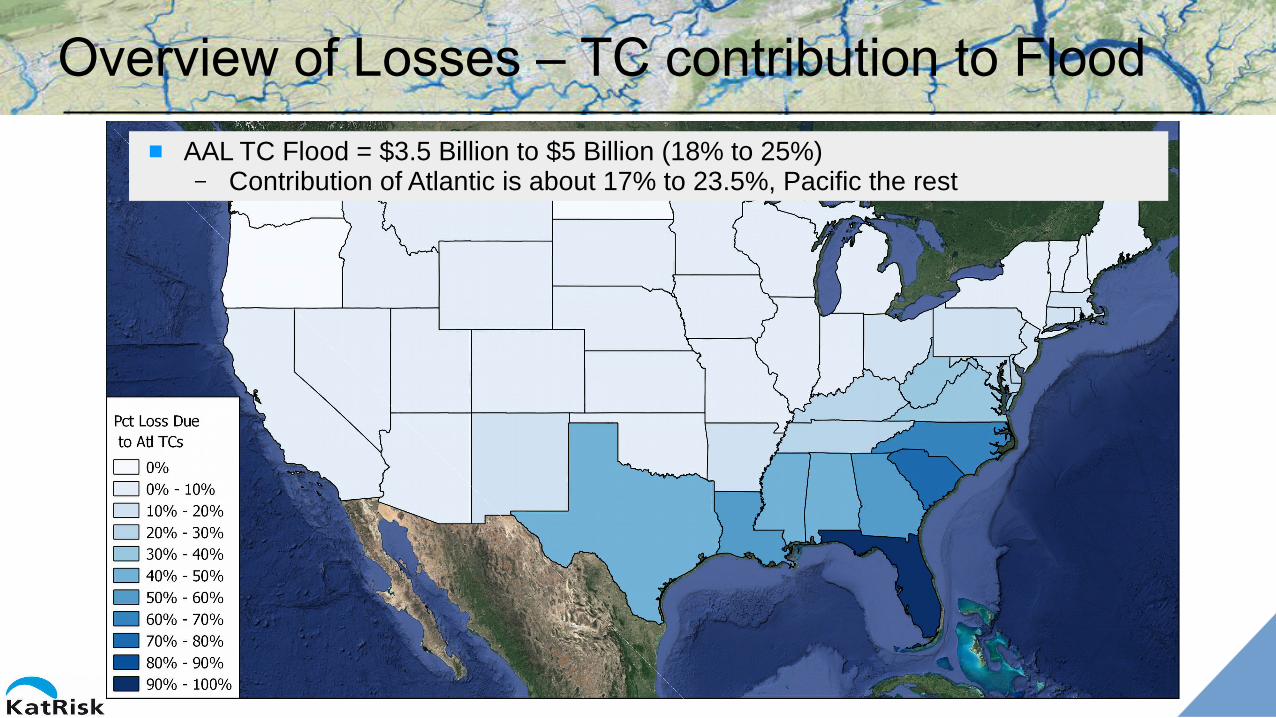
AAL TC Flood = $3.5 Billion to $5 Billion (18% to 25%)– Contribution of Atlantic is about 17% to 23.5%, Pacific the rest
Overview of Losses – TC contribution to Flood

AAL TC Flood = $3.5 Billion to $5 Billion (18% to 25%)– Contribution of Pacific is about 1% to 1.5%, Atlantic the rest
Overview of Losses – TC contribution to Flood

Effects of ENSO on Precipitation in Oct – March
https://www.climate.gov/news-features/featured-images/how-el-ni%C3%B1o-and-la-ni%C3%B1a-affect-winter-jet-stream-and-us-climate
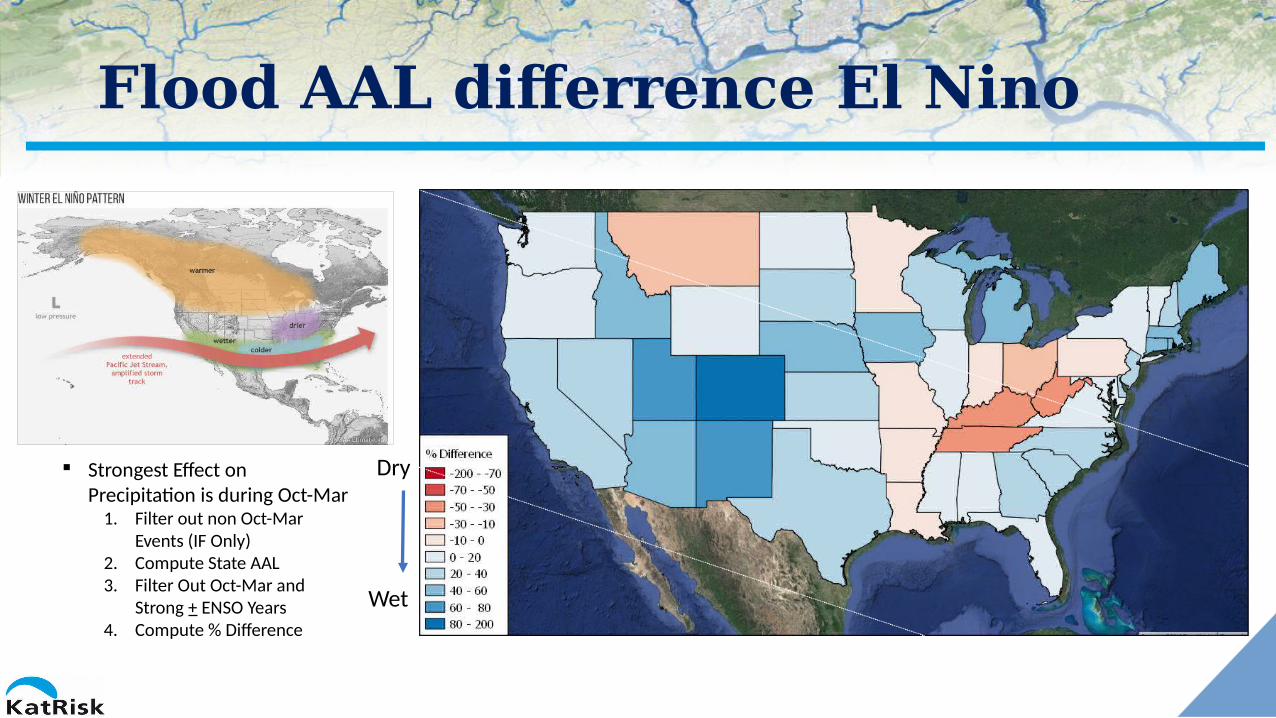
Flood AAL differrence El Nino
Wet
Dry Strongest Effect on Precipitation is during Oct-Mar
1. Filter out non Oct-Mar Events (IF Only)
2. Compute State AAL3. Filter Out Oct-Mar and
Strong + ENSO Years4. Compute % Difference

Flood AAL Difference La Nina
Wet
Dry Strongest Effect on Precipitation is during Oct-Mar
1. Filter out non Oct-Mar Events (IF Only)
2. Compute State AAL3. Filter Out Oct-Mar and
Strong + ENSO Years4. Compute % Difference

USA AAL by Atlantic SST and ENSO
Hurricane losses dependency on Atlantic SST Anomaly and ENSO
AAL by Atlantic SST
AAL by ENSO
Introduction of SST leads to clusteringfor TCs that cause losses in the USA
# Atlantic TCs with SST Dispersion = 1.15# Atlantic TCs Poisson

SpatialKat Financial Model
Explicit inuring order between perils
Choose wind or flood first
Choose how wind and flood losses should be
executed within a contract
Choose how surge and inland flood should be
executed within a contract
Financial ModelLimits, Deductibles
and BlanketsLocation
CoverageSite
AccountPortfolio
FacultativeReinsurance
Special Conditions
Comprehensive client survey to ensure contracts execute as they
do in reality

Climate Sensitivity: Short Story about Sea Level
Representative Concentration Pathways
LIG127k
11k to today rise in sea level
Lohmann, AWI

Sea Level Rise Puzzle During Last Inter-Glacial (LIG) exposed fossil reef indicate 5m - 9m higher sea
level (Dutton & Lambeck, 2012, Dutton et al., 2015)
LIG with Sea Surface Temperature Southern Hemisphere + 1 - 3oC warmer (Capron et. al. 2014)
Lohmann, AWI

Melting West Antarctic Ice Sheet from below Last Interglacial: Climate Models and paleo-climate data are consistent
Antarctic Ice Sheet: Marine ice sheet instability -> Sea level rise
Threshold ~2°C based on paleo-climate and climate model studies
Lohmann, AWI

KatRisk Surge Climate Change Study
Compares USA surge losses with current conditions, conditions around 1900, and a uniform 30 cm sea level rise (SLR)– Current speed of SLR is about 2.8 to 3.6 mm/year (currently accelerating), and was about
1.8 mm/year in the 20th century
Use high resolution exposure of $6.88 trillion along the coasts results summarized on 200m gridded resolution
Buildings, contents, time element and appurtenant structures modeled
Ground-up AAL increased from $5 billion to $6.9 billion, implying an increase of about $60 million per centimeter SLR, or currently about $20 million per year (although the increase is not linear), equal to 0.4% of the AAL – but also with potential to accelerate.
Ground-up AAL increased from $4 billion to $5 billion based on a 20cm sea level rise between 1900 and today. Simulations for 1900 assume the same sea defenses, bathymetry, and tropical cyclone frequency and severity as today.
Number are slightly different compared to before – ran different BFE assumptions for this

Sea Level Rise 30cm
SS EP curves past, present and potential future
Current
Loss / RP 2 5 10 20 50 100 200 500 1000
1900 [$billion] 0.443 3.6 8.4 16.9 33.2 48.1 65.8 95.7 127.3
BASE [$billion] 0.65 4.8 10.8 20.9 39.5 56.4 75.9 108 141
SLR [$billion] 1.0 7.1 15.2 27.6 49.6 69.6 92.2 128 161
AAL = $5.0 Bn AAL = $6.9 BnAAL = $4.0 Bn
1900

Southern Florida Exposure

Southern Florida (AAL GU loss ratio 1900)

Southern Florida (AAL GU loss ratio now)

Southern Florida (AAL GU loss ratio SLR)

Increase in GU loss AAL [$Bn] by State
Increase in GU loss AAL between 1900 and today, as well as today to uniform 30cm SLR scenario.
Exposures are from current residential, commercial and industrial estimates
Risk increase is measured as increase in AAL by state

KatRisk US results for wind, flood, storm surge
Questions