using machine learning in environmental tax reform ... filereform assessment for sustainable...
TRANSCRIPT

sustainability
Article
Using Machine Learning in Environmental TaxReform Assessment for Sustainable Development:A Case Study of Hubei Province, China
Yinger Zheng 1,2, Haixia Zheng 3,4,* and Xinyue Ye 5,*1 Department of Urban and Economic Geography, College of Urban and Environmental Sciences,
Peking University, Beijing 100871, China; [email protected] Lincoln Institute Center for Urban Development and Land Policy, Peking University, Beijing 100871, China3 Agricultural Information Institute, Chinese Academy of Agricultural Sciences, Beijing 100081, China4 Department of Business Administration, College of Management, Beijing Union University,
Beijing 100101, China5 Department of Geography, Kent State University, Kent, OH 44242, USA* Correspondence: [email protected] (H.Z.); [email protected] (X.Y.);
Tel.: +86-10-8210-9901 (H.Z.); +1-419-494-7825 (X.Y.)
Academic Editor: Marc A. RosenReceived: 26 September 2016; Accepted: 29 October 2016; Published: 1 November 2016
Abstract: During the past 30 year of economic growth, China has also accumulated a hugeenvironmental pollution debt. China’s government attempts to use a variety of means, includingtax instruments to control environmental pollution. After nine years of repeated debates, the StateCouncil Legislative Affairs Office released the Environmental Protection Tax Law (Draft) in June 2015.As China’s first environmental tax law, whether this conservative “Environmental Fee to Tax (EFT)”reform could improve the environment has generated controversy. In this paper, we seek insights tothis controversial issue using the machine learning approach, a powerful tool for environmental policyassessment. We take Hubei Province, the first pilot area as a case of EFT, and analyze the institutionalincentive, behavior transformation and emission intensity reduction performance. Twelve pilot citieslocated in Hubei Province were selected to estimate the effect of the reform by using synthetic controland a rapid developing machine learning method for policy evaluation. We find that the EFT reformcan promote emission intensity reduction. Especially, relative to comparable synthetic cities in theabsence of the reform, the average annual emission intensity of Sulfur Dioxide (SO2) in the pilotcities dropped by 0.13 ton/million Yuan with a reduction rate of 10%–32%. Our findings also showthat the impact of environmental tax reform varies across cities due to the administrative level andeconomic development. The results of our study are also supported by enterprise interviews. The EFTimproves the overall environmental costs, and encourages enterprises to reduce emissions pollution.These results provide valuable experience and policy implications for the implementation of China’sEnvironmental Protection Tax Law.
Keywords: environmental fee to tax reform; China; synthetic control method; sulfur dioxide (SO2)emissions; machine learning
1. Introduction
Frequent large-scale environmental disasters, such as haze and water pollution, have raisedconcerns among researchers and the public [? ]. Such social pressure forces the government to activelyexplore new instruments of governance to control environmental pollutions [? ? ], and employ newmethods such as machine learning to evaluate its policies.
Sustainability 2016, 8, 1124; doi:10.3390/su8111124 www.mdpi.com/journal/sustainability

Sustainability 2016, 8, 1124 2 of ??
Environmental Taxes are a particular type of economic instrument to handle environmentalproblems by internalizing environmental costs and creating economic incentives for the public andbusinesses to promote ecologically sustainable activities [? ? ].
For thirty years, environmental tax reform has developed rapidly in the globe [? ]. European Union(EU) has implemented series of green growth policies since 1990s [? ? ? ]. In Canada, British Columbia(BC) became the first jurisdiction to approve a revenue-neutral carbon tax in 2008 [? ]. Environmentaltax reform has also spread to developing countries in Asia [? ]. The major concern of environmenttax in these countries is to adjust the tax bases and to bring about “double dividend” [? ], as toimprove the environment and economic efficiency simultaneously. Since having gradually getting ridof the dilemma of “treatment after pollution”, the object of taxation in developed countries is mainlycarbon [? ]. Likewise, the research on the environmental tax has also focused on relationship betweenenvironmental management, economic development and social activities [? ? ? ]. Typical evaluationmethods include CGE (Computable General Equilibrium) [? ] such as General Equilibrium Modelfor Economy-Energy-Environment (GEM-E3, http://www.gem-e3.net), Asia-Pacific Integrated Model(AIM, http://www-iam.nies.go.jp) and Global Trade Analysis Project (GTAP, http://www.gtap.agecon.purdue.edu/models), and time-series-based macro-econometric models [? ], such as GINFORS [? ] andE3ME [? ].
With the growing prominence of environmental issues, the study of environmental tax reformin China has also followed the international trends [? ]. China’s environmental policy assessmentoriginated from the study of pollution levy system [? ? ? ? ], focusing on the analysis of theeffect, mechanism of sewage fees and collection system aiming to reduce the charges. Withthe internationalization of China’s environmental problems, the central focus has also shifted toenvironmental taxes [? ] and the interaction between environmental policy and economic development [?], such as double dividend [? ] and the theoretical mechanism on EFT reform. CGE [? ? ] and othersimulation methods are applied in the evaluations. The research on environmental tax in China is stillin its infancy and focuses mainly on tracking research on international hot topics and methods whilelacks in-depth quantitative analysis on China’s own environmental pollution control policy assessment.China is still suffering from serious environmental pollution. Unlike developed countries that focus oncarbon emissions, China pays more attention on SO2 and other pollutants control in its EnvironmentalProtection Tax Law (Draft) and other environmental policies. In China, environmental taxes were firstintroduced in “Energy Saving and Emission Reduction Comprehensive Work Plan, 2007”. Essentially,the most important part of the environmental tax reform is the “Environmental Fee to Tax (EFT)” reform.This EFT reform was first piloted in Hubei Province in October 2007. After years of repeated debates,the State Council Legislative Affairs Office released the Environmental Protection Tax Law (Draft) inJune 2015 and officially extended Hubei Province’s EFT reform mode nationwide.
The environmental implication of this EFT reform is still in controversy [? ]. Supporters of thislaw believe that EFT is changing the pollutant discharge fees, a soft constraint into environmentaltaxes, an obligatory constraint, greatly enhancing the intensity and rigidity of law enforcement. EFT isan effective way to avoid rent-seeking in the environmental protection departments and interferenceto the collection of pollutant discharge fees by protectionisms, and reduce the shelter to polluters, so asto promote polluting enterprises to make efforts on reducing emissions [? ? ].
Opponents argued that the main reason for the poor effect of pollutant discharge fees is that the feerate of pollutants is too low; this cannot generate incentives for emission reductions. Enterprises wouldrather pay than reduce emissions [? ]. When the pollutant discharge fees are changed into environmentaltaxes, while pollutant tax rates are not greatly increased, the emission reduction will not be promoted.Therefore, a reasonable assessment of the policy effect of EFT not only has theoretical significance but alsohas important practical meaning for the legislation of environmental protection tax [? ? ].
As many important reforms in China, China’s legislation on environmental taxes follows theline of thinking—from pilot to popularization. Ordinary measurement methods are difficult to haveperformance for the implementation of pilot policy on a small scale. The limitations of CGE model and

Sustainability 2016, 8, 1124 3 of ??
macroeconomic model in the environmental emissions effect evaluation are also prompting China toseek another way to assess the effect of environmental tax reform [? ? ].
Experimental economics presents an objective and effective evaluation of experimental results,and provides a new perspective and solution for the policy makers and scholars [? ? ]. The reasonableenvironment system design can change the behavior of pollution through both of constraint and incentive,and then reach the expected goal of environmental performance, and therefore, the organic combinationof system, behavior and performance is an effective strategy for the research and analysis of EFT policy.
Experimental economics has a quasi-natural experimental method. The experimental group,where the policy is implemented, is compared with the control group, where the policy is notimplemented. The effect of policy can be seen by the difference of the two groups. The core ofquasi-natural experiment method is to find the appropriate control group, and the main methodsinclude difference-in-differences (DIDS), regression discontinuity design (RD design), synthetic controlmethod (SCM), etc. Among them, the DIDS is the longest method costing most study efforts, andmoreover its credibility is higher [? ]. However, DIDS has two major problems for the performancestudy of EFT as follows: (1) subjectivity of control group select; and (2) policy endogenesis [? ].
RD design is the most widely used in the specific space or in a field, there are obvious naturalboundaries. SCM has the shortest time of birth which uses machine learning for fitting; this is a methodhighly suitable for the study of small samples [? ? ].
SCM is a new policy evaluation method proposed by Abadie [? ], and its basic idea is to constructa good control city through a weighted combination of multi control cities, so as to seek for a controlcity that is completely similar to the target city; this is still an important and difficult problem, whichhas long plagued the research of policy assessment. SCM’s advantages are as follows: (1) SCM issuitable for fine quantitative analysis of small samples; (2) by machine learning method based on bigdata, SCM can determine the weight of control city group to decrease the error of subjective choice [?]; and (3) SCM uses independent modeling, provides corresponding control object for the study ofindividual, and avoids average evaluation [? ].
The basic logic of this method is that it is difficult to find a similar comparison city for each city inthe treatment group, but we can construct a good comparison city with other no-EFT cities outsideHubei Province by multiple computing iterations in machine learning algorithm. Because syntheticcontrol avoids the limitation of the traditional method, it has been widely used in the field of policyevaluation in recent years, including crime interventions [? ], tropical deforestation [? ] and localimpacts of nuclear power facilities [? ]. In the field of environmental policy, Zhang [? ] has used thesynthetic control method to evaluate whether the 2008 Olympic Games improved Beijing’s air quality.
In this study, we employ the synthetic control method, a new approach based on machine learningalgorithm, to assess the impacts of EFT reform among 12 cities in Hubei Province. By creating asynthetic city with multi cities to replicate the target city, we obtained the excess reductions of SO2
emission caused by the reform. The results demonstrate that the EFT reform can effectively restrainthe pollutant discharge, but the effect has regional heterogeneity.
The rest of the paper is organized as follows: Section ?? is background of policy. Section ??introduces the method and data. Section ?? estimates the influence of EFT reform on the SO2 emissionintensity. Finally, Section ?? is the discussion and conclusions.
2. Policy Background
2.1. Background of Hubei Province EFT
Since the end of 1990s, the voice of pollutant discharge fees reform continues nationwide.Hubei Province is the first and the only pilot area; this has its profound inner background. First of all,Hubei Province has experienced a process of high growth and high pollution since 2004. Stimulatedby the policy of the rise of central China, Hubei Province’s GDP has been in a rapid growth since 2004.From 2008 to present, GDP growth rate in Hubei Province has been higher than the average level in
Sustainability 2016, 8, 1124 4 of ??
other regions of the country. With economic development, pollution problems became increasinglyprominent. During 2004–2005, pollutant emissions generally declined throughout the country; inthis context, Hubei Province had a substantial increase in emissions of pollutants [? ]. Secondly,Hubei Province’s collection of pollutant discharge fees was inadequate for a long time, and the effectof pollution emission reduction was not good [? ].
The inadequate collection of pollutant discharge fees in Hubei Province is related to the localgovernment’s serious interference with the pollutant discharge fees in order to protect the economicdevelopment. Some local governments introduced their own policy to distort pollutant discharge feesin order to develop their local economy.
In addition to improving the collection enforcement of pollutant discharge fees, another impetusto the reform in Hubei Province is that irregularities in the use of local pollutant discharge fees areexpected to be changed [? ]. The situation of illegal use of pollutant discharge fees in Hubei Provincewas repeatedly exposed. Under the pressure of public opinion, Hubei Province tried to correct the useof pollutant discharge fees by means of reform. Therefore, in order to reduce local protectionism andpower abuse of environmental protection department, improve the collection efficiency of pollutantdischarge fees, and give play to the role of encouragement of pollutant discharge fees, Hubei Provinceactively reported to the central government, and the pilot of EFT was carried out in Hubei Province.
2.2. Current EFT Pilot Tax System
In view of failure of pollutant discharge fees, on 1 October 2007, Hubei Province startedimplementing the reform of EFT (http://www.hbepb.gov.cn/hbfg/szfgz/200710/t20071012_8814.html). In the past, “the environmental protection department was responsible for approval andcollection of pollutant discharge fees”, after the reform of EFT, “the environmental protectiondepartment is in charge of approval while local tax department is in charge of collection”. The patternof collection and supervision is that “the environmental protection department is responsible forapproval while the tax department is responsible for collection, and the bank is for storage while thefinancial system is for unified management”, making collection, management and use of pollutantdischarge fees separate. Accordingly, a new collection and supervision pattern of pollutant dischargefees is formed, namely four-sector linkage of environmental protection, tax, finance and bank, andjoint supervision, which pioneered the reform of collection and supervision of pollutant dischargefees in the county [? ? ]. The specific differences before and after EFT in Hubei Province are shown inTable ??.

Sustainability 2016, 8, 1124 5 of ??
Table 1. Comparison before and after EFT in Hubei Province.
Item Compared Pollutant Discharge Fees Environmental Taxes
Collection department Environmental protection department ofprovince, city, county Provincial local tax department
Collection cycle Half of year or a year Month or season
Funds use
Funds are used for environment governance;however, irregularities led to self-use funds forthe environmental protection department or thelocal government.
Funds are under the unified managementof public finance budget.
Collection procedure
The environmental protection department isresponsible for the approval and collection, andthe payment is into the local financial budgetaccount. A strict monitoring and evaluationmechanism is absent.
It is approved by the environmentalprotection department, and collected intothe treasury by the tax department underthe same tax assessment mechanism.
EnforcementIts enforcement is weaker than that of tax. As asoft constraint, its law enforcement is relativelylarge at random.
As an obligatory constraint, it has lawenforcement with rigid features.
Superior leadership Local government Provincial government
Sources: compiled during the research project.
3. Method and Data
3.1. Synthetic Control Method and Machining Learning
In the public domain, from the national level, a series of policy intervention may be implemented.How to identify the path and influence size of a correct policy is very difficult, especially the effect of apilot policy [? ]. There are two main reasons:
(1) Policy endogeneity, which means that there is a systematic difference between pilot cities andother cities, and this difference is exactly the reason for why the cities to become pilot cities;
(2) The time and regional restrictions of the pilot areas cannot provide a large number ofpolicy implementation samples; this is not applicable to the traditional econometric methods.Synthetic control method provides a new approach to identifying the effectiveness of the policy.This approach conducts classification and clustering learning according to the characteristics ofa large number of non-pilot cities through machine learning, and extracts the core elements toestablish a multidimensional model image of pilot cities. By means of linkage of small samples ofpilot and big data, the effective assessment of performance on the pilot cities is implemented.
In this section, we attempt to reveal the causal effect of EFT reform by imputing the missingpotential emission intensity reductions, which is the counterfactual outcome that would have prevailedif cities had not implemented the EFT reform. For this purpose, we invoke the synthetic control method,first developed by Abadie and Gardeazabal [? ] and then extended by Abadie et al. [? ].
EFT reform in Hubei Province began at the end of 2007. Since other provinces did not adopt thereform policy, we can take the environmental tax reform in Hubei Province as a natural experiment.In accordance with the theory of policy evaluation, we put the pilot cities after 2007 into the treatmentgroup, other cities into the control group, and then by comparing the differences between the controlgroup and the treatment group, we will be able to assess the effect of the EFT reform. Suppose thereare K + 1 cities, as indexed by i = 1, 2, . . . , K + 1 over all T periods, t = 1, 2, . . . , T. Only city i = 1passed the EFT reform and the remaining K cities are the potential control cities that did not pass thereform, also called the donor pool. Then there are T0 number of pre-reform periods, and T1 number ofpost-reform periods so T0 + T1 = T. The general effect of tax reform for city i at period t is then givenby αit = Y I
it −YNit where Y I
it is the pollutants emission intensity of city i if the reform is started in T0 + 1
Sustainability 2016, 8, 1124 6 of ??
to T and YNit is the pollutants emission intensity in the absence of the reform. Since only city i = 1 starts
EFT reform, we need to estimate (α1T0+1, . . . , α1T). We can first estimate YNit by the factor model:
YNit = δt + θtZi + λtµi + εit (1)
where δt is an unidentified common factor invariant across the units, Zi is the covariate vectornot affected by the reform, θt is a vector of unidentified time-specific parameters, λt is a vectorof unidentified common factors, while µi is the city-specific non-observable and also the error term εitis the zero-mean variable following the random distribution. The existence of anticipatory effects areirrelevant in this case, indicating that all the essential elements in Zi that belong to pre-reform periodare not impacted by the reform. Equation (1) allows the effect of non-observable city heterogeneity todiffer over time.
In our study, all the factors, such as economic factors, population factors, factors of openness,administrative factors, technological factors and industrial structure factors , are the inputs, as the Ziof the model from Equation (1).
With the panel DIDS estimator, the consequence of non-observable heterogeneity, λt is supposedto be fixed over time. Thus, the synthetic control method makes a substantial improvement on theDIDS method and handles endogeneity caused by the existence of non-observable confounders varyingover time.
The method intends to construct the missing counterfactual, YNit from the cities not impacted by the
reform. Let W = (w2, ..., wk+1)′ be (k× 1) vector of weights such that 0 ≤ wj ≤ 1 for i = 2, 3, ..., k + 1
andk+1∑
k=2wk = 1. Each vector W presents a possible synthetic control, which means a distinct weighted
average of control cities. The outcome variable value for each particular synthetic control is:
k+1
∑k=2
WkYkt = δt + θt
k+1
∑k=2
WkZk + λt
k+1
∑k=2
Wkµk +k+1
∑k=2
Wkεkt (2)
Suppose that there are(w∗2 , . . . , w∗k+1
)such that:
k+1
∑k=2
w∗k Yk1 = Y11,k+1
∑k=2
w∗k Yk2 = Y12, . . . ,k+1
∑k=2
w∗k YkT0 = Y1T0 andk+1
∑k=2
wkzk = z1 (3)
Abadie et al. [? ] prove if ∑T0t=1 λ′tλt is non-singular, then
YN1t −
k+1
∑k=2
w∗k Yk1 =k+1
∑k=2
w∗kT0
∑s=1
λt
(T0
∑n=1
λ′nλn
)−1
λ′s (εks − ε1s)−k+1
∑k=2
w∗k (εks − ε1s) (4)
λt is applied as unidentified common factors to present the unknown variables, which may alsoinfluence the model. There are many ways to guarantee that non-singular condition is satisfied, suchas feeding the vectors as constant.
Abadie et al. [? ] shows the estimate of the effect of the reform for the enacted cities, Equation (5)is an unbiased estimator of α̂1t:
α̂1t = Yit −k+1
∑k=2
w∗k Ykt t ∈ [T0 + 1, . . . , T] (5)
where w∗j the weight is assigned to the kt cities that did not enact the reform.
Equation (4) can hold exactly only if (Yk1, Z1) actually belongs to the convex hull of
[(Yk2, Z2), . . . , (Yk
p+1, ZP+1)]. This means it is possible that the pre-reform SO2 emissions intensity

Sustainability 2016, 8, 1124 7 of ??
of some of the reform-enacted states will not be synthetized properly using the pre-reform features ofthe cities that did not enact such reform.
The vector W∗ is designed to minimize the distance relationship between the vector of pre-reformfeatures for the exposed city (X1) and the weighted matrix that does contain the pre-reform features ofthe unexposed cities
(X0) :‖ X1 − X0W ‖=√(X1 − X0W)′ V (X1 − X0W) (6)
where V is a positive semi-definite symmetric matrix. The minimization procedure is strictly subject tocertain constraints that the weight specifically assigned to unexposed city varies between zero andone, and the sum of weights is bounded by one.
For Equation (6), we used the quadratic programming, which is a typical optimization methodin machine learning [? ], in order to optimize the minimization process of the loss function of theweights. The machine learning method in the synthetic control method enables us to evaluate themodel not only with big size of samples, but also with small ones by constructing a virtual syntheticmatch groups.
Synthetic control method promotes the effective usage of data-driven processes to automaticallygenerate suitable comparison groups. This enables researchers to use quantitative and qualitativemethodologies, to effectively analyze similarities and differences between the participating unitsrepresenting the particular case of interest and the synthetic control, to evaluate the impact of theindividual cases rather than a single average value of impact [? ]. This method can be particularlyuseful for our study, of which the sample data are relatively small and evaluation of an average effectcould be rather difficult or potentially misleading. However, we notice the limitations of the analyticalmethod, and make recommendations for empirical practice. Although synthetic controls are definedas convex combinations of unexposed individual units, weights above one or negative weights canalso be used by allowing the extrapolation. For example, for either China’s highest industrial sulfurdioxide emissions intensity city Chongqing or the lowest emission intensity city Sanya, the controlgroup cannot be weighted to reach the same industrial sulfur dioxide emissions, so synthetic controlmethod is no longer appropriate in this case. Fortunately, most of the cities in Hubei Province does nothave this problem; it is suitable for synthetic control method.
3.2. Data and Sample Selection
We used balanced panel data during 2003–2013 of 12 pilot cities in Hubei Province (Figure ??) andthe other 262 cities in China. The city data come from the CHINA CITY STATISTICAL YEARBOOK [?] and the official websites of these cities’ Statistics Bureaus, while national and provincial data comefrom the CHINA ENVIRONMENT YEARBOOK [? ].

Sustainability 2016, 8, 1124 8 of ??
Sustainability 2016, 8, 1124 7 of 20
Sanya, the control group cannot be weighted to reach the same industrial sulfur dioxide emissions, so synthetic control method is no longer appropriate in this case. Fortunately, most of the cities in Hubei Province does not have this problem; it is suitable for synthetic control method.
3.2. Data and Sample Selection
We used balanced panel data during 2003–2013 of 12 pilot cities in Hubei Province (Figure 1) and the other 262 cities in China. The city data come from the CHINA CITY STATISTICAL YEARBOOK [37] and the official websites of these cities’ Statistics Bureaus, while national and provincial data come from the CHINA ENVIRONMENT YEARBOOK [38].
Figure 1. Twelve Target Cities in Hubei Province in central China. Notes: The gray parts are the pilot cities in this paper.
According to lots of previous work, such as the study of Peng et al. [39] and Lehoczki and Sleszynski [40], this study chooses industrial SO2 emissions intensity (GDP and per capita GDP used in this paper are based on the benchmark of 2003 at constant price) as an EFT reform evaluation indicator, and the specific equation such as Equation (7). Due to the difference of each city’s SO2
emission intensity, the direct use of the difference of emission reduction intensity is not scientific. This study takes β difference ratio to represent the effect of EFT, named decline rate hereinafter referred to as the emission reduction effect, and the specific equation such as Equation (8). SO emissions intensity = SOGDP (7)
= (SO realemissions intensity − SO synth emissions intensity)(SO real emissions intensity (8)
China is currently the world’s largest source of SO2 emissions; meanwhile, SO2 is the main air pollutant [41] in China, causing various environmental disasters such as acid rain [42] and haze weather [43]. Industrial SO2 emissions accounted for more than 90% of China’s total pollutant emissions. Thus, controlling such pollution is an urgent task for environmental protection authorities. This study chooses industrial SO2 emission intensity, namely the ratio of SO2 emissions to GDP, and the tax reform effect in improving the regional environment
The sample of this study has the typical “treatment after pollution” characteristics. In March 2004, Premier Wen Jiabao proposed the “Rise of Central China” [44], followed by a series of plans to stimulate the central region’s economy, including Hubei Province. Correspondingly, Hubei Province
Figure 1. Twelve Target Cities in Hubei Province in central China. Notes: The gray parts are the pilotcities in this paper.
According to lots of previous work, such as the study of Peng et al. [? ] and Lehoczki andSleszynski [? ], this study chooses industrial SO2 emissions intensity (GDP and per capita GDP used inthis paper are based on the benchmark of 2003 at constant price) as an EFT reform evaluation indicator,and the specific equation such as Equation (7). Due to the difference of each city’s SO2 emissionintensity, the direct use of the difference of emission reduction intensity is not scientific. This studytakes β difference ratio to represent the effect of EFT, named decline rate hereinafter referred to as theemission reduction effect, and the specific equation such as Equation (8).
SO2 emissions intensity =SO2
GDP(7)
β =(SO2 real emissions intensity − SO2 synth emissions intensity)
(SO2 real emissions intensity)(8)
China is currently the world’s largest source of SO2 emissions; meanwhile, SO2 is the mainair pollutant [? ] in China, causing various environmental disasters such as acid rain [? ] andhaze weather [? ]. Industrial SO2 emissions accounted for more than 90% of China’s total pollutantemissions. Thus, controlling such pollution is an urgent task for environmental protection authorities.This study chooses industrial SO2 emission intensity, namely the ratio of SO2 emissions to GDP, andthe tax reform effect in improving the regional environment.
The sample of this study has the typical “treatment after pollution” characteristics. In March 2004,Premier Wen Jiabao proposed the “Rise of Central China” [? ], followed by a series of plans to stimulatethe central region’s economy, including Hubei Province. Correspondingly, Hubei Province experiencedrapid economic growth—its GDP grew at an average annual rate of 13.2% between 2004 and 2007. Wehave also found that Hubei Province’s GDP growth rate has been higher than the national averagefrom 2008 onwards.
With the rapid economic development, pollution has become more and more serious in centralChina. From 2004 to 2005, emissions of pollutants in Hubei Province rose despite a national trendof decline. In order to improve the environment, Hubei Province implemented the EFT reform in allthe subordinate cities. This spontaneous policy represents a clear endogeneity, and in this case, thesynthetic control method has the advantage over traditional DIDS method. Due to data availability,12 cities in Hubei Province are included into this research: Wuhan, Xiangyang, Ezhou, Jingzhou,Jingmen, Xianning, Xiaogan, Huangshi, Huanggang, Yichang, Suizhou and Shiyan. We define these12 cities as the target cities, and select 262 other cities outside Hubei Province as the control group.
Sustainability 2016, 8, 1124 9 of ??
Because October 2007 is the EFT reform’s starting point, the annual data before 2008 are used for thesynthesis control cities, and data from 2008 onwards are used for assessing the policy effect.
Predictive variables are good indicators for measuring the effect of fitting results [? ].
(a) Economic factors: Grossman and Krueger [? ] first discovered inverted U shape curve ofrelationship between the degree of environmental pollution and per capita GDP, during theresearch on the environmental effect of North American Free Trade Agreement, which was latercalled “Environmental Kuznets Curve” (EKC). Shen [? ] found that China’s SO2 emissions arealso in line with the characteristics of EKC. In this paper, we use per capita GDP to measureeconomic development level, recorded as GDP.
(b) Population factors: Urbanization promotes population concentration, which may lead to thescale effect of energy use and reduce pollution emissions [? ? ], while the increase of percapita emissions may appear in sparsely populated areas due to the reduction of environmentalregulations [? ]. In addition, Wang [? ] found that people with higher educational degrees to havea stronger awareness of environmental protection, and also to actively fight against pollution.This paper uses the population density, which is the ratio of population at the end of a yearand the area of the administrative area, to measure population concentration, and the educationpopulation ratio, which is the ratio of number of college students and population at the end of ayear, to measure education level. The two variables are recorded as population (pop, thereafter)and education (edu, thereafter) respectively.
(c) Factors of openness: In accordance with the principle of comparative advantage, the pollutionintensive industries will be transferred from developed countries to developing countries, orfrom countries with strong environmental regulations to control weak countries. This is calledPollution Haven Hypothesis [? ]. Research [? ? ] found that the opening up to foreign investmentand the trade openness [? ] are related to the SO2 pollution. This paper uses the ratio of foreignindustrial output and industrial output to measure the degree of economic openness, recordedas open.
(d) Administrative factors: Wang et al. [? ] pointed out that the Chinese enterprises have a strongbargaining power with local environmental protection agencies, resulting in environmentallegislation not being fully implemented. The will and enforcement of environmental protectionagencies have a great influence on the actual effects of policies. This paper uses the localfiscal dependence on industries, that is, the ratio of VAT payable of Industrial Enterprisesabove Designated Size and budgetary revenue for measurement, recorded as dependence(dep, thereafter).
(e) Technological factors: Progress of environmental protection technologies and R&D investmentwill directly improve the environmental protection effects. [? ] This paper uses the ratio ofexpenditure on science and technology to government’s budgeted expenditures for measurement,recorded as technologies (tech, thereafter).
(f) Industrial structure factors: EKC curve shows that environmental pollution is closely relatedto transformation of industrial structure [? ]. Industrialization in the early stage of economicdevelopment often leads to rapid increase of natural resources consumption and waste emissions.At later stages of development, the proportion of service industry normally increases, reducingthe dependence on the exploitation of resources and energy consumption. The environmentalpressure of industrial production is also reduced by technological and management innovation.In this paper, the environmental effect of industrial structure adjustment is measured by the ratioof second industry GDP to the tertiary industry GDP, recorded as second industry (seci, thereafter)and tertiary industry (teri, thereafter).

Sustainability 2016, 8, 1124 10 of ??
3.3. Enterprise Interview
In this paper, semi-structured in-depth interview method is adopted to conduct research on27 enterprises from 12 pilot cities of Hubei Province. The aim of interview is to understand the specificchanges with regard to the government’s management of enterprise pollution behavior, and learn whetherthe changes of regulatory actions can bring corresponding changes of enterprise emission strategy.
We mainly focus on studying EFT’s effect on enterprise pollution emissions, thus we select someenterprises with serious pollution emissions. The surveyed enterprises cover a plurality of pollutingindustries including thermal power, steel, chemical industry, etc. In addition, enterprises in differentscales have different pollution abatement strategies, meanwhile, the scale of enterprises will also affectthe degree of game between the enterprise and government, and therefore we survey enterprises inthe different scale. Enterprise scale is divided into large enterprises (listing corporation; the numberof employees is more than 2000), medium-sized enterprises (the number of employees is more than300 people) and small businesses (the number of employees is below 300). Respondents are mostlyadministrators from the enterprise’s governmental affairs department and the technical department.
4. Results
4.1. Constructing a Synthetic Version of City
In view of the differences in administrative enforcement and subjective initiative, this paperdoes not take the methods of the previous studies to mix all the pilot cities, but uses the method ofcity-by-city analysis by constructing the synthetic control city for each pilot city. Effect of EFT reform ismeasured by the difference in SO2 emission intensity between each pilot city and its synthetic controlcity. Taking Wuhan for example, this paper utilizes SO2 emission intensity and predictive controlvariable (per capita GDP, industrial structure, population density, etc.) from 2003 to 2007 to synthesizethe control city of Wuhan. The effect of EFT reform on Wuhan is measured with the difference in SO2
emission intensity after 2008. The principle of choosing the weight of cities is the minimum of themean square error of SO2 emission intensity before the EFT reform. Based on Equation (5), the weightof the synthetic control group of Wuhan can be calculated as shown in Table ??.
Table 2. Synthetic Weights for Wuhan.
City Weight
Xian 0.420Shanghai 0.132
Beijing 0.125Changsha 0.078Shantou 0.066Haikou 0.064Daqing 0.057
Xiangtan 0.021Jiayuguan 0.017
Benxi 0.012Jinzhou 0.010
Notes: The synthetic weight is the cities weight assigned in the synthetic control method. We list all the cities,which have positive weights for synthetic Wuhan, excluding 0-weights cities. Source: Authors’ computationSTATA12 by synthetic control program.
Table ?? compares the pre-reform features of Wuhan to the synthetic Wuhan, and to those of anaverage of the 262 cities in our donor pool. Results in Table ?? suggest that the synthetic Wuhan drawsa better comparison for Wuhan than the average of the sample of other cities. The synthetic Wuhan isvery similar to the real Wuhan for the pre-2008 period. In particular, SO2 emissions in 2003, 2005, and2007 of the synthetic of Wuhan all fit very well with that of real Wuhan.
Sustainability 2016, 8, 1124 11 of ??
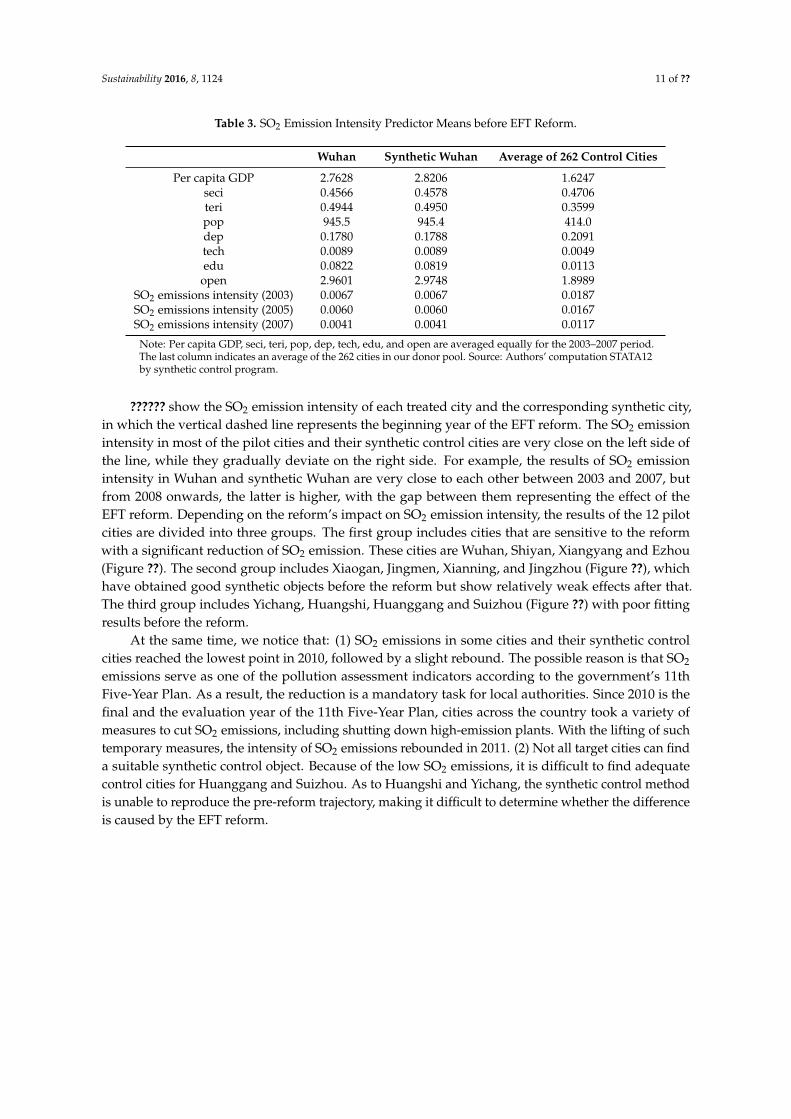
Table 3. SO2 Emission Intensity Predictor Means before EFT Reform.
Wuhan Synthetic Wuhan Average of 262 Control Cities
Per capita GDP 2.7628 2.8206 1.6247seci 0.4566 0.4578 0.4706teri 0.4944 0.4950 0.3599pop 945.5 945.4 414.0dep 0.1780 0.1788 0.2091tech 0.0089 0.0089 0.0049edu 0.0822 0.0819 0.0113
open 2.9601 2.9748 1.8989SO2 emissions intensity (2003) 0.0067 0.0067 0.0187SO2 emissions intensity (2005) 0.0060 0.0060 0.0167SO2 emissions intensity (2007) 0.0041 0.0041 0.0117
Note: Per capita GDP, seci, teri, pop, dep, tech, edu, and open are averaged equally for the 2003–2007 period.The last column indicates an average of the 262 cities in our donor pool. Source: Authors’ computation STATA12by synthetic control program.
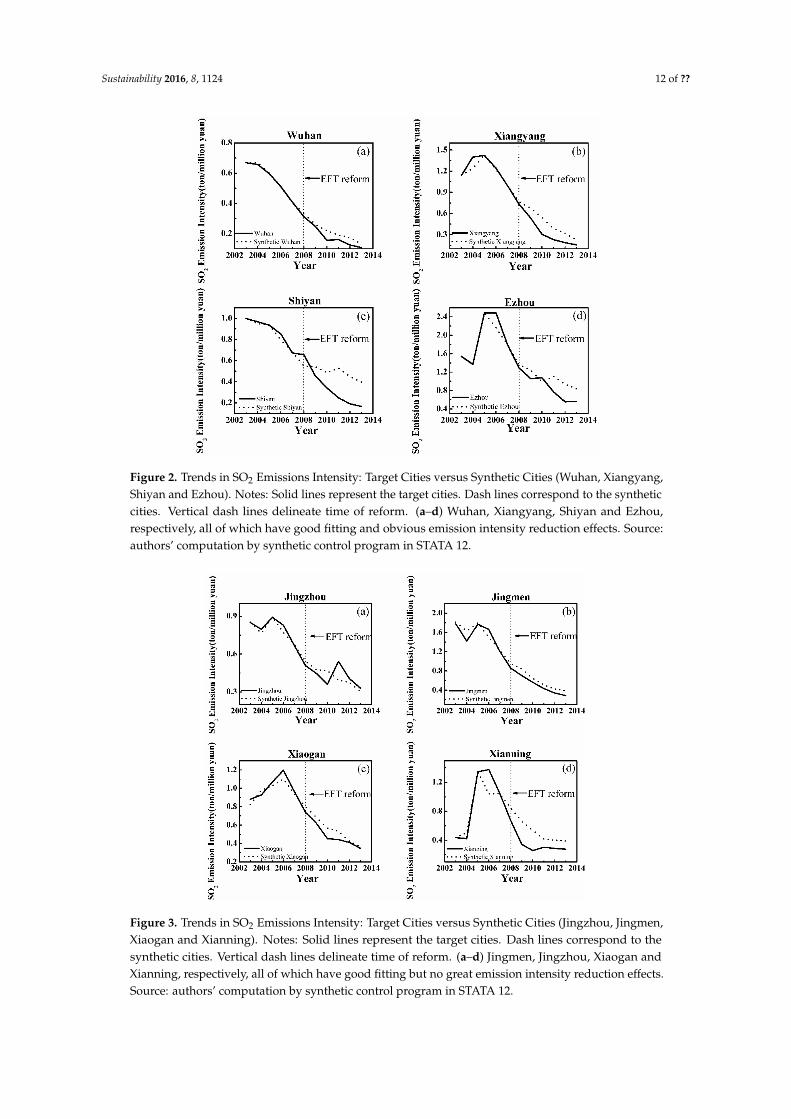
?????? show the SO2 emission intensity of each treated city and the corresponding synthetic city,in which the vertical dashed line represents the beginning year of the EFT reform. The SO2 emissionintensity in most of the pilot cities and their synthetic control cities are very close on the left side ofthe line, while they gradually deviate on the right side. For example, the results of SO2 emissionintensity in Wuhan and synthetic Wuhan are very close to each other between 2003 and 2007, butfrom 2008 onwards, the latter is higher, with the gap between them representing the effect of theEFT reform. Depending on the reform’s impact on SO2 emission intensity, the results of the 12 pilotcities are divided into three groups. The first group includes cities that are sensitive to the reformwith a significant reduction of SO2 emission. These cities are Wuhan, Shiyan, Xiangyang and Ezhou(Figure ??). The second group includes Xiaogan, Jingmen, Xianning, and Jingzhou (Figure ??), whichhave obtained good synthetic objects before the reform but show relatively weak effects after that.The third group includes Yichang, Huangshi, Huanggang and Suizhou (Figure ??) with poor fittingresults before the reform.
At the same time, we notice that: (1) SO2 emissions in some cities and their synthetic controlcities reached the lowest point in 2010, followed by a slight rebound. The possible reason is that SO2
emissions serve as one of the pollution assessment indicators according to the government’s 11thFive-Year Plan. As a result, the reduction is a mandatory task for local authorities. Since 2010 is thefinal and the evaluation year of the 11th Five-Year Plan, cities across the country took a variety ofmeasures to cut SO2 emissions, including shutting down high-emission plants. With the lifting of suchtemporary measures, the intensity of SO2 emissions rebounded in 2011. (2) Not all target cities can finda suitable synthetic control object. Because of the low SO2 emissions, it is difficult to find adequatecontrol cities for Huanggang and Suizhou. As to Huangshi and Yichang, the synthetic control methodis unable to reproduce the pre-reform trajectory, making it difficult to determine whether the differenceis caused by the EFT reform.
Sustainability 2016, 8, 1124 12 of ??
Sustainability 2016, 8, 1124 11 of 20
Figure 2. Trends in SO2 Emissions Intensity: Target Cities versus Synthetic Cities (Wuhan, Xiangyang, Shiyan and Ezhou). Notes: Solid lines represent the target cities. Dash lines correspond to the synthetic cities. Vertical dash lines delineate time of reform. (a–d) Wuhan, Xiangyang, Shiyan and Ezhou ,respectively, all of which have good fitting and obvious emission intensity reduction effects. Source: authors’ computation by synthetic control program in STATA 12.
Figure 3. Trends in SO2 Emissions Intensity: Target Cities versus Synthetic Cities (Jingzhou, Jingmen, Xiaogan and Xianning). Notes: Solid lines represent the target cities. Dash lines correspond to the synthetic cities. Vertical dash lines delineate time of reform. (a–d) Jingmen, Jingzhou, Xiaogan and Xianning, respectively, all of which have good fitting but no great emission intensity reduction effects. Source: authors’ computation by synthetic control program in STATA 12.
Figure 2. Trends in SO2 Emissions Intensity: Target Cities versus Synthetic Cities (Wuhan, Xiangyang,Shiyan and Ezhou). Notes: Solid lines represent the target cities. Dash lines correspond to the syntheticcities. Vertical dash lines delineate time of reform. (a–d) Wuhan, Xiangyang, Shiyan and Ezhou,respectively, all of which have good fitting and obvious emission intensity reduction effects. Source:authors’ computation by synthetic control program in STATA 12.
Sustainability 2016, 8, 1124 11 of 20
Figure 2. Trends in SO2 Emissions Intensity: Target Cities versus Synthetic Cities (Wuhan, Xiangyang, Shiyan and Ezhou). Notes: Solid lines represent the target cities. Dash lines correspond to the synthetic cities. Vertical dash lines delineate time of reform. (a–d) Wuhan, Xiangyang, Shiyan and Ezhou ,respectively, all of which have good fitting and obvious emission intensity reduction effects. Source: authors’ computation by synthetic control program in STATA 12.
Figure 3. Trends in SO2 Emissions Intensity: Target Cities versus Synthetic Cities (Jingzhou, Jingmen, Xiaogan and Xianning). Notes: Solid lines represent the target cities. Dash lines correspond to the synthetic cities. Vertical dash lines delineate time of reform. (a–d) Jingmen, Jingzhou, Xiaogan and Xianning, respectively, all of which have good fitting but no great emission intensity reduction effects. Source: authors’ computation by synthetic control program in STATA 12.
Figure 3. Trends in SO2 Emissions Intensity: Target Cities versus Synthetic Cities (Jingzhou, Jingmen,Xiaogan and Xianning). Notes: Solid lines represent the target cities. Dash lines correspond to thesynthetic cities. Vertical dash lines delineate time of reform. (a–d) Jingmen, Jingzhou, Xiaogan andXianning, respectively, all of which have good fitting but no great emission intensity reduction effects.Source: authors’ computation by synthetic control program in STATA 12.

Sustainability 2016, 8, 1124 13 of ??
Sustainability 2016, 8, 1124 12 of 20
Figure 4. Trends in SO2 Emissions Intensity: Target Cities versus Synthetic Cities (Yichang, Suizhou, Huanggang and Huangshi). Notes: Solid lines represent the target cities. Dash lines correspond to the synthetic cities. Vertical dash lines delineate time of reform. (a–d) Yichang, Suizhou, Huanggang and Huangshi, respectively, none of which has good fitting. Source: authors’ computation by synthetic control program in STATA 12.
The effect of the EFT reform is evaluated according to the decline in emission of the actual city compared to the synthetic city after the implementation of the policy. The average reductions of the emission intensity of SO2 in the treated cities from 2008 to 2013 are listed in Table 4. The average reduction is of 0.11 tons/million Yuan, with an average decline rate of 19.6%. SO2 emission intensity in Shiyan, Xiangyang and Xianning dropped more relative to the target cities in the past six years, with the average decline rate of over 30%.
Table 4. SO2 Emission intensity reduction of Target Cities, 2008–2013.
City Average Reduction(Ton/Million Yuan) Average Decline Rate (%)
Wuhan 0.0329 16.82 Xiangyang 0.1280 30.21
Ezhou 0.1936 19.16 Shiyan 0.1490 32.42
Xianning 0.1857 34.34 Jingzhou −0.0051 −3.04 Xiaogan 0.0604 10.37 Jingmen 0.0963 16.68
4.2. Placebo Studies
To estimate the reliability and validity of the results, and to identify the effect of EFT reform on the reduction of SO2 emissions, we perform placebo studies as in [31], where the particular treatment of interest is reassigned in the research data to cities different from pilot cities. Thus, we can acquire synthetic control estimates for cities that did not implement the reform. Applying the idea to each
Figure 4. Trends in SO2 Emissions Intensity: Target Cities versus Synthetic Cities (Yichang, Suizhou,Huanggang and Huangshi). Notes: Solid lines represent the target cities. Dash lines correspond tothe synthetic cities. Vertical dash lines delineate time of reform. (a–d) Yichang, Suizhou, Huanggangand Huangshi, respectively, none of which has good fitting. Source: authors’ computation by syntheticcontrol program in STATA 12.
The effect of the EFT reform is evaluated according to the decline in emission of the actual citycompared to the synthetic city after the implementation of the policy. The average reductions of theemission intensity of SO2 in the treated cities from 2008 to 2013 are listed in Table ??. The averagereduction is of 0.11 tons/million Yuan, with an average decline rate of 19.6%. SO2 emission intensity inShiyan, Xiangyang and Xianning dropped more relative to the target cities in the past six years, withthe average decline rate of over 30%.
Table 4. SO2 Emission intensity reduction of Target Cities, 2008–2013.
City Average Reduction(Ton/Million Yuan) Average Decline Rate (%)
Wuhan 0.0329 16.82Xiangyang 0.1280 30.21
Ezhou 0.1936 19.16Shiyan 0.1490 32.42
Xianning 0.1857 34.34Jingzhou −0.0051 −3.04Xiaogan 0.0604 10.37Jingmen 0.0963 16.68
4.2. Placebo Studies
To estimate the reliability and validity of the results, and to identify the effect of EFT reform onthe reduction of SO2 emissions, we perform placebo studies as in [? ], where the particular treatmentof interest is reassigned in the research data to cities different from pilot cities. Thus, we can acquiresynthetic control estimates for cities that did not implement the reform. Applying the idea to each cityin the donor pool enables us to compare the assessed effects of the EFT reform on the treatment cities,

Sustainability 2016, 8, 1124 14 of ??
to the particular distribution of placebo effects obtained from other cities. We will define the effects ofthe EFT reform significant if the assessed impact on treatment cities is unusually highly related to theparticular distribution of placebo effects.
The Root Mean Square Prediction Error (RMSPE, thereafter) [? ] estimates the actual magnitudeof the gap in the primary outcome variable of interest between each city and its equivalent syntheticcounterpart. Figure ?? indicates ratio distributions of post-reform RMSPE, the specific equation suchas Equation (9), to pre-reform RMSPE, the specific equation such as Equation (10), for the treatmentunits and for the cities in the donor pool.
Post− reform RMSPE =
1T1
∑Tt=T0+1
(Yit −
k+1
∑k=2
w∗k Ykt
)2 1
2
(9)
Pre− reform RMSPE =
1T0
∑T0t=1
(Yit −
k+1
∑k=2
w∗k Ykt
)2 1
2
(10)
where T is the total periods number; T0 is the number of pre-reform periods; T1 is the number ofpost-reform periods, so T0 + T1 = T; and Yit −∑k+1
k=2 w∗k Ykt is the representation of α̂1t (see Equation (5)).A large numeric post-intervention RMSPE is not indicative of a large main effect of the particular
intervention, as if the synthetic control does not rather closely reproduce the primary outcome ofinterest prior to the particular intervention [? ]. In other words, a large numeric post-reform RMSPEis not generally indicative of a large main effect of the reform if the pre-period RMSPE is also ratherlarge. As for each city, we simply divide the post-reform RMSPE by its pre-reform RMSPE. In Figure ??,Wuhan obviously stands out as the city with the largest RMSPE ratio. For Wuhan, the post-reform gapis about 3.76 times bigger than the pre-reform gap, which means that the reduction in SO2 emissions isindeed indicative of the effects of EFT reform.
Results indicate that RMSPE rates of four cities, Wuhan, Xiangyang, Ezhou and Shiyan, aremeasurably higher than others, which means the EFT reform effects are more workable in thesefour cities.
Sustainability 2016, 8, 1124 13 of 20
city in the donor pool enables us to compare the assessed effects of the EFT reform on the treatment cities, to the particular distribution of placebo effects obtained from other cities. We will define the effects of the EFT reform significant if the assessed impact on treatment cities is unusually highly related to the particular distribution of placebo effects.
The Root Mean Square Prediction Error (RMSPE, thereafter) [31] estimates the actual magnitude of the gap in the primary outcome variable of interest between each city and its equivalent synthetic counterpart. Figure 5 indicates ratio distributions of post-reform RMSPE, the specific equation such as Equation (9), to pre-reform RMSPE, the specific equation such as Equation (10), for the treatment units and for the cities in the donor pool.
Post − reformRMSPE = 1 − ∗ (9)
Pre − reformRMSPE = 1 − ∗ (10)
where T is the total periods number; T0 is the number of pre-reform periods; T1 is the number of post-reform periods, so T0 + T1 = T; and − ∑ ∗ is the representation of (see Equation (5)).
A large numeric post-intervention RMSPE is not indicative of a large main effect of the particular intervention, as if the synthetic control does not rather closely reproduce the primary outcome of interest prior to the particular intervention [31]. In other words, a large numeric post-reform RMSPE is not generally indicative of a large main effect of the reform if the pre-period RMSPE is also rather large. As for each city, we simply divide the post-reform RMSPE by its pre-reform RMSPE. In Figure 5, Wuhan obviously stands out as the city with the largest RMSPE ratio. For Wuhan, the post-reform gap is about 3.76 times bigger than the pre-reform gap, which means that the reduction in SO2 emissions is indeed indicative of the effects of EFT reform.
Results indicate that RMSPE rates of four cities, Wuhan, Xiangyang, Ezhou and Shiyan, are measurably higher than others, which means the EFT reform effects are more workable in these four cities.
Figure 5. Ratio Distributions of Post-reform RMSPE to Pre-reform RMSPE: Target Cities and Control Cities. Notes: We remove bad fitting placebo results whose Pre-reform RMSPE exceeds three times the overall RMSPE, and the rest of results are made into a frequency histogram, in which a gray bar represents target cities falling in that interval. Source: authors’ computation by synthetic control program in STATA 12.
Figure 5. Ratio Distributions of Post-reform RMSPE to Pre-reform RMSPE: Target Cities and ControlCities. Notes: We remove bad fitting placebo results whose Pre-reform RMSPE exceeds three timesthe overall RMSPE, and the rest of results are made into a frequency histogram, in which a gray barrepresents target cities falling in that interval. Source: authors’ computation by synthetic controlprogram in STATA 12.
Sustainability 2016, 8, 1124 15 of ??
4.3. Robustness Evaluation
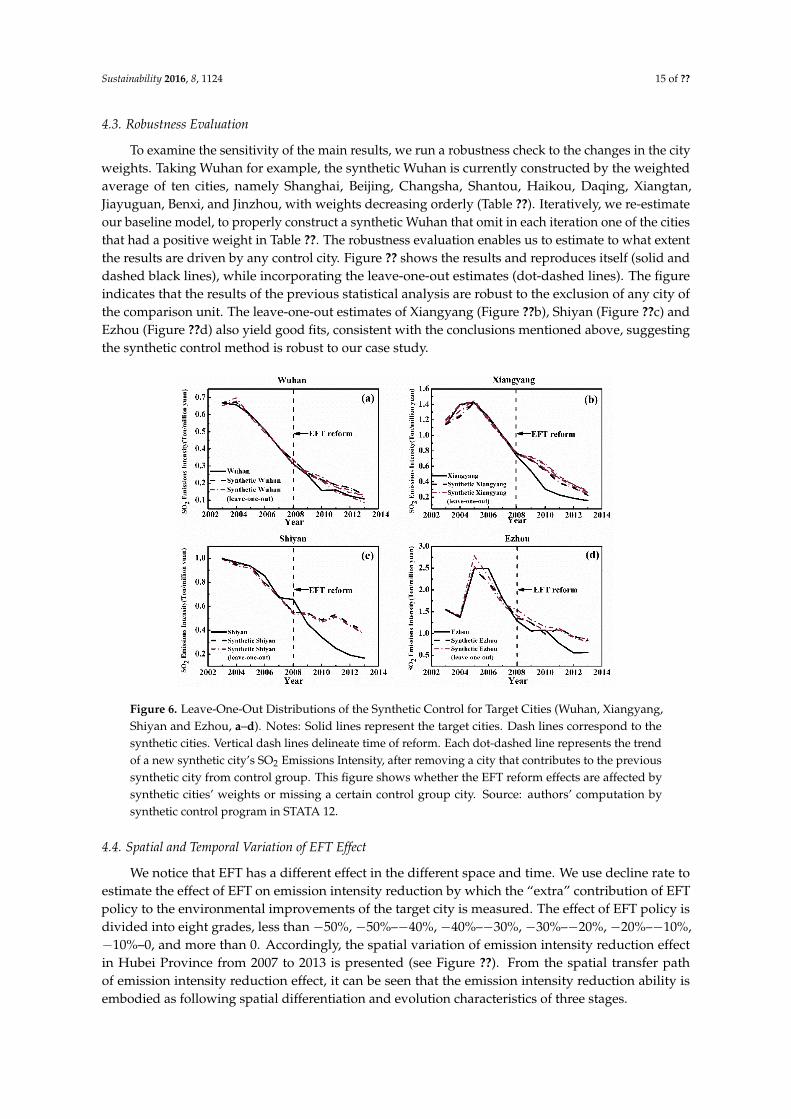
To examine the sensitivity of the main results, we run a robustness check to the changes in the cityweights. Taking Wuhan for example, the synthetic Wuhan is currently constructed by the weightedaverage of ten cities, namely Shanghai, Beijing, Changsha, Shantou, Haikou, Daqing, Xiangtan,Jiayuguan, Benxi, and Jinzhou, with weights decreasing orderly (Table ??). Iteratively, we re-estimateour baseline model, to properly construct a synthetic Wuhan that omit in each iteration one of the citiesthat had a positive weight in Table ??. The robustness evaluation enables us to estimate to what extentthe results are driven by any control city. Figure ?? shows the results and reproduces itself (solid anddashed black lines), while incorporating the leave-one-out estimates (dot-dashed lines). The figureindicates that the results of the previous statistical analysis are robust to the exclusion of any city ofthe comparison unit. The leave-one-out estimates of Xiangyang (Figure ??b), Shiyan (Figure ??c) andEzhou (Figure ??d) also yield good fits, consistent with the conclusions mentioned above, suggestingthe synthetic control method is robust to our case study.
Sustainability 2016, 8, 1124 14 of 20
4.3. Robustness Evaluation
To examine the sensitivity of the main results, we run a robustness check to the changes in the city weights. Taking Wuhan for example, the synthetic Wuhan is currently constructed by the weighted average of ten cities, namely Shanghai, Beijing, Changsha, Shantou, Haikou, Daqing, Xiangtan, Jiayuguan, Benxi, and Jinzhou, with weights decreasing orderly (Table 3). Iteratively, we re-estimate our baseline model, to properly construct a synthetic Wuhan that omit in each iteration one of the cities that had a positive weight in Table 2. The robustness evaluation enables us to estimate to what extent the results are driven by any control city. Figure 6 shows the results and reproduces itself (solid and dashed black lines), while incorporating the leave-one-out estimates (dot-dashed lines). The figure indicates that the results of the previous statistical analysis are robust to the exclusion of any city of the comparison unit. The leave-one-out estimates of Xiangyang (Figure 6b), Shiyan (Figure 6c) and Ezhou (Figure 6d) also yield good fits, consistent with the conclusions mentioned above, suggesting the synthetic control method is robust to our case study.
Figure 6. Leave-One-Out Distributions of the Synthetic Control for Target Cities (Wuhan, Xiangyang, Shiyan and Ezhou, a–d). Notes: Solid lines represent the target cities. Dash lines correspond to the synthetic cities. Vertical dash lines delineate time of reform. Each dot-dashed line represents the trend of a new synthetic city’s SO2 Emissions Intensity, after removing a city that contributes to the previous synthetic city from control group. This figure shows whether the EFT reform effects are affected by synthetic cities’ weights or missing a certain control group city. Source: authors’ computation by synthetic control program in STATA 12.
4.4. Spatial and Temporal Variation of EFT Effect
We notice that EFT has a different effect in the different space and time. We use decline rate to estimate the effect of EFT on emission intensity reduction by which the “extra” contribution of EFT policy to the environmental improvements of the target city is measured. The effect of EFT policy is divided into eight grades, less than −50%, −50%–−40%, −40%–−30%, −30%–−20%, −20%–−10%, −10%–0, and more than 0. Accordingly, the spatial variation of emission intensity reduction effect in Hubei Province from 2007 to 2013 is presented (see Figure 7). From the spatial transfer path of emission intensity reduction effect, it can be seen that the emission intensity reduction ability is embodied as following spatial differentiation and evolution characteristics of three stages.
Figure 6. Leave-One-Out Distributions of the Synthetic Control for Target Cities (Wuhan, Xiangyang,Shiyan and Ezhou, a–d). Notes: Solid lines represent the target cities. Dash lines correspond to thesynthetic cities. Vertical dash lines delineate time of reform. Each dot-dashed line represents the trendof a new synthetic city’s SO2 Emissions Intensity, after removing a city that contributes to the previoussynthetic city from control group. This figure shows whether the EFT reform effects are affected bysynthetic cities’ weights or missing a certain control group city. Source: authors’ computation bysynthetic control program in STATA 12.
4.4. Spatial and Temporal Variation of EFT Effect
We notice that EFT has a different effect in the different space and time. We use decline rate toestimate the effect of EFT on emission intensity reduction by which the “extra” contribution of EFTpolicy to the environmental improvements of the target city is measured. The effect of EFT policy isdivided into eight grades, less than −50%, −50%–−40%, −40%–−30%, −30%–−20%, −20%–−10%,−10%–0, and more than 0. Accordingly, the spatial variation of emission intensity reduction effectin Hubei Province from 2007 to 2013 is presented (see Figure ??). From the spatial transfer pathof emission intensity reduction effect, it can be seen that the emission intensity reduction ability isembodied as following spatial differentiation and evolution characteristics of three stages.

Sustainability 2016, 8, 1124 16 of ??
Sustainability 2016, 8, 1124 15 of 20
Figure 7. Temporal and spatial changes of the intensity rise of SO2 emission intensity reductions in Hubei Province during 2007–2013.
Start-up Phase (2007–2009): Hubei Province’s EFT had an effect on enhancing the capacity of emission intensity reductions; this shows characteristics of diffusion from the Wuhan metropolitan circle and Western Hubei region. Since 2007, EFT policy started in Hubei Province, the emission intensity reduction effect of pilot cities and synthetic control is close to 0. In 2008 Wuhan metropolitan circle and Western Hubei region took on significant governance effect, among them, the emission intensity of Xianning reached −20.9%, and the emission intensity of Shiyan reached to −19.5%. In 2009, Xianning further enhanced to −48.2%, and the emission intensity difference of Xiangyang located in Western Hubei region also reached −20.2%.
Mature Stage (2010–2012): Since 2010, the effect of EFT on pollution emission intensity reductions in the most of pilot cities in Hubei Province has been significantly improved, and Wuhan metropolitan circle and Western Hubei region have showed “double” spatial agglomeration effect and obvious regional spillover effect. The emission intensity reduction strength of Wuhan and Xiangyang, the two major urban centers in Hubei Province, reached −28.7% and −43.9%. Xiaogan in Wuhan metropolitan circle, and Shiyan and Jingzhou in Western Hubei region reached −52%, −30% and −23%, respectively, and Xianning in Wuhan metropolitan circle even reached −52%. Hence, we
Figure 7. Temporal and spatial changes of the intensity rise of SO2 emission intensity reductions inHubei Province during 2007–2013.
Start-up Phase (2007–2009): Hubei Province’s EFT had an effect on enhancing the capacity ofemission intensity reductions; this shows characteristics of diffusion from the Wuhan metropolitancircle and Western Hubei region. Since 2007, EFT policy started in Hubei Province, the emissionintensity reduction effect of pilot cities and synthetic control is close to 0. In 2008 Wuhan metropolitancircle and Western Hubei region took on significant governance effect, among them, the emissionintensity of Xianning reached−20.9%, and the emission intensity of Shiyan reached to−19.5%. In 2009,Xianning further enhanced to −48.2%, and the emission intensity difference of Xiangyang located inWestern Hubei region also reached −20.2%.
Mature Stage (2010–2012): Since 2010, the effect of EFT on pollution emission intensity reductionsin the most of pilot cities in Hubei Province has been significantly improved, and Wuhan metropolitancircle and Western Hubei region have showed “double” spatial agglomeration effect and obviousregional spillover effect. The emission intensity reduction strength of Wuhan and Xiangyang, the twomajor urban centers in Hubei Province, reached −28.7% and −43.9%. Xiaogan in Wuhan metropolitancircle, and Shiyan and Jingzhou in Western Hubei region reached−52%,−30% and−23%, respectively,and Xianning in Wuhan metropolitan circle even reached −52%. Hence, we can draw the conclusion
Sustainability 2016, 8, 1124 17 of ??
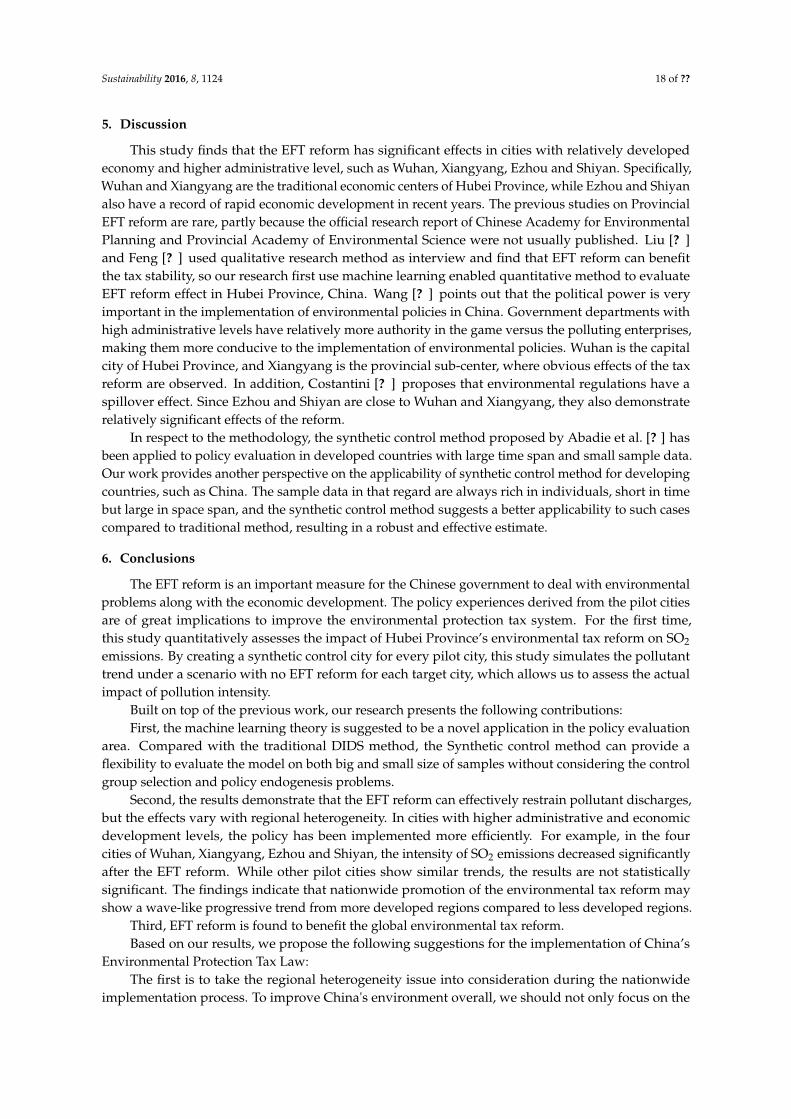
that, after EFT policy has been implemented for 2–3 years, its effect on regional environmentalgovernance is generally substantively improved. During 2011 and 2012, the effect of emission intensityreduction policy continued to enlarge, and Western Hubei region became a center of emission intensityreductions instead of Wuhan metropolitan circle. Xiangyang continued to maintain a high ratio of−40%, and moreover Shiyan in Western Hubei region even reached −53% and −57.4%, a high ratioof “extra” effect, correspondingly, only Ezhou in the Wuhan metropolitan circle reached −30.7% and−40.8%, and Xianning reached −27.2% and −28.6%, respectively.
Continuous Phase (2013): After a rapid increase of 2010–2012 pollution emission intensityreductions, the effect of reductions in the pilot cities of Hubei Province began to enter the stationaryphase. In 2013, Xiangyang, the center city in Western Hubei region, remained a high level of −30%,Shiyan continued to maintain an extremely high “extra” effect of −57.8%, and Jingmen and Xianningin Wuhan metropolitan circle reached a high level of −26.6% and −29.2%, respectively. For the rest ofcities, the effect of reductions kept balanced or declined slightly; this shows those cities have sustainedsubstantial emission intensity reduction effect compared with synthetic control cities without theimplementation of EFT.
4.5. Results of Enterprise Interview
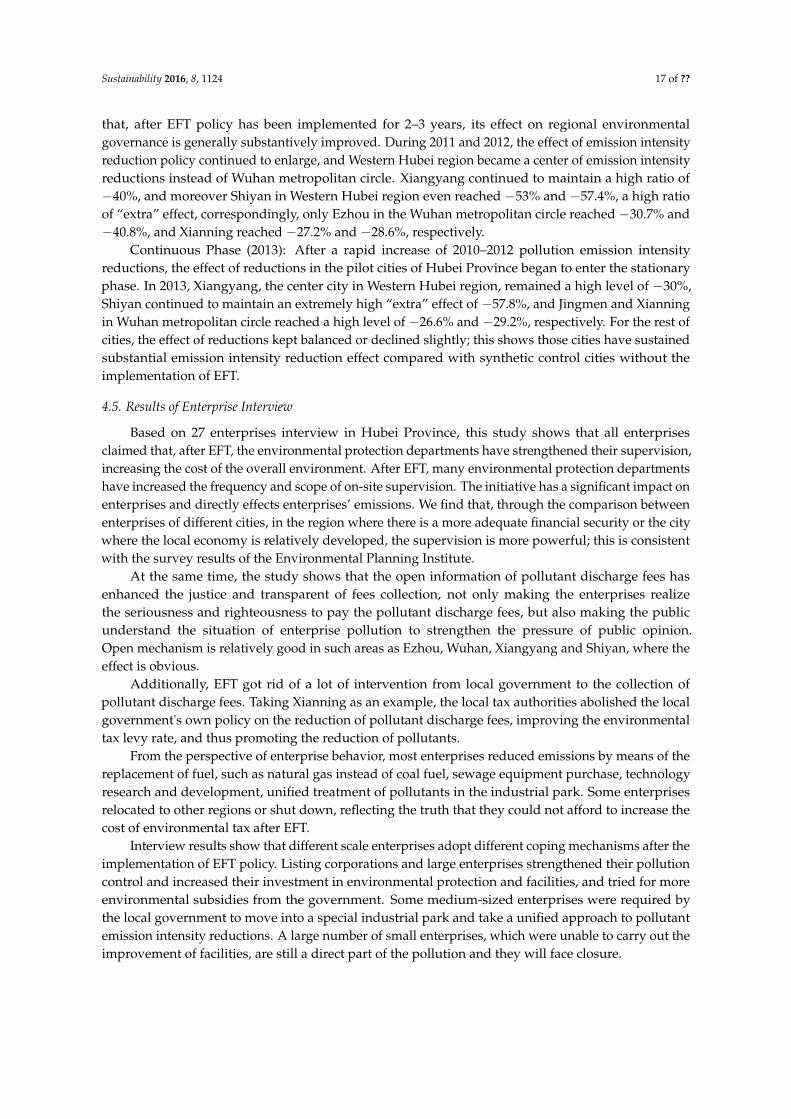
Based on 27 enterprises interview in Hubei Province, this study shows that all enterprisesclaimed that, after EFT, the environmental protection departments have strengthened their supervision,increasing the cost of the overall environment. After EFT, many environmental protection departmentshave increased the frequency and scope of on-site supervision. The initiative has a significant impact onenterprises and directly effects enterprises’ emissions. We find that, through the comparison betweenenterprises of different cities, in the region where there is a more adequate financial security or the citywhere the local economy is relatively developed, the supervision is more powerful; this is consistentwith the survey results of the Environmental Planning Institute.
At the same time, the study shows that the open information of pollutant discharge fees hasenhanced the justice and transparent of fees collection, not only making the enterprises realizethe seriousness and righteousness to pay the pollutant discharge fees, but also making the publicunderstand the situation of enterprise pollution to strengthen the pressure of public opinion.Open mechanism is relatively good in such areas as Ezhou, Wuhan, Xiangyang and Shiyan, where theeffect is obvious.
Additionally, EFT got rid of a lot of intervention from local government to the collection ofpollutant discharge fees. Taking Xianning as an example, the local tax authorities abolished the localgovernment's own policy on the reduction of pollutant discharge fees, improving the environmentaltax levy rate, and thus promoting the reduction of pollutants.
From the perspective of enterprise behavior, most enterprises reduced emissions by means of thereplacement of fuel, such as natural gas instead of coal fuel, sewage equipment purchase, technologyresearch and development, unified treatment of pollutants in the industrial park. Some enterprisesrelocated to other regions or shut down, reflecting the truth that they could not afford to increase thecost of environmental tax after EFT.
Interview results show that different scale enterprises adopt different coping mechanisms after theimplementation of EFT policy. Listing corporations and large enterprises strengthened their pollutioncontrol and increased their investment in environmental protection and facilities, and tried for moreenvironmental subsidies from the government. Some medium-sized enterprises were required bythe local government to move into a special industrial park and take a unified approach to pollutantemission intensity reductions. A large number of small enterprises, which were unable to carry out theimprovement of facilities, are still a direct part of the pollution and they will face closure.
Sustainability 2016, 8, 1124 18 of ??
5. Discussion
This study finds that the EFT reform has significant effects in cities with relatively developedeconomy and higher administrative level, such as Wuhan, Xiangyang, Ezhou and Shiyan. Specifically,Wuhan and Xiangyang are the traditional economic centers of Hubei Province, while Ezhou and Shiyanalso have a record of rapid economic development in recent years. The previous studies on ProvincialEFT reform are rare, partly because the official research report of Chinese Academy for EnvironmentalPlanning and Provincial Academy of Environmental Science were not usually published. Liu [? ]and Feng [? ] used qualitative research method as interview and find that EFT reform can benefitthe tax stability, so our research first use machine learning enabled quantitative method to evaluateEFT reform effect in Hubei Province, China. Wang [? ] points out that the political power is veryimportant in the implementation of environmental policies in China. Government departments withhigh administrative levels have relatively more authority in the game versus the polluting enterprises,making them more conducive to the implementation of environmental policies. Wuhan is the capitalcity of Hubei Province, and Xiangyang is the provincial sub-center, where obvious effects of the taxreform are observed. In addition, Costantini [? ] proposes that environmental regulations have aspillover effect. Since Ezhou and Shiyan are close to Wuhan and Xiangyang, they also demonstraterelatively significant effects of the reform.
In respect to the methodology, the synthetic control method proposed by Abadie et al. [? ] hasbeen applied to policy evaluation in developed countries with large time span and small sample data.Our work provides another perspective on the applicability of synthetic control method for developingcountries, such as China. The sample data in that regard are always rich in individuals, short in timebut large in space span, and the synthetic control method suggests a better applicability to such casescompared to traditional method, resulting in a robust and effective estimate.
6. Conclusions
The EFT reform is an important measure for the Chinese government to deal with environmentalproblems along with the economic development. The policy experiences derived from the pilot citiesare of great implications to improve the environmental protection tax system. For the first time,this study quantitatively assesses the impact of Hubei Province’s environmental tax reform on SO2
emissions. By creating a synthetic control city for every pilot city, this study simulates the pollutanttrend under a scenario with no EFT reform for each target city, which allows us to assess the actualimpact of pollution intensity.
Built on top of the previous work, our research presents the following contributions:First, the machine learning theory is suggested to be a novel application in the policy evaluation
area. Compared with the traditional DIDS method, the Synthetic control method can provide aflexibility to evaluate the model on both big and small size of samples without considering the controlgroup selection and policy endogenesis problems.
Second, the results demonstrate that the EFT reform can effectively restrain pollutant discharges,but the effects vary with regional heterogeneity. In cities with higher administrative and economicdevelopment levels, the policy has been implemented more efficiently. For example, in the fourcities of Wuhan, Xiangyang, Ezhou and Shiyan, the intensity of SO2 emissions decreased significantlyafter the EFT reform. While other pilot cities show similar trends, the results are not statisticallysignificant. The findings indicate that nationwide promotion of the environmental tax reform mayshow a wave-like progressive trend from more developed regions compared to less developed regions.
Third, EFT reform is found to benefit the global environmental tax reform.Based on our results, we propose the following suggestions for the implementation of China’s
Environmental Protection Tax Law:The first is to take the regional heterogeneity issue into consideration during the nationwide
implementation process. To improve China's environment overall, we should not only focus on the
Sustainability 2016, 8, 1124 19 of ??
environmental policies implementation in more developed cities, but also improve the administrativecapacity and incentives of the environmental protection agencies in underdeveloped areas.
The second is to enhance information openness and promote public participation. The cooperationamong different departments is necessary. In addition, the pollution fee of different companies can bepublished by the media and Internet to draw public attention in monitoring environment pollution.
The third is to improve and optimize the environment monitoring system and build informationsharing platform. The automatic online monitoring system, which is currently only available in bigcities, should also be expanded to small cities to improve its spatial coverage and information sharing.
Acknowledgments: Project supported by National Natural Science Foundation of Chinese “Benefit Transferfor Wetland Ecosystem Services Based on Meta-analysis and GIS: Valuing the Influence of Climate Change onWetlands (41271527), the Social Sciences Research Program under the Ministry of Education (11YJC790300), BeijingSocial Sciences Research Program (13CSB007), Project supported by Peking University-Lincoln Institute Centerfor Urban Development and Land Policy.
Author Contributions: Yinger Zheng, Haixia Zheng and Xinyue Ye co-designed and performed research.Yinger Zheng interviewed enterprise, interpreted the data, wrote the draft paper and revised it until its finalversion. Haixia Zheng contributed research ideas and revised the paper. All authors read and approved thefinal manuscript.
Conflicts of Interest: The authors declare no conflict of interest.
References
1. Zhang, S. Environmental Tax: Arrows on the String with Right Target?—A Discussion on Some Key Issuesfor Environmental Taxation Policy in China. Environ. Prot. 2015, 43, 31–35.
2. Ge, C.; Gao, S.; Ren, Y.; Sun, G.; Long, F. Study on the design of wastewater environmental tax in China: Fromwastewater pollutant discharge fee to environmental tax. In Environmental Taxation in China and Asia-Pacific:Achieving Environmental Sustainability through Fiscal Policy; Edward Elgar: Cheltenham, UK, 2011.
3. Brys, B.; Matthews, S.; Herd, R.; Wang, X. Tax Policy and Tax Reform in the People's Republic of China; OECDPublishing: Paris, France, 2013.
4. Brys, B.; Matthews, S.; Owens, J. Tax Reform Trends in OECD Countries; OECD Publishing: Paris, France, 2011.5. Hoerner, J.; Bosquet, B. Environmental Tax Reform: The European Experience; Center for a Sustainable Economy:
Washington, DC, USA, 2001.6. Ekins, P.; Speck, S. Environmental Tax Reform (ETR); Oxford University Press: Oxford, UK, 2011.7. Withana, S.; Brink, P.; Illes, A.; Nanni, S.; Watkins, E. Environmental tax reform in Europe: Opportunities for
the future final report. J. Environ. Econ. Manag. 2005, 49, 174–196.8. Harrison, K. A tale of two taxes: The fate of environmental tax reform in Canada. Rev. Policy Res. 2012, 29,
383–407. [CrossRef]9. Seung-Joon, P.; Ogawa, Y.; Kawakatsu, T.; Pollitt, H. The double dividend of an environmental tax reform
in East Asian economies. In Low-Carbon, Sustainable Future in East Asia: Improving Energy Systems; Lee, S.,Pollitt, H., Park, S., Eds.; Taxation and Policy Cooperation: London, UK, 2009.
10. Ciaschini, M.; Pretaroli, R.; Severini, F.; Socci, C. Regional double dividend from environmental tax reform:An application for the Italian economy. Res. Econ. 2012, 66, 273–283. [CrossRef]
11. Parry, I.; Norregaard, J.; Heine, D. Environmental tax reform: Principles from theory and practice. Annu. Rev.Resour. Econ. 2012, 4, 101–125. [CrossRef]
12. Ekins, P.; Pollitt, H.; Barton, J.; Blobel, D. The implications for households of environmental tax reform (ETR)in Europe. Ecol. Econ. 2011, 70, 2472–2485. [CrossRef]
13. Ekins, P.; Summerton, P.; Thoung, C.; Lee, D. A major environmental tax reform for the UK: Results for theeconomy, employment and the environment. Environ. Resour. Econ. 2011, 50, 447–474. [CrossRef]
14. Ekins, P.; Pollitt, H.; Summerton, P.; Chewpreecha, U. Increasing carbon and material productivity throughenvironmental tax reform. Energy Policy 2012, 42, 365–376. [CrossRef]
15. Barker, T.; Junankar, S.; Pollitt, H.; Summerton, P. The macroeconomic effects of unilateral environmental taxreforms in Europe, 1995–2012. In Critical Issues in Environmental Taxation 1995–2005; Oxford University Press:Oxford, UK, 2009.

Sustainability 2016, 8, 1124 20 of ??
16. Lutz, C.; Meyer, B. Environmental and economic effects of post-Kyoto carbon regimes: Results of simulationswith the global model GINFORS. Energy Policy 2009, 37, 1758–1766. [CrossRef]
17. Barker, T.; Junankar, S.; Pollitt, H.; Summerton, P. The effects of environmental tax reform on internationalcompetitiveness in the European Union: Modelling with E3ME. In Carbon-Energy Taxation: Lessons fromEurope; Andersen, M., Ekins, P., Eds.; Oxford University Press: Oxford, UK, 2009.
18. Dasgupta, S.; Huq, M.; Wheeler, D.; Zhang, C. Water pollution abatement by Chinese industry: Cost estimatesand policy implications. Appl. Econ. 2001, 33, 547–557. [CrossRef]
19. Wang, H.; Wheeler, D. Pricing Industrial Pollution in China: An Econometric Analysis of the Levy System;World Bank Publications: Washington, DC, USA, 1996.
20. Wang, H.; Wheeler, D. Endogenous Enforcement and Effectiveness of China’s Pollution Levy System; World BankPublications: Washington, DC, USA, 2000.
21. Wang, H.; Wheeler, D. Financial incentives and endogenous enforcement in China’s pollution levy system.J. Environ. Econ. Manag. 2005, 49, 174–196. [CrossRef]
22. Chen, S. Marginal abatement cost and environmental tax reform in China. Soc. Sci. China 2011, 3, 6–15.[CrossRef]
23. Tong, J.; Zhu, B. A Study on “Environmental Dividend” as the Primary Objective in Environmental TaxReform in China. Int. Tax. China 2011, 8, 11–21.
24. Xiao, B.; Niu, D.; Guo, X.; Xu, X. The Impacts of Environmental Tax in China: A Dynamic RecursiveMulti-Sector CGE Model. Energies 2015, 8, 7777–7804. [CrossRef]
25. Liang, Q.; Yao, Y.; Zhao, L.; Yao, Y.; Wang, C.; Yang, R.; Wei, Y. Platform for China Energy and EnvironmentalPolicy Analysis: A general design and its application. Environ. Model. Softw. 2014, 51, 195–206. [CrossRef]
26. Blanchard, O.; Kahn, C. The Solution of Linear Difference Models under Rational Expectations. Econometrica1980, 48, 1305–1311. [CrossRef]
27. Puhani, P. The treatment effect, the cross difference, and the interaction term in nonlinear“difference-in-differences” models. Econ. Lett. 2012, 115, 85–87. [CrossRef]
28. Abadie, A.; Diamond, A.; Hainmueller, J. Synthetic Control Methods for Comparative Case Studies:Estimating the Effect of California’s Tobacco Control Program. J. Am. Stat. Assoc. 2010, 105, 493–505.[CrossRef]
29. Abadie, A.; Gardeazabal, J. The Economic Costs of Conflict: A Case Study of the Basque Country.Am. Econ. Rev. 2003, 93, 113–132. [CrossRef]
30. Abadie, A.; Diamond, A.; Hainmueller, J. Synth: An r package for synthetic control methods in comparativecase studies. J. Stat. Softw. 2011, 42, 1–17. [CrossRef]
31. Abadie, A.; Diamond, A.; Hainmueller, J. Comparative Politics and the Synthetic Control Method. Am. J.Polit. Sci. 2015, 59, 495–510. [CrossRef]
32. Saunders, J.; Lundberg, R.; Braga, A.; Ridgeway, G.; Miles, J. A Synthetic Control Approach to EvaluatingPlace-Based Crime Interventions. J. Quant. Criminol. 2014, 31, 1–22. [CrossRef]
33. Sills, E.; Herrera, D.; Kirkpatrick, A.; Brandão, A.; Dickson, R.; Hall, S.; Pattanayak, S.; Shoch, D.;Vedoveto, M.; Young, L.; et al. Estimating the Impacts of Local Policy Innovation: The Synthetic ControlMethod Applied to Tropical Deforestation. PLoS ONE 2015, 10, e0132590. [CrossRef] [PubMed]
34. Ando, M. Dreams of urbanization: Quantitative case studies on the local impacts of nuclear power facilitiesusing the synthetic control method. J. Urban Econ. 2015, 85, 68–85. [CrossRef]
35. Zhang, J.; Zhong, C.; Yi, M. Did Olympic Games improve air quality in Beijing? Based on the syntheticcontrol method. Environ. Econ. Policy Stud. 2015, 18, 21–39. [CrossRef]
36. Sra, S.; Nowozin, S.; Wright, S.J. Optimization for Machine Learning; Mit Press: Cambridge, UK, 2012.37. National Bureau of Statistics of China. China City Statistical Yearbook; Chinese Statistics Press: Beijing,
China, 2014.38. China Environment Yearbook Editing Committee. China Environment Yearbook; China Environment Yearbook
Press: Beijing, China, 2014.39. Peng, Y.; Cui, J.; Cao, Y. Impact of Manufacturing Transfer on SO2 Emissions in Jiangsu Province, China.
Atmosphere 2016, 7, 69. [CrossRef]40. Lehoczki, Z.; Sleszynski, J. Sulphur Dioxide Emission Charge in Poland. In Economic Instruments for
Environmental Management: A Worldwide Compendium of Case Studies; Routledge: London, UK, 2014.
Sustainability 2016, 8, 1124 21 of ??
41. Nam, K.; Waugh, C.; Paltsev, S.; Reilly, J.; Karplus, V. Synergy between pollution and carbon emissionscontrol: Comparing China and the United States. Energy Econ. 2014, 46, 186–201. [CrossRef]
42. Zhao, Y.; Duan, L.; Larssen, T.; Nielsen, C.; Hao, J. Soil acidification in China: Is controlling SO2 emissionsenough? Environ. Sci. Technol. 2009, 43, 8021–8026. [CrossRef] [PubMed]
43. Xie, Y.; Zhao, B.; Zhang, L.; Luo, R. Spatiotemporal variations of PM2.5 and PM10 concentrations between31 Chinese cities and their relationships with SO2, NO2, CO and O3. Particuology 2015, 20, 141–149. [CrossRef]
44. Lai, H. Developing Central China: A new regional programme. China Int. J. 2007, 5, 109–128. [CrossRef]45. Grossman, G.; Krueger, A. Environmental Impacts of a North American Free Trade Agreement. 1991.
Available online: http://www.nber.org/papers/w3914.pdf?newwindow=l (accessed on 31 October 2016).46. Shen, J. A Simultaneous Estimation of Environmental Kuznets Curve: Evidence from China. China Econ. Rev.
2006, 17, 383–394. [CrossRef]47. Liu, Y.; Zhou, Y.; Wu, W. Assessing the impact of population, income and technology on energy consumption
and industrial pollutant emissions in China. Appl. Energy 2015, 155, 904–917. [CrossRef]48. Selden, T.; Song, D. Environmental quality and development: Is there a Kuznets curve for air pollution
emissions? J. Environ. Manag. 1994, 27, 147–162. [CrossRef]49. Copeland, B.; Taylor, M. Trade and transboundary pollution. Am. Econ. Rev. 1995, 85, 716–737.50. Lan, J.; Kakinaka, M.; Huang, X. Foreign direct investment, human capital and environmental pollution in
China. Environ. Res. Econ. 2012, 51, 255–275. [CrossRef]51. Bao, Q.; Chen, Y.; Song, L. Foreign direct investment and environmental pollution in China: A simultaneous
equations estimation. Environ. Dev. Econ. 2011, 16, 71–92. [CrossRef]52. Jayanthakumaran, K.; Liu, Y. Openness and the environmental Kuznets curve: Evidence from China.
Econ. Model. 2012, 29, 566–576. [CrossRef]53. Wang, H.; Mamingi, N.; Laplante, B.; Dasgupta, S. Incomplete enforcement of pollution regulation:
Bargaining power of Chinese factories. Environ. Resour. Econ. 2003, 24, 245–262. [CrossRef]54. Dasgupta, S.; Laplante, B.; Wang, H.; Wheeler, D. Confronting the environmental Kuznets curve.
J. Econ. Perspect. 2002, 16, 147–168. [CrossRef]55. Chen, Y. Research of Environmental Taxation Reform in China. Master’s Thesis, Central China Normal
University, Wuhan, China, 2014.56. Feng, Y. Research on Green Development & Environmental Tax System Reform in China. Master’s Thesis,
Central China Normal University, Wuhan, China, 2014.57. Wang, A. The search for sustainable legitimacy: Environmental law and bureaucracy in China. Harv. Environ.
Law Rev. 2013, 37, 365–589. [CrossRef]58. Costantini, V.; Mazzanti, M.; Montini, A. Environmental performance, innovation and spillovers.
Evidence from a regional NAMEA. Ecol. Econ. 2013, 89, 101–114. [CrossRef]
© 2016 by the authors; licensee MDPI, Basel, Switzerland. This article is an open accessarticle distributed under the terms and conditions of the Creative Commons Attribution(CC-BY) license (http://creativecommons.org/licenses/by/4.0/).