using insects to teach stats: creating flipped classroom
TRANSCRIPT
University of Nebraska - LincolnDigitalCommons@University of Nebraska - Lincoln
Distance Master of Science in Entomology Projects Entomology, Department of
Spring 2014
Using Insects to Teach Stats: Creating FlippedClassroom Materials that Support StudentLearning of the Statistical Analysis Skills RequisiteWithin the International Baccalaureate HigherLevel Biology Course SyllabusJohn C. GaspariniUniversity of Nebraska-Lincoln
Follow this and additional works at: http://digitalcommons.unl.edu/entodistmasters
Part of the Entomology Commons
This Thesis is brought to you for free and open access by the Entomology, Department of at DigitalCommons@University of Nebraska - Lincoln. It hasbeen accepted for inclusion in Distance Master of Science in Entomology Projects by an authorized administrator of DigitalCommons@University ofNebraska - Lincoln.
Gasparini, John C., "Using Insects to Teach Stats: Creating Flipped Classroom Materials that Support Student Learning of theStatistical Analysis Skills Requisite Within the International Baccalaureate Higher Level Biology Course Syllabus" (2014). DistanceMaster of Science in Entomology Projects. 4.http://digitalcommons.unl.edu/entodistmasters/4

Entomology Distance Masters Project Overview Department of Entomology University of Nebraska-Lincoln
Date Submitted: 3/1/2014
Student Name: John C. Gasparini Student ID #:
Semester Enrolled in Ento 888: Spring Year: 2014
Title of Project Proposal: “Using Insects to Teach Stats: Creating Flipped Classroom Materials that Support Student Learning of the Statistical Analysis Skills Requisite Within the International Baccalaureate Higher Level Biology Course Syllabus.” Project Background: I work as a science teacher at a school in Germany. While I have enjoyed taking all of my classes within the UNL Masters in Entomology Program, I am not, and will not be a practicing entomologist in my career. That is why I would like my thesis project to focus on using the lessons that I have learned in completing this distance education program to improve my teaching. I feel as if I learned a great deal about insects in this program, but in addition I also learned quite a bit about what works and what does not work in terms of designing asynchronous and online instructional materials. I have chosen to combine these two elements – the study of insects and distance instructional design – in addressing a consistent academic need on the parts of my students, namely statistical analysis skill development. The school where I work has had a 1-to-1-laptop program since 2005. Every student in grades 7 through 12 has been issued a personal laptop for their academic use. Students are expected to bring their computers to every lesson, although there are many lessons where these machines are not utilized because the learning activities of the day do not require the use of a computer. As teachers we have been encouraged to develop “appropriate use(s) that enhance learning” by the administration of our school. Over this time, I have taught kids in grades 7 through 12, and I have tried my best to develop lessons that utilize laptops not simply to replace or replicate established modes of instruction, but rather to improve upon or reinforce sound teaching practice. I have also worked for the past 15 years as a teacher of the International Baccalaureate (IB) Higher and Standard Level Biology. IB Biology is a rigorous, two-year course that has a significant experimental component incorporated into its curriculum design. (For an overview of the material covered in IB Biology Courses, see the following link: http://www.ibo.org/diploma/curriculum/group4/biology.cfm). IB Biology is, in my opinion, a far more demanding and thorough introductory course than that offered by The College Board and Advanced Placement (AP) Biology. Not only does the IB syllabus cover more topics within biology, it explores these topics in more detail. The IB Biology syllabus also required a minimum of 60 hours of lab work over the course’s two years. Much of this lab work involves the students designing their own independent lab investigations. Statistical analysis of data is expected as part of their lab work. Helping foster the development of statistical analysis skills is, I feel, one of the most challenging aspects of teaching the IB Biology curriculum. The IB Biology laboratory program requires that, wherever appropriate, students should show appropriate statistical analysis and the use of statistical tests that should inform students as they write up conclusions summarizing the findings of their experiments. Students are expected to perform statistical calculations, such as standard deviation as well as t-tests and chi-squared tests in processing their lab results. They should be able to perform a linear regression. They are also expected to document the uncertainties that accompany any of their measurements taken during their lab work. This expectation of statistical analysis on the parts of 11th and 12th graders has been to my experience, one of the most challenging aspects of teaching IB Biology. I try to teach the meaning of reliability and variability, and how to determine means, modes, and medians of data sets. (This tends to be the easier part.) The determination of standard deviations, t-test values, chi-squared values, and lines of best fit is more of a challenge. The most difficult aspect of teaching stats skills is getting the kids to interpret these statistical tests properly so that that can use them in drawing informed conclusions based on their data whereby they don’t just simply fall into the 9th and 10 grade paradigm of analysis that says if the mean of one data set is bigger than that of another then one can confidently conclude that there is
a significant difference between the two. I have, informally, “flipped” some aspects of my teaching of IB Biology. Using the school’s course management software, I have placed all of my course materials online for students to access. My students can access all of the unit packet materials, lab instructions, and supplemental pdf documents that I have created for my courses over the years. If a student wants to read up on DNA replication using these online materials prior to our covering the material together as a class in lessons, they can, but I have as a habit not prepared any of this online content specifically for students to work through independently as an introduction to the material prior to my talking about the topics in class. Much of this online content lacks the guidance necessary to allow students to approach a topic independently. What I have not done is create online materials that fully realize the “flipped classroom” model of instruction. I would like to send my student home each night with their homework being that they go through the prepared online materials for about 15 to 20 minutes. The next day in class, I would like to work through excel-based exercises in calculation of statistical values and tests, as well as the way in which the test values are interpreted to draw informed conclusions based on data. Ideally, I hope to lesson the amount of lecture that I have to deliver on the use of Excel and we will spend far more instructional time in the act of processing data. The other aspect of the challenge is that for the 11th graders that come into my IB Biology classes they have not been formally introduced to statistics in their math courses. Biology teachers at our school are the first to introduce this mathematical material. We have to do it in September every Fall within the first 4 weeks of our school year because we need to start using stats in our lab work. While we cover stats early in the IB Bio course students need to be able to go back over it again and again as they collect their own data in later lab work over a two-year span. I always try to instill intellectual independence in my students – they need to be able to learn on their own in many ways as they prepare for university – and by putting this resource up online, kids can reference it when they need it, and come to me when they are really struggling with a data processing issue.
Deliverables Created During this Masters Project
1. Literature Review on the use of flipped classroom instruction. (Please note: there is a shocking lack of properly controlled experimental evaluation of educational outcomes when it comes to pedagogy in the literature. The case of Flipped Classroom Instruction is no exception. I had a great deal of difficulty in writing this Literature review because there was little to work with that was not anecdotal in its evidence in support or criticism of this practice. )
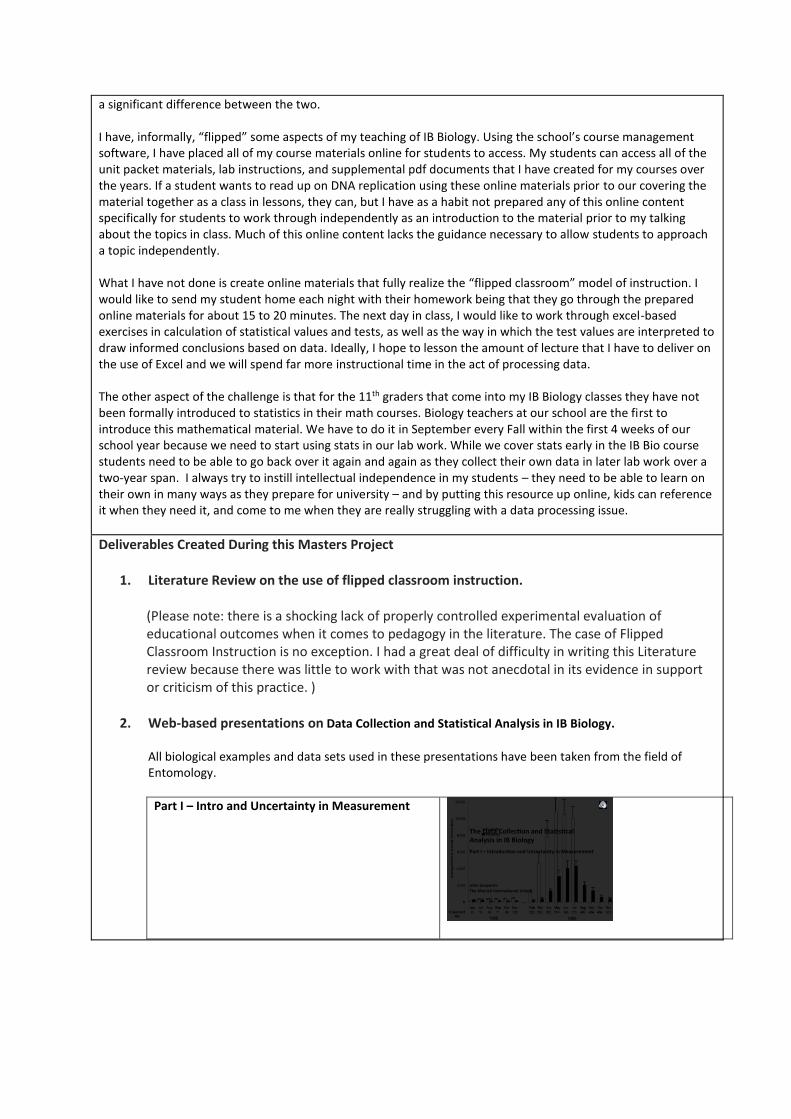
2. Web-based presentations on Data Collection and Statistical Analysis in IB Biology. All biological examples and data sets used in these presentations have been taken from the field of Entomology.
Part I – Intro and Uncertainty in Measurement
TheDataCollec onandSta s calAnalysisinIBBiology
JohnGaspariniTheMunichInterna onalSchool
PartI–Introduc onandUncertaintyinMeasurement

Part II – Mean, Mode, Median, Standard Deviation and Variability
Part III – Hypothesis Testing, t-tests
Part IV – Hypothesis Testing, Chi-Squared Tests
Part V – Correlation and Linear Regression
Part VI – Statistical Test Flow Chart
3. Embedded Youtube-Based Podcasts on Using Excel to Conduct Stats Tests: Embedded within each of the presentations listed above are Youtube-based podcasts explaining and showing how to conduct each of the statistical tests covered in these presentation in Excel or other programs. The presentations were all generated using the program ScreenFlow and show step by step how to use Excel to calculate SD values, t-tests, chi squared tests and linear regression/correlation analysis.
Imaginethatyouhavecollecteddataontheproboscislengthandbodymassofourtwobu erflyspecies.Recorditproperly.Youmustbeneattoreduceproblemslater!
Givetherawdatatablesproper tles
Includeuncertain es!
Beconsistentinyournumberofdecimalplaces.Don’tusemorethanthesensi vitylimitsofyourinstrument.
UsingaT-testtoevaluateahypothesis:
At-testisasta s caltestthatallowsustodeterminethesignificanceofthedifferencebetweenthemeansoftwodatasets.
Inotherwords:"Arethemeanstothetwodatasetsfarenoughapartthatwecansaythattheyaretrulydifferent?”
Whenwelookatourbu erflybodymassdatawecanseethatthereisoverlapbetweentheSDerrorbars,buttheremights llbeasignificantdifferencehere…
Female Male Total
Roostsites>5m ObservedNumbers(O) 380 480 860
ExpectedNumbers(E) 465.5 394.5 860
O–E -85.5 85.5
YatesCorrec on (|O-E|)-0.5 85.0 85.0
(O–E)2/E 15.5 18.3
Roostsites>5m ObservedNumbers(O) 623 370 993
ExpectedNumbers(E) 537.5 455.5 993
O–E 85.5 -85.5
YatesCorrec on (|O-E|)-0.5 85.0 85.0
(O–E)2/E 13.4 15.9 Total(χ2)=63.1
Totals 1003 850 1853
5.Runtheanalysisasusual.Calcula ngO-E,(O-E)2and(O-E)2/Eforeachcategory,thensumthe(O-E)2/E.valuestoobtainX2
Wehavecalculatedwithaχ2valueof63.1
Herearesomeexamplesofhowcorrela onmeasuresthestrengthofalinearrela onship.
Strength:Astrongcorrela onrangesfrom.8to1.0Amoderatecorrela onrangesfrom.6to.8Aweakcorrela onrangesfrom0to.6
Westart
here!
Whatkindofdata?
Measurements
CalculatemeanandSDfromreplicates
Frequencies(Counts)
WhatkindofStatsTest?
MakeSca erPlot
PlotBarGraph
Tes ngforrela onbetween2sets
Tes ngfordifferencebetweensets
Tes ngforacorrela on
Findinghowonefactoraffectsanother
PearsonCorrela onCoeffic
i
ent=CORREL(array1,array2)0=nocorrela on1=perfectcorrela on
LinearRegressionAddtrendlinetographDisplayequa onGivesslopeandinterceptofline
2sets
Morethan2sets
Sameindividuals
Differentindividuals
PairedT-test=TTEST(array1,array2,2,1)IfP<0.05=Sig.Dif.IfP>0.05=NoSig.Dif.
UnpairedT-test=TTEST(array1,array2,2,2)IfP<0.05=Sig.Dif.IfP>0.05=NoSig.Dif.
ANOVASeeyourteacherforadviceonhowthismightbehandled
WhatkindofStatsTest?
Tes ngfordifferencebetweencounts
ComparingobserveddatatoatheoryChiSquaredTest=CHISQ.TEST(Obs.array,Exp.array)IfP<0.05=DisagreewiththeoryIfP>0.05=Agreewiththeory
ChiSquaredTest=CHISQ.TEST(Obs.array,Exp.array)IfP<0.05=Sig.Dif.IfP>0.05=NoSig.Dif.

Calculating Standard Deviation in Excel http://youtu.be/90YWFllx1EA
Putting SD Error Bars on an Excel Graph http://youtu.be/oV0vbQlp9AI
Hypothesis testing using a T-test in Excel http://youtu.be/0hGnjp-o-Xw
Simple one Category Chi-Squared Test in Excel http://youtu.be/EOZu6O6i-Zk
Chi Squared Test with Multiple Categories in Excel http://youtu.be/I2Gi2DN_y4A
4. In-Class Activities Excel Workbook
An in-class activities Excel workbook on use of statistical tools. This workbook focuses on analyzing insect data and corresponds to the six-part, web-based presentations.

Future Plans for this Instructional Material:
I will post all of these files online via my school’s course management software.
I also plan on sharing these materials with my department. (I think all of the biology teachers will be pleased.)
I will employ these materials in my classes in September of 2014 as we start our next school year. Specifically I will be using these materials in my section of 11th Grade Standard Level Biology
Class of 2016. While it would be interesting to conduct a study on the learning outcomes of this flipped
classroom methodology, I do not currently have a proper control group. I only have one set of 11th Grade Biology kids for 2014-2015. It may be possible to conduct such a study in Fall of 2016 as I will then pick up two Identical sets of HL Biology according to the rotation of the teaching load that occurs in my department.
Literature Review – Flipped Classroom Instruction
John Gasparini (98004648)
In the world of Pre-K through 12 education, buzzwords and trends come and go, but
technology integration and a student-centered class will be two constants for the future.
Flipped classrooms capitalize on current technology with a focus on the individual student.
While there are many different variations of the flipped pedagogy, Hamdan and McKight (2013)
argue that in a flipped classroom, teachers shift direct learning out of the large group learning
space and move it into the individual learning space, with the help of one of several
technologies. A class that is flipped allows all participants, the teacher and all students, to learn
together by aligning the place and time to ensure authentic collaborative learning experiences
(McGoldrick, 2012).
With the current push for technology integration into classes, the question of
effectiveness on student learning has to be asked. In an International Association for the
Evaluation of Educational Achievement (IEA) study on effective technology integration in
international classrooms, it was concluded that students using technology to find, organize,
analyze, and create products while reflecting on their work are more likely to develop not only
information and communication technology skills, but other 21st century skills such as
communication, collaboration, and problem solving (Kozma, 2003). In a flipped classroom
students are not just using technology as a substitute for the teacher but they are accessing
instructional videos at home, so that when they come to school they are engaging in
meaningful discussions, activities, and projects to apply the content learned at home. Students
in today’s schools are made up of “digital natives” (Prensky, 2001). Therefore, educators need

to teach to students’ strengths and interests. Flipped learning, video podcasting in particular,
have been shown to have a positive impact on student attitudes (Bolliger, Supanakorn, &
Boggs, 2010) and student performance (Vajoczki, Watt, Marquis, & Holshausen, 2010).
According to Fulton’s (2012) study in Minnesota at Byron High School student interviews were
positive and reflected students’ success and preference of flipped classrooms. A 10th grade
student said, “I like that we watched the concept at home, but then mastered the concept in
class” (p. 14). However, as mentioned by Herreid & Schiller (2013) there are some potential
pitfalls to flipped learning. Because of drastic changes from traditional instruction, students can
be unsure of the process or do not adapt their academic habits resulting in being unprepared
for class. Another possible negative is the amount of preparation time that teachers will need
to take to find or make quality instructional videos. A common misconception about flipped
classrooms is that they are a replacement for the teacher. When well executed, however, the
teacher takes on the role of facilitator and is very active in each student’s learning (Johnson,
2012).
Another benefit of flipping classrooms is student motivation and ownership of their own
learning. According to Pink (2009), in order for one to be intrinsically motivated the individual
needs autonomy, mastery, and purpose. Flipping the classroom provides all three aspects of
authentic intrinsic motivation, particularly autonomy in their learning. Flipped classrooms give
students autonomy over what they do, when they do it, how they do it, and whom they do it
with. In a TED Talk (Khan, 2011) the creator of Khan Academy, Salman Khan, mentions that
while engaging in video tutorials, students learn in a risk free environment and are self-paced.
Students’ ownership of their learning provides them an avenue to choose how they

demonstrate their understanding. According to research by Sardone & Devlin-Scherer (2010)
students with intrinsic motivation and curiosity were engaged in the tasks at hand, implying
that once students learn the content, the time in class can be used to tap into the students’
natural curiosity.
An abundance of research can be found on flipped classroom success and
implementation in secondary and university education, but to his knowledge the effect of
flipping classrooms in middle school is still undetermined. In the aforementioned teacher
survey done by Flipped Learning Network (2012), 95% of the teachers surveyed taught in
secondary settings. This survey reflects the lack of flipped pedagogy occurring in middle school
classes. There does not seem to be any controlled experimental research studies investigating
the effects of flipped pedagogy in a middle school classroom setting. It would be interesting to
design and evaluate the learning outcomes of a flipped classroom unit in science for a middle
school science classroom.

References
Bennett, B. (n.d.) Educator, learner: Trying to lead by example. [Web log comment]
Retrieved from http:// www.brianbennett.org/blog/flipclass-chat/
Bolliger, D. U., Supanakorn, S., & Boggs, C. (2010). Impact of podcasting on student
motivation in the online learning environment. Computers & Education, 55(2), 714-
722. doi:10.1016/j.compedu.2010.03.004
Flipped Learning Network. (2012). Improve student learning and teacher satisfaction in one
flip of the classroom [Infographic]. Retrieved from
http://www.flippedlearning.org/cms/lib07/VA01923112/Centricity/Domain/41/
classroomwindowinfographic7-12.pdf
Fulton, K. (2012). Upside down and inside out: Flip your classroom to improve student
learning. Learning & Leading with Technology, 39(8), 12–17.
Hamdan & McKight (2013). A review of flipped learning [PDF document]. Retrieved from
http://www.flippedlearning.org/cms/lib07/VA01923112/Centricity/Domain/41/
LitReview_FlippedLearning.pdf
Herreid, C., & Schiller, N. (2013). Case studies and the flipped classroom. Journal Of College
Science Teaching, 42(5), 62-66.
Johnson, G. (2012, May 7). The flipped classroom is not. [Video file]. Retrieved from
http://www.youtube.com/watch?v=hGs6ND7a9ac&feature=c4-overview-
vl&list=PL0B34C03680F07263
Khan, S. (2011, March). Let’s use video to reinvent education. [Video file]. Retrieved from
http://www.ted.com/talks/salman_khan_let_s_use_video_to_reinvent_education.html
Kozma, R. B. (2003). Technology and classroom practices: An international study. Journal
Of Research On Technology In Education, 36(1), 1-14.
McGoldrick A. M. (2012, November 12). Maybe we should call it a shifted classroom. (Blog
entry]. Retrieved from http://audrey-mcsquared.blogspot.com.es/2012/11/maybe-
we- should-call-it-shifted.html?spref=tw
Pink, D. (2009). Drive: The surprising truth about what motivates us. New York, NY:
Riverhead Books.
Prensky, M. (2001). Digital natives, digital immigrants. On the Horizon 9 (5): 1–6.
doi:10.1108/10748120110424816.
Sardone, N. B., & Devlin-Scherer, R. (2010). Teacher candidate responses to digital games:
21st-century skills development. Journal Of Research On Technology In Education,
42(4), 409-425.
Vajoczkt, S., Watt, S., Marquis, N., & Holshausen, K. (2010). Podcasts: Are they an
effective tool to enhance student learning? A case study from McMaster University,
Hamilton, Canada. Journal Of Educational Multimedia & Hypermedia, 19(3), 349-
362.