using financial statement information presentations for chapter 5 by glenn owen
TRANSCRIPT

Using Financial Using Financial Statement InformationStatement Information
Presentations for Chapter 5 by Glenn Owen

Key PointsKey Points Using financial accounting numbers to influence management
decisions and predict future events. Five steps of financial statement analysis. Assessing the business environment. Assessing earnings quality and persistence. Analyzing financial statements. Difficulties involved in using annual report information to
identify mispriced securities. Difficulties involved in using financial statements
to compare the performance of companies operating in different countries.

Control and PredictionControl and PredictionFinancial accounting numbers are useful in
two fundamental ways:– They help investors and creditors influence and monitor
the business decisions of a company’s managers– They help to predict a company’s future earnings and
cash flows

Book Value vs. True ValueBook Value vs. True Value
Business environment– Statements are backward looking, not focusing on the
future prospects.
Unrecorded events– Statements leave out some current and historical
information such as human resources and the effects of inflation.
Management bias– Managers often choose accounting methods
and estimates that make them look good.

Five Steps of Five Steps of Financial Statement AnalysisFinancial Statement Analysis
Assessing the business environment.Reading and studying the financial
statements and footnotes.Assessing earnings quality.Analyzing the financial statements.Predicting future earnings
and/or cash flow.

Assessing the Business Assessing the Business EnvironmentEnvironment
What is the nature of the company’s operations? What strategy is being employed to generate profits? What is the company’s industry? Who are the major players? Competition? What are the relationships between the
company and its customers and suppliers? How are the company’s sales and
profits affected by changes in the economy?

Reading and Studying the Financial Reading and Studying the Financial Statements and NotesStatements and Notes
Read the audit report.Identify significant transactions
– major acquisitions, discontinuance or disposal of a business segment, unresolved litigation, major write-downs of receivables or inventories, etc.
Read the financial statements and footnotes.

Assessing Earnings QualityAssessing Earnings Quality
Overstating operating performanceTaking a bathCreating hidden reservesEmploying off-balance-sheet financingEarnings quality and unrecorded events

Analyzing the Financial Analyzing the Financial StatementsStatements
Comparisons across timeComparisons within the industryComparisons within the financial statements:
common-size statements and ratio analysis– Profitability ratios– Leverage ratios– Solvency ratios– Asset turnover ratios– Market ratios

Comparisons Across TimeComparisons Across Time
Financial accounting numbers can be made more meaningful if they are compared across time.
GAAP require side-by-side comparison of the current and the preceding years in published financial reports.

Comparisons Within Comparisons Within the Industrythe Industry
Financial accounting numbers can also be made more meaningful if they are compared to those of similar companies.
Comparison of financial accounting numbers with industry averages is also helpful.
Sources of industry information include:– Dun & Bradstreet– Robert Morris Associates– Moody– Standard & Poor

Comparisons Within Comparisons Within the Financial Statementsthe Financial Statements
Common-size financial statementsRatio analysis
– Profitability ratios– Leverage ratios– Solvency ratios– Asset turnover ratios– Other ratios

Common-Size Income Common-Size Income Statement for LA-Z-Boy, Inc.Statement for LA-Z-Boy, Inc.
2000 % 1999 % Net sales $1,717 100 1,288 100 Cost of sales (1,284) 75 (947) 74 Expenses (345) 20 (275) 21 Net income $88 5 $ 66 5
On the income statement, cost of goods sold, expenses, and net income are often expressed as percentages of net sales.
On the balance sheet, assets and liabilities can be expressed as percentages of total assets.

Profitability RatiosProfitability RatiosThese ratios are designed to measure a
firm’s earnings power.Net income, the primary measure of the
overall success of a company, is compared to other measures of financial activity or condition to assess performance as a percent of some level of activity or investment.

The return on equity ratio measures the effectiveness The return on equity ratio measures the effectiveness at managing capital provided by at managing capital provided by ownersowners..
Profitability RatiosProfitability Ratios
Return on equity
Net Income Average Stockholder’s Equity

The return on assets ratio measures the effectiveness The return on assets ratio measures the effectiveness at managing capital provided by all at managing capital provided by all investorsinvestors..
Profitability RatiosProfitability Ratios
Return on assets
Net Income + [Interest Expense (1 -Tax Rate )]
Average Total Assets

Return on sales (profit margin)
Net Income + [Interest Expense (1 -Tax Rate )]
Net Sales
Profitability RatiosProfitability Ratios
The return on sales ratio provides an indication of The return on sales ratio provides an indication of a company’s ability to generate and market a company’s ability to generate and market profitable products and control its costs.profitable products and control its costs.

Leverage RatiosLeverage RatiosLeverage refers to using borrowed funds to
generate returns for stockholders.Leverage is desirable because it creates
returns for stockholders without using any of their money.
Leverage increases risk by committing the company to future cash obligations

Common equity leverage
Net Income Net Income +
[Interest Expense (1 -Tax Rate )]
This ratio compares the return available to the This ratio compares the return available to the stockholders to returns available to all capital providers.stockholders to returns available to all capital providers.
Leverage RatiosLeverage Ratios

This ratio measures the extent to which a company This ratio measures the extent to which a company relies on borrowings (liabilities).relies on borrowings (liabilities).
Capital structure leverage
Average Total Assets Average Stockholders' Equity
Leverage RatiosLeverage Ratios

This ratio compares liabilities to stockholders’ equity This ratio compares liabilities to stockholders’ equity and is another measure of capital structure leverage.and is another measure of capital structure leverage.
Debt/equity ratio
Average Liabilities Average Stockholders' Equity
Leverage RatiosLeverage Ratios

Long-term debt ratio
Long-Term Liabilities Total Assets
This ratio measures the importance of long-term debt This ratio measures the importance of long-term debt as a source of asset financing.as a source of asset financing.
Leverage RatiosLeverage Ratios

Solvency RatiosSolvency RatiosSolvency refers to a company’s ability to
meet its current debts as they come due.There is pressure on companies with high
levels of leverage to manage their solvency.

Current ratio Current Assets Current Liabilities
Solvency RatiosSolvency Ratios
This ratio measures solvency in the sense that This ratio measures solvency in the sense that current assets can be used to meet current liabilitiescurrent assets can be used to meet current liabilities

Solvency RatiosSolvency Ratios
Quick ratio Cash + Marketable Securities + Net Accounts Receivable
Current Liabilities
Similar to the current ratio, this ratio provides a Similar to the current ratio, this ratio provides a more stringent test of a company’s solvency.more stringent test of a company’s solvency.

Solvency RatiosSolvency Ratios
Interest coverage
Net Income + Tax Expense + Interest Expense Interest Expense
This ratio compares the annual funds available to This ratio compares the annual funds available to meet interest to the annual interest expense.meet interest to the annual interest expense.

Accounts payable turnover
Cost of Goods Sold Average Accounts Payable
This ratio measures the extent to which accounts This ratio measures the extent to which accounts payable is used as a form of financing.payable is used as a form of financing.
Solvency RatiosSolvency Ratios

Asset Turnover RatiosAsset Turnover RatiosAsset turnover ratios are typically computed
for total assets, accounts receivable, inventory, and fixed assets.
These ratios measure the speed with which assets move through operations or reflect the number of times during a given period that these specific assets are acquired, used, and replaced.
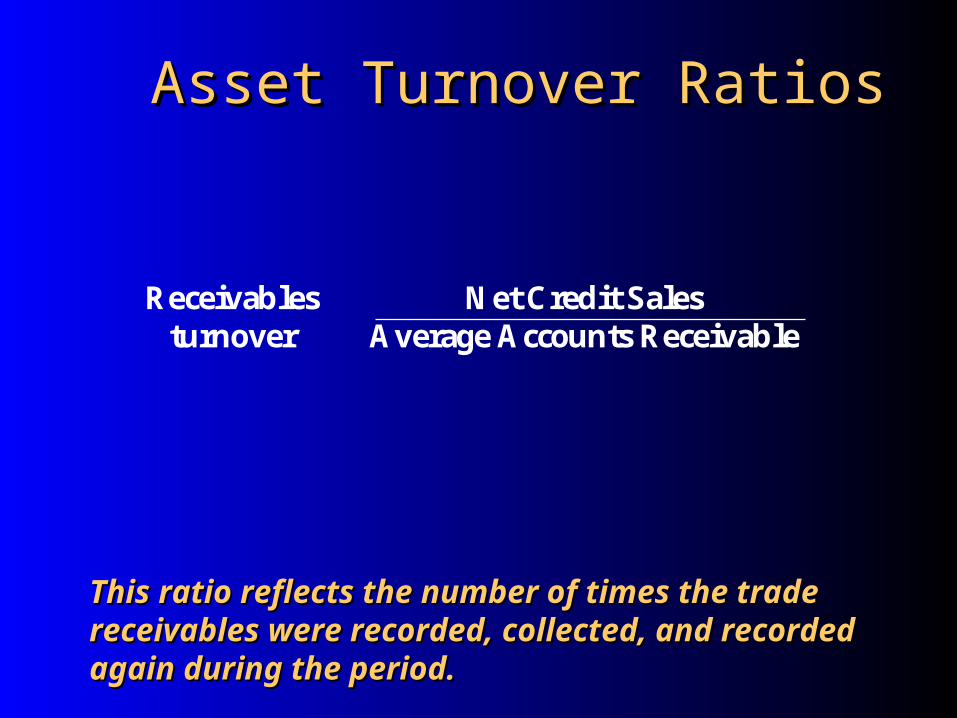
Asset Turnover RatiosAsset Turnover Ratios
Receivables turnover
Net Credit Sales Average Accounts Receivable
This ratio reflects the number of times the trade This ratio reflects the number of times the trade receivables were recorded, collected, and recorded receivables were recorded, collected, and recorded again during the period.again during the period.

Asset Turnover RatiosAsset Turnover Ratios
Inventory turnover
Cost of Goods Sold Average Inventory
This ratio measures the speed with which inventories This ratio measures the speed with which inventories move through operations.move through operations.

Asset Turnover RatiosAsset Turnover Ratios
Fixed assets turnover
Sales Average Fixed Assets
This ratio measures the speed with which fixed assets This ratio measures the speed with which fixed assets are used up.are used up.

Asset Turnover RatiosAsset Turnover Ratios
Total asset turnover
Sales Average Total Assets
This ratio measures the speed with which all assets are This ratio measures the speed with which all assets are used up in operations.used up in operations.

Other RatiosOther RatiosThese additional ratios are used by the
financial community to assess company performance.

Other RatiosOther Ratios
Earnings per share
Net Income Average Number of Common
Shares Outstanding
This ratio, according to the financial press, is the This ratio, according to the financial press, is the primary measure of a company’s performance.primary measure of a company’s performance.

Other RatiosOther Ratios
Price/earnings ratio
Market Price per Share Earnings per Share
This ratio is used by many analysts to assess the This ratio is used by many analysts to assess the investment potential of common stocks.investment potential of common stocks.

Other RatiosOther Ratios
Dividend yield ratio
Dividends per Share Market Price per Share
This ratio indicates to cash return on the This ratio indicates to cash return on the stockholders’ investment.stockholders’ investment.

Other RatiosOther Ratios
Stock price return
Market Price 1 - Market Price 0 + Dividends
Market Price 0
This ratio measures the pretax performance of an This ratio measures the pretax performance of an investment in a share of common stock.investment in a share of common stock.

Solvency AssessmentSolvency AssessmentAbility to Generate Cash Cash Requirements
Operating Performance
Financial Flexibility

Solvency AssessmentSolvency AssessmentAbility to Generate Cash Cash Requirements
Operating PerformanceOperating Revenue
Sale of GoodsSale of Service
Creation of Operating Receivables(timing difference)Cash Inflows from Operations
Financial Flexibility

Solvency AssessmentSolvency AssessmentAbility to Generate Cash Cash Requirements
Operating PerformanceOperating Revenue
Sale of GoodsSale of Service
Creation of Operating Receivables(timing difference)Cash Inflows from Operations
Operating CostsCost of Goods SoldOperating Expense
Creation of Operating Payables(timing difference)Cash Outflows from Operations
Financial FlexibilityAbility to create short-term debtAbility to create long-term debtAbility to issue equityAbility to liquidate assets Liquidity

Solvency AssessmentSolvency AssessmentAbility to Generate Cash Cash Requirements
Operating PerformanceOperating Revenue
Sale of GoodsSale of Service
Creation of Operating Receivables(timing difference)Cash Inflows from Operations
Operating CostsCost of Goods SoldOperating Expense
Creation of Operating Payables(timing difference)Cash Outflows from Operations
Financial FlexibilityAbility to create short-term debtAbility to create long-term debtAbility to issue equityAbility to liquidate assets
Payments for short-term debtPayments for long-term debtPayments for dividendsPayments for asset replacement
Liquidity
Timing of Cash Inflows Timing of Cash Outflows

C O P Y R I G H T
C o p y r i g h t © 2 0 0 3 , J o h n W i l e y & S o n s , I n c . A l l r i g h t s r e s e r v e d .R e p r o d u c t i o n o r t r a n s l a t i o n o f t h i s w o r k b e y o n d t h a t p e r m i t t e d i n S e c t i o n 1 1 7 o f t h e 1 9 7 6 U n i t e d S t a t e s C o p y r i g h t A c t w i t h o u t t h ee x p r e s s w r i t t e n p e r m i s s i o n o f t h e c o p y r i g h t o w n e r i s u n l a w f u l . R e q u e s t f o r f u r t h e r i n f o r m a t i o n s h o u l d b e a d d r e s s e d t o t h e P e r m i s s i o n s D e p a r t m e n t , J o h n W i l e y & S o n s , I n c . T h e p u r c h a s e r m a y m a k e b a c k - u p c o p i e s f o r h i s / h e r o w n u s e o n l y a n d n o t f o r d i s t r i b u t i o n o r r e s a l e . T h e P u b l i s h e r a s s u m e s n o r e s p o n s i b i l i t yf o r e r r o r s , o m i s s i o n s , o r d a m a g e s , c a u s e d b y t h e u s e o f t h e s e p r o g r a m s o r f r o m t h e u s e o f t h e i n f o r m a t i o n c o n t a i n e d h e r e i n .