u.s. lodging overview what lies ahead - hotel lawyer. lodging overview what lies ahead ... total...
TRANSCRIPT

1
U.S. Lodging OverviewWhat Lies Ahead
Vail R. Brown
Vice President, Global Business Development & Marketing

2
Agenda: 8 May 2012
2012 / 2013 Forecast
Total U.S. Review
Customer Segmentation
Chain Scales
Markets

3
2012 / 2013 Forecast
4
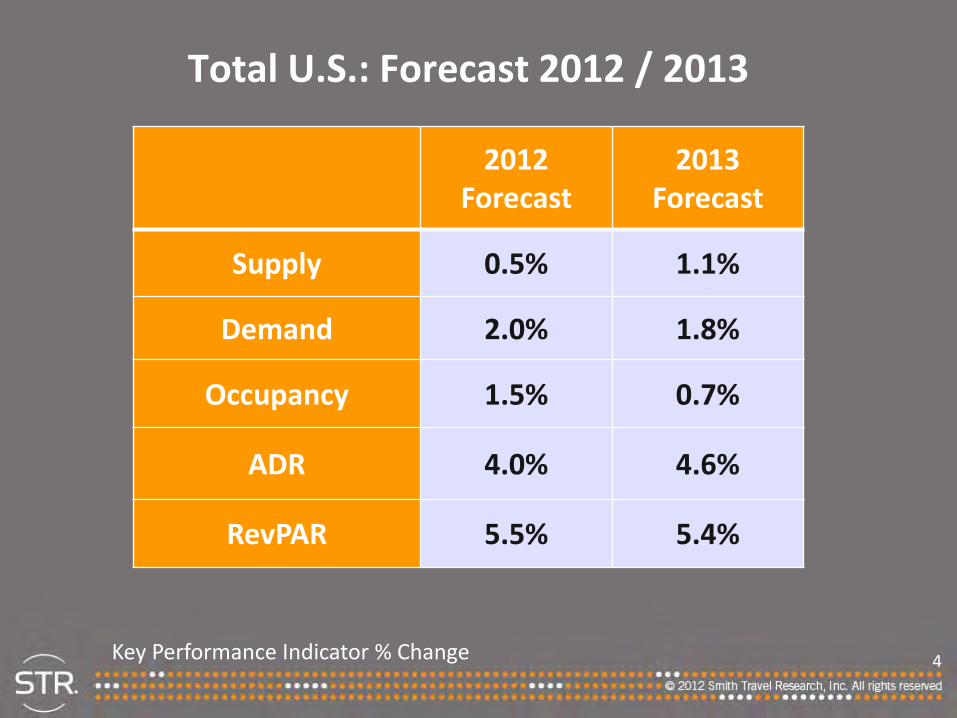
Total U.S.: Forecast 2012 / 2013
2012Forecast
2013Forecast
Supply 0.5% 1.1%
Demand 2.0% 1.8%
Occupancy 1.5% 0.7%
ADR 4.0% 4.6%
RevPAR 5.5% 5.4%
Key Performance Indicator % Change
5
Why Are STR’s RevPAR Assumptions Lower Than Consensus?
6
-20
-16
-12
-8
-4
0
4
8
12
2000 2004 2008 2012
Chains Independents
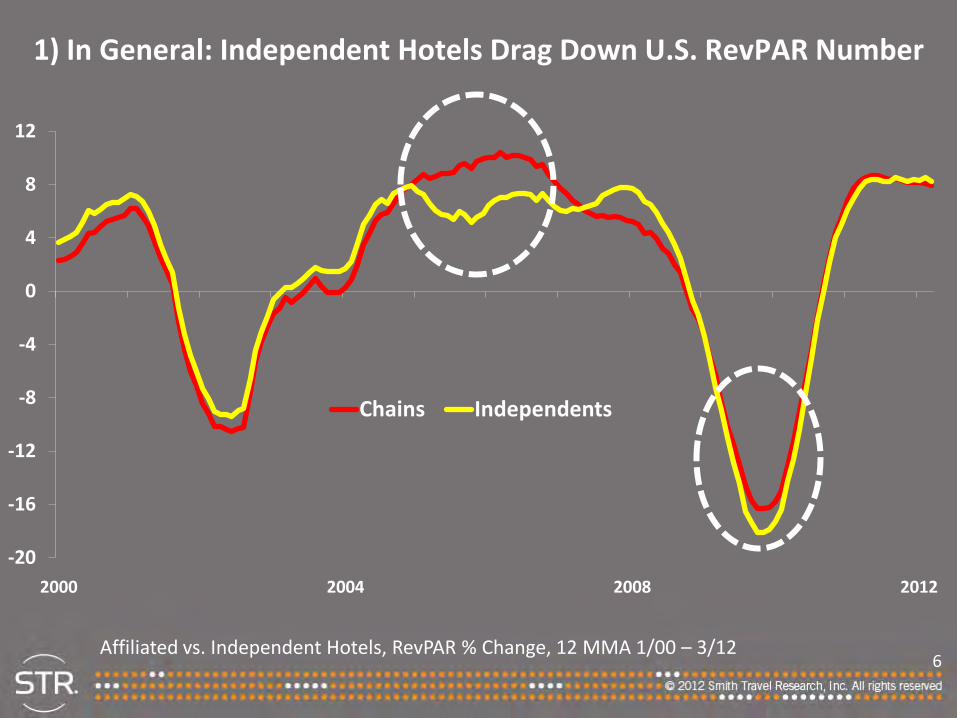
1) In General: Independent Hotels Drag Down U.S. RevPAR Number
Affiliated vs. Independent Hotels, RevPAR % Change, 12 MMA 1/00 – 3/12
7
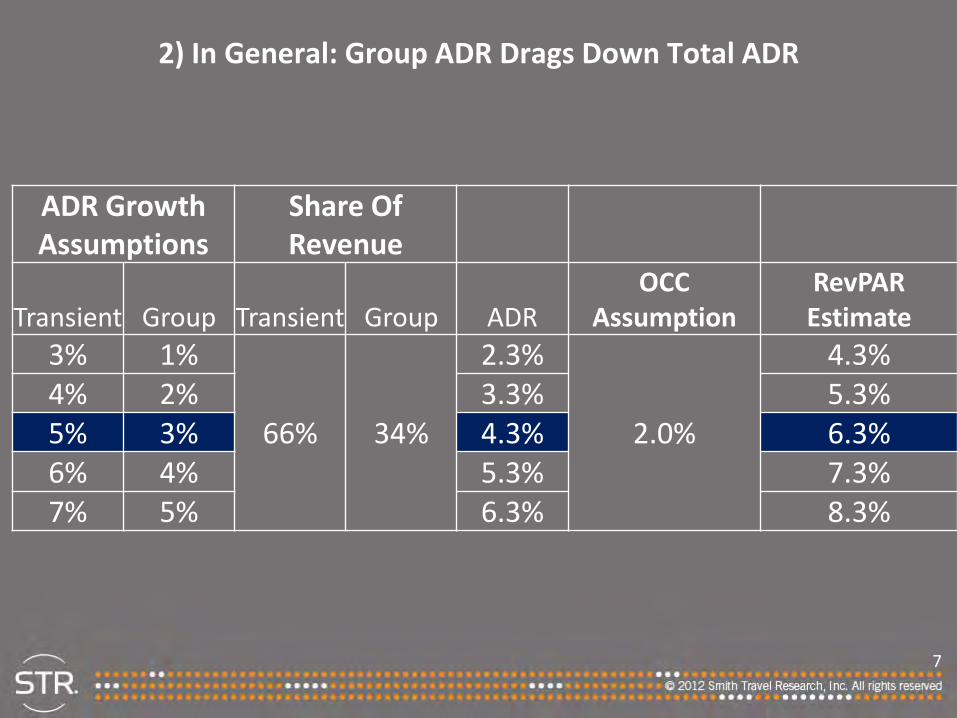
2) In General: Group ADR Drags Down Total ADR
ADR Growth Assumptions
Share Of Revenue
Transient Group Transient Group ADROCC
AssumptionRevPAREstimate
3% 1%
66% 34%
2.3%
2.0%
4.3%4% 2% 3.3% 5.3%5% 3% 4.3% 6.3%6% 4% 5.3% 7.3%7% 5% 6.3% 8.3%
8
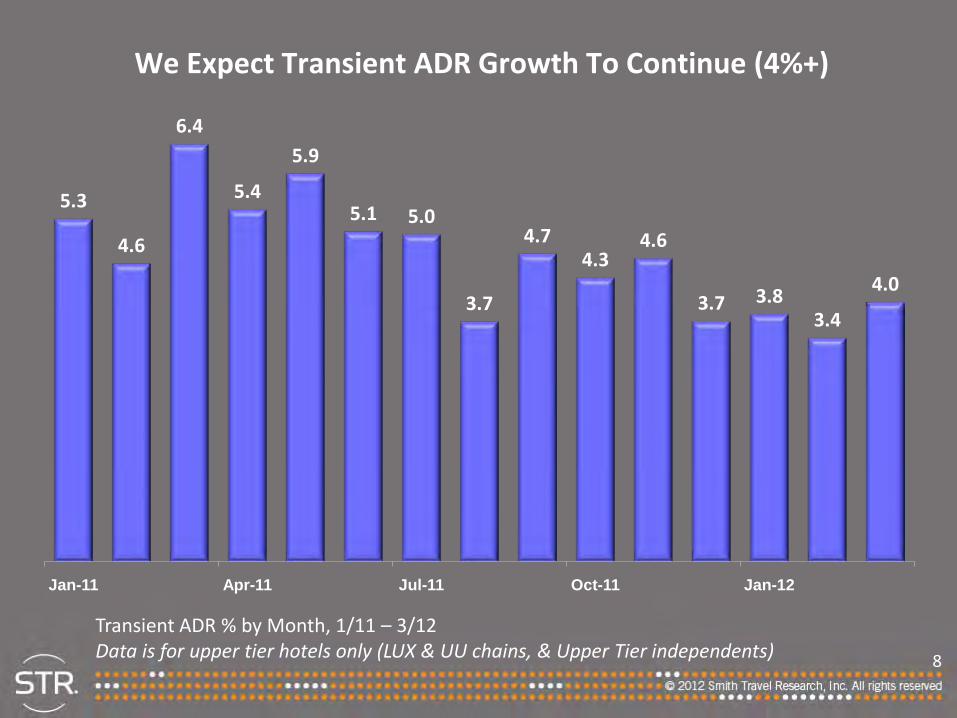
5.3
4.6
6.4
5.4
5.9
5.1 5.0
3.7
4.74.3
4.6
3.7 3.83.4
4.0
Jan-11 Apr-11 Jul-11 Oct-11 Jan-12
Transient ADR % by Month, 1/11 – 3/12Data is for upper tier hotels only (LUX & UU chains, & Upper Tier independents)
We Expect Transient ADR Growth To Continue (4%+)
9
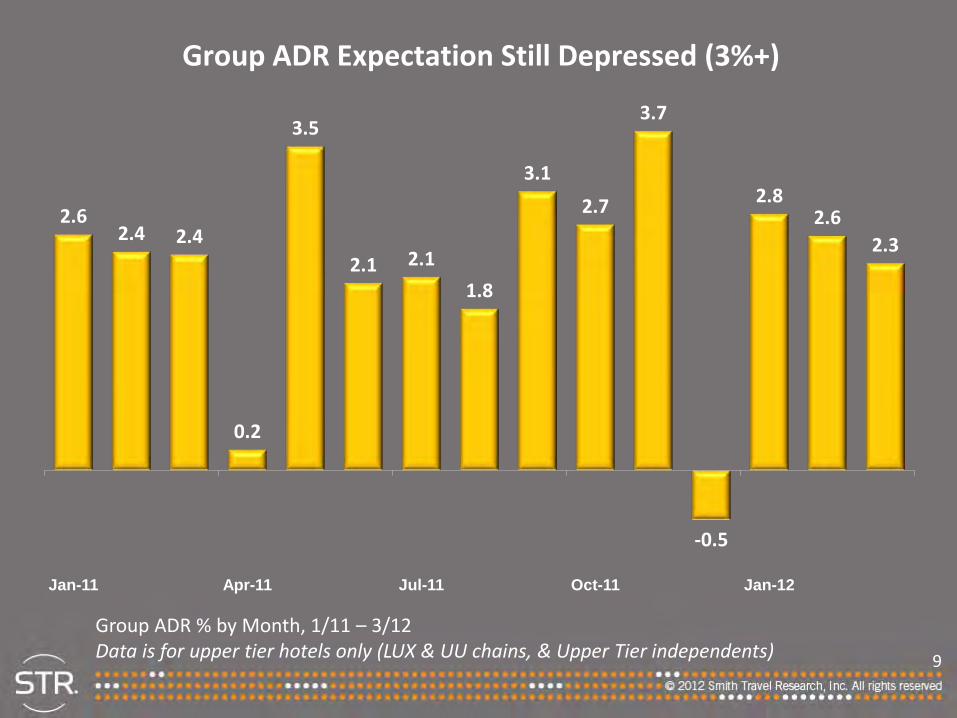
2.62.4 2.4
0.2
3.5
2.1 2.1
1.8
3.1
2.7
3.7
-0.5
2.82.6
2.3
Jan-11 Apr-11 Jul-11 Oct-11 Jan-12
Group ADR % by Month, 1/11 – 3/12Data is for upper tier hotels only (LUX & UU chains, & Upper Tier independents)
Group ADR Expectation Still Depressed (3%+)

10
Current Hotel Performance
11
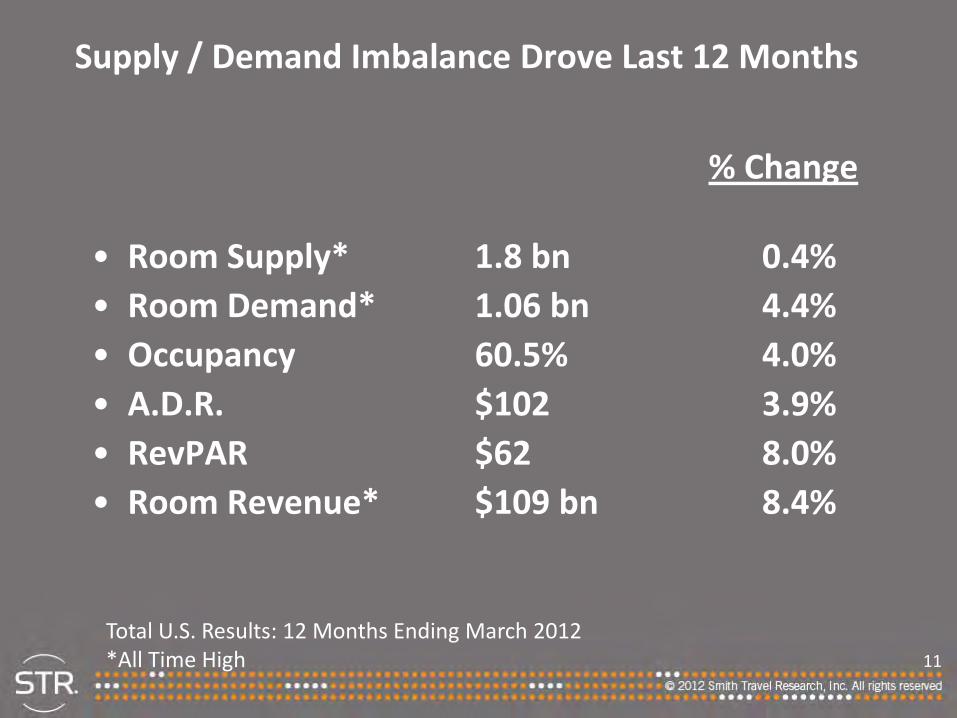
Supply / Demand Imbalance Drove Last 12 Months
% Change
• Room Supply* 1.8 bn 0.4%• Room Demand* 1.06 bn 4.4%• Occupancy 60.5% 4.0%• A.D.R. $102 3.9%• RevPAR $62 8.0%• Room Revenue* $109 bn 8.4%
Total U.S. Results: 12 Months Ending March 2012*All Time High

12
Q1 2012:
Highest Demand - EVER
(245 Million Rooms Sold)
13
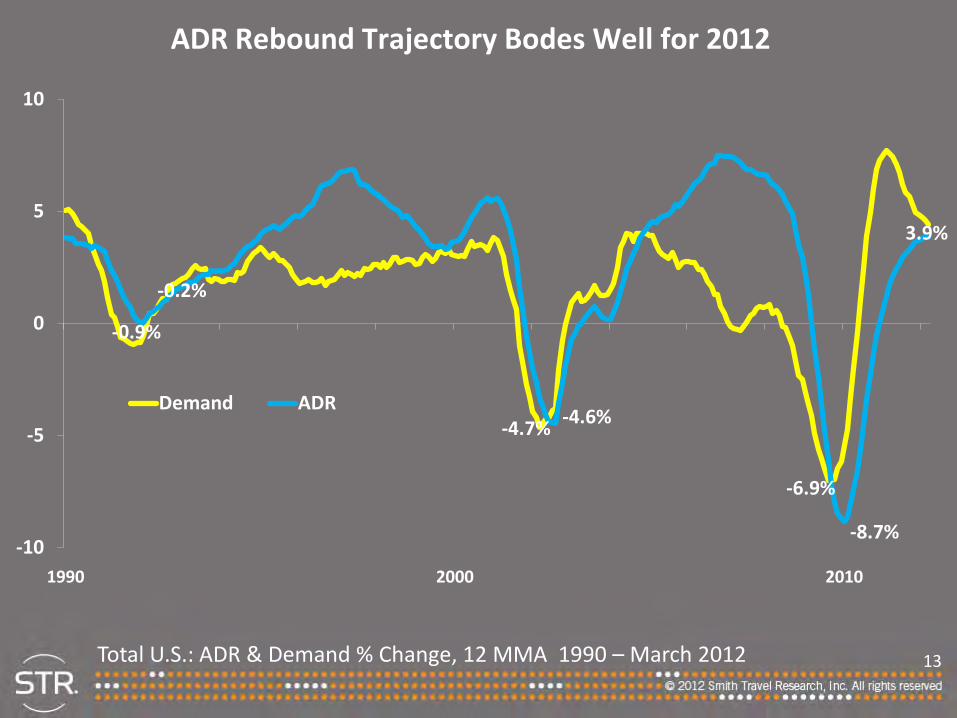
-10
-5
0
5
10
1990 2000 2010
Demand ADR
ADR Rebound Trajectory Bodes Well for 2012
-6.9%
-4.7%
-0.9%
-4.6%
-0.2%
-8.7%
3.9%
Total U.S.: ADR & Demand % Change, 12 MMA 1990 – March 2012
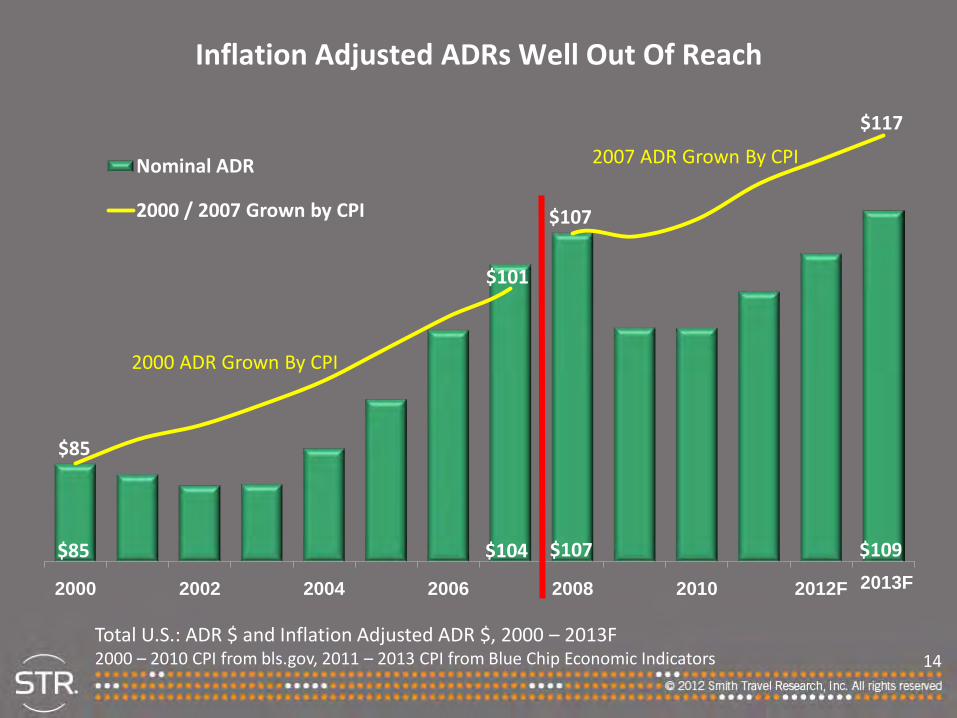
14
2000 2002 2004 2006 2008 2010 2012F
Nominal ADR
2000 / 2007 Grown by CPI
2000 ADR Grown By CPI
Total U.S.: ADR $ and Inflation Adjusted ADR $, 2000 – 2013F2000 – 2010 CPI from bls.gov, 2011 – 2013 CPI from Blue Chip Economic Indicators
$85
$101
$104
$85
$107 $109
$107
$117
2013F
Inflation Adjusted ADRs Well Out Of Reach
2007 ADR Grown By CPI

15
Customer Segmentation Overview
16
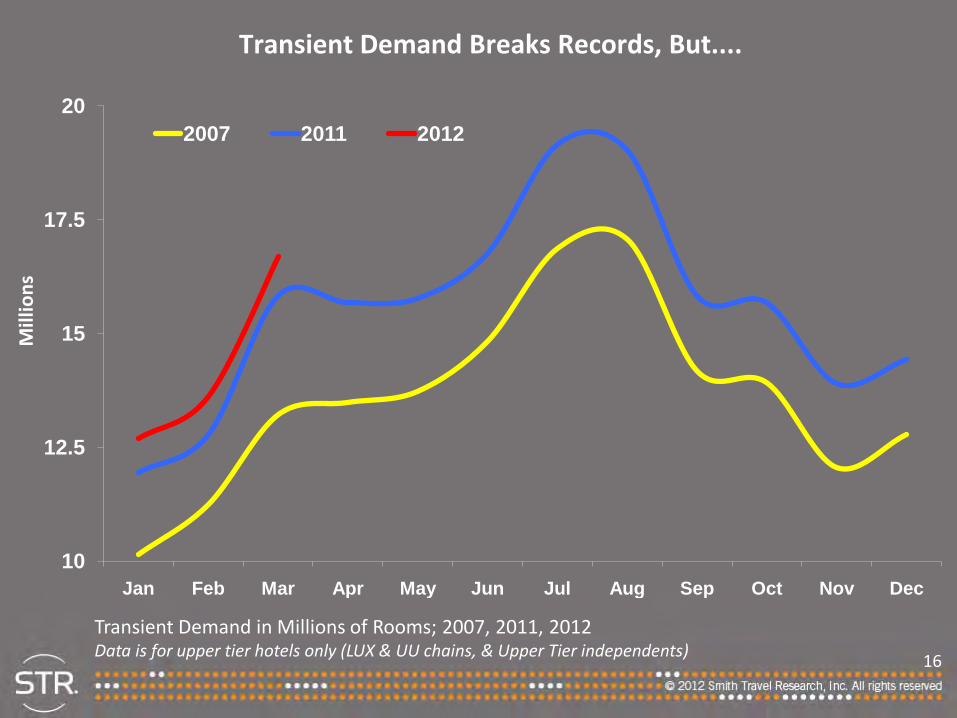
Transient Demand Breaks Records, But....
10
12.5
15
17.5
20
Jan Feb Mar Apr May Jun Jul Aug Sep Oct Nov Dec
2007 2011 2012
Transient Demand in Millions of Rooms; 2007, 2011, 2012Data is for upper tier hotels only (LUX & UU chains, & Upper Tier independents)
Mill
ions
17
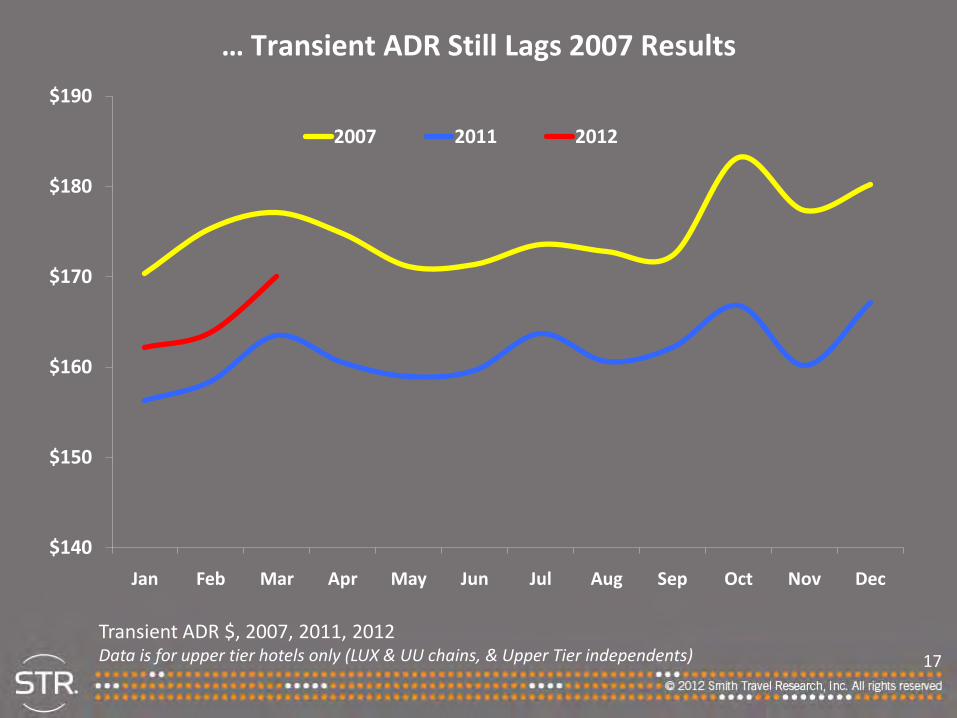
… Transient ADR Still Lags 2007 Results
$140
$150
$160
$170
$180
$190
Jan Feb Mar Apr May Jun Jul Aug Sep Oct Nov Dec
2007 2011 2012
Transient ADR $, 2007, 2011, 2012Data is for upper tier hotels only (LUX & UU chains, & Upper Tier independents)
18
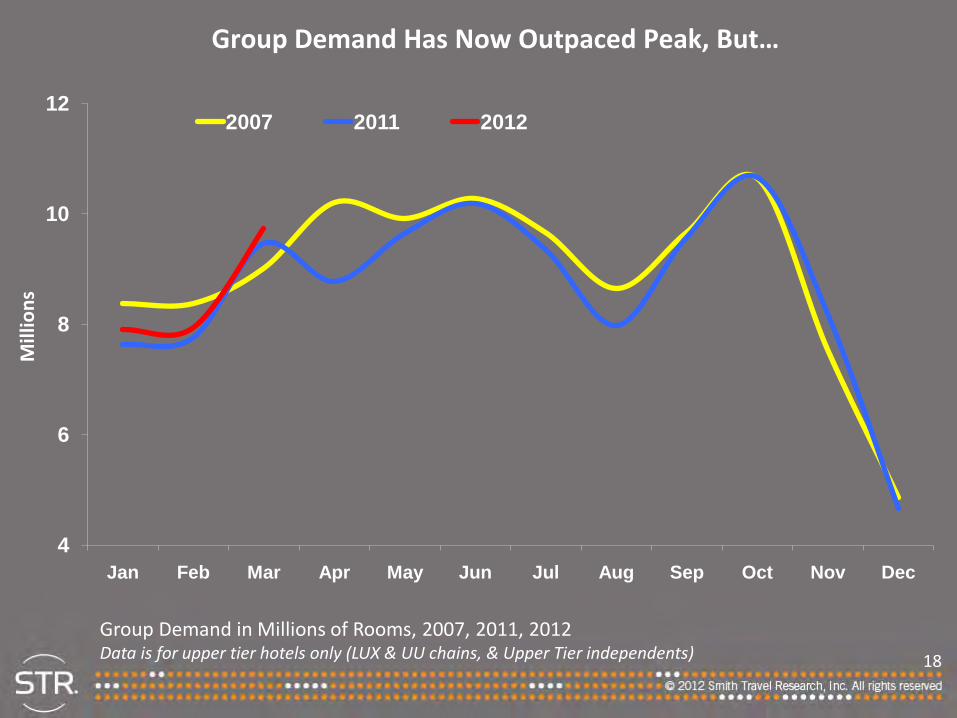
Group Demand Has Now Outpaced Peak, But…
4
6
8
10
12
Jan Feb Mar Apr May Jun Jul Aug Sep Oct Nov Dec
Mill
ions
2007 2011 2012
Group Demand in Millions of Rooms, 2007, 2011, 2012Data is for upper tier hotels only (LUX & UU chains, & Upper Tier independents)
19
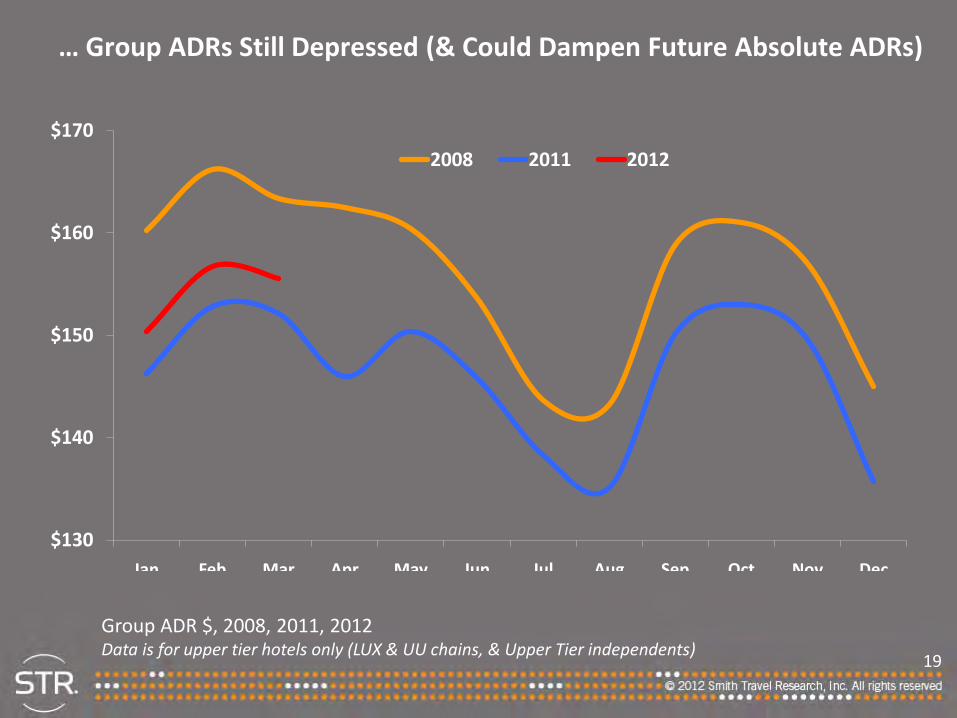
… Group ADRs Still Depressed (& Could Dampen Future Absolute ADRs)
$130
$140
$150
$160
$170
Jan Feb Mar Apr May Jun Jul Aug Sep Oct Nov Dec
2008 2011 2012
Group ADR $, 2008, 2011, 2012Data is for upper tier hotels only (LUX & UU chains, & Upper Tier independents)

20
Chain Scale Overview
21
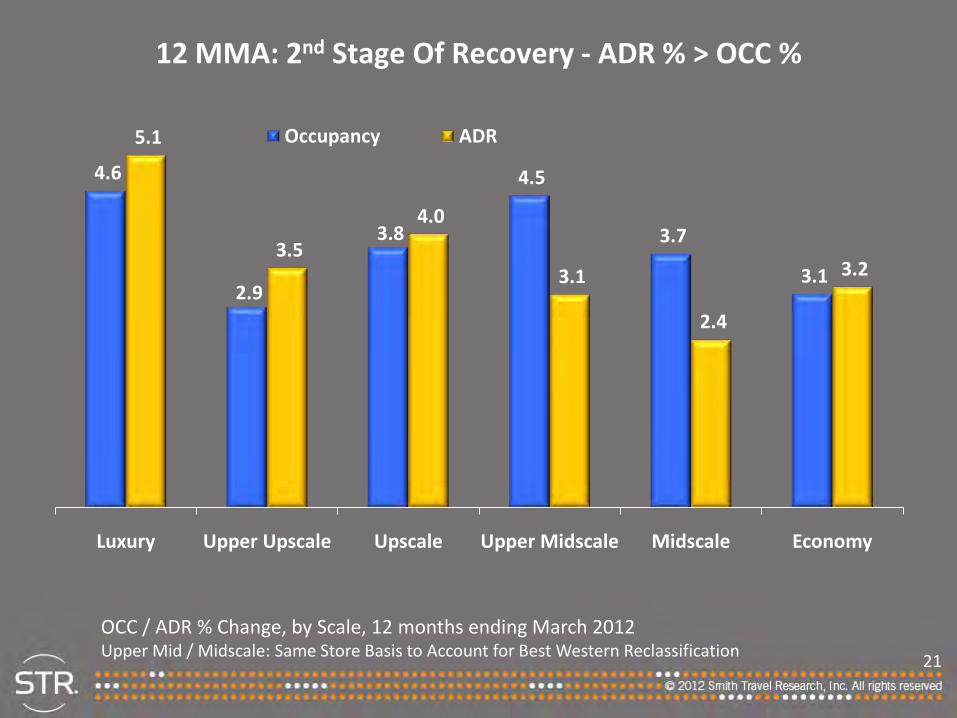
12 MMA: 2nd Stage Of Recovery - ADR % > OCC %
4.6
2.9
3.8
4.5
3.7
3.1
5.1
3.5
4.0
3.1
2.4
3.2
Luxury Upper Upscale Upscale Upper Midscale Midscale Economy
Occupancy ADR
OCC / ADR % Change, by Scale, 12 months ending March 2012Upper Mid / Midscale: Same Store Basis to Account for Best Western Reclassification
22
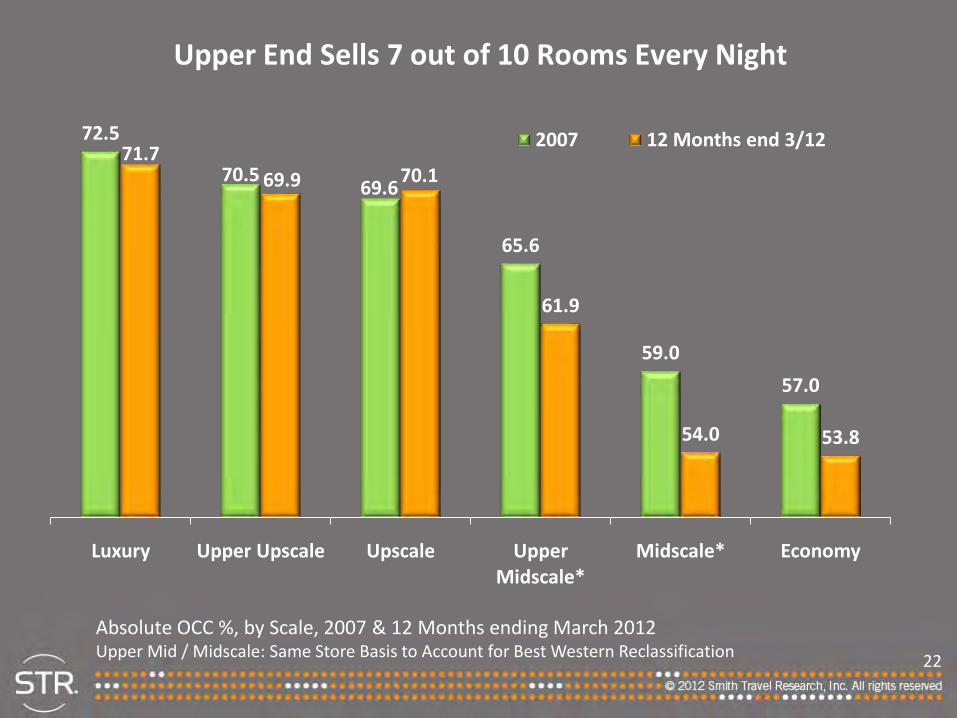
Upper End Sells 7 out of 10 Rooms Every Night
72.5
70.569.6
65.6
59.0
57.0
71.769.9 70.1
61.9
54.0 53.8
Luxury Upper Upscale Upscale Upper Midscale*
Midscale* Economy
2007 12 Months end 3/12
Absolute OCC %, by Scale, 2007 & 12 Months ending March 2012Upper Mid / Midscale: Same Store Basis to Account for Best Western Reclassification
23
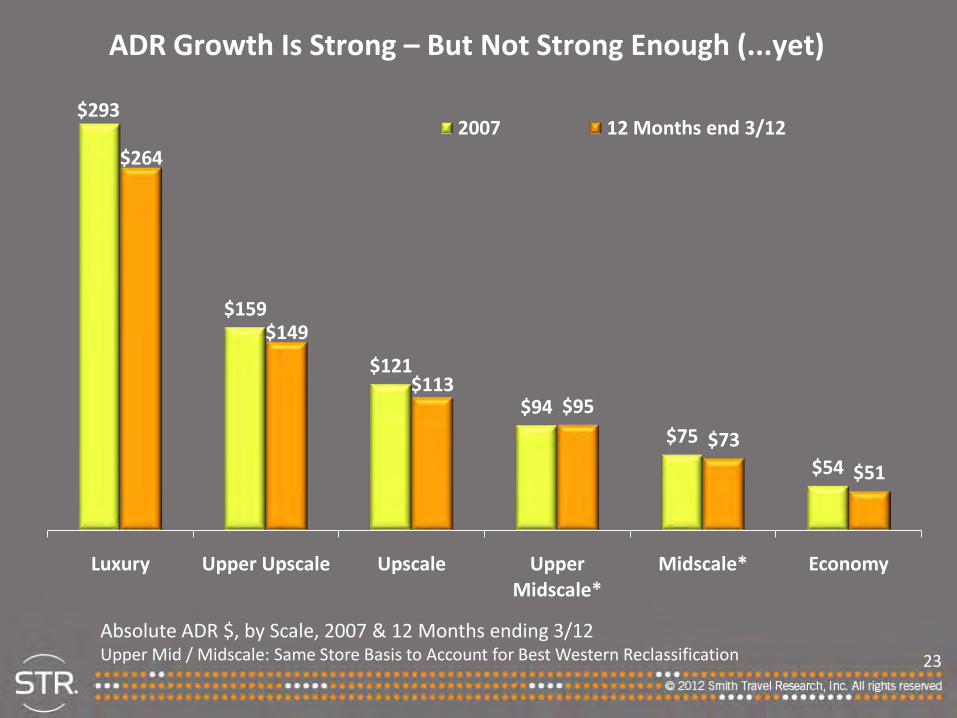
ADR Growth Is Strong – But Not Strong Enough (...yet)
$293
$159
$121
$94$75
$54
$264
$149
$113$95
$73
$51
Luxury Upper Upscale Upscale Upper Midscale*
Midscale* Economy
2007 12 Months end 3/12
Absolute ADR $, by Scale, 2007 & 12 Months ending 3/12Upper Mid / Midscale: Same Store Basis to Account for Best Western Reclassification

24
Market Overview
25
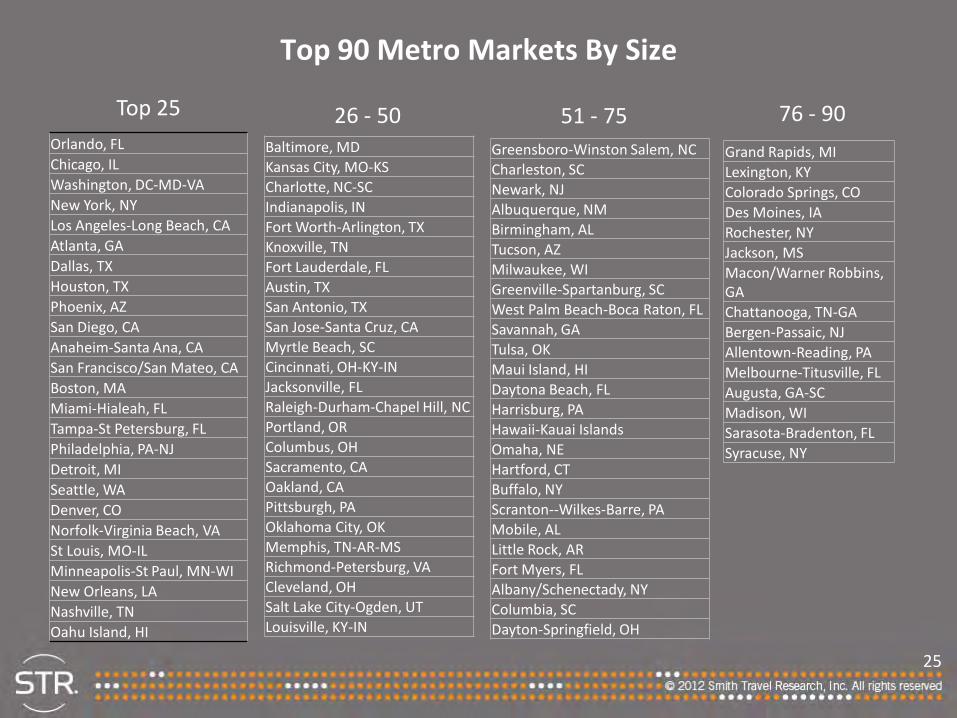
Orlando, FLChicago, ILWashington, DC-MD-VANew York, NYLos Angeles-Long Beach, CAAtlanta, GADallas, TXHouston, TXPhoenix, AZSan Diego, CAAnaheim-Santa Ana, CASan Francisco/San Mateo, CABoston, MAMiami-Hialeah, FLTampa-St Petersburg, FLPhiladelphia, PA-NJDetroit, MISeattle, WADenver, CONorfolk-Virginia Beach, VASt Louis, MO-ILMinneapolis-St Paul, MN-WINew Orleans, LANashville, TNOahu Island, HI
Baltimore, MDKansas City, MO-KSCharlotte, NC-SCIndianapolis, INFort Worth-Arlington, TXKnoxville, TNFort Lauderdale, FLAustin, TXSan Antonio, TXSan Jose-Santa Cruz, CAMyrtle Beach, SCCincinnati, OH-KY-INJacksonville, FLRaleigh-Durham-Chapel Hill, NCPortland, ORColumbus, OHSacramento, CAOakland, CAPittsburgh, PAOklahoma City, OKMemphis, TN-AR-MSRichmond-Petersburg, VACleveland, OHSalt Lake City-Ogden, UTLouisville, KY-IN
Greensboro-Winston Salem, NCCharleston, SCNewark, NJAlbuquerque, NMBirmingham, ALTucson, AZMilwaukee, WIGreenville-Spartanburg, SCWest Palm Beach-Boca Raton, FLSavannah, GATulsa, OKMaui Island, HIDaytona Beach, FLHarrisburg, PAHawaii-Kauai IslandsOmaha, NEHartford, CTBuffalo, NYScranton--Wilkes-Barre, PAMobile, ALLittle Rock, ARFort Myers, FLAlbany/Schenectady, NYColumbia, SCDayton-Springfield, OH
Grand Rapids, MILexington, KYColorado Springs, CODes Moines, IARochester, NYJackson, MSMacon/Warner Robbins, GAChattanooga, TN-GABergen-Passaic, NJAllentown-Reading, PAMelbourne-Titusville, FLAugusta, GA-SCMadison, WISarasota-Bradenton, FLSyracuse, NY
Top 25 26 - 50 51 - 75 76 - 90
Top 90 Metro Markets By Size
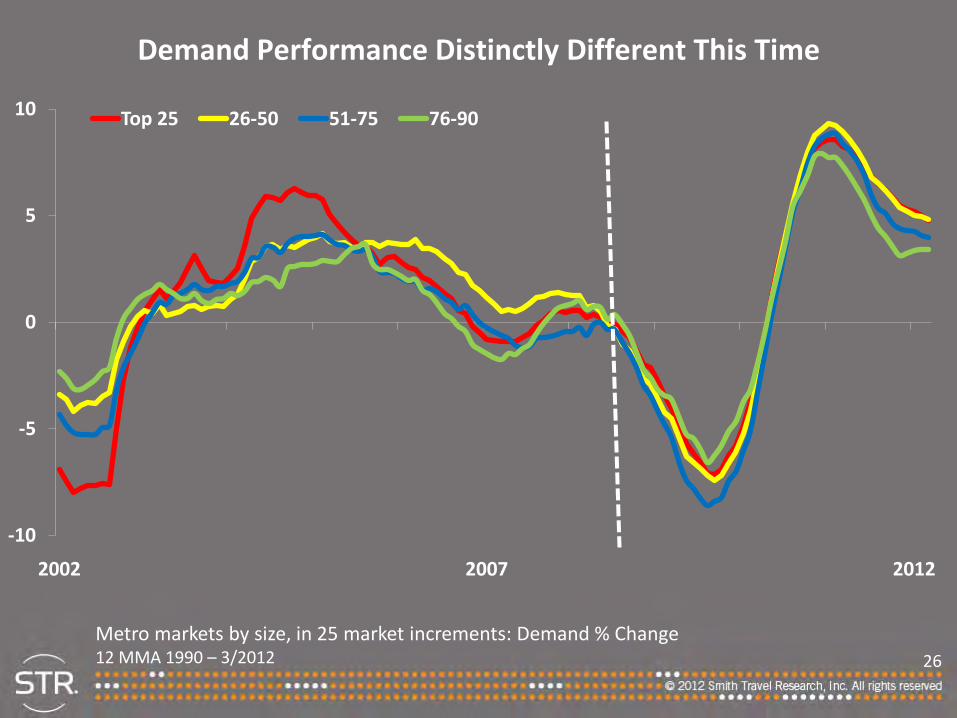
26
-10
-5
0
5
10
2002 2007 2012
Top 25 26-50 51-75 76-90
Demand Performance Distinctly Different This Time
Metro markets by size, in 25 market increments: Demand % Change 12 MMA 1990 – 3/2012
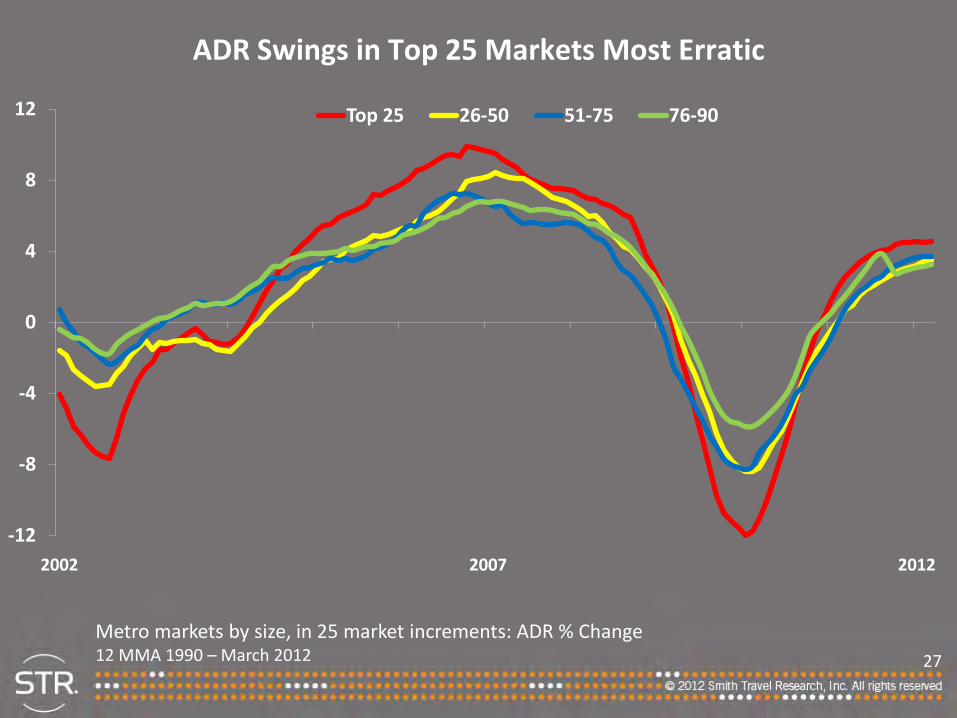
27
-12
-8
-4
0
4
8
12
2002 2007 2012
Top 25 26-50 51-75 76-90
ADR Swings in Top 25 Markets Most Erratic
Metro markets by size, in 25 market increments: ADR % Change12 MMA 1990 – March 2012

28
Q1: OCC and ADR Gains Across The Board
Occ % Change ADR % ChangeAtlanta 2.6 2.7Boston 4.8 7.0Chicago 8.0 6.0Dallas 1.1 -5.0
LA 3.7 3.2Miami 2.4 9.3
NYC 5.8 1.6Oahu 5.2 10.1
Orlando 3.2 3.5Phoenix -1.2 4.3
San Diego 4.4 1.6SF 2.9 11.7DC 0.5 -2.0
Top 25 Markets 3.8 4.1All Other Markets 3.8 3.8Total United States 3.8 4.0

29
Supply Pipeline
30
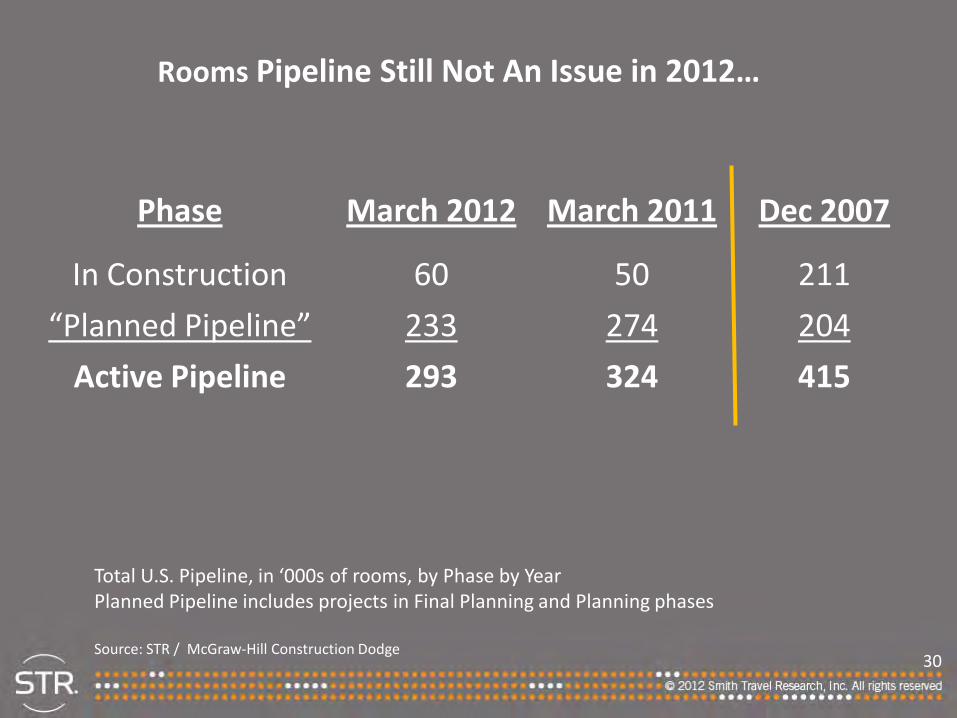
Rooms Pipeline Still Not An Issue in 2012…
Phase March 2012 March 2011 Dec 2007
In Construction 60 50 211
“Planned Pipeline” 233 274 204
Active Pipeline 293 324 415
Total U.S. Pipeline, in ‘000s of rooms, by Phase by YearPlanned Pipeline includes projects in Final Planning and Planning phases
Source: STR / McGraw-Hill Construction Dodge
31
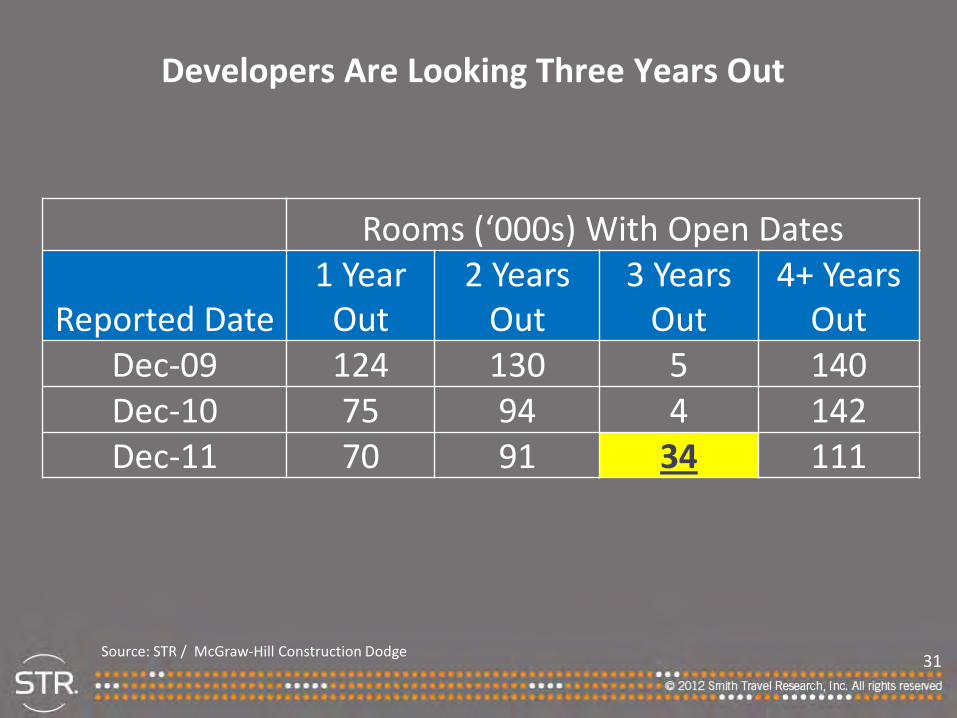
Rooms (‘000s) With Open Dates
Reported Date1 Year
Out2 Years
Out3 Years
Out4+ Years
OutDec-09 124 130 5 140Dec-10 75 94 4 142Dec-11 70 91 34 111
Developers Are Looking Three Years Out
Source: STR / McGraw-Hill Construction Dodge
32
Takeaways
Improving economy – 2H 2012 stronger?
Low supply growth - most markets
Demand growth, but slower
Climb out continues

33
Thank you!
www.hotelnewsnow.comClick on “Hotel Data Presentations”