university of technology dr louay a.mahdi department...
TRANSCRIPT

University of Technology Dr. louay A.Mahdi Department of Mechanical Engineering
Branches: General, Refrigeration and Air conditioning, Vehicles Measurements Forth class 2014– 2015 Measurement of velocity 8
------------------------------------------------------------------------------------------------------------------------------------------
1

University of Technology Dr. louay A.Mahdi Department of Mechanical Engineering
Branches: General, Refrigeration and Air conditioning, Vehicles Measurements Forth class 2014– 2015 Measurement of velocity 8
------------------------------------------------------------------------------------------------------------------------------------------
2
Definition: Linear Velocity is distance/time (mm/time, cm/time, m/time, km/hr)
Principles of fluid mechanics:
Shear stress and viscosity
There are three states of matter: solid, liquid and gas. Liquids and gases are different in many respects but
behave in the same way under the action of a deforming force. Liquids and gases, i.e. fluids, flow under the
action of a deforming force, whereas a solid retains its shape. The effect is illustrated in Figure 8.1(a), which
shows the effect of a shear force F on a rectangular block. The corresponding shear stress τ is the force per
unit area F/A, where A is the area of the base of the block.
The effect of τ is to deform the block as shown, and the resulting shear strain is quantified by the angle ∅. In a
solid ∅ will be constant with time and of magnitude proportional to τ. In a fluid ∅ will increase with time and the
fluid will flow.
Figure 8.1(b) shows a fluid flowing over a solid boundary, e.g. a flat plate. The fluid in contact with the plate
surface at y = 0 has zero velocity. As we move away from the plate, i.e. as y increases, the velocity v of the
layers increases, until well away from the plate the layers have the free stream velocity v0. The layers between
the free stream and the boundary are called boundary layers and are characterized by a velocity gradient
dv/dy. From fihure [8.1] we see that frictional shear stresses are present in these boundary layers.
Figure 8.1 Shear stress and viscosity: (a) Deformation caused by shearing forces (b) Velocity distribution in
boundary layers.
t
sv

University of Technology Dr. louay A.Mahdi Department of Mechanical Engineering
Branches: General, Refrigeration and Air conditioning, Vehicles Measurements Forth class 2014– 2015 Measurement of velocity 8
------------------------------------------------------------------------------------------------------------------------------------------
3
Liquids and gases:
Although liquids and gases have the common properties of fluids, they have distinctive properties of their own.
A liquid is difficult to compress, i.e. there is a very small decrease in volume for a given increase in pressure,
and it may be regarded as incompressible, i.e. density ρ is independent of pressure (but will depend on
temperature). Gases are easy to compress, and density depends on both pressure and temperature.
For an ideal gas we have:
P=ρ.R.T Equation of state for ideal gas
For real gases the above equation must be corrected by introducing an experimental compressibility factor or
gas law deviation constant.
The amount of heat required to raise the temperature of a gas by a given amount depends on whether the gas
is allowed to expand, i.e. to do work, during the heating process. A gas therefore has two specific heats:
specific heat at constant volume CV and specific heat at constant pressure CP. If the expansion or contraction
of a gas is carried out adiabatically, i.e.
Laminar and turbulent flow: Reynolds number
Experimental observations have shown that two distinct types of flow can exist.
The first is laminar flow, or viscous or streamline flow; this is shown for a circular pipe in Figure 8.2(a). Here
the particles move in a highly ordered manner, retaining the same relative positions in successive cross-
sections. Thus laminar flow in a circular pipe can be regarded as a number of annular layers: the velocity of
these layers increases from zero at the pipe wall to a maximum at the pipe center with significant viscous
shear stresses between each layer. Figure 12.2(a) shows the resulting velocity profile; this is a graph of layer
velocity v versus distance r of layer from center, and is parabolic in shape.
The second type of flow, turbulent flow, is shown in Figure 8.2(b). This is highly disordered; each particle
moves randomly in three dimensions and occupies different relative positions in successive cross-sections. As
a result, the velocity and pressure at a given point in the pipe are both subject to small random fluctuations
with time about their mean values. The viscous friction forces which cause the ordered motion in laminar flow
are much smaller in turbulent flow. Figure 8.2(b) shows a typical velocity profile for turbulent flow in a circular
pipe. It is obtained by taking a point r in the pipe and measuring the time average v of the velocity component,
along the direction of flow at that point.
The Reynolds number tells us whether the flow in a given situation is laminar or turbulent. It is the
dimensionless number:
Re=ρ.U.d/μ

University of Technology Dr. louay A.Mahdi Department of Mechanical Engineering
Branches: General, Refrigeration and Air conditioning, Vehicles Measurements Forth class 2014– 2015 Measurement of velocity 8
------------------------------------------------------------------------------------------------------------------------------------------
4
The Reynolds number represents the ratio of inertial forces (proportional to ρ.U.d) to viscous forces
(proportional to η); thus a low value of Re implies laminar flow and a high value turbulent flow. The following is
an approximate guide:
Re < 2 × 10³ – laminar flow
2 × 10³ < Re < 104 – transition region
Re > 104 – turbulent flow
Figure 8.2 Types of flow and velocity profiles in a circular pipe: (a) Laminar (b) Turbulent
Continuity: conservation of mass and volume flow rate:
Figure 7.3 shows a stream tube through which there is a steady flow; since conditions are steady the principle
of conservation of mass means that:
Mass of fluid entering in unit time = mass of fluid leaving in unit time
Conservation of mass flow rate: ṁ=ρ.U.A
Conservation of volume flow rate: Q=U.A
Figure 8.3 Conservation of mass flow rate in a stream
tube.

University of Technology Dr. louay A.Mahdi Department of Mechanical Engineering
Branches: General, Refrigeration and Air conditioning, Vehicles Measurements Forth class 2014– 2015 Measurement of velocity 8
------------------------------------------------------------------------------------------------------------------------------------------
5
Total energy and conservation of energy
Potential energy given by: Potential energy = m.g.z
Kinetic energy given by: Kinetic energy = 1/2 (mv-2)
Flow work is often referred to as pressure energy; this is the energy possessed by a fluid when moving
under pressure as part of a continuous stream. The total energy of a flowing fluid is the sum of pressure,
kinetic and potential energies, so that:
Fluid energy: Total energy/unit mass = 𝑝
𝜌+
1
2∙ 𝜈−2 + 𝑔𝑧
Conservation of energy – incompressible fluid:
Measurement of velocity at a point in a fluid
This is important in investigational work, such as studies of the velocity distribution around an aerofoil in a wind
tunnel, or measurement of the velocity profile in a pipe prior to the installation of a permanent flow meter.
There are two main methods.
Pitot-static tube
An obstruction type primary element used mainly for fluid velocity measurement is the Pitot tube.
Principle
Consider Fig. 8.4 which shows flow around a solid body. When a solid body is held centrally and stationary in
a pipeline with a fluid streaming down, due to the presence of the body, the fluid while approaching the object
starts losing its velocity till directly in front of the body, where the velocity is zero. This point is known as the
stagnation point. As the kinetic head is lost by the fluid, it gains a static head. By measuring the difference of
pressure between that at normal flow line and that at the stagnation point, the velocity is found out. This
principle is used in Pitot tube sensors.
Figure 8.4 Flow around a solid body

University of Technology Dr. louay A.Mahdi Department of Mechanical Engineering
Branches: General, Refrigeration and Air conditioning, Vehicles Measurements Forth class 2014– 2015 Measurement of velocity 8
------------------------------------------------------------------------------------------------------------------------------------------
6
The simplest Pitot tube consists of a tube with an impact opening of 3.125 mm to 6.35 mm diameter pointing
towards the approaching fluid. This measures the stagnation pressure. An ordinary upstream tap can be used
for measuring the line pressure.
A common industrial type of Pitot tube consists of a cylindrical probe inserted into the air stream, as shown in
Fig. 8.4. Fluid flow velocity at the upstream face of the probe is reduced substantially to zero. Velocity head is
converted to impact pressure, which is sensed through a small hole in the upstream face of the probe. A
corresponding small hole in the side of the probe senses static pressure. A pressure instrument measures the
differential pressure, which is proportional to the square of the stream velocity in the vicinity of the impact
pressure sensing hole. The velocity equation for the Pitot tube is given by:
𝑣 = 𝐶𝑝𝑖𝑡𝑜𝑡 ∙ √2𝑔ℎ
Where Cpitot is the Pitot tube constant.
Figure 8.5 shows a typical Pitot tube which also shows the taps for sensing static pressure. The total pressure
developed at the point where the flow is stagnated is assumed to occur at the tip of a Pitot tube or at a specific
point on a bluff body immersed in the stream.
The Pitot tube causes practically no pressure loss in the flow stream. It is normally installed through a nipple in
the side of the pipe. It is frequently installed through an isolation valve, so that it can be moved back and forth
across the stream to establish the profile of flow velocity.
Certain characteristics of Pitot tube flow measurement have limited its industrial application. For true
measurement of flow, it is essential to establish an average value of flow velocity. To obtain this with a Pitot
tube, it is necessary to move the tube back and forth across the stream to establish the velocity at all points
and then to take an average. For high-velocity flow streams, it is required to provide necessary stiffness and
strength.
A tube inserted in a high-velocity stream has a tendency to vibrate and get broken. As a result, Pitot tubes are
generally used only in low-to-medium flow gas applications where high accuracy is not required.
Figure 8.5 Typical Pitot tube
University of Technology Dr. louay A.Mahdi Department of Mechanical Engineering
Branches: General, Refrigeration and Air conditioning, Vehicles Measurements Forth class 2014– 2015 Measurement of velocity 8
------------------------------------------------------------------------------------------------------------------------------------------
7
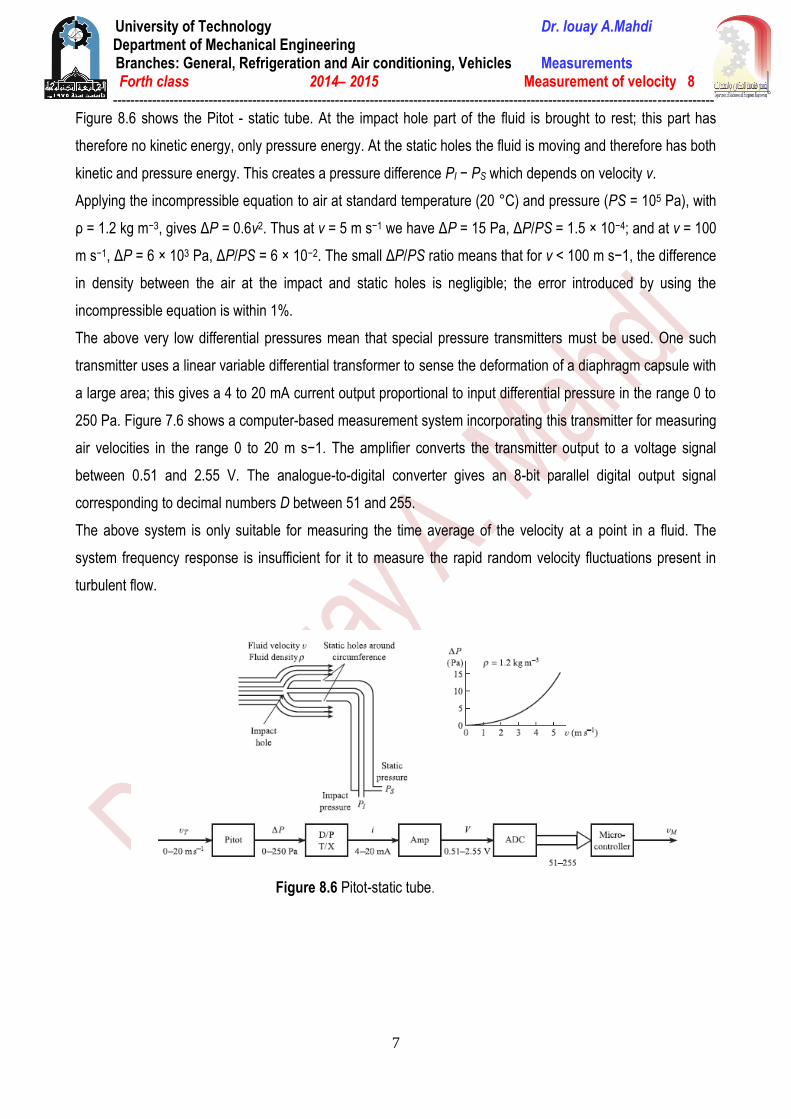
Figure 8.6 shows the Pitot - static tube. At the impact hole part of the fluid is brought to rest; this part has
therefore no kinetic energy, only pressure energy. At the static holes the fluid is moving and therefore has both
kinetic and pressure energy. This creates a pressure difference PI − PS which depends on velocity v.
Applying the incompressible equation to air at standard temperature (20 °C) and pressure (PS = 105 Pa), with
ρ = 1.2 kg m−3, gives ΔP = 0.6v2. Thus at v = 5 m s−1 we have ΔP = 15 Pa, ΔP/PS = 1.5 × 10⁻⁴; and at v = 100
m s−1, ΔP = 6 × 10³ Pa, ΔP/PS = 6 × 10⁻². The small ΔP/PS ratio means that for v < 100 m s−1, the difference
in density between the air at the impact and static holes is negligible; the error introduced by using the
incompressible equation is within 1%.
The above very low differential pressures mean that special pressure transmitters must be used. One such
transmitter uses a linear variable differential transformer to sense the deformation of a diaphragm capsule with
a large area; this gives a 4 to 20 mA current output proportional to input differential pressure in the range 0 to
250 Pa. Figure 7.6 shows a computer-based measurement system incorporating this transmitter for measuring
air velocities in the range 0 to 20 m s−1. The amplifier converts the transmitter output to a voltage signal
between 0.51 and 2.55 V. The analogue-to-digital converter gives an 8-bit parallel digital output signal
corresponding to decimal numbers D between 51 and 255.
The above system is only suitable for measuring the time average of the velocity at a point in a fluid. The
system frequency response is insufficient for it to measure the rapid random velocity fluctuations present in
turbulent flow.
Figure 8.6 Pitot-static tube.

University of Technology Dr. louay A.Mahdi Department of Mechanical Engineering
Branches: General, Refrigeration and Air conditioning, Vehicles Measurements Forth class 2014– 2015 Measurement of velocity 8
------------------------------------------------------------------------------------------------------------------------------------------
8
Hot Wire probes
INTRODUCTION
The hot-wire anemometer has been used extensively for many years as a research tool in fluid mechanics.
hot-wire anemometry will refer to the use of a small, electrically heated element exposed to a fluid medium for
the purpose of measuring a property of that medium. Normally, the property being measured is the velocity.
Since these elements are sensitive to heat transfer between the element and its environment, temperature and
composition changes can also be sensed.
Figure 8.7 shows a hot-wire anemometer probe. Typical dimensions of the wire sensor are 0.00015 to 0.0002
inches (0.0038 to 0.005 mm) in diameter and 0.040 to 0.080 inches (1.0 to 2.0 mm) long. This is the type of
hot wire that has been used for such measurements as turbulence levels in wind tunnels, flow patterns around
models and blade wakes in radial compressors. The film type of sensor is shown in Figure 7.8. The hot film is
used in regions where a hot wire probe would quickly break such as in water flow measurements.
Figure 8.7 hot wire Figure 8.8 hot film hot wire
Modes of anemometer operation:
Constant Current (CCA) Constant Temperature (CTA)
Hot wire can be using as a Constant Temperature Anemometer (CTA). It works based on the fact that the
probe’s resistance will be proportional to the temperature of the hot wire. The bridge circuit shown in Figure
8.9 below is set up by setting the adjustable resistor to the resistance you wish the probe and its leads to have
during operation. (The other two legs of the bridge have identical resistance.) The servo amplifier tries to keep
the error voltage zero (meaning the resistances of the two lower legs of the bridge match). It will adjust the
bridge voltage such that the current through the probe heats it to the temperature which gives the selected
resistance. When we put the probe in a flow, the air (or water) flowing over it will try to cool it. In order to
maintain the temperature (resistance) constant, the bridge voltage will have to be increased. A very fine hot

University of Technology Dr. louay A.Mahdi Department of Mechanical Engineering
Branches: General, Refrigeration and Air conditioning, Vehicles Measurements Forth class 2014– 2015 Measurement of velocity 8
------------------------------------------------------------------------------------------------------------------------------------------
9
wire by itself cannot respond to changes in fluid velocity at frequencies above about 500 Hz. By compensating
for frequency lag with a non-linear amplifier this response can be increased to values of 300 to 500 kHz.
Figure 8.9 Constant Temperature Anemometer (CTA)
Figure 8.10 Basic CTA Measuring Chain
Features
- Measures velocities from a few cm/s to supersonic.
- High temporal resolution: fluctuations up to several hundred kHz.
- High spatial resolution: eddies down to 1 mm or less.
- Measures all three velocity components simultaneously.
- Provides instantaneous velocity information.

University of Technology Dr. louay A.Mahdi Department of Mechanical Engineering
Branches: General, Refrigeration and Air conditioning, Vehicles Measurements Forth class 2014– 2015 Measurement of velocity 8
------------------------------------------------------------------------------------------------------------------------------------------
10
Principles of operation:
Consider a thin wire mounted to supports and exposed to a velocity U. When a current is passed
through wire, heat is generated (I2Rw). In equilibrium, this must be balanced by heat loss (primarily
convective) to the surroundings.
If velocity changes, convective heat transfer coefficient will change, wire temperature will change and
eventually reach a new equilibrium.
Figure 8.11

University of Technology Dr. louay A.Mahdi Department of Mechanical Engineering
Branches: General, Refrigeration and Air conditioning, Vehicles Measurements Forth class 2014– 2015 Measurement of velocity 8
------------------------------------------------------------------------------------------------------------------------------------------
11
PROBE TYPES
Hot-Wire Sensors
A hot-wires type sensor must have two characteristics to make it a useful device:
A high temperature coefficient of resistance
An electrical resistance such that it can be easily heated with an electrical current at practical voltage
and current levels.
The most common wire materials are tungsten, platinum and a platinum-iridium alloy. Tungsten wires are
strong and have a high temperature coefficient of resistance, (0.004/oC). However, they cannot be used at
high temperatures in many gases because of poor oxidation resistance. Platinum has good oxidation
resistance, has a good temperature coefficient (0.003/oC), but is very weak, particularly at high temperatures.
The platinum-iridium wire is a compromise between tungsten and platinum with good oxidation resistance, and
more strength than platinum, but it has a low temperature coefficient of resistance (0.00085/oC). Tungsten is
presently the more popular hot wire material. A thin platinum coating is usually applied to improve bond with
the plated ends and the support needles.
Hot-Film Sensors
The hot-film sensor is essentially a conducting film on a ceramic substrate. The sensor shown in Figure 7.8 is
a quartz rod with a platinum film on the surface. Gold plating on the ends of the rod isolates the sensitive
area and provides a heavy metal contact for fastening the sensor to the supports. When compared with hot
wires the cylindrical hot-film sensor has the following advantages:
Better frequency response (when electronically controlled) than a hot wire of the same diameter
because the sensitive part of the sensor is distributed on the surface rather than including the entire
cross section as with a wire. Although hot wires are typically much smaller in diameter.
Lower heat conduction to the supports (end loss) for a given length to diameter ratio due to the low
thermal conductivity of the substrate material. A shorter sensing length can thus be used.
More flexibility in sensor configuration. Wedge, conical, parabolic and flat surface shapes are
available.
Less susceptible to fouling and easier to clean. A thin quartz coating on the surface resists
accumulation of foreign material. Fouling tends to be a direct function of size.
The metal film thickness on a typical film sensor is less than 1000 Angstrom units, causing the physical
strength and the effective thermal conductivity to be determined almost entirely by the substrate material. Most
films are made of platinum due to its good oxidation resistance and the resulting long-term stability. The
ruggedness and stability of film sensors have led to their use for many measurements that have previously
been very difficult with the more fragile and less stable hot wires.

University of Technology Dr. louay A.Mahdi Department of Mechanical Engineering
Branches: General, Refrigeration and Air conditioning, Vehicles Measurements Forth class 2014– 2015 Measurement of velocity 8
------------------------------------------------------------------------------------------------------------------------------------------
12
Due to the fact that hot film probes are typically of a much larger diameter than wires, they will not
respond as quickly as a typical wire and therefore will not measure turbulent fluctuations at as high a
frequency as hot wires.
Advantages:
- Good Frequency response: Measurements to several hundred kHz possible, 1 MHz also feasible.
- Velocity Measurement: measures magnitude and direction of velocity and velocity fluctuations, Wide
velocity range
- Temperature Measurements
- Two Phase Flow: Measurements in flows containing continuous turbulent phase and distributed
bubbles.
- Signal to noise ratio: have low noise levels. Resolution of1 part in 10000 is accomplished.
- Signal Analysis: Output is continuous analogue signal, both time domain and frequency domain
analysis can be carried out. Output can also be processed by digital systems.
- Measurement of turbulent quantities like vorticity, dissipation rate etc.
Classification of Hot Wire Probes
On the basis of number of sensors:
Single Sensor Probe Dual Sensor Probe Triple Sensor Probe
Problem Sources:
Bubbles in Liquids: Effect of bubbling on portion of typical calibration curve
Eddy shedding: from cylindrical sensors occurs at Re ~50. Vibrations from prongs and probe
supports causes vibrate due to eddy shedding from them or due induced vibrations.
Temperature Variations.

University of Technology Dr. louay A.Mahdi Department of Mechanical Engineering
Branches: General, Refrigeration and Air conditioning, Vehicles Measurements Forth class 2014– 2015 Measurement of velocity 8
------------------------------------------------------------------------------------------------------------------------------------------
13
Anemometer
These anemometers have been used to measure air and gas flows in a variety of applications.
They are also used to measure the velocity of wet and dry gases.
Designs of Mechanical Anemometers:
1. Vane anemometer
2. three-cup anemometer
3. Impeller anemometer.
Vane Anemometer
Fig. 8.12 shows the vane-design. In this type, the vanes rotate in
response to airflow with the angular velocity of the vanes being
proportional to the wind speed. When a portable unit is required or
when the local readout is satisfactory, vane motion is passed to the
indicator through a gear and spring assembly. If the reading is to be
remote, a magnetically coupled or capacitive coupled pickup can be
used to generate a transmission signal.
Figure 8.12
Three-Cup Anemometer
Fig. 8.13 shows a three-cup anemometer. This type of anemometer is not
sensitive to the direction of the fluid. In this design the shaft drives a direct
current tachometer generator with an output voltage that is proportional to
the wind speed. This signal may be used to drive a remote mounted
indicator recorder.
Figure 8.13

University of Technology Dr. louay A.Mahdi Department of Mechanical Engineering
Branches: General, Refrigeration and Air conditioning, Vehicles Measurements Forth class 2014– 2015 Measurement of velocity 8
------------------------------------------------------------------------------------------------------------------------------------------
14
Impeller Anemometer
The impeller design is shown in Fig. 8.14. This anemometer also has a shaft-driven tachometer. Since the tail
on the impeller design always keep the impellers pointed into the wind, this instrument can be used to detect
both wind speed and wind direction. The speed of response for anemometer is given in meters of wind and is
known as distance constant.
Figure 8.14

University of Technology Dr. louay A.Mahdi Department of Mechanical Engineering
Branches: General, Refrigeration and Air conditioning, Vehicles Measurements Forth class 2014– 2015 Measurement of velocity 8
------------------------------------------------------------------------------------------------------------------------------------------
15
Angular velocity:
Definition: Angular Velocity is turn/time (r.p.m):
DC Tachometer (Angular Velocity):
The rotor is directly connected to the rotating object.
The output signal that is induced at the rotating coil is picked up using a commutator device (consists
of low resistance carbon brushes)
Commutator is stationary but makes contact with the split slip rings
Generated voltage is (Faraday’s Law)
Permanent Magnet AC Tachometer:
When the rotor is stationary or moving in a quasi-static manner the output voltage will be constant.
As the rotor moves, an additional voltage, proportional to the speed of the rotor will be induced.
The output is an amplitude modulated signal proportional to the rotor speed and demodulation is
necessary.
Direction is obtained from the phase angle.
Main advantage of AC tachometers is that they have no slip rings or brushes.
For low frequency applications (~5Hz), supply with 60Hz is adequate.
Sensitivity is in the range 50 – 100mV/rad/s.
t

University of Technology Dr. louay A.Mahdi Department of Mechanical Engineering
Branches: General, Refrigeration and Air conditioning, Vehicles Measurements Forth class 2014– 2015 Measurement of velocity 8
------------------------------------------------------------------------------------------------------------------------------------------
16
vo
S RP S N P
N
AC Induction Tachometer:
Similar in construction to an induction motor. Rotor windings are shorted.
The induced voltage in the rotor windings is a modulated signal of the supply. Modulation is due to the
speed of the rotor.
The output voltage on the secondary is a result of primary and rotor windings and is supply modulated
by the speed.
Main advantage of AC tachometers is that they have no slip rings or brushes
Photoelectric Tachometer:
Structure: A disk with reflecting markings attached to the shaft.
A light source and a light detector.
Output: a train of pulses whose frequency is proportional to shaft’s RPM.

University of Technology Dr. louay A.Mahdi Department of Mechanical Engineering
Branches: General, Refrigeration and Air conditioning, Vehicles Measurements Forth class 2014– 2015 Measurement of velocity 8
------------------------------------------------------------------------------------------------------------------------------------------
17
Strain Gauge Tachometer:
Structure: A thin rod with a bonded strain gauge attached. The end of the rod has
a small wheel that rests on the dist. attached to the shaft.
Output: A sinusoidal waveform whose frequency is proportional to the RPM.
Optical Sensor:
Structure: A light emitter and a light detector.

University of Technology Dr. louay A.Mahdi Department of Mechanical Engineering
Branches: General, Refrigeration and Air conditioning, Vehicles Measurements Forth class 2014 – 2015 Measurement of flow 9
------------------------------------------------------------------------------------------------------------------------------------------
1

University of Technology Dr. louay A.Mahdi Department of Mechanical Engineering
Branches: General, Refrigeration and Air conditioning, Vehicles Measurements Forth class 2014 – 2015 Measurement of flow 9
------------------------------------------------------------------------------------------------------------------------------------------
2
Introduction:
The material which is in a liquid or gaseous state, flow can be quantified as either the mass flow rate or the
volume flow rate, with the latter being the volume of material that flows in one unit of time. Of the two, a flow
measurement in terms of mass flow rate is preferred if very accurate measurement is required. The greater
accuracy of mass flow measurement arises from the fact that mass is invariant whereas volume is a variable
quantity.
Mass Flow Rate:
The method used to measure mass flow rate is determined by whether the measured quantity is in a solid,
liquid, or gaseous state, as different techniques are appropriate for each.
Conveyor-Based Methods:
Conveyor-based methods are appropriate for measuring the flow of solids in the form of powders or small
granular particles. Such powders and particles are produced commonly by crushing or grinding procedures in
process industries, and a conveyor is a very suitable means of transporting materials in this form. Transporting
materials on a conveyor allows the mass flow rate to be calculated in terms of the mass of material on a given
length of conveyor multiplied by the speed of the conveyor.
Coriolis Flow meter
As well as sometimes being known by the alternative name of inertial flow meter, the Coriolis flow meter is
often referred to simply as a mass flow meter because of its dominance in the mass flow meter market.
Coriolis meters are used primarily to measure the mass flow rate of liquids, although they have also been used
successfully in some gas-flow measurement applications. The flow meter consists either of a pair of parallel
vibrating tubes or as a single vibrating tube that is formed into a configuration that has two parallel sections.
The two vibrating tubes (or the two parallel sections of a single tube) deflect according to the mass flow rate of
the measured fluid that is flowing inside. Tubes are made of various materials, of which stainless steel is the
most common. They are also manufactured in different shapes, such as B shaped, D shaped, U shaped,
triangular shaped, helix shaped, and straight. These alternative shapes are sketched in Figure 9.1a, and a U-
shaped tube is shown in more detail in Figure 9.1b. The tubes are anchored at two points. An
electromechanical drive unit, positioned midway between the two anchors, excites vibrations in each tube at
the tube resonant frequency. Vibrations in the two tubes, or the two parallel sections of a single tube, are 180
degrees out of phase.

University of Technology Dr. louay A.Mahdi Department of Mechanical Engineering
Branches: General, Refrigeration and Air conditioning, Vehicles Measurements Forth class 2014 – 2015 Measurement of flow 9
------------------------------------------------------------------------------------------------------------------------------------------
3
The vibratory motion of each tube causes forces on the particles in the flowing fluid. These forces induce
motion of the fluid particles in a direction that is orthogonal to the direction of flow, which produces a Coriolis
force. This Coriolis force causes a deflection of the tubes that is superimposed on top of the vibratory motion.
Coriolis meters give excellent accuracy, with measurement uncertainties of ±0.2% being typical. They also
have low maintenance requirements. However, apart from being expensive (typical cost is $6000), they suffer
from a number of operational problems. Failure may occur after a period of use because of mechanical fatigue
in the tubes. Tubes are also subject to both corrosion caused by chemical interaction with the measured fluid
and abrasion caused by particles within the fluid. Diversion of the flowing fluid around the flow meter causes it
to suffer a significant pressure drop, although this is much less evident in straight tube designs.
Figure 9.1
University of Technology Dr. louay A.Mahdi Department of Mechanical Engineering
Branches: General, Refrigeration and Air conditioning, Vehicles Measurements Forth class 2014 – 2015 Measurement of flow 9
------------------------------------------------------------------------------------------------------------------------------------------
4
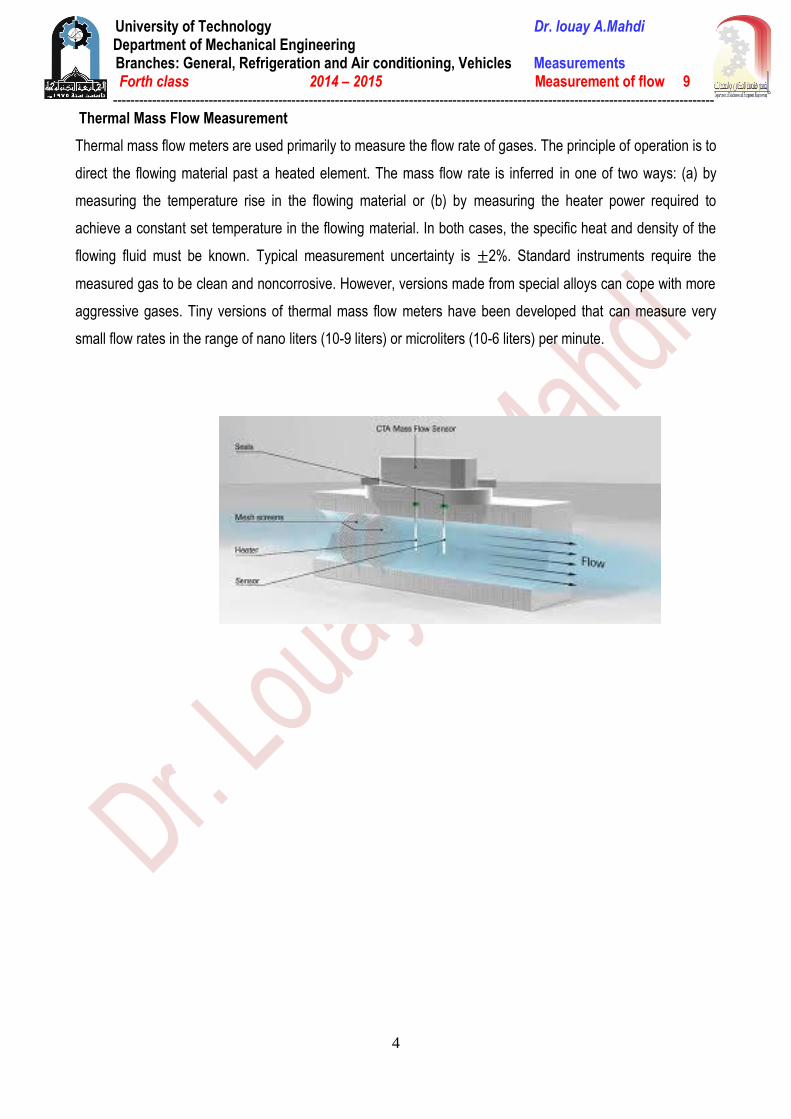
Thermal Mass Flow Measurement
Thermal mass flow meters are used primarily to measure the flow rate of gases. The principle of operation is to
direct the flowing material past a heated element. The mass flow rate is inferred in one of two ways: (a) by
measuring the temperature rise in the flowing material or (b) by measuring the heater power required to
achieve a constant set temperature in the flowing material. In both cases, the specific heat and density of the
flowing fluid must be known. Typical measurement uncertainty is ±2%. Standard instruments require the
measured gas to be clean and noncorrosive. However, versions made from special alloys can cope with more
aggressive gases. Tiny versions of thermal mass flow meters have been developed that can measure very
small flow rates in the range of nano liters (10-9 liters) or microliters (10-6 liters) per minute.

University of Technology Dr. louay A.Mahdi Department of Mechanical Engineering
Branches: General, Refrigeration and Air conditioning, Vehicles Measurements Forth class 2014 – 2015 Measurement of flow 9
------------------------------------------------------------------------------------------------------------------------------------------
5
Volume flow rate:
Volume flow rate is an appropriate way of quantifying the flow of all materials that are in a gaseous, liquid, or
semiliquid slurry form (where solid particles are suspended in a liquid host), although measurement accuracy
is inferior to mass flow measurement as noted earlier. Materials in these forms are usually carried in pipes,
and various instruments can be used to measure the volume flow rate as described later. As noted in the
introduction, these all assume laminar flow. In addition, flowing liquids are sometimes carried in an open
channel, in which case the volume flow rate can be measured by an open channel flow meter.
Variable Area Flow meters (Rotameters)
In the variable area flow meter (which is also sometimes known as a rotameter), the differential pressure
across a variable aperture is used to adjust the area of the aperture. The aperture area is then a measure of
the flow rate. The instrument is reliable, inexpensive, and used extensively throughout industry, accounting for
about 20% of all flow meters sold. Normally, because this type of instrument only gives a visual indication of
flow rate, it is of no use in automatic control schemes. However, special versions of variable area flow meters
are now available that incorporate fiber optics. In these, a row of fibers detects the position of the float by
sensing the reflection of light from it, and an electrical signal output can be derived from this.
In its simplest form, shown in Figure 9.2, the instrument consists of a tapered glass tube containing a float that
takes up a stable position where its submerged weight is balanced by the up thrust due to the differential
pressure across it. The position of the float is a measure of the effective annular area of the flow passage and
hence of the flow rate. The inaccuracy of the least expensive instruments is typically ±5%, but more
expensive versions offer measurement inaccuracies as low as±0.5%.
Figure 9.2

University of Technology Dr. louay A.Mahdi Department of Mechanical Engineering
Branches: General, Refrigeration and Air conditioning, Vehicles Measurements Forth class 2014 – 2015 Measurement of flow 9
------------------------------------------------------------------------------------------------------------------------------------------
6
Differential Pressure (Obstruction-Type) Meters
Differential pressure meters involve the insertion of some device into a fluid-carrying pipe that causes an
obstruction and creates a pressure difference on either side of the device. Such meters are sometimes known
as obstruction-type meters or flow restriction meters. Devices used to obstruct the flow include the orifice
plate, Venturi tube, flow nozzle, and Dall flow tube, as illustrated in Figure 9.3. When such a restriction is
placed in a pipe, the velocity of the fluid through the restriction increases and the pressure decreases. The
volume flow rate is then proportional to the square root of the pressure difference across the obstruction. The
manner in which this pressure difference is measured is important. Measuring the two pressures with different
instruments and calculating the difference between the two measurements is not satisfactory because of the
large measurement error that can arise when the pressure difference is small. Therefore, the normal
procedure is to use a differential pressure transducer, which is commonly a diaphragm-type device.
The Pitot static tube is another device that measures flow by creating a pressure difference within a fluid-
carrying pipe. However, in this case, there is negligible obstruction of flow in the pipe. The Pitot tube is a very
thin tube that obstructs only a small part of the flowing fluid and thus measures flow at a single point across
the cross section of the pipe. This measurement only equates to average flow velocity in the pipe for the case
of uniform flow. The an nubar is a type of multiport Pitot tube that measures the average flow across the cross
section of the pipe by forming the mean value of several local flow measurements across the cross section
of the pipe.
All applications of this method of flow measurement assume laminar flow by ensuring that the flow conditions
upstream of the obstruction device are in steady state; a certain minimum length of straight run of pipe ahead
of the flow measurement point is specified to achieve this. The minimum lengths required for various pipe
diameters are specified in standards tables. However, a useful rule of thumb widely used in process industries
is to specify a length of 10 times the pipe diameter. If physical restrictions make this impossible to achieve,
special flow-smoothing vanes can be inserted immediately ahead of the measurement point.
Flow restriction-type instruments are popular because they have no moving parts and are therefore robust,
reliable, and easy to maintain. However, one significant disadvantage of this method is that the obstruction
causes a permanent loss of pressure in the flowing fluid. The magnitude and hence importance of this loss
depend on the type of obstruction element used, but where the pressure loss is large, it is sometimes
necessary to recover the lost pressure by an auxiliary pump further down the flow line. This class of device is
not normally suitable for measuring the flow of slurries, as the tappings into the pipe to measure the differential
pressure are prone to blockage, although the Venturi tube can be used to measure the flow of dilute slurries.

University of Technology Dr. louay A.Mahdi Department of Mechanical Engineering
Branches: General, Refrigeration and Air conditioning, Vehicles Measurements Forth class 2014 – 2015 Measurement of flow 9
------------------------------------------------------------------------------------------------------------------------------------------
7
Figure 9.3
Figure 9.4 illustrates approximately the way in which the flow pattern is interrupted when an orifice plate is
inserted into a pipe. Other obstruction devices also have a similar effect to this, although the magnitude of
pressure loss is smaller. Of particular interest is the fact that the minimum cross-sectional area of flow occurs
not within the obstruction but at a point downstream of there.
Figure 9.4
Orifice plate
The orifice plate is a metal disc with a concentric hole in it, which is inserted into the pipe carrying the flowing
fluid. Orifice plates are simple, inexpensive, and available in a wide range of sizes. In consequence, they
account for almost 50% of the instruments used in industry for measuring volume flow rate. One limitation of
the orifice plate is that its inaccuracy is typically at least ±2% and may approach±5%. Also, the permanent
pressure loss caused in the measured fluid flow is between 50 and 90% of the magnitude of the pressure
difference, (P1-P2). Other problems with the orifice plate are a gradual change in the discharge coefficient
over a period of time as the sharp edges of the hole wear away and a tendency for any particles in the flowing
fluid to stick behind the hole, thereby reducing its diameter gradually as the particles build up. The latter
problem can be minimized by using an orifice plate with an eccentric hole. If this hole is close to the bottom of

University of Technology Dr. louay A.Mahdi Department of Mechanical Engineering
Branches: General, Refrigeration and Air conditioning, Vehicles Measurements Forth class 2014 – 2015 Measurement of flow 9
------------------------------------------------------------------------------------------------------------------------------------------
8
the pipe, solids in the flowing fluid tend to be swept through, and buildup of particles behind the plate is
minimized.
A very similar problem arises if there are any bubbles of vapor or gas in the flowing fluid when liquid flow is
involved. These also tend to build up behind an orifice plate and distort the pattern of flow. This difficulty can
be avoided by mounting the orifice plate in a vertical run of pipe.
Venturis and similar devices
A number of obstruction devices are available that are specially designed to minimize pressure loss in the
measured fluid. These have various names such as Venturi, flow nozzle, and Dall flow tube. They are all much
more expensive than an orifice plate but have better performance. The smooth internal shape means that they
are not prone to solid particles or bubbles of gas sticking in the obstruction, as is likely to happen in an orifice
plate. The smooth shape also means that they suffer much less wear and, consequently, have a longer life
than orifice plates. They also require less maintenance and give greater measurement accuracy.
Venturi: The Venturi has a precision-engineered tube of a special shape. This offers measurement uncertainty
of only±1%. However, the complex machining required manufacturing it means that it is the most expensive of
all the obstruction devices discussed. Permanent pressure loss in the measured system is 10-15% of the
pressure difference (P1-P2) across it.
Dall flow tube: The Dall flow tube consists of two conical reducers inserted into a fluid carrying pipe. It has a
very similar internal shape to the Venturi, except that it lacks a throat. This construction is much easier to
manufacture, which gives the Dall flow tube an advantage in cost over the Venturi, although the typical
measurement inaccuracy is a little higher (±1.5%). Another advantage of the Dall flow tube is its shorter
length, which makes the engineering task of inserting it into the flow line easier. The Dall tube has one further
operational advantage in that the permanent pressure loss imposed on the measured system is only about 5%
of the measured pressure difference (P1-P2).
Flow nozzle: This nozzle is of simpler construction still and is therefore less expensive than either a Venturi or
a Dall flow tube, but the pressure loss imposed on the flowing fluid is 30-50% of the measured pressure
difference (P1-P2) across the nozzle.

University of Technology Dr. louay A.Mahdi Department of Mechanical Engineering
Branches: General, Refrigeration and Air conditioning, Vehicles Measurements Forth class 2014 – 2015 Measurement of flow 9
------------------------------------------------------------------------------------------------------------------------------------------
9
Differential pressure flow meter according to British standard Institution.

University of Technology Dr. louay A.Mahdi Department of Mechanical Engineering
Branches: General, Refrigeration and Air conditioning, Vehicles Measurements Forth class 2014 – 2015 Measurement of flow 9
------------------------------------------------------------------------------------------------------------------------------------------
10
Pitot static tube
The Pitot static tube is used mainly for making temporary measurements of flow, although it is also used in
some instances for permanent flow monitoring. It measures the local velocity of flow at a particular point within
a pipe rather than the average flow velocity as measured by other types of flow meters. This may be very
useful where there is a requirement to measure local flow rates across the cross section of a pipe in the case
of non-uniform flow. Multiple Pitot tubes are normally used to do this.
Positive Displacement Flow meters
Positive displacement flow meters account for nearly 10% of the total number of flow meters used in industry
and are used in large numbers for metering domestic gas and water consumption. The least expensive
instruments have a typical inaccuracy of about±2%, but the inaccuracy in more expensive ones can be as low
as±0.5%. These higher quality instruments are used extensively within the oil industry; as such applications
can justify the high cost of such instruments.
All positive displacement meters operate using mechanical divisions to displace discrete volumes of fluid
successively. While this principle of operation is common, many different mechanical arrangements exist for
putting the principle into practice. However, all versions of positive displacement meters are low friction, low
maintenance, and long life devices, although they do impose a small permanent pressure loss on the flowing
fluid. Low friction is especially important when measuring gas flows, and meters with special mechanical
arrangements to satisfy this requirement have been developed.
Turbine Meters
A turbine flow meter consists of a multi-bladed wheel mounted in a pipe along an axis parallel to the direction
of fluid flow in the pipe, as shown in Figure 9.5. The flow of fluid past the wheel causes it to rotate at a rate
proportional to the volume flow rate of the fluid. This rate of rotation has traditionally been measured by
constructing the flow meter such that it behaves as a variable reluctance tachogenerator. This is achieved by

University of Technology Dr. louay A.Mahdi Department of Mechanical Engineering
Branches: General, Refrigeration and Air conditioning, Vehicles Measurements Forth class 2014 – 2015 Measurement of flow 9
------------------------------------------------------------------------------------------------------------------------------------------
11
fabricating the turbine blades from a ferromagnetic material and placing a permanent magnet and coil inside
the meter housing. A voltage pulse is induced in the coil as each blade on the turbine wheel moves past it, and
if these pulses are measured by a pulse counter, the pulse frequency and hence flow rate can be deduced. In
recent instruments, fiber optics are also now sometimes used to count the rotations by detecting reflections off
the tip of the turbine blades.
Provided that the turbine wheel is mounted in low-friction bearings, measurement inaccuracy can be as low as
±0.2%. However, turbine flow meters are less rugged and reliable than flow restriction-type instruments and
are affected badly by any particulate matter in the flowing fluid. Bearing wear is a particular problem, which
also imposes a permanent pressure loss on the measured system. Turbine meters are particularly prone to
large errors when there is any significant second phase in the fluid measured. For instance, using a turbine
meter calibrated on pure liquid to measure a liquid containing 5% air produces a 50% measurement error. As
an important application of the turbine meter is in the petrochemical industries, where gas/oil mixtures are
common, special procedures are being developed to avoid such large measurement errors.
Turbine meters have a similar cost and market share to positive displacement meters and compete for many
applications, particularly in the oil industry. Turbine meters are smaller and lighter than the latter and are
preferred for low-viscosity, high-flow measurements. However, positive displacement meters are superior in
conditions of high viscosity and low flow rate.
Figure 9.5
Electromagnetic Flow meters:
Electromagnetic flow meters, sometimes known just as magnetic flow meters, are limited to measuring the
volume flow rate of electrically conductive fluids. A typical measurement inaccuracy of around ±1% is
acceptable in many applications, but the instrument is expensive both in terms of the initial purchase cost and
in running costs, mainly due to its electricity consumption. A further reason for its high cost is the need for
careful calibration of each instrument individually during manufacture, as there is considerable variation in the
properties of the magnetic materials used.

University of Technology Dr. louay A.Mahdi Department of Mechanical Engineering
Branches: General, Refrigeration and Air conditioning, Vehicles Measurements Forth class 2014 – 2015 Measurement of flow 9
------------------------------------------------------------------------------------------------------------------------------------------
12
The instrument, shown in Figure 9.6, consists of a stainless-steel cylindrical tube fitted with an insulating liner,
which carries the measured fluid. Typical lining materials used are neoprene, polytetrafluoroethylene, and
polyurethane. A magnetic field is created in the tube by placing mains-energized field coils either side of it, and
the voltage induced in the fluid is measured by two electrodes inserted into opposite sides of the tube. The
ends of these electrodes are usually flush with the inner surface of the cylinder. The electrodes are
constructed from a material that is unaffected by most types of flowing fluids, such as stainless steel,
platinum–iridium alloys, Hastelloy, titanium, and tantalum. In the case of rare metals in this list, the electrodes
account for a significant part of the total instrument cost.
Figure 9.6
Vortex-Shedding Flow meters
The vortex-shedding flow meter is used as an alternative to traditional differential pressure meters in many
applications. The operating principle of the instrument is based on the natural phenomenon of vortex
shedding, created by placing an un stream lined obstacle (known as a bluff body) in a fluid-carrying pipe, as
indicated in Figure 9.7. When fluid flows past the obstacle, boundary layers of viscous, slow-moving fluid are
formed along the outer surface. Because the obstacle is not streamlined, the flow cannot follow the contours of
the body on the downstream side, and the separate layers become detached and roll into eddies or vortices in
the low-pressure region behind the obstacle. The shedding frequency of these alternately shed vortices is
proportional to the fluid velocity past the body. Various thermal, magnetic, ultrasonic, and capacitive vortex
detection techniques are employed in different instruments.
Such instruments have no moving parts, operate over a wide flow range, have low power consumption, require
little maintenance, and have a similar cost to measurement using an orifice plate. They can measure both
liquid and gas flows, and a common inaccuracy value quoted is ±1% of full-scale reading, although this can

University of Technology Dr. louay A.Mahdi Department of Mechanical Engineering
Branches: General, Refrigeration and Air conditioning, Vehicles Measurements Forth class 2014 – 2015 Measurement of flow 9
------------------------------------------------------------------------------------------------------------------------------------------
13
be seriously downgraded in the presence of flow disturbances upstream of the measurement point and a
straight run of pipe before the measurement point of 50 pipe diameters is recommended. Another problem with
the instrument is its susceptibility to pipe vibrations, although new designs are becoming available that have a
better immunity to such vibrations.
Figure 9.7
Ultrasonic Flow meters
The ultrasonic technique of volume flow rate measurement is, like the magnetic flow meter as show in figure
9.8, a noninvasive method. It is not restricted to conductive fluids, however, and is particularly useful for
measuring the flow of corrosive fluids and slurries. In addition to its high reliability and low maintenance
requirements, a further advantage of an ultrasonic flow meter over an electromagnetic flow meter is that the
instrument can be clamped externally onto existing pipework instead of being inserted as an integral part of
the flow line. As the procedure of breaking into a pipeline to insert a flow meter can be as expensive as the
cost of the flow meter itself, the ultrasonic flow meter has enormous cost advantages. Its clamp-on mode of
operation also has significant safety advantages in avoiding the possibility of personnel installing flow meters
coming into contact with hazardous fluids, such as poisonous, radioactive, flammable, or explosive ones. Also,
any contamination of the fluid being measured (e.g., food substances and drugs) is avoided. Ultrasonic meters
are still less common than differential pressure or electromagnetic flow meters, although usage continues to
expand year by year.
Two different types of ultrasonic flow meter exist that employ distinct technologies—one based on Doppler
shift and the other on trans it time. In the past, the existence of these alternative technologies has not always
been readily understood and has resulted in ultrasonic technology being rejected entirely when one of these
two forms has been found to be unsatisfactory in a particular application.
This is unfortunate because the two technologies have distinct characteristics and areas of application, and
many situations exist where one form is very suitable and the other is not. To reject both, having only tried out
one, is therefore a serious mistake. Ultrasonic flow meters have become available that combine both Doppler
shift and transit time technologies. Particular care has to be taken to ensure a stable flow profile in ultrasonic
flow meter applications.

University of Technology Dr. louay A.Mahdi Department of Mechanical Engineering
Branches: General, Refrigeration and Air conditioning, Vehicles Measurements Forth class 2014 – 2015 Measurement of flow 9
------------------------------------------------------------------------------------------------------------------------------------------
14
It is usual to increase the normal specification of the minimum length of straight pipe run prior to the point of
measurement, expressed as a number of pipe diameters, from a value of 10 up to 20 or, in some cases, even
50 diameters. Analysis of the reasons for poor performance in many instances of ultrasonic flow meter
application has shown failure to meet this stable flow profile requirement to be a significant factor. figure 8.8
Choice between Flow meters for Particular Applications
The number of relevant factors to be considered when specifying a flow meter for a particular application is
very large. These include the temperature and pressure of the fluid, its density, viscosity, chemical properties
and abrasiveness, whether it contains particles, whether it is a liquid or gas, etc. This narrows the field to a
subset of instruments that are physically capable of making the measurement. Next, the required performance
factors of accuracy, range ability, acceptable pressure drop, output signal characteristics, reliability, and
service life must be considered. Accuracy requirements vary widely across different applications, with
measurement uncertainty of ±5% being acceptable in some and less than ±0.5% being demanded in others.
Finally, economic viability must be assessed, which must take into account not only the purchase cost, but
also reliability, installation difficulties, maintenance requirements, and service life.
Where only a visual indication of flow rate is needed, the variable area meter is popular. Where a flow
measurement in the form of an electrical signal is required, the choice of available instruments is very large.
The orifice plate is used extremely commonly for such purposes and accounts for almost 50% of instruments
currently in use in industry. Other forms of differential pressure meters and electromagnetic flow meters are
used in significant numbers. Currently, there is a trend away from rotating devices, such as turbine meters and
positive displacement meters. At the same time, usage of ultrasonic and vortex meters is expanding.

University of Technology Dr. louay A.Mahdi Department of Mechanical Engineering
Branches: General, Refrigeration and Air conditioning, Vehicles Measurements Forth class 2014 – 2015 Measurement of flow 9
------------------------------------------------------------------------------------------------------------------------------------------
15
Calibration of Flow meters
The first consideration in choosing a suitable way to calibrate flow-measuring instruments is to establish
exactly what accuracy level is needed so that the calibration system instituted does not cost more than
necessary. In some cases, such as handling valuable fluids or where there are legal requirements as in petrol
pumps, high accuracy levels (e.g., error ±0.1%) are necessary and the expensive procedures necessary to
achieve these levels are justified. However, in other situations, such as in measuring additives to the main
stream in a process plant, only low levels of accuracy are needed (e.g., error ±5% is acceptable) and
relatively inexpensive calibration procedures are sufficient.
The accuracy of flow measurement is affected greatly by the flow conditions and characteristics of the flowing
fluid. Therefore, wherever possible, process flow-measuring instruments are calibrated on-site in their normal
measuring position. This ensures that calibration is performed in the actual flow conditions, which are difficult
or impossible to reproduce exactly in a laboratory. To ensure the validity of such calibration, it is also normal
practice to repeat flow calibration checks until the same reading is obtained in two consecutive tests. However,
it has been suggested that even these precautions are inadequate and that statistical procedures are needed.
If on-site calibration is not feasible or is not accurate enough, the only alternative is to send the instrument
away for calibration using special equipment provided by instrument manufacturers or other specialist
calibration companies. However, this is usually an expensive option. Furthermore, the calibration facility does
not replicate the normal operating conditions of the meter tested, and appropriate compensation for
differences between calibration conditions and normal use conditions must be applied.
The equipment and procedures used for calibration depend on whether mass, liquid, or gaseous flows are
being measured. Therefore, separate sections are devoted to each of these cases. It must also be stressed
that all calibration procedures mentioned in the following paragraphs in respect to fluid flow only refer to flows
of single phase fluids (i.e., liquids or gases).
Where a second or third phase is present, calibration is much more difficult and specialist advice should be
sought from the manufacturer of the instrument used for measurement.
Calibration Equipment and Procedures for Mass Flow-Measuring Instruments
Where the conveyor method is used for measuring the mass flow of solids in the form of particles or powders,
both mass-measuring and velocity-measuring instruments are involved. In the case of Coriolis and thermal
mass flow meters, the usual method of calibrating these while in situ in their normal measurement position is
to provide a diversion valve after the meter. During calibration procedures, the valve is opened for a measured
time period to allow some of the fluid to flow into a container that is subsequently weighed. Alternatively, the
meter can be removed for calibration using special test rigs normally provided by the instrument manufacturer.

University of Technology Dr. louay A.Mahdi Department of Mechanical Engineering
Branches: General, Refrigeration and Air conditioning, Vehicles Measurements Forth class 2014 – 2015 Measurement of flow 9
------------------------------------------------------------------------------------------------------------------------------------------
16
Calibration Equipment and Procedures for Instruments Measuring Volume Flow Rate of Liquids:
Calibrated tank
Probably the simplest piece of equipment available for calibrating instruments measuring liquid flow rates is
the calibrated tank. This consists of a cylindrical vessel, as shown in Figure 9.9, with conical ends that facilitate
draining and cleaning of the tank. A sight tube with a graduated scale is placed alongside the final, upper,
cylindrical part of the tank, which allows the volume of liquid in the tank to be measured accurately. Flow rate
calibration is performed by measuring the time taken, starting from an empty tank, for a given volume of liquid
to flow into the vessel.
Because the calibration procedure starts and ends in zero flow conditions, it is not suitable for calibrating
instruments affected by flow acceleration and deceleration characteristics. This therefore excludes instruments
such as differential pressure meters (orifice plate, flow nozzle, Venturi, Dall flow tube, Pitot tube), turbine flow
meters, and vortex-shedding flow meters.
The technique is further limited to the calibration of low-viscosity liquid flows, although lining the tank with an
epoxy coating can allow the system to cope with somewhat higher viscosities. The limiting factor in this case is
the drainage characteristics of the tank, which must be such that the residue liquid left after draining has an
insufficient volume to affect the accuracy of the next calibration.
Figure 9.9
Orifice plate
A flow line equipped with a certified orifice plate is sometimes used as a reference standard in flow calibration,
especially for high flow rates through large-bore pipes. While measurement uncertainty is of the order of±1%
at best, this is adequate for calibrating many flow-measuring instruments.
Turbine meter
Turbine meters are also used as a reference standard for testing flow meters. Their main application, as for
orifice plates, is in calibrating high flow rates through large-bore pipes. Measurement uncertainty down to
±0.2% is attainable.