university of south bohemia, České bud ějovice institute
TRANSCRIPT

University of South Bohemia, České Budějovice Institute of Physical Biology, Nové Hrady
PhD thesis
Imaging of fluorescence emission signals from healthy and infected leaf tissues
Zuzana Benediktyová
Supervisor: Doc. RNDr. Ladislav Nedbal, Dr.Sc.
Institute of Systems Biology and Ecology v.v.i., Academy of Sciences of the Czech Republic
Zámek 136, 37333 Nové Hrady

i
Benediktyová Z,. 2009: Imaging of fluorescence emission signals from healthy and
infected leaf tissues. PhD thesis – 123 pages, University of South Bohemia, Institute
of physical biology, Nové Hrady, Czech Republic
Prohlašuji, že svoji disertační práci jsem vypracovala samostatně pouze s použitím
pramenů a literatury uvedených v seznamu citované literatury.
Prohlašuji, že v souladu s § 47b zákona č. 111/1998 Sb. v platném znění souhlasím se
zveřejněním své disertační práce, a to v nezkrácené podobě - v úpravě vzniklé
vypuštěním vyznačených částí archivovaných Ústavem fyzikální biologie JČU
v Nových Hradech elektronickou cestou ve veřejně přístupné části databáze STAG
provozované Jihočeskou univerzitou v Českých Budějovicích na jejích internetových
stránkách.
25.10.2009
RNDr. Zuzana Benediktyová

ii
List of publications
1. Benediktyová Z, Nedbal L (2009) Imaging of multi-color fluorescence
emission from leaf tissues. Photosynthesis Research, DOI 10.1007/s11120-
009-9498
2. Berger S., Benediktyová Z., Matouš K., Bonfig K., Mueller M., Nedbal L.
and Roitsch T. (2007) Visualization of dynamics of plant-pathogen interaction
by novel combination of chlorophyll fluorescence imaging and statistical
analysis: differential effects of virulent and avirulent strains of P. syringae and
oxylipins on A. thaliana. Journal of Experimental Botany 58 (4): 797-806 *
3. Vácha F., Sarafis V., Benediktyová Z., Bumba L., Valenta J., Vácha M.,
Sheue Ch-R. and Nedbal L. (2007) Identification of Photosystem I and
Photosystem II enriched regions of thylakoid membrane by optical
microimaging of cryo-fluorescence emission spectra and of variable
fluorescence. Micron. 38 (2): 170-175
4. Matouš K., Benediktyová Z., Berger S., Roitsch T. and Nedbal L. (2006)
Case study of combinatorial imaging: What protocol and what chlorophyll
fluorescence image to use when visualizing infection of Arabidopsis thaliana
by Pseudomonas syringae? Photosynthesis Research 90: 243-253
* two first authors contributed equally

iii
Nové Hrady, 25.10.2009
Prohlášení školitele o rozsahu podílu studenta na publikační činnosti
Prohlašuji, že RNDr. Zuzana Benediktyová se podílela na společných publikacích
přibližně v níže uvedeném rozsahu.
Benediktyová Z, Nedbal L (2009) Imaging of multi-color fluorescence emission
from leaf tissues. Photosynthesis Research, DOI 10.1007/s11120-009-9498 80%
Berger S., Benediktyová Z., Matouš K., Bonfig K., Mueller M., Nedbal L. and
Roitsch T. (2007) Visualization of dynamics of plant-pathogen interaction by novel
combination of chlorophyll fluorescence imaging and statistical analysis: differential
effects of virulent and avirulent strains of P. syringae and oxylipins on A. thaliana.
Journal of Experimental Botany 58 (4): 797-806 30%
Vácha F., Sarafis V., Benediktyová Z., Bumba L., Valenta J., Vácha M., Sheue Ch-
R. and Nedbal L. (2007) Identification of Photosystem I and Photosystem II enriched
regions of thylakoid membrane by optical microimaging of cryo-fluorescence
emission spectra and of variable fluorescence. Micron. 38 (2): 170-175 20%
Matouš K., Benediktyová Z., Berger S., Roitsch T. and Nedbal L. (2006) Case study
of combinatorial imaging: What protocol and what chlorophyll fluorescence image to
use when visualizing infection of Arabidopsis thaliana by Pseudomonas syringae?
Photosynthesis Research 90: 243-253 30%
Doc. RNDr. Ladislav Nedbal, Dr.Sc.

iv
Annotation
Auto-fluorescence emission of plant tissues can be a powerful reporter on plant
biochemistry and physiology since it originates in substances inherent to primary or
secondary metabolism. Plant bodies contain a plethora of intrinsic fluorescent
compounds emitting practically all wavelengths of visible light. Moreover, the
spectrum of fluorescent reporter signals was recently extended by a variety of
fluorescent proteins that provide a new tool to mark whole cells or sub-cellular
structures, study protein localization and monitor gene expression and molecule
interactions. The imaging of such fluorescence signals reveals a possibility to acquire
the information from as many as millions of points simultaneously, in vivo and in a
non-invasive way thereby preserving integrity of cells and whole organisms. Imaging
is particularly suited to visualize heterogeneity such as a localized immune response
to invading pathogens. It can be applied both at macro- as well as micro-scales in two
and three dimensions. The recent advancement in microscopy, the multi-photon
microscopy, has made possible to monitor fluorescence signals, such as NAD(P)H
fluorescence from intact leaf interior, that have been hidden to single-photon
techniques.
Anotace
Auto-fluorescence rostlinných pletiv může sloužit jako zdroj významných informací o
biochemických a fyziologických procesech probíhající v rostlinném organismu. Je
totiž vyzařována látkami vlastními rostlině, které jsou obvykle spjaty s primárním
nebo sekundárním metabolismem. Rostlinná těla jsou plná fluorescenčních sloučenin,
které vyzařují téměř v celém spektru viditelného a částečně i infračerveného záření.
Navíc byla tato bohatá škála fluorescenčních reporterů nedávno rozšířena o paletu
uměle vnesených fluorescenčních proteinů. Fluorescenční proteiny jsou novodobým
nástrojem, který umožňil geneticky značit celé buňky nebo jimi obsahované struktury,
studovat lokalizaci proteinů a monitorovat expresi genů nebo molekulární interakce.
Zavedení zobrazovacích technik k monitorování fluorescenčních signálů otevřelo
možnost získat informaci z milionů bodů současně. Neocenitelnou výhodou těchto

v
technik je jejich neinvazivní charakter, zachovávají integritu buněk i celého
organismu. Zobrazování je vhodné zejména k studiu prostorové heterogenity,
například lokalizovanou imunitní odpověď rostliny na pronikající patogen.
Zobrazovací metody můžou být použity na úrovni makroskopické nebo
mikroskopické, ve dvou nebo třech prostorových dimenzích. Současný pokrok
v mikroskopii a zvláště multifotonová mikroskopie otevřela možnost monitorovat
fluorescenční signály, které nejsou přístupné pro jednofotonové techniky. Jedným
z nich je NAD(P)H fluorescence z nitra intaktního listu.

vi
Acknowledgement
I would like to thank Ladislav Nedbal for providing me with new ideas, and
perspectives, inspiring me in profesional and private life, and many thanks especialy
for his holy patience with my wrighting skills. I am greatful to Pepa Lazár and Aleš
Holoubek for their scientific assistance, inspiring talks and all the motivation.
Furthermore, I would like to thank Julie Soukupová for her great help with finilizing
this document.
I would also like to thank to many people who entered to my life in Nové Hrady and
contributed to pleasant and frendly atmosphere around me: Franta Adamec, Víťa
Březina, Miluška Vochozková, Žaneta Princová, Karel Matouš, Radek Tesař, Zuzka
Rybárová, and Anamika Mishra. Thank you my friends. Special thanks belongs to my
mother, Margita Benediktyová, and Honza Dvořák for their support and love.

vii
Abbreviations
A0 Chl a cofactor of PSI
A1 phyloquinone of PSI
ATP adenosine-5’-triphosphate
BGF blue-green fluorescence
Chl chlorophyll
Chl a chlorophyll a
Chl b chlorophyll b
ChlF Chl a fluorescence
CP43 minor antenna chlorophyll-protein complex in PSII core
CP47 minor antenna chlorophyll-protein complex in PSII core
Cyt b6f cytochrome b6f
D1, D2 polypeptide D1 and D2 of PSII reaction center
DNA deoxyribonucleic acid
EGFP enhanced variant of green fluorescent protein, GFP-S65T
FAD flavin adenine dinucleotide
FMN flavin mononucleotide
FNR feredoxin-NADP reductase
FP fluorescence protein
F0 fluorescence intensity at the minimal level
FM fluorescence intensity at the maximal level
FP fluorescence in the peak of Kautsky curve
FS steady-state fluorescence level
FX, FA, FB iron-sulfur (Fe-S) clusters in PSI
gfp gene for GFP
GFP green fluorescence protein
HR hypersensitive response
LHC light harvesting complex
LHCI light harvesting complex of PSI
LHCII light harvesting complex associated with PSII
NADP nicotinamide adenine dinucleotide phosphate
OEC oxygen evolving complex

viii
PAR photosynthetically active radiation
PC plastocyanin
Pheo pheophytin
PS photosystem
PSI photosystem I
PSII photosystem II
P680 a pair of reaction center chlorophylls of PSII
P700 a pair of Chl a and Chl a’ in the reaction center of PSI
QA primary plastoquinone electron acceptor of PSII
QB secondary plastoquinone electron acceptor of PSII
QBH2 plastoquinol, double reduced QB of PSII
RC reaction center
TPM two-photon microscopy
UV ultraviolet
YZ tyrosine residue

1
TABLE OF CONTENTS
TABLE OF CONTENTS 1
OVERVIEW 3
THEORETICAL BACKGROUND 5
Intrinsic fluorophores in plants 6
Photosynthetic pigments and chlorophyll fluorescence 8
Chlorophylls 8
Carotenoids 10
Photosynthetic apparatus and photosynthesis 11
PSII and PSI under a lens 13
From molecules to in vivo fluorescence 14
Blue-green auto-fluorescent compounds of the leaf tissue 17
Plant phenolics 17
Nicotineamides and flavins 20
Blue-green fluorescence 21
Green fluorescent protein 24
RESULTS 27
1. Imaging of multicolor fluorescence emission from leaf tissues with single-
photon and two-photon excitation 28
2. Infection of Arabidopsis thaliana by the bacterium Pseudomonas syringae
monitored by green fluorescent protein emission 36
Introduction 37
Materials and Methods 39
GFP expression plasmids 39
Preparation of GFP transformed Pseudomonas 40
Visualization of GFP fluorescence from plates 45
Fluorescence spectroscopy 46

2
Microscopic analysis of gfp transformed strains 48
Imaging of chlorophyll fluorescence kinetics 49
Wide-field fluorescence microscopy of gfp expressing pathogen in leaves of A.
thaliana 49
Two-photon microscopy imaging 50
Results and Discussion 51
Expression of green fluorescent protein in P. syringae 51
Morphology of the gfp transformants 56
Pathogenicity and virulence 59
Plasmid burden 63
Dependence of fluorescence on the stage of growth 63
Plasmid stability under non-selective conditions 64
Visualization of P. syringae in planta 67
Heterogeneity of tissue response to virulent and avirulent strain of P. syringae
visualized in three dimensions 70
Conclusion 81
3. Chlorophyll fluorescence imaging, a tool for early pathogen detection 82
Case study of combinatorial imaging: What protocol and what chlorophyll
fluorescence image to use when visualizing infection of Arabidopsis thaliana by
Pseudomonas syringae? 84
Visualization of dynamics of plant-pathogen interaction by novel combination of
chlorophyll fluorescence imaging and statistical analysis: differential effects of
virulent and avirulent strains of P. syringae and oxylipins on A. thaliana. 96
4. Micro-imaging of photosynthetic activity 107
SUMMARY 114
REFERENCES 115

3
OVERVIEW
Plant tissues contain numerous fluorescence compounds that are involved in
primary or secondary metabolism. Thus, fluorescence emission can be a powerful
reporter on plant biochemistry and physiology. In this work, we present macroscopic
as well as microscopic fluorescence imaging approaches to various fluorescence
signals emanating from intrinsic auto-fluorophores as well as from green fluorescent
protein introduced into invading pathogenic bacteria.
The introduction into fluorescence of plant auto-fluorophores and fluorescent
proteins is reviewed in the chapter Theoretical background. Here, we summarize
a list of auto-fluorescent compounds found in plant tissue together with a short
description of chemical and optical properties of the most abundant classes of such
compounds. A special emphasis was placed on two main fluorescence reporter
signals: chlorophyll fluorescence and blue-green fluorescence.
The imaging of various fluorescence signals from intact leaf tissue at macro-
and micro-scales is discussed in the first Results chapter Imaging of multicolor
fluorescence emission from leaf tissues with single-photon and two-photon
excitation. A principal difference in information gathered using single-photon and
two-photon excitation is demonstrated on an example of blue-green auto-fluorescence
of healthy leaf tissue. We also demonstrate the capacity of two-photon microscopy for
visualization of GFP labeled pathogenic bacteria spreading in Arabidopsis thaliana
leaves.
In the chapter The potential use of green fluorescent protein for monitoring
infection process of P. syringae in A. thaliana, we demonstrate the power of the
combined imaging of auto-fluorescence emission from intrinsic plant fluorophores
with fluorescent protein introduced into the plant-invading pathogen. The pathogenic
bacteria were labeled with enhanced variant of the green fluorescent protein that made
possible to differentiate fluorescence signals from microbes and the plant. Spatial
interactions of different strains of Pseudomonas syringae, virulent and avirulent, were
examined in undisturbed leaf tissue by wide-field single-photon and scanning two-
photon microscopy.

4
Principles and experimental techniques of chlorophyll fluorescence imaging
are described in the chapter Chlorophyll fluorescence imaging, a tool for early
pathogen detection. The technique contributes to our better understanding of events
occurring in model plant Arabidopsis thaliana infected by hemibiotrophic pathogen
Pseudomonas syringae. Results are separated into two parts. In the first part, we
present a new data mining procedure which was developed to push the detection limit
of macroscopic imaging of whole leaves into very early times after the plant infection.
In the second part, the algorithm was applied to differentiate between effects of
virulent and avirulent Pseudomonas strains and to reveal a possible involvement of
signaling molecules.
The last chapter, Micro-imaging of photosynthetic activity, is dedicated to
microscopy that shifted the spatial resolution of chlorophyll fluorescence imaging
towards the cellular and sub-cellular level. The imaging of variable fluorescence was
used to identify PSII enriched regions in the thylakoid membrane of a giant
chloroplast of the shade plant Aglaonema simplex.

5
THEORETICAL BACKGROUND

6
Intrinsic fluorophores in plants
Plants contain a great amount of different pigments, which play a variety of
roles. They utilize sunlight and transform it to chemical energy in the process of
photosynthesis, perceive light signals as photoreceptors, and pigment flowers and
fruits to provide visual or olfactory signals for animals.
Some of the plant pigments possess ability to re-emit absorbed energy in the
form of fluorescence or phosphorescence. These are called fluorophores. Many
fluorescent substances have been reported in plants (Wolfbeis 1985; Rost 1995).
Table 1 lists abundant and representative fluorescent compounds found in plant
tissues. The most important pigments are described in further detail in the following
chapters.
Plant tissues are, in general, more strongly auto-fluorescent than animal tissues
(Rost 1995). Red fluorescence emanates from chloroplasts, blue and green can be
found in cell walls and vacuoles. These auto-fluorescence signals can be used as
powerful reporters on plant biochemistry and physiology (Buschmann et al. 2000)
Recently, spectrum of the fluorescence reporter signals was extended by an
advent of fluorescent proteins (FPs) (Rizzo and Piston 2004; Shaner et al. 2005). FPs
can be expressed in other organisms where they cause a spontaneous fluorescence
emission (Chalfie et al. 1994). The potential of this technology lies in the ability to
fuse FPs to proteins of interest and thus produce “molecular tags“ enabling to
visualize, track and quantify molecules and events in living cells. Since the discovery
of the original green fluorescence protein, many fluorescent variants with improved
spectral (Lippincott-Schwartz and Patterson 2003), folding and expression properties
have been yielded by mutagenic studies (Sawano and Miyawaki 2000). Nowadays,
protocols for FP applications in plants are also available (Berg and Beachy 2008).

7
Table 1 Plant auto-fluorophores
Chemical class Compound
Cyclic tetrapyroles Chlorophyll a, b
Simple phenolics Non-flavonoids
Phenolic acids salicilic acid, gentisic acid, ellagic acid
Hydroxycinamic acids ferulic acid, caffeic acid, sinapic acid, chlorogenic acid
Stilbenes Resveratrol
Chromones
Flavonoids
Flavonols kaempherol, quercetin
Flavones flavones
Isoflavones
Flavanones
Chalcones
Aurones
Coumarins coumarin, umbelliferone, esculetin, scopoletin
Furocumarins Psoralen
Poly-phenolics Lignans
Lignins
Tannins
Nicotineamides NADH, NADPH
Flavins FMN, FAD, riboflavin
Polyenes Phytofluene
Quinones Vitamin K
Folates folic acid, dihydrofolate
Alkaloids berberine, quinine, lysergic acid

8
Photosynthetic pigments and chlorophyll fluorescence
Pigments involved in the process of photosynthesis are usually denoted as
photosynthetic pigments. The photosynthetic pigments of higher plants comprise
chlorophylls (Chl) and carotenoids. Although, carotenoids are not fluorescent under
standard conditions, we included them to this chapter. Carotenoids function as
accessory pigments in photosynthetic apparatus funneling the energy of absorbed
photons to chlorophylls and thus contributing to chlorophyll fluorescence signal.
Chlorophylls
Chlorophyll is the most abundant pigment of leaves. Several chemical forms
exist but only chlorophyll a (Chl a) and chlorophyll b (Chl b) are found in higher
plants. Both, Chl a and b are mixed prenyllipids. They possess the isoprenoid phytyl
chain that gives them their hydrophobic character. The phytyl chain is esterified to the
carboxy group of non-isoprenoide porphyrine ring. The difference between Chl a and
b is small. The Chl a possesses a methyl group and the Chl b a formyl group at carbon
C-7 of the porphyrine ring (Figure 1A left panel). Although this is a minor structural
difference, only Chl a can act as primary donor of electron in photosynthesis. Chl b
functions solely as an accessory pigment. Interestingly, the ratio of Chl a / Chl b,
typicaly 3:1, was found to be a sensitive marker responding to growth conditions and
environmental factors such as light intensity (Lichtenthaler 1987).
The right panel in Figure 1A shows typical absorption and fluorescence
spectra of Chl a and Chl b in vitro (Blankenship 2002). There are two distinct
absorption bands in blue and red part of the visible spectrum. Positions of the two
major absorption maxima depend on a solvent assayed. They are shifted towards
longer wavelengths with increasing solvent polarity and water content (Lichtenthaler
1987). But in given solvent, peak maxima of Chl b lie always between those of Chl a.
The non-conventional two-band absorption spectrum can be explained by the “four-
orbital model“(Blankenship 2002). The two transitions to the excited state requiring
low energy are responsible for Q bands (red absorption) and two requiring high
energy are called B or Sorret bands (blue absorption). The fluorescence emission of
chlorophylls is shifted to longer wavelengths than the red absorption peak. It is

9
polarized along y-axis, as it is emitted from the Qy transition (Blankenship 2002). It is
a mirror image of the main Qy band. The spectral characteristics of Chl a and b
isolated in 100% water free acetone are summarized in Table 2.
Figure 1 Photosynthetic pigments: chemical formulas and absorption and emission spectra of
chlorophylls (A), and absorption spectra of carotenoids (B) in solution are compared with in vivo
excitation and emission spectra of 4 different leaves (C). Spectra of pigments were taken from
(Blankenship 2002) and (Lichtenthaler and Buschmann 2001). Fluorescence excitation and
emission spectra of leaves were measured using spectrofluorometer FluoroMax-4, Jobin Yvon –
Horiba. The excitation spectrum was determined at 730 nm and emission one was measured with
UV excitation of 360 nm.

10
Table 2 Spectroscopic properties of Chl a, Chl b, b-carotene, lutein, neoxanthin and violaxanthin
in 100 % acetone: absorption maximum λλλλmax, molar extinction coefficient εεεεmax, fluorescence
lifetime ττττf and fluorescence quantum yield φφφφf.
Pigment wta, (g mol-1) λmaxb, (nm)
εmax, (l mol-1 cm-1)
τf φf
Chl a 893.49 429.6; 661.6 100.4; 82.6b 6.1 nse 0.35e
Chl b 906.51 455.8; 644.8 131.8; 46.8b 3.6 nse 0.15e
β-carotene 536.9 453.2; 478.9 136.7; 110.7c
Lutein 568.9 447.4; 475.4 144.6d
Neoxanthin 600.9 415.6; 438.4; 467.0 134.3d
Violaxanthin 600.9 419.4; 442.6; 470.6 153.2d
100-300 fs from S2 to
S0g
f 10-4–10-5
Data taken from a International carotenoid society http://www.carotenoidsociety.org/, b
(Lichtenthaler 1987), c http://omlc.ogi.edu/spectra/PhotochemCAD/html/index.html, d (Croce et
al. 2000), e (Blankenship 2002), f (Frank et al. 1997), g (Polivka and Sundstrom 2004).
Carotenoids
Carotenoids belong to the most abundant pigments in nature. They are found
in all organisms because of their anti-oxidative properties. However, they can be
synthesized only by photosynthesizing organisms. Carotenoids occur in all green
tissues as well as in flowers (where they serve to attract animals), in storage organs, or
in other plant parts. Carotenoids which are involved in light harvesting in
photosynthesis are classified as primary, whereas others, found outside the
photosynthetically active tissue, are called secondary. The primary carotenoids are
present in all photosynthetic pigment-protein complexes. Their role in photosynthetic
apparatus is threefold. First, they are essential for proper folding of proteins and
stabilize their structures. Second, they contribute to efficiency of photosynthesis.
They harvest light of wavelengths where chlorophylls cannot absorb. Finally,
Carotenoids provide protection against excessive excitation via de-excitation of
chlorophyll directly or in xanthophyll cycle.
Carotenoids are chemically derived from tetraterpenoids made of several
isoprene subunits. Primary Carotenoids can be divided into two groups: (1) oxygen-
free carotenes (α− or β-carotene) and (2) oxygenated derivatives, xanthophylls
(lutein, zeaxanthin, violaxanthin). Xanthophylls contain oxygen in a form of hydroxyl

11
or epoxy group in a molecule. Chemical formulas of β-carotene, lutein, neoxanthin,
violaxanthin are shown in Figure 1B left part.
Although the group of primary Carotenoids comprises a lot of compounds,
they all exhibit similar absorption spectrum (Figure 1B) characterized by three
absorption maxima (violaxanthin, neoxanthin) or two maxima with one shoulder (β-
carotene, lutein). Positions of peaks are known to be shifted to shorter wavelengths
with increasing amount of oxygen or hydrophilic groups. In contrast, peaks are shifted
to longer wavelengths with increasing extent of conjugation (Polivka and Sundstrom
2004). The wide absorption spectrum is in the UV-blue spectral region 350 – 500 nm.
It represents the energy needed for S0–S2 transition which is the allowed electronic
transition in carotenoids. The S0-S1 electronic transition is forbidden for symmetry
reasons. The S0-S1 transition is allowed only under nonlinear two-photon absorption
that was widely used in two-photon spectroscopy to elucidate the light harvesting
contribution of carotenoids in photosynthetic pigment-protein complexes (Walla et al.
2000; Walla et al. 2002; Hilbert et al. 2004).
The lifetime of second excited state S2 is very short. It was reported in the
range of 100-300 fs (Polivka and Sundstrom 2004). This favors internal conversion
(lifetime < ps) to dominate over fluorescence. The radiative transition from S2 to S1 is
negligible too. Equally, the fluorescence makes negligible contribution to first excited
state decay (S1-S0) because of extremely weak absorption between these states.
However, most Carotenoids exhibit some weak fluorescence with the typical quantum
yields 10-4 – 10-5 (Frank et al. 1997). This emission is attributed to relaxation from S2
to the ground state. The S2 emission constitutes a mirror image (Onaka et al. 1999) of
the absorption spectrum with a typical Stokes shift 150-300 cm-1 (Polivka and
Sundstrom 2004).
Photosynthetic apparatus and photosynthesis
In vivo, both, chlorophylls and carotenoids are embedded in pigment-protein
complexes termed photosystems (PS). The photosystem II (PSII) and the photosystem
I (PSI) are found in thylakoid membrane of chloroplasts. The photosystems consist of
3 components: (1) reaction center (RC), (2) inner or core antenna, and (3) peripheral
antenna complex, also called light harvesting complex (LHC). Light energy of
incident photons is captured by pigment molecules in the antenna complexes which

12
pass the energy by electron resonance transfer along to adjacent pigments, sometimes
absorbing at a somewhat lower energy each step. Pigments absorbing at lower and
lower energy are organized towards the reaction center. Carotenoids can pass their
excitation energy to chlorophyll b that passes the energy further to chlorophyll a and,
finally, the exciton is captured by a molecule of primary donor sitting in reaction
center. Thus, the major function of antennas is to collect light and deliver absorbed
energy to the RC where primary photochemical reaction occurs.
Figure 2 Charge transporting chain of photosynthesis: The energy input of an absorbed photon is
needed to loosen an electron from P680 or P700. The electron is further transferred along a chain
of electron carriers that, in addition to PSI and PSII, contains another large membrane
complexes: cytochrome b6f (Cyt b6f), ATP synthase and mobile intersystem electron carriers:
plastoquinone QB and plastocyanin (PC). The QB is linking PSII and cyt b6f. The PC shuttles
between Cyt b6f and PSI. Finally, the electron is utilized to reduce a molecule of NADP+ to
NADPH. On the other side, the missing electron is replaced by a one extracted from a molecule of
reductant, water. Molecular oxygen is released as a by-product. In series of chemical reactions,
proton gradient is build across the thylakoid membrane. It is due to release of protons into
chloroplast lumen after water oxidation and due to proton transfer governed by plastoquinone
QB from stromal to luminal side. This transmembrane electrochemical potential gradient powers
ATP synthase to ATP production. ATP and NADPH are ultimately utilized in Calvin-Benson
cycle, where carbon is assimilated and carbohydrates are synthesized. Taken from
en.wikipedia.org/wiki/File:Thylakoid_mambrane.png.

13
PSII and PSI under a lens
PSII The structure of PSII core contains more than 20 proteins, 34 Chl molecules,
2 pheophytins a and 11 β-carotene molecules (Loll et al. 2005). PSII
framework is made of D1 (32 kDa) and D2 (34 kDa) heterodimeric protein
complex in which electron transporting intermediates are located. It is
flanked with the core antenna complex CP43 on D1 and CP47 on D2 side
and associated with a subset of minor antenna proteins CP29, CP26 and
CP24 on either side. In addition, each RC is associated with trimers of
peripheral antenna . The peripheral antenna of PSII (LHCII) is the most
abundant light harvesting complex. It consists of three transmembrane
helices that coordinate 7-8 Chl a, 5-6 Chl b and 2 molecules of carotenoids
(Standfuss et al. 2005). The carotenoid sites have the highest affinity to
lutein, however, also violaxanthin or neoxanthin can occupy these sites, but
in sub-stoichiometric amounts (Jennings et al. 1996). The role of carotenoid
in LHCII is twice: stabilizing and light harvesting. Carotenoids were shown
to be 50-80% as effective as chlorophyll a in light harvesting (Walla et al.
2000).
The excited molecule P680* is a strong reducing agent. It can easily loose
electron and reduce nearby acceptor pheophytin (Pheo). The electron further
moves towards the electron stabilizing acceptor QA, a plastoquinone tightly
bound to stromal side of D2 subunit (Figure 2). After two charge
separations, QA fully reduces one mobile molecule of QB docked to a
pocket-like binding site on D1. After uptake of two protons, QBH2 is
released into plastoquinone pool in the thylakoid membrane and replaced by
another oxidized molecule of QB from the pool. The P680+ reduced by
accepting an electron from the oxygen evolving complex (OEC) via a
tyrosine residue YZ. OEC is localized at the luminal side of PSII. After four
successive charge separations (turnovers of PSII), two water molecules are
oxidized and hence one O2 molecule and four H+ are released into the
lumen. PSII is the only known protein complex that oxidize water.

14
PSI PSI is composed of a core and an antenna LHCI ((Jensen et al. 2007). The
core contains of approximately 100 molecules of Chl a and 12-16 β-carotene
associated with 84 kDa heterodimeric protein core complex (PSI-A, PSI-B)
along with about ten additional proteins (Melis 1991; Blankenship 2002).
Only 4 Chl a molecules (P700 dimer and 2 A0 cofactors) participate in
electron transport in reaction center. Other Chl molecules perform light
harvesting. PSI core complex is monomeric in plants. Electron microscopy
indicates that 3-4 LHCI dimmers are attached to core monomer to assemble a
complex which contains 170-200 chlorophylls. Each LHCI monomer binds 8
Chl a, 2 Chl b and 3 cararotenoids. So LHCI contains substantially less Chl b
molecules.
In PSI reaction center, the electron carriers are organized in two symmetric
branches and charge separation may proceed along both of them. Primary
charge separation is initiated by excitation of the chlorophyll dimmer P700.
The electron passes along the electron-transfer chain consisting of a Chl a
cofactor (A0), a phyloquinone (A1) and three iron-sulfur (Fe-S) clusters (FX,
FA, FB). At stromal side, the electron is given by the cluster FB to soluble
protein ferredoxin and then transferred to NADP+ via feredoxin-NADP
reductase (FNR). The reaction cycle is completed by re-reduction of P700+ by
plastocyanin at the luminal side.
From molecules to in vivo fluorescence
Most photosynthetic pigments are known to emit fluorescence in a solution. In
vivo, however, it is the Chl a fluorescence (ChlF) from PSII that dominates the entire
emission at room temperature. It is accepted that the PSII contribution is up to 90 %,
although under specific conditions, some authors has reported a non-negligible
contribution from PSI (up to 30% in C3 plants and 50% in C4 plants) at Fo conditions
(Pfundel 1998). In the photosynthetic apparatus, chlorophyll b and carotenoids have a
role of accessory pigments that funnel energy they absorbed towards chlorophyll a
molecules sitting in the PSII reaction centers. Therefore, even UV illumination can be
used to induce PSII Chl a fluorescence emission (Error! Reference source not
found.C grey solid line). Although the ChlF emission in vivo is dominated by a
single source in PSII, it is spectrally heterogeneous. At room temperature, the major

15
fluorescence band is found at 683 – 685 nm with a vibrational satellite at 720 – 735
nm (Error! Reference source not found.C) (Govindjee 2004). At 77 K temperature,
Chl a in vivo fluorescence shows at least four emission bands at: 685 nm, 695 nm, 720
nm and 740 nm (Govindjee 2004). Most of infra-red bands were shown to belong to
the PSI reaction center (Mullet et al. 1980), except the peak at 685 nm which was
assigned to CP43 Chl a and the one at 695 nm to CP47 chlorophyll-protein complex
(Nakatani et al. 1984).
The ChlF originates in close vicinity to sites where light energy is transformed
into chemical energy. The same excitation states that give rise to fluorescence
emission also participate in photochemical energy conversion (Schreiber 2004). Light
energy absorbed by a leaf can be used to drive photosynthesis (photochemistry) and
some energy is dissipated as heat or re-emitted as fluorescence. These three processes
compete. Thus an increase in efficiency of one will result in a decrease in the yield of
the other two (Maxwell and Johnson 2000). Typically, ChlF represents only 1 or 2%
of energy of excitation (Maxwell and Johnson 2000).
Although, ChlF represents only a small part of total energy absorbed, it can be
easily measured using “pulse amplitude modulation (PAM)” measuring systems (for
review of the technique see (Schreiber 2004)). In modulated fluorometers, a
modulated light source is used to produce short measuring pulses. The fast detection
system is tuned to detect fluorescence only within these pulses. If the detection system
is reliably blocked against incident light, the relative fluorescence yield can be
measured in the presence of background illumination (ambient light or even sunlight
or a strong light pulse). This is of a great importance because ChlF exhibits kinetic
behavior depending on intensity and duration of incident actinic light.
When dark-adapted leaf is suddenly illuminated by actinic light, ChlF
increases up to 6 times. The fast rise from the minimal fluorescence level (F0) to the
maximum peak FM (or FP) is typically followed by slower fluorescence decline to a
stationary level (FS) over a time-scale of a few minutes. This fluorescence transient is
known as Kautsky effect (Govindjee 1995). It reflects the photochemical activity of
PSII. The fast fluorescence rise has been explained by reduction of the primary
quinone electron acceptor PSII, QA. Once QA accepts an electron generated in the
reaction center, it is not able to accept another one until the first electron is transferred
to the secondary electron carrier QB. During this period, the reaction center is termed
“closed” and the yield of photochemistry is reduced along with the increase in the

16
yield of fluorescence. Subsequent decline of fluorescence can be explained by
activation of photochemical and non-photochemical quenching mechanisms. The
photochemical quenching of ChlF is caused by increase in the rate at which electrons
are transferred away from PSII that is due to activation of enzymes involved in carbon
metabolism and opening stomata. The non-photochemical quenching is due to
increase in the efficiency with which energy is converted to heat.
Many experimental protocols which can probe photochemistry at different
time-scales are available nowadays (Nedbal and Koblížek 2006). These features
render Chl a fluorescence to be a unique indicator of photosynthesis.

17
Blue-green auto-fluorescent compounds of the leaf tissue
In addition to red and far-red chlorophyll fluorescence, leaves emit blue and
green fluorescence (BGF) in the spectral region 400-630 nm (Meyer et al. 2003).
ChlF attracted much more attention since the clear relationship of ChlF to
photosynthesis and particularly to carbon metabolism was shown (Kutsky et al.
1960). Low attention to BGF was caused by its fuzzy, heterogeneous origin with a
number of fluorophores contributing to the emission. This fact is indicated by a broad
excitation peak spanning UV-B (280-370 nm), UV-A to blue wavelengths (Johnson et
al. 2000). Compounds which are potential candidate contributors to BGF can be
divided into two groups: (1) plant phenolics located preferentially in the superficial
leaf compartments such as cell walls and vacuoles of the leaf epidermis, and (2)
nicotineamids and flavines that are directly related to the redox state of a plant cell.
Plant phenolics
Plant phenolics cover a large group of compounds which have one or more
hydroxyl groups attached directly to an aromatic ring. Solely fluorescent
representatives are listed in Table 1.
Phenolics are biosynthesized in the shikimic acid pathway (Taiz and Zeiger
1998) in which shikimic acid is the first intermediate with aromatic ring. Another
intermediates trans-cinamic acid and para-coumaric acid are direct precursors of the
most simple phenolics called phenylpropanoids, such as caffeic acid or ferulic acid
that contain one benzene ring. Simple propanoids are important building blocks for
more complex phenolics, such as lignin or flavonoids. Flavonoids are the largest class
of the plant phenolics. The basic flavonoid skeleton, diphenylpropene subunit, is
biosynthesized from products of shikimic acid and malonic acid (Figure 3) (Taiz and
Zeiger 1998). Based on the degree of oxidation of the three carbon bridge, flavonoids
are classified into several groups: flavones, flavonols, isoflavones, anthocyanins...
Another criterion for classification are substituted groups. Hydroxyl groups are
usually found in different positions of diphenylpropene subunit. Sugars are common
as well, most flavonoids are present as glycosidic conjugates (anthocyanins)
(Stobiecki et al. 2006). Both these substituents increase water-solubility in contrast to
methyl ether or isopentyl sidechain that makes flavonoids more lipophilic.

18
Plant phenolics are chemically heterogeneous and are involved in various
biochemical and physiological processes (Harborne and Williams 2000). Some are
involved in many interactions of plants with their biotic and abiotic environment.
Some phenolics serve, for instance, as signaling molecules attracting pollinators and
fruit dispersers, as defense compounds against pathogens (Padmavati and Reddy
1999; Jain and Nainawatee 2002; Treutter 2005; Yao et al. 2007), as predator
deterrents (Renwick et al. 2001; Onyilagha et al. 2004; Park et al. 2005) or simple
propanoids as caffeic acid or ferulic acid can have alelopatic effects and inhibit the
growth of neighboring plants. Polymerized phenolics like lignin function as
mechanical support. However, the most remarkable is their UV screening function
(Landry et al. 1995; Cockell and Knowland 1999).
Figure 3 Outline of phenolics biosynthesis: two major pathways are involved: the shikimic acid
pathway and the malonic acid pathway. In the shikimic acid pathway, simple carbohydrate
precursors from glycolysis and pentose phosphate pathway are converted to the aromatic amino
acids. Shikimic acid is one of the first intermediate. The next is phenylalanine, from which
cinamic acid is formed via elimination of ammonia group. The trans-cinamic acid is converted to
para-coumaric acid by the addition of hydroxyl group. It is a precursor of simple phenolic
compounds as caffeic and ferulic acid, coumarins and lignin. Subsequent product,
diphenylpropene subunit, is biosynthesized from products of shikimic acid (light grey ring B) and

19
malonate (dark grey ring A) pathways. It forms a basic flavonoid skeleton of flavones,
isoflavones, flavonols and anthocyanins (adapted from (Taiz and Zeiger 1998)).
Phenolics are very good absorbers thanks to the π-electron system in aromatic
structure. They cover a large part of UV wavelenghts (UV-A and UV-B). Cinamic
acid and especially its derivative ferulic acid covalently bind to cell wall
carbohydrates and their amount positively correlates with increasing exposure to UV-
A and UV-B radiation (Cockell and Knowland 1999). The absorption properties of
phenolics are modulated by side groups or simply by the size of their molecules. The
larger a molecule, the longer a absorbed wavelength (Cockell and Knowland).
Flavonoids absorb at longer wavelengths (UV-A to blue) than simple phenolics. They
are relatively poor UV-B absorbers, although their increased accumulation under UV-
B radiation was documented (Agati et al. 2002). However, flavonoids have been
shown to accumulate not only in epidermal layer but also in mesophyll of leaves
exposed to UV-B. They may scavenge reactive oxygen species generated in excess
light and, thus, play a key role in high light acclimation (Pietta 2000; Agati et al.
2007). Anthocyanins, a typical coloring content of cell vacuoles, are the least efficient
absorbers of UV radiation since their absorbance maximum is generally near 520 nm.
Their absorbance properties depend strongly on pH.
The fluorescence yield of phenolic compounds also depends on pH. For
instance, ferulic acid can be found in two ionic forms (pKa 4.4 and 9.0). It is poorly
fluorescent in an acidic environment (pH 2 – 4) where it is not ionized. Its form
carrying a single charge, occurring at pH 6 to 7, is two fold more fluorescent. The
excitation and emission maxima are around 290 – 310 nm and 420 nm, respectively.
The doubly ionized form is formed in an alkaline medium. It is the most fluorescent
with bathochromicaly shifted excitation peak to 345 nm and emission maximum to
470 nm at pH 10. This pH dependency has been successfully used to confirm the
presence of ferulic acid bound to cell walls in the assay of alkali treatment performed
under fluorescence microscopy with UV excitation (Lichtenthaler and Schweiger
1998). The solvent polarity is another factor affecting ionization degree of the
molecule. Yields of excitation and emission increase with increasing polarity.
Interestingly, the excitation maximum remained at the same wavelength but the
Stokes shift remarkably increased.

20
In contrast to strong absorption in UV and blue spectral region, flavonoid
fluorescence quantum yields in vitro are usually quite low (Agati et al. 2002)
compared to other leaf phenolics. Thus, their contribution to fluorescence measured at
the leaf surface in vivo can be negligible even though they accumulate in high
concentration under certain environmental condition (Cockell and Knowland 1999;
Agati et al. 2007).
Nicotineamides and flavins
Nicotinamid adenine dinucleotide (NAD(P)H) and flavins (FMN and FAD)
are well known intrinsic fluorophores in fluorescence microscopy. These compounds
are inherently related to the cellular metabolism. They are found in cells of all
organisms from unicellular bacteria through plants to animals where they function as
cofactors or coenzymes in many biosynthetic reactions. They are usually a source of
unwanted auto-fluorescence that “contaminates” fluorescence micrographs in a wide
spectral range 400 - 600 nm. However, (NAD(P)H) and flavins are also attracting
attention since they can be monitored as potential indicators of cellular metabolism
and redox processes.
Nicotinamide adenine dinucleotide NAD and its phosphate derivative NADP
are synthesized from nicotinamide (niacin, vitamin B3). NAD is the principal mobile
carrier of reducing equivalents between soluble dehydrogenase enzymes in cytosole
and the respiratory chain in mitochondria. NADP is located predominantly in
chloroplasts where it links the light and the dark phases of photosynthesis. The
reduced form, NAD(P)H, absorbs UV light strongly (Figure 4). The extinction
coefficient is 6220 M-1cm-1. It is highly fluorescent, with absorption and emission
maximum at 340 and 460 nm, respectively (Lakowicz 1999). The molecule is
fluorescent in reduced form. The oxidized form, NAD(P)+ is non-fluorescent. The
lifetime of NAD(P)H in aqueous solution is near 0.4 ns because fluorescence is
partially quenched by collisions or stacking with the adenine moiety. The quantum
yield and lifetime increase about three to fourfold upon binding to proteins. The usual
interpretation is that protein prevents contact between adenine and fluorophore group,
nicotinamide ring. NAD(P)H fluorescence has long been used as an indicator of
cellular metabolic state (Zipfel et al. 2003). It is possible to monitor the oxidation and
reduction of NADH in isolated mitochondria or even in intact tissues. Spectral and

21
time-resolved analysis of chloroplast gave strong evidence that NADPH is responsible
for most blue-green fluorescence of chloroplasts (Latouche et al. 2000).
Figure 4 Absorption and emission spectra of NAD(P)H and FAD (modified from (Lakowicz
1999))
Flavins and flavoproteins are other possible candidates for blue-green
fluorophores of chloroplasts (Latouche et al. 2000). The flavin mononucleotide
(FMN) and flavin adenine dinucleotide (FAD) are synthesised from dietary riboflavin
(vitamin B2). They have similar properties, although FMN lacks the whole AMP
moiety. It contains only flavin, ribitol (a sugar alcohol derived from ribose) and
phosphate. They are most commonly encountered as prosthetic groups, permanently
attached to enzymes involved in redox reactions, where they function as temporary
carriers of reducing equivalents as part of the catalytic mechanism. Flavins absorb
light in the visible range around 450 nm and emit yellow, around 525 nm (Figure 4)
with typical lifetimes 4.7 and 2.3 ns (Lakowicz 1999). Their oxidized forms are
brightly fluorescent, however become bleached when reduced. In contrast to
NAD(P)H, protein-bound forms have very low fluorescence quantum yields. This
may make difficulties to detect and resolve the contribution from mostly bound
flavins in leaf tissue (Latouche et al. 2000).
Blue-green fluorescence

22
Fluorescence emission spectrum of green leaves induced by UV excitation
extends through the whole visible spectrum. Typically, four emission characteristics
are described: blue band (440 nm), green shoulder (520 nm), red band (690 nm) and
far-red band (740 nm) (Buschmann et al. 2000). The red and far-red fluorescence is
exclusively emitted by chlorophyll a. In contrast, blue and green signal cannot be
assigned to a single fluorophore. It is a complex multi-fluorophore emission named
blue-green fluorescence (BGF).
There are two major differences between ChlF and BGF. (1) BGF is constant
on a short time scale (minutes) (Cerovic et al. 1999). The response to light quality and
quantity is manifested over longer periods hours or days). (2) In contrast to ChlF,
several compounds contribute to BGF upon UV excitation. In principle, plant
phenolics, especially hydroxycinamic acids, chromones, stilbenes, flavonoids, simple
phenolics, nicotinamides (NAD(P)H), flavins (FMN, FAD, riboflavin), folates and
some polyenes (phytofluen), quinines, alkaloids (quercetin, berberin), all can
contribute to blue-green emission when excited by UV. But although present in the
tissue, the contribution of certain compound to leaf BGF is affected by many factors.
It depends on localization of fluorophore in the leaf tissue, its concentration,
absorption spectrum, molar absorptivity, emission spectrum, fluorescence quantum
yield and physical and chemical micro-environment of fluorophore (Cerovic et al.
1999).
Leaf anatomy probably plays the most important role. It was shown that leaf
cuticle and epidermis has the strongest BGF. It was found that this BGF signal is
strongly dependent on phenolics composition. Cinamic acids (mainly ferulic acid)
covalently bound to the cell walls of epidermal cells were identified to be the major
blue-green fluorescing substances (Lichtenthaler and Miehe 1997; Lichtenthaler and
Schweiger 1998; Buschmann et al. 2000; Meyer et al. 2003). Phenolics in the cell
walls and soluble phenolics (quercetin or kempherol) present in the vacuole of
epidermal cells and cuticular wax are involved only to some degree since they are
weak fluorophores. The contribution of compounds present in internal structures (like
chloroplasts or mitochondria) to overall BGF of a leaf was estimated to be 3% in
spinach (Cerovic et al. 1994) and 10-15% in pea (Cerovic et al. 1998). It is reduced
due to attenuation of UV excitation through the UV absorbing leaf surface and re-
absorption of especially blue fluorescence by photosynthetic pigments (Cerovic et al.
1994). Only the contribution to green emission can be more significant. There exist
23
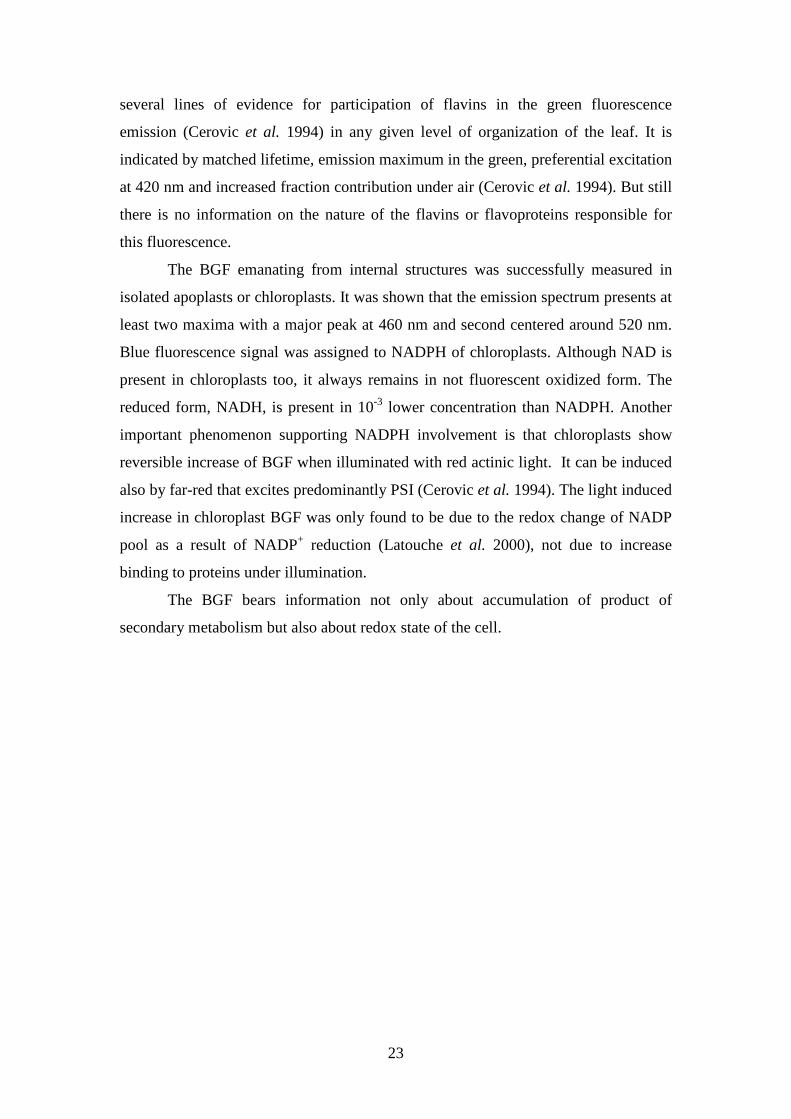
several lines of evidence for participation of flavins in the green fluorescence
emission (Cerovic et al. 1994) in any given level of organization of the leaf. It is
indicated by matched lifetime, emission maximum in the green, preferential excitation
at 420 nm and increased fraction contribution under air (Cerovic et al. 1994). But still
there is no information on the nature of the flavins or flavoproteins responsible for
this fluorescence.
The BGF emanating from internal structures was successfully measured in
isolated apoplasts or chloroplasts. It was shown that the emission spectrum presents at
least two maxima with a major peak at 460 nm and second centered around 520 nm.
Blue fluorescence signal was assigned to NADPH of chloroplasts. Although NAD is
present in chloroplasts too, it always remains in not fluorescent oxidized form. The
reduced form, NADH, is present in 10-3 lower concentration than NADPH. Another
important phenomenon supporting NADPH involvement is that chloroplasts show
reversible increase of BGF when illuminated with red actinic light. It can be induced
also by far-red that excites predominantly PSI (Cerovic et al. 1994). The light induced
increase in chloroplast BGF was only found to be due to the redox change of NADP
pool as a result of NADP+ reduction (Latouche et al. 2000), not due to increase
binding to proteins under illumination.
The BGF bears information not only about accumulation of product of
secondary metabolism but also about redox state of the cell.

24
Green fluorescent protein
Green fluorescent protein (GFP) is a small (27 kD) protein found in jellyfish
Aequorea victoria. It was first discovered by Shimomura et al. (Shimomura et al.
1962) when isolated as a companion protein to other blue-emitting protein, aequorin.
The aequorin is chemiluminescent, its emission is conditioned by the binding of Ca2+
ions. In contrast, GFP is fluorescent. In A. victoria, GFP fluorescence occurs when
aequorin interacts with Ca2+ ions inducing its blue glow which excites GFP.
GFP became the most widely used molecular probe since the discovery that
the expression of this gene in other organisms creates fluorescence (Chalfie et al.
1994). GFP is useful for examining biological phenomena because of its spontaneous
fluorescence. No subsequent fixing or staining or addition of exogenous cofactors is
required. It can be monitored in real time, in living tissue, non-destructively,
visualized by standard fluorescence microscopes.
The entire 27 kD structure of GFP is essential to the development and
maintenance of the protein fluorescence. Although, the pure chromophore consists of
only three neighbouring aminoacids Ser65, Tyr66 and Gly67 which can be a motif
widely found in nature, denatured GFP is not fluorescent. This implies that non-
covalent interactions of the chromophore with its local environment have a great
influence on the spectral characteristics and that fluorescence is mediated by amino
acids close to the chromophore in the tertiary structure. The sequence of Ser-Tyr-Gly
is located in the center of the barrel-like structure consisting of 11 β strands (Figure
5B) (Ormo et al. 1996). In this special environment, the carboxyl carbon of Ser65
reacts with the amino nitrogen of Gly67 that result in formation of imidazolin-5-one
ring. Maturation of the protein is completed by oxidation process resulting in
conjugation of imidazolin ring with Tyr66 (Figure 5C).
GFP emits green light under UV illumination. The excitation spectrum (Figure
5A) of the wild type GFP (blue line) has two excitation maxima at 395 nm and at 475
nm. Two excitation peaks originate from two states of chromophore which are in
special equilibrium. The prevalent protonated form is responsible for 395 nm peak.
Less abundant unprotonated form corresponds with 475 nm maximum. Regardless of
excitation, the fluorescence emission spectrum (green line in Figure 5A) has one, not
well defined peak at 507 nm.

25
Figure 5 (A) Absorption and emission spectra of wild type GFP (wtGFP): the absorption
spectrum (blue line) shows two bands: around 396 nm caused by the neutral form and one
around 476nm which is caused by the anionic form. The emission spectrum (green line) consists
of only one peak around 507 nm. The spectra were taken from (Chalfie et al. 1994). (B) 3-
dimensional bucket like structure of GFP with the chromophore shielded in the middle. C)
Maturation of the GFP fluorophore: carboxyl carbon of Ser65 forms the fluorophore with amino
nitrogen of Gly67 (the groups are highlighted by grey circle). The fluorophore exists in two
absorptive states. The protonated form absorbing at 395 nm predominates over the less prevalent
unprotonated form with 475 nm maximal absorption.
Since the discovery of GFP, a number of differently colored mutants have
been produced. They are generally, referred to as fluorescence proteins (FPs). The
most famous is the variant of GFP that differs from the wild type by single mutation,
having a threonine (Th65) instead of a serine (Ser65) at amino acid residue 65. The

26
GFP-S65T is an allele for “red shift” mutation. This GFP variant is known as
enhanced GFP (EGFP) with exceptional bright emission maximum at 510nm and
excitation maximum at 490nm.
More recently, fluorescence proteins from other species have been identified.
Spectral characteristics of numerous fluorescence pigments found in corals are listed
at http://www.advancedaquarist.com/2006/9/aafeature.

27
RESULTS

28
1. Imaging of multicolor fluorescence emission from
leaf tissues with single-photon and two-photon
excitation
Published:
Benediktyova Z. and Nedbal L. (2009) Imaging of multi-colour fluorescence emission
from leaf tissues. Photosynthesis Research, DOI 10.1007/s11120-009-9498
Abstract:
Multi-color fluorescence emission from leaf tissues is presented as a powerful
reporter on plant biochemistry and physiology that can be applied both at macro- and
micro-scales. The blue-green fluorescence emission is typically excited by ultraviolet
(UV) excitation. However, this approach cannot be applied in investigating intact leaf
interior because the UV photons are largely absorbed in the epidermis of the leaf
surface. This methodological barrier is eliminated by replacing the UV photon
excitation by excitation with two infra-red photons of the same total energy. We
demonstrate this approach by using two-photon excitation for microscopy of A.
thaliana leaves infected by pathogenic bacterium P. syringae. The leaf structures are
visualized by red chlorophyll fluorescence emission reconstructed in 3-D images
while the bacteria are detected by the green emission of engineered fluorescence
protein.
Souhrn:
Vícebarevná fluorescenční emise tkaniv listu je prezentována jako významný zdroj
informací o biochemii a fyziologii rostliny. Může být měřena makroskopicky nebo
mikroskopicky. Modrozelená fluorescenční emise je obvykle indukována UV
světlem. Tento přístup se nicméně nemůže uplatnit při zkoumání intaktního vnitřku

29
listu. Většina UV fotonů je totiž absorbována, povrchem listu, epidermem. Tuto
metodologickou bariéru je možné překonat nahrazením UV světla infračerveným
o stejné celkové energii. Dvoufotonová mikroskopie byla použita při mikroskopickém
zobrazování infekce Pseudomonas syringae v listech Arabidopsis thaliana. Struktury
listu byly charakterizovány na základě jejich červené, chlorofylové fluorescence.
Bakterie byly zobrazovány díky zelenému fluorescenčnímu proteinu. Prostorová
informace o struktuře listu a rozložení bakterií byla rekonstruována do 3D scény.

36
2. Infection of Arabidopsis thaliana by the bacterium
Pseudomonas syringae monitored by green fluorescent
protein emission
Abstract:
The plant pathogen P. syringae was labeled with green fluorescent protein. The gfp
gene was introduced in a plasmid and two strains, the virulent (DC3000) and the
avirulent (RPM1) bacteria were tagged by 3 different plasmid constructs. Phenotypes
of transformants were subjected to an examination. We tested how their viability,
ability to grow and multiply in vitro and in vivo and virulence were affected by the
insertion of the gfp gene and its expression. Other important features of the
transformants were their fluorescence brightness and stability of labeling in non-
selective conditions. Following the inoculation of the transformants into the plant
leaves, the infection process was visualized by fluorescence microscopy in situ and in
real time.

37
Introduction
Pseudomonas syringae is a global plant pathogen which infects most of higher
plants. Infected seeds are the primary disease source in the field conditions. Cold, wet
weather is important for pathogen survival, spreading and high disease incidence,
since these conditions promotes epiphytic growth on the leaf surface. Epiphytic
colonization precedes the endophytic invasion to the leaf tissue that only is believed
to induce the disease symptoms.
Bacteria enter leaf tissue through wounds or natural openings such as stomata.
In susceptible plants, virulent bacteria actively colonize the internal leaf tissue and
multiply to high population levels in intercellular spaces. This late phase is
accompanied by the appearance of the first symptoms, water-soaked lesions that
eventually become necrotic. In contrast, resistant plants recognize very early an
avirulent pathogen and the defense responses preventing its invasion and spreading,
such as accumulation of phytoalexins and stress signaling molecules, expression of
proteins with antimicrobial activity or cell wall strengthening and other are induced
(Hammond-Kosack and Jones 1996; Thomma et al. 1998). This, so-called,
incompatible interaction culminates in programmed cell death of the infected host
cells and eradication of the invader (Heath 2000). The endophytic growth dynamics
determines pathogenicity and virulence of a pathogen.
Assessment of the in planta growth of bacteria is typically done by counting
bacterial colonies extracted from leaf tissue plated on solid medium. Such monitoring
of population dynamics is slow, material-costly and tedious procedure. Several studies
reported using bioluminescence as a non-disruptive marker for monitoring bacterial
growth in situ (Paynter et al. 2006) or for tracing pathogen within a host plant or on a
plant surface (Shaw et al. 1992). The lux genes from Vibrio fischerii or Photorhabdus
luminescence were transfered to Xantomonas campestris and Pseudomonas syringae.
However, the bioluminescence depends strongly on cellular level of ATP. Bacteria
with low metabolic activity could not be detected resulting in underestimates. The
bioluminescence is a measure of metabolic activity rather than of cell viability and
multiplication (Paynter et al. 2006). The use of flourescence proteins such as green
fluorescent protein (GFP) can circumvent this problem.

38
Numerous reports describe the use of GFP to study dynamics and distribution
of various GFP labeled pathogens in different parts of plant body. GFP was
introduced into Rhizobium meliloti (Gage et al. 1996) to visualize distribution of
bacteria on root surface, infection of roots and subsequent nodulation. Bluemberg et
al. (Bloemberg et al. 1997) describes the construction of plasmids which
constitutively expressed the bright mutant of the GFP and were stably maintained in
Pseudomonas sp. in non-selective conditions of root surface of tomato seedlings.
Green fluorescent Ervwinia amylovora cells were observed in the xylene of apple
seedlings and then breaking out of the vessels into the intercellular spaces of the
adjacent parenchyma (Bogs et al. 1998). Colonization strategies and survival of
various pathogenic and non-pathogenic bacterial strains were investigated on the leaf
surface under different environmental conditions (Monier and Lindow 2003b; Monier
and Lindow 2003a; Sabaratnam and Beattie 2003). In majority of these reports, the
GFP labeled pathogens have been studied in chlorophyll free environment of roots or
plant surfaces. The visualization of GFP in leaf interior is problematic because of the
interference of chlorophyll emission with GFP fluorescence (Zhou et al. 2005). This
interference distorts the proportionality between the GFP content and the detected
levels of fluorescence, thus limiting the use of GFP as a quantitative reporter.
The objective of this study was to evaluate the potential of GFP as a marker
for bacterial colonization of leaf interior. We used wide-field epi-fluorescence
microscopy and two-photon microscopy of detached leaves to visualize P. syringae
labeled with bright variant of GFP (enhanced GFP). Three different plasmids carrying
the gene for GFP were introduced into the pathogen. Morphological observation,
cultural evaluation and pathogenicity test on Arabidopsis plants were done to test if
the gfp transformants maintained the characteristics of the wild-type strain and were
able to express the gfp gene in vitro and in vivo. Exploring the differences in
pathogenesis of virulent (DC3000) and avirulent (RPM1) strain of P. syringae at the
cellular level was of our particular interest.

39
Materials and Methods
GFP expression plasmids
The strains of P. syringae pv. tomato DC3000 (virulent strain) and RPM1 (avirulent
strain) were modified by introducing plasmids carrying the gene for wild-type GFP or
its enhanced variant EGFP. The plasmids used in our study were kindly provided by
Prof. Lindow (UC Berkeley, USA), Prof. Long (Stanford U., USA) and Prof. Roitsch
(Würzburg University, Germany). The list of plasmids is summarized in Table 1.
The plasmid pTB93G carried the gene encoding the wild type GFP. Other
plasmids contained enhanced GFP variant. In all cases, the gfp gene was put under the
control of strong promoters: nptII (plasmid pPNpt-Green) or trp promoter from
Salmonella typhimurium (plasmids pKT-trp, pTB93G and pTB93F). The promoter-
gfp transcriptional fusions were then cloned into the broad-host-range vectors:
pMB393 and pPROBE. Cloning into the plasmid pMB393 resulted in construction of
pTB93F and pTB93G plasmids. The pPROBE vector was used to construct plasmids
pKT-trp and pPNptGreen. Both vectors ensure constitutive expression in host
organisms. The pMB393 conferred the spectinomycin resistance (Gage et al. 1996).
The pPROBE conferred the kanamycin resistance and it was reported to be
maintained at approximately 5 – 10 copies per cell (Miller et al. 2000).
Table 1 List of gfp plasmids used for transformation
Plasmid Characteristics Source Citation
pTB93G ptrp-GFP in pMB393. Tcr, Spr Long S., Stanford (Gage et al. 1996)
pTB93F ptrp-GFP-S65Ta in pMB393. Spr, Cmr
Long S., Stanford (Gage et al. 1996)
PKT-trp ptrp-GFP-S65Ta in pPROBE-KT. Kmr
Lindow S., Berkeley (Hallmann et al. 2001)
PPNpt-Green nptII-GFP-S65Ta in pPROBE-KT. Kmr
Roitsch T., Wurzburg (Sabaratnam and Beattie 2003)
GFP-S65T - enhanced GFP, variant containing threonine instead of serine at amino acid residue 65
Cmr, Kmr, Spr, Tcr – conferred resistance to chloramphenicol, kanamycin, spectinomycin and tetracycline

40
Preparation of GFP transformed Pseudomonas
The plasmids were delivered cloned in Escherichia coli strains XL1Blue (pTB93G,
pTB93F) or DH5α (pKT-trp). Plasmid DNA had to be isolated first and then
transferred to P. syringae. The transformation was done by electroporation.
Plasmids isolation
The E. coli cells were grown overnight in 3 ml of LB Broth medium with appropriate
antibiotics (Table 2), shaking at 37ºC. Well grown overnight inoculum was further
diluted by fresh LB medium containing antibiotics and grown for one more night in
total volume of 100 ml.
LB Broth medium:
NaCl (Lachema, Brno, CZ) 10 g
Tryptone (Sigma, St.Louis, USA) 10 g
Yeast extract (Sigma, St.Louis, USA) 5 g
Add redistilled water to a final volume of 1 liter. Adjust pH to 7.0 with 5N NaOH and autoclave.
Table 2 Antibiotics
Antibiotics Stock solution Final concentration
Cm Chloramphenicol (Sigma-Aldrich) 50 mg / ml in ethanol 50 µg/ml
Km Kanamycin (Sigma-Aldrich) 50 mg / ml in H2O 100 µg/ml
Sp Spectinomycin (Sigma-Aldrich) 100 mg / ml in DMSO/H2O 50 µg/ml
Tc Tetracycline (Sigma-Aldrich) 10 mg / ml in ethanol 10 µg/ml
Plasmids were isolated from E.coli using Zyppy Plasmid Miniprep Kit (ZYMO
RESEARCH, www.zymoresearch.com). The procedure comprised DNA purification
step that was important for subsequent electroporation. The DNA for electroporation
had a very low ionic strength and a high resistance and hence it was purified by either
dilution or precipitation or dialysis. The Kit involved the Fast Spin column
technology that guaranteed isolation of high quality endotoxin-free plasmid DNA. All
steps were performed at room temperature according to the following protocol.

41
Plasmid DNA isolation
Add 600µl of bacteria culture grown in LB medium to a 1.5 ml eppendorf tube.
Add 100µl of 7x Lysis Buffer and mix by inverting tube 4 – 6 times. After addition of Lysis Buffer the
solution changes from opaque to clear blue, indicating complete cell lysis. Perform the step 2 within 2
minutes.
Add 350µl of cold Neutralization Buffer and mix thoroughly. The sample will turn yellow when the
neutralization is complete and a yellowish precipitate will form.
Centrifuge at 11000 – 16000 x g for 2 – 4 minutes.
Transfer the supernatant into the provided Zymo-Spin II column. Avoid disturbing the cell debris
pellet. The Fast-Spin column technology speeds up a purification step.
Place the column into the Collection Tube and centrifuge for 15 seconds.
Discard the flow-through and place the column back into the same Collection Tube.
Add 200µl of Endo-Wash Buffer to the column and centrifuge for 15 seconds.
Add 400µl of Zyppy Wash Buffer to the column and centrifuge for 30 seconds.
Transfer the column into the clean 1.5 ml eppendorf tube than add 30µl of Zyppy Elution Buffer (10
mM Tris-HCl, pH 8.5 and 0.1 mM EDTA) directly to the column matrix and incubate for 1 minute at
room temperature.
Centrifuge for 15 seconds to elute the plasmid DNA.
Agarose gel electrophoresis
The isolated DNA was examined using agarose gel electrophoresis. The technique is
based on the movement of negatively charged nucleic acid through the agarose gel
placed in the electric field. The migration rate depends on its molecular weight (a
number of base pairs). Moreover, DNA concentration can be indirectly estimated
from the fluorescence intensity of ethidium bromide staining. The minimal amount of
1ng/µl of isolated DNA is needed for further electroporation.
The mobility of linear DNA fragments is inversely proportional to the log10 of
their molecular weight. However, circular forms, plasmids, travel in agarose
differently comparing to linear DNAs of the same size. This is because the native
plasmid DNA occurs in at least two topologically different forms: the supercoiled
form which migrates more rapidly and the nicked circles that migrate slower. To
determine the correct size of plasmids, it was necessary to linearize them. As we had
maps of pTB93G (Figure 1A) and pTB93F and knew restriction sites, we digested

42
plasmids by restriction endonuclease enzyme Hind III which cuts a small fragment
containing gfp gene out of the 8kbp plasmid. In the case of pKT-trp we did not have a
map, so it was not cleaved.
Solutions for electrophoresis
TAE 50x stock solution:
Tris base 242 g
acetic acid 57.1 ml
0.5M EDTA (pH 8) 100 ml
add to 1 liter with deionized water
Ethidium bromide solution:
Ethidium bromide 10 mg/ml in distilled water
Loading buffer:
10mM Tris-HCl (pH 7.6),
0.03% bromophenol blue,
0.03% xylene cyanol FF,
60% glycerol, 60mM EDTA
Agarose gel electrophoresis
Prepare 1 % agarose gel: pour 0.5 g of agarose in 50 ml 1 x TAE buffer and heat until agarose is
completely dissolved and no smears are visible.
Cool the hot solution down to 50°C and add 1.5 µl of ethidium bromide solution. Mix gently to avoid
formation of bubbles.
Then, pour agarose solution into the gel cast cassette and place in appropriate combs.
After several minutes of polymerization, agarose gel can be used for electrophoresis.
Place gel to electrophoresis chamber and add 1x TAE until the gel is sufficiently covered.
Mix DNA samples with 1 µl of loading buffer and load it into individual slots in gel.
Run electrophoresis at 120 V for approximately 30 minutes.
Visualize resolved DNA fragments under UV trans-illumination lamp.

43
Restriction cleavage by Hind III (volume 20 µµµµl)
1. Mix 12.5 µl of sterile double deionized water with 2 µl of 10x restriction enzyme buffer 2 and 5
µl of isolated plasmid DNA.
2. Add 0.5 µl (5 U) of restriction enzyme Hind III and mix well by spinning down.
3. Incubate for 1.5 hour at 37°C in a chamber.
4. Resolve DNA fragments by agarose gel electrophoresis.
Figure 1 (A) The map of gfp expression plasmid pTB93G: the plasmid has approximately 8.0
kbp. The gfp gene is under the Salmonella typhimurium trp promoter (pTrp). pTrp-gfp fusion was
cloned into the broad-host range vector pMB393 which introduced a spectinomycin resistance
gene (Sp). Multiple restriction sites are shown around gfp gene (GFP). Plasmid pTB93F (not
shown) is identical to pTB93G except it contains a single base change which results in the GFP-
S65T mutation. (B) Gel electrophoresis of isolated plasmids: in the first and second lanes, DNA
with a known sizes was used as a reference (1.5kbp and 8kbp ladder markers). The sizes of
selected bands are indicated in number of base pairs (bp) on the left. Lanes 5, 6 and 7 consist of
uncut pTB93G, pTB93F and pKT-trp respectively. In lanes 3 and 4 are pB93G and pTB93F cut
by Hind III enzyme. Carved fragments are emphasized by the white circle. The gel was made of
1% agarose treated with intercalating, fluorescent agent ethidium bromide. Photograph was
done by transilluminating the gel with UV light to excite the pink fluoresce of ethidium bromide.
Figure 1B shows the agarose gel stained with ethidium bromide. Lanes 1 and 2
contain reference markers, lane 3 and 4 Hind III digested plasmids pTB93G and
pTB93F. Native forms of pTB93G, pTB93F and pKT-trp are in lanes 5, 6 and 7

44
respectively. As a reference, the 1.5 kbp and 8kbp standards were used. The former
one is a mixture of DNA fragments of 1.5kbp to 100bp length. The 8kbp standard
includes molecules of the size between 8kbp and 500bp. Enzyme Hind III incised
a fragment of about 700-800bp from pTB93G and pTB93F. The remaining parts of
both plasmids migrated as a smear in the zone between 6kbp and 7kbp. The digestion
was complete, no band referring to uncut plasmids was found. The native pTB93G
and pTB93F seemed to be occurring preferentially in supercoiled form migrating as
4kbp linear fragments, although their real size 8kbp. The pKT-trp might be presented
in several different topological forms while instead of a single band, DNA migrated as
a smear containing at least 2 different bands.
Electroporation
Isolated plasmids pTB93G, pTB93F and pKT-trp were transferred into P. syringae
pv. tomato DC3000 and RPM1 by electroporation using following procedure.
Electroporated cells were selectively cultured on plates with appropriate
combination of antibiotics. Rifampicyn or rifampicyn plus tetracycline were present
in all plates, as they ensured the selective growth of original strains of P. Syringae,
DC3000 and RPM1. Kanamicyne was added to distinguish cells bearing plasmid
pKT-trp, tetracycline and spectinomycin for pTB93G or chloranfenicol and
spectinomycin for selection of pTB93F. The first colonies appeared approximately
after two days of cultivation at room temperature. Individual colonies were tested for
GFP fluorescence. GFP expressing transformants were transferred from plates to
liquid medium and deeply frozen stocks were prepared to preserve the most original
genetic information. These stocks were used to start again the new cultivation from
the same cells in later experiments. The transformed cells were transferred from plate
to plate no more than two times.

45
Electroporation
1. The overnight culture of donor cells (P. syringae) inoculated from fresh plate colony was
diluted 10 times to 50 ml KB medium and grown for another 2-3 hours at 28ºC.
2. Cells were grown to mid-log phase (OD600 = 0.4 - 0.5).
3. For the preparation of competent cells it is important to eliminate salts before
electroporation, otherwise they will disturb the process. Prior electroporation, cells were
twice extensively washed by redistilled water. The centrifugation was gentle at low speed:
1570g for 10 minutes.
4. At the end, the cells were harvested by centrifugation (1750 g, 10 minutes). The supernatant
was gently poured off to concentrate cells 10 times: from 20 ml to 2 ml.
5. The cryoprotectant glycerol was added to final concentration 10 %.
6. The sample was divided to aliquots that were frozen at -80ºC.
7. The required number of micro centrifuge tubes and sterile micro-electroporation cuvette
were pre-cooled on ice.
8. Aliquots of competent cells were thawed. 100 µl of cells in 10% glycerol were pipetted to
the required number of microfuge tubes on ice. The rest of the aliquot was discarded.
9. 1 µl of purified plasmid DNA was added to cells and incubated for 5 minutes on ice.
10. The cell-DNA mixture was pipetted between the bosses in a micro-electroporation chamber
of 1cm diameter. Air bubbles was avoided, because the pressure of a bubble might cause
arcing and loss of the sample. Samples were pulsed at 1.2 kV.
11. Directly after pulse, cells were transferred to fresh KB medium and incubated well shaken
for 1 hour.
12. After incubation, different volumes of cells were plated on well-dried plates with appropriate
antibiotics. Plates were cultivated for 1 – 3 days in the position of the bottom on at room
temperature.
Preservation of transformed strains:
1. Autoclave 150 µl 80% glycerol in Eppendorf tubes.
2. Add 650 µl of well-grown bacterial culture.
3. Immediately freeze and store at – 80ºC.
Visualization of GFP fluorescence from plates
GFP transformants were first checked for their fluorescence directly on the agar
plates. We screened for individual GFP expressing colonies using simple
experimental setup (sketch at Figure 2).

46
Figure 2 Schematic diagram of experimental setup used for visualization of GFP colonies grown
on the agar plates
Plates were illuminated by the monochromatizing light source Polychrom V
(Till-Photonics, Germany). The excitation light of 475 nm (half-bandwidth of 15 nm)
was delivered by a light guide and expanded over the whole area of Petri dish using a
lens (focal distance = 80 mm) that was placed in front of the light guide aperture. The
sample plate was located perpendicularly to the incident beam. A color digital camera
(Olympus E500) was used as a detector. It was positioned under 30 degree to the
incident light. To enhance contrast of the fluorescence images, a long-pass
interference filter was placed in front of the camera. The filter transmitted light above
530nm (T>90%) and blocked the excitation light below 480 nm.
Fluorescence spectroscopy
A spectrofluorometer (FluoroMax-4, Jobin Yvon – Horiba, www.jobinyvon.com/)
was used to measure fluorescence characteristics of the strains carrying various GFP
plasmids. In all cases, the excitation spectrum was determined at 520 nm and was
measured from 350 to 500 nm. The emission spectrum was measured with excitation
470 nm in the range 500 to 600 nm. The slit width of 2 nm was used for both
excitation and emission and integration time was kept to 0.5 s. Figure 3A shows
spectra of E. coli carrying pKT-trp and pTB93F. Interestingly, plasmid pTB93F was
not fluorescent in E. coli in contrast to pKT-trp. The reason of this difference remains
unknown.
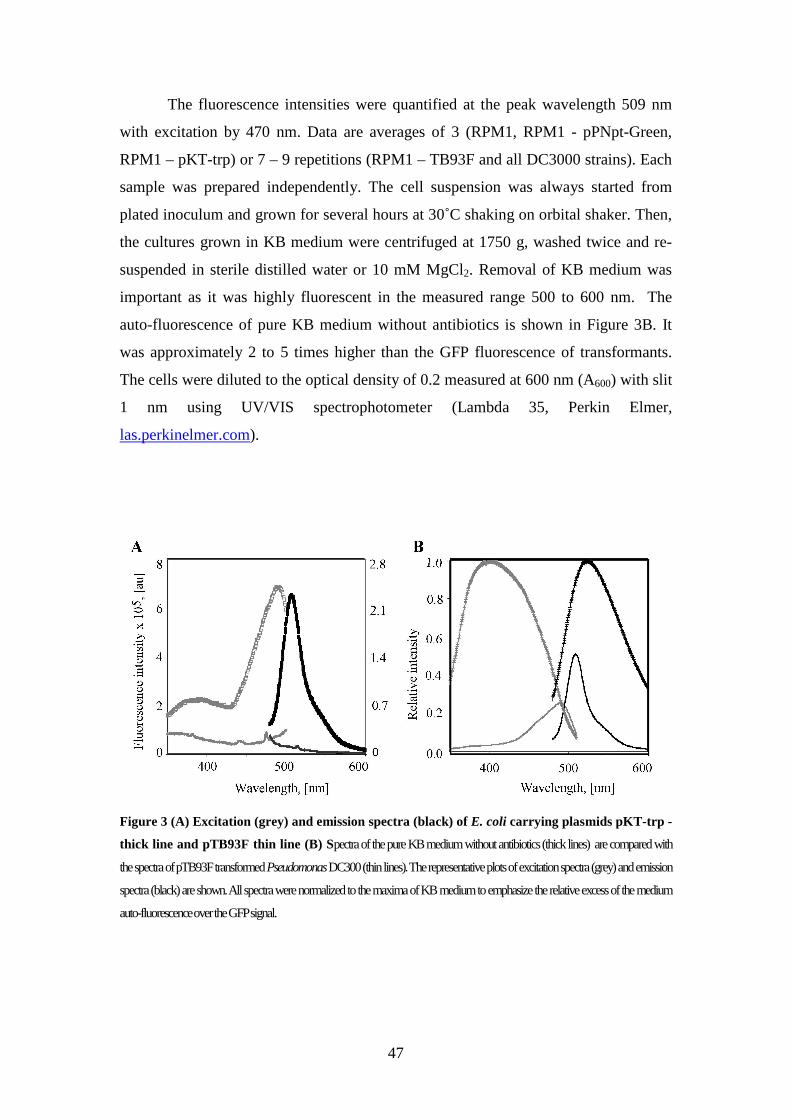
47
The fluorescence intensities were quantified at the peak wavelength 509 nm
with excitation by 470 nm. Data are averages of 3 (RPM1, RPM1 - pPNpt-Green,
RPM1 – pKT-trp) or 7 – 9 repetitions (RPM1 – TB93F and all DC3000 strains). Each
sample was prepared independently. The cell suspension was always started from
plated inoculum and grown for several hours at 30˚C shaking on orbital shaker. Then,
the cultures grown in KB medium were centrifuged at 1750 g, washed twice and re-
suspended in sterile distilled water or 10 mM MgCl2. Removal of KB medium was
important as it was highly fluorescent in the measured range 500 to 600 nm. The
auto-fluorescence of pure KB medium without antibiotics is shown in Figure 3B. It
was approximately 2 to 5 times higher than the GFP fluorescence of transformants.
The cells were diluted to the optical density of 0.2 measured at 600 nm (A600) with slit
1 nm using UV/VIS spectrophotometer (Lambda 35, Perkin Elmer,
las.perkinelmer.com).
Figure 3 (A) Excitation (grey) and emission spectra (black) of E. coli carrying plasmids pKT-trp -
thick line and pTB93F thin line (B) Spectra of the pure KB medium without antibiotics (thick lines) are compared with
the spectra of pTB93F transformed Pseudomonas DC300 (thin lines). The representative plots of excitation spectra (grey) and emission
spectra (black) are shown. All spectra were normalized to the maxima of KB medium to emphasize the relative excess of the medium
auto-fluorescence over the GFP signal.
48
Microscopic analysis of gfp transformed strains
The inverted microscope Olympus IX70 was used to estimate a fraction of cells
expressing the gfp gene and to examine cell morphology of transformed Pseudomonas
strains. The microscopic preparations were prepared as follows: Bacteria were
cultivated in a liquid KB medium at 30˚C for several hours to mid-exponential phase.
Cells were spined down (5 min, 1750 g) and re-suspended in a small amount of water
or 10 mM MgCl2. 3 µl of each suspension was then deposited on a glass slide,
covered with a cover slip and immediately observed under the microscope equipped
with the 60x objective (UPlan Apo, NA 0.9, Olympus, Japan).
The microscope provided an operation in a standard bright-field or in an epi-
fluorescence mode. When the bright-field microscopy was used, cells were stained by
Giemsa-Romanovsky staining procedure. It was used to examine cell sizes of wild
type and transformants. Both modes were combined to determine a fraction of GFP
expressing cells. The filter set for fluorescence microscopy consisted of 417 – 477 nm
band-path excitation filter (FF01 447/60, Semrock, USA) combined with a 495 nm
dichroic filter (FF495-Di02, Semrock, USA) and a 504 – 539 nm barrier filter (FF01
520/35, Semrock, USA). The enhanced GFP variant was excited with 470 nm light
emitted by a light-emitting-diode (PB09 Royal Blue, Lumileds, USA, λmax ≈ 470nm).
Images were captured with a 12 bits CCD camera (chip Sony ICX429AL, resolution
512 x 512 pixels). The microscope was calibrated using a micrograded slide with
parallel stripes separated by known distance.
(1) Estimation of GFP expression per cell
The fraction of fluorescent cells was determined from bright-field and corresponding
fluorescence images of the same field view. ImageJ software (Abramoff et al. 2004)
was used to count the number of fluorescent cells. However, the amount of non-
fluorescent cells had to be estimated manually, since the preparation was not stained
and the non-fluorescent cells could not be automatically distinguished from the
background. Five to six different images containing 377 cells carrying plasmid
pTB93F, 583 with pKT-trp and 121 with pPNpt-Green were examined.
(2) Analysis of cell morphology
The length of wild-type and transformed cells was compared by bright-field
microscopy. To recognize transparent bacteria, samples were first stained by Giemsa-

49
Romanovsky staining procedure. The images were processed with ImageJ (Abramoff
et al. 2004). Initially, the out-of-focus cells were removed from all images. Then, the
images were thresholded and converted into binary images where cells were colored
black and background white. To exclude dirt or cell pieces, the circularity of
measured particles was restricted to 0 - 0.5. This range was determined
experimentally to best fit a rod-like shape of Pseudomonas cells, since the formula for
circularity is 4π(area/(perimeter)2) and thus the value 1 indicates a perfect circle. The
cell size was determined as the Feret’s diameter that refers to the longest distance
between two points along the selection boundary. Between 550 to 1150 cells were
measured for each strain.
Imaging of chlorophyll fluorescence kinetics
Fluorescence images of whole leaves were captured using FluorCam imaging system
(P.S.I., Brno Czech Republic, www.psi.cz) as described in(Berger et al. 2007).
Wide-field fluorescence microscopy of gfp expressing pathogen in leaves of A.
thaliana
The green fluorescence of GFP and red chlorophyll emission were imaged using i-
MIC 2000 digital platform (Till-Photonics, Gräfelfing, Germany, www.till-
photonics.de). iMIC is fully motorized microscope. It is equipped with a motorized
stage which allows XY movement in the range 25mm x 25mm with resolution less
than 1µm at speed 7.5 mm/s. An objective revolver provides a possibility of using up
to 4 objectives. The iMIC focuses with a piezo-element (250 µm of fine travel range
with resolution 50nm) combined with z-stepper motor (25 mm of coarse movement
with speed 7.5 mm/s). The system operates with the 12 bits IMAGO – QE camera. It
provides 1.3 megapixels resolution and enhanced quantum efficiency. Exposure times
range from 0.5 ms to 1000 ms. The core of the system is an illumination unit -
Polychrome V that is fiber-coupled with the microscope. The Polychrom is a rapid
scanning monochromatizing light source tunable between 340 – 680 nm.
Filter cubes are automatically exchangeable. Chlorophyll filter cube consisted
of 640 nm short pass interference filter (open in 400 – 630 nm), FF669-Di01dichroic

50
mirror (Semrock, Rochester, USA, www.semrock.com) and RG695 as emitter
(fluorescence detection over 695 nm). GFP was detected with a standard Semrock
filter set consisting of: FF01-472/30 exciter, FF495-Di02 dichroic mirror and FF01-
520/35 emision filter. Thus GFP could be excited with light of 460 - 490 nm
wavelength. GFP emission was detected in the spectral window 505 – 540 nm. Three
objectives were typically used: Olympus (Olympus, Hamburg, Germany) UApo/340
20x (NA 0.75), UApo/340 40x (NA 1.15, water immersion) and PlanApoChromat
60x (NA 1.2, water immersion).
Two-photon microscopy imaging
The 3-dimensional distribution of pathogenic bacteria in a leaf tissue was visualized
by the two-photon microscope Leica DM IRE2 HC Fluo TCS 1-B (Leica
Microsystems, Wetzlar, Germany). The infrared laser Chameleon Ultra (Coherent,
Santa Clara, USA) was tuned to 900 nm to excite both, GFP and ChlF. Emission
bands for GFP (500 –540 nm) and ChlF (680 – 700 nm) were selected by acousto-
optical beam splitter. Samples were observed using a 63x water immersion objective
HCX PL APO, NA 1.2 (Zeiss, Göttingen, Germany).
Detached Arabidopsis leaves were mounted in a custom made microscopic
chamber equipped with corrected cover slips no. 1.5 (Assistent, Glaswarenfabrik Karl
Hecht Gmbh+Co, Sondheim, Germany), dipped in 10 mM MgCl2 solution under a
block of agarose. Reconstruction of 3D scene was performed using direct volume
rendering in ImageJ software (Abramoff et al. 2004).

51
Results and Discussion
Expression of green fluorescent protein in P. syringae
Two strains of Pseudomonas syringae, virulent (DC3000) and avirulent strain
(RPM1), were electro-transformed with 3 different plasmids carrying gene for GFP:
pTB93F, pTB93G and pKT-trp (details in Table 1). In addition, another two strains
tagged with pPNpt-Green were provided by Thomas Roitsch (Würzburg University,
Germany).
All mutants were cultivated on selective plates, solid medium supplemented
with appropriate combination of antibiotics, to pre-select cells carrying the introduced
plasmids. Resistance to the antibiotics was conferred by a resistance gene which had
been introduced into bacterial cell together with the gfp-gene. The colonies of both P.
syringae electro-porated with plasmids pTB93F and pKT-trp were successfully grown
on plates. However, no cells transformed by pTB93G survived antibiotic selection.
Then, transformants were tested for their green fluorescence emission. The
Petri plates were screened under blue illumination (475 nm) to search for fluorescing
bacterial colonies. Figure 4A shows plated colonies of original strain DC3000 and its
GFP variants. Images in the top row represent color photographs taken under white,
room lighting to visualize position of bacteria on plates. Corresponding fluorescence
images are shown below. The original DC3000 strain did not exhibit any GFP
emission whereas all transformed strains were fluorescent, although to a various
extent (Figure 4A bottom row).
The fluorescence images revealed quantitative differences among
transformants despite all images were acquired under identical conditions. The
bacteria carrying pTB93F and pPNpt-Green exhibited bright fluorescence of
comparable intensity. On the contrary, the pKT-trp colonies showed only dim green
emission. We suppose that this difference was not caused by a difference in thickness
of cell layers grown on plates. It rather originated in lower GFP concentration
accumulated in bacterial cells or lower yield of GFP fluorescence in cells carrying
pKT-trp. This result was surprising, since the plasmid pKT-trp was technically a
combination of pTB93F and pPNpt-Green. It contained same gfp-gene construct as
pPNpt-Green, which was under the control of trp promoter as in the case of pTB93F.
Further, the gfp transformants were inspected by a spectrofluorometer.

52
Excitation and emission spectra were measured to (1) distinguish the GFP
fluorescence from potential auto-fluorescence of bacterial cells and (2) quantify and
compare the brightness of individual gfp-mutants. The excitation spectrum was
measured at emission wavelength of 520 nm and emission scan was obtained with
excitation by 470 nm. The spectra of parent strains DC3000 (grey and black lines in
Figure 4B) and RPM1 (data not shown) did not exhibit any peaks. In contrast,
excitation and emission maxima, characteristic for an enhanced variant of GFP, were
found in all transformed strains (Figure 4B). The excitation maximum was identified
at 480 nm. The emission spectrum peaked at 509 nm. Moreover, the excitation spectra
of strains carrying pPNpt-Green and pKT-trp (Figure 4B red and green lines) had also
shoulders in UV region (between 380-390 nm). It corresponds to the main excitation
maximum of wtGFP which was suppressed by the S65T mutation. The similarity
between pPNpt-Green and pKT-trp points at their related origin. Both plasmids
contain the same EGFP construct that is only controlled by various promoters.
All spectra were determined with constant spectrofluorometer settings and in
cell suspensions diluted to the same optical density. The excitation and emission
spectra in Figure 4B revealed similar quantitative differences as the plate screening.
Virulent bacteria carrying plasmid pPNpt-Green were the brightest. Those with
pTB93F were a bit less fluorescent. In contrast, cells tagged with pKT-trp displayed
only a little fluorescence emission. Interestingly, plasmid pKT-trp led to about five
times more fluorescence in E. coli (Figure 3A) than in Pseudomonas. The reason for
this difference was not understood.
Fluorescence yield is an important criterion since the brighter cells would
allow easier visualization with standard epi-fluorescence microscope and standard
filter sets. The fluorescence intensities of all transformants, detected at 520 nm
excited at 470 nm, are compared in Figure 4C. Data are averages of at least 3
independent experiments. Each experiment was done with freshly prepared cell
suspension inoculated from plated culture, then grown for several hours, washed
twice and diluted in MgCl2 to the same optical density, 0.2 OD600. The data suffer
from high variability that might originate from the impact of growth phase on the GFP
production. Data were collected in exponential as well as stationary phases. Two
trends were evident, although other differences among transformants were not
statistically significant. First, strains carrying the plasmid pPNpt-Green were always
the brightest. Second, all transformed avirulent strains of P. syringae (RPM1)

53
manifested lower mean fluorescence in comparison to virulent strains. Different
fluorescence intensities can be explained by a lower copy number of various plasmids
per cell or different expression rates of gfp-gene. The plasmid copy number is
typically negatively correlated with the plasmid size (Smith and Bidochka 1998) and
vice versa the plasmid loss is positively correlated with the size. The pKT-trp is
apparently bigger (Figure 1), therefore, less copies might be maintained in the host
cell. Another reason could be the plasmid-added burden to the host metabolism. It
might reduce the rate of gfp gene expression. However, the same effect can be also
attained if bacterial population is mixed and it contains a fraction of non-fluorescent
but resistant cells. Perhaps pKT-trp is more prone to recombination, the gene for gfp
can be disrupted by such an event although cells can sustain their resistance to
antibiotics and grow in a selective medium. In the first scenario, cells would be less
bright and we might face a problem with their visualization especially in highly
scattering leaf tissue. However, if some cells loose gfp construct, they are unusable for
further quantitative analysis because the co-localization of the pathogen with infection
symptoms would be underestimated.
The lower GFP fluorescence in avirulent strains could be explained by a
possible impact of plasmid on the host metabolism. The overall yields of plasmid
DNA expression differs with respect to plasmid metabolic burden. The avirulent
strain already carries one plasmid with the gene for factor of avirulence except the gfp
construct. So cells have to provide the energy for synthesis of two products instead of
one that might affect the expression rates of both. The lower expression would lead to
lower total GFP accumulation and thus lower fluorescence emission of avirulent
strains. And vice versa, these GFP transformants could be affected in production of
avirulent factor RPM1 and thus in their virulence. The virulence phenotypes of P.
syringae mutants were also inspected and it is discussed below.

54
Figure 4 (A) Screening for green fluorescing transformants: colonies grown on selective agar
plates in reflected white light (top row) and in fluorescence (lower row). Green fluorescence was
excited by blue illumination and was spectrally separated by interference filter. For the purpose
of this figure, the plates were inoculated by dense inoculum and were grown longer than usually
to obtain a well visible pattern. Images were recorded under the same conditions and were not
further processed. (B) Excitation and emission spectra of virulent strain of P. syringae (DC3000)
transformed by: pKT-trp - green line, pTB93F – blue line, pPNpt-Green – red line in comparison
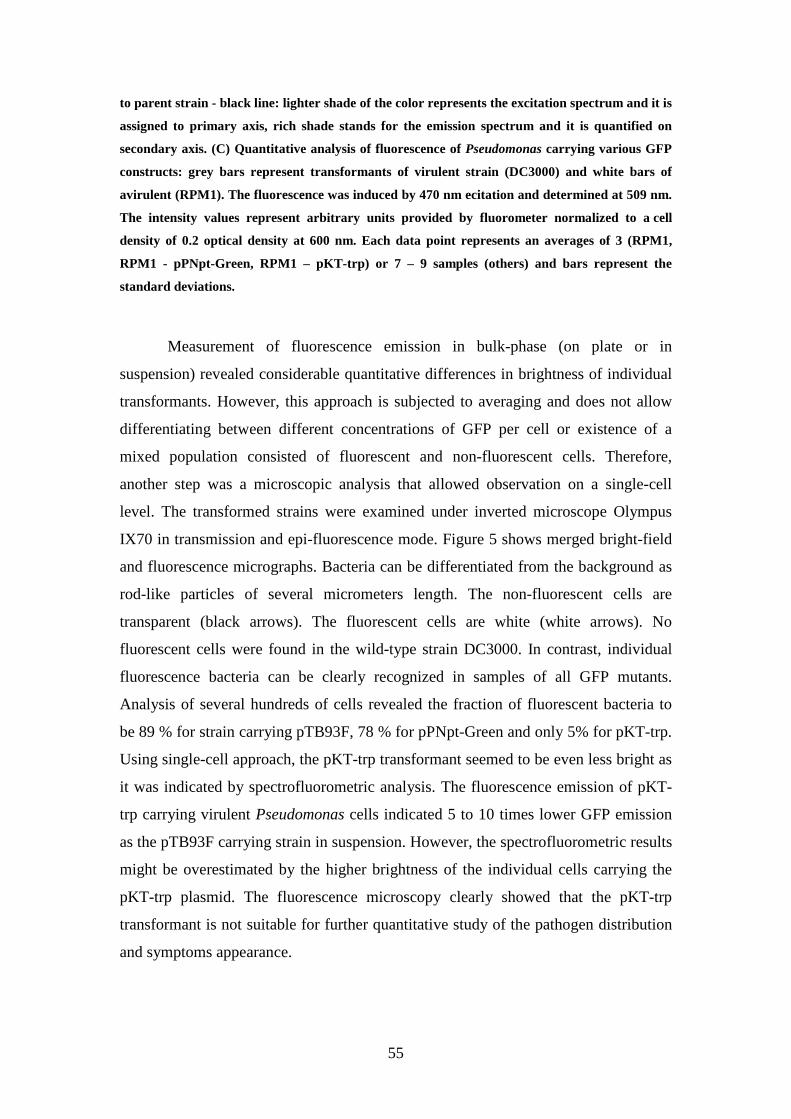
55
to parent strain - black line: lighter shade of the color represents the excitation spectrum and it is
assigned to primary axis, rich shade stands for the emission spectrum and it is quantified on
secondary axis. (C) Quantitative analysis of fluorescence of Pseudomonas carrying various GFP
constructs: grey bars represent transformants of virulent strain (DC3000) and white bars of
avirulent (RPM1). The fluorescence was induced by 470 nm ecitation and determined at 509 nm.
The intensity values represent arbitrary units provided by fluorometer normalized to a cell
density of 0.2 optical density at 600 nm. Each data point represents an averages of 3 (RPM1,
RPM1 - pPNpt-Green, RPM1 – pKT-trp) or 7 – 9 samples (others) and bars represent the
standard deviations.
Measurement of fluorescence emission in bulk-phase (on plate or in
suspension) revealed considerable quantitative differences in brightness of individual
transformants. However, this approach is subjected to averaging and does not allow
differentiating between different concentrations of GFP per cell or existence of a
mixed population consisted of fluorescent and non-fluorescent cells. Therefore,
another step was a microscopic analysis that allowed observation on a single-cell
level. The transformed strains were examined under inverted microscope Olympus
IX70 in transmission and epi-fluorescence mode. Figure 5 shows merged bright-field
and fluorescence micrographs. Bacteria can be differentiated from the background as
rod-like particles of several micrometers length. The non-fluorescent cells are
transparent (black arrows). The fluorescent cells are white (white arrows). No
fluorescent cells were found in the wild-type strain DC3000. In contrast, individual
fluorescence bacteria can be clearly recognized in samples of all GFP mutants.
Analysis of several hundreds of cells revealed the fraction of fluorescent bacteria to
be 89 % for strain carrying pTB93F, 78 % for pPNpt-Green and only 5% for pKT-trp.
Using single-cell approach, the pKT-trp transformant seemed to be even less bright as
it was indicated by spectrofluorometric analysis. The fluorescence emission of pKT-
trp carrying virulent Pseudomonas cells indicated 5 to 10 times lower GFP emission
as the pTB93F carrying strain in suspension. However, the spectrofluorometric results
might be overestimated by the higher brightness of the individual cells carrying the
pKT-trp plasmid. The fluorescence microscopy clearly showed that the pKT-trp
transformant is not suitable for further quantitative study of the pathogen distribution
and symptoms appearance.

56
Figure 5 Microscopic analysis of GFP expression in P. syringae strains: the parent strain DC3000
without GFP plasmid and its transformants harboring pTB93F, pKT-trp and pPNpt-Green are
shown. Images are combined bright-field and epi-fluorescence micrographs of the same field of
cells. The white arrows indicate fluorescent bacteria expressing GFP and the dark arrows non-
fluorescent bacteria. Scale bar represents 10µµµµm.
Morphology of the gfp transformants
Microscopic visualization was used to elucidate the difference in brightness of the gfp
mutants. However, it also pointed out to considerable difference in cell size (Figure
5). The size of bacterial cells might be an important factor. It could have effect on
growth rates, multiplication and cell motility in infected leaf tissue that can affect the
bacterial virulence. It can also distort the turbidometric measurements.
The fluorescence microscopy of bright field imaging was used with the
modified Giemsa-Romanowski staining procedure. A top row of Figure 6 shows the
micrographs of non-transformed virulent strain (wild type) and its transformed
variants pTB93F, pKT-trp and pPNpt-Green. Comparing to the wild type, tagged
strains had typically longer cells. The average cell length of parent strain DC3000 was
(2.42 ± 1.47) µm. It did not significantly differ from the transformed strains:
DC3000/pTB93F (3.54 ± 2.27) µm, DC3000/pKT-trp (3.54 ± 2.02) µm and
DC3000/pPNpt-Green (4.26 ± 2.91) µm. However, the distribution of wild type strain
showed (bottom row in Figure 6) that the length of more than 95 % cells fell between
0.5 and 3.5 µm. In contrast, transformed strains were more variable in size and their
distributions were right-hand skewed. The pPNpt-Green strain was the most affected
one. Very long cells resembling short filaments were frequently observed (Figure 6).
Liquid culture was abounded by this phenotype after several hours of cultivation.
However, it was not found in preparations scraped from solid agar plates. So the
formation of long filaments seems to appear only in conditions of promoting a fast

57
growth. We do not suppose, it is a response to nutrients depletion. Bacteria typically
tend to decrease their size in response to nutrients lack (Monier and Lindow 2003b).
Kolter et al. (Kolter et al. 1993) stated that when E. coli starved, they could become
less metabolically active and smaller, owing to cellular divisions with no increase in
cell mass. We rather assume that GFP transformants were under some metabolic
pressure. It is possible that plasmids posed high demand on host metabolism that
could be manifested as formation of long filamentous structures during rapid
population growth (Smith and Bidochka 1998; von Bodman et al. 2003). The
filaments could be formed of several non-detached cells and represent a form of
aggregates. Bacterial aggregates were shown to increase the stress tolerance and
population survival in aquatic environment and in phylosphere (Monier and Lindow
2003a).
Figure 6 Effect of different gfp plasmids on the cell size of P. syringae: top row shows the bright
field images of Giemsa-Romanowski stained cells of wild type virulent strain (DC3000) and its
transformants pTB93F, pKT-trp and pPNpt-Green. Scale bar represents 5µµµµm. Normalized
frequency distributions of bacterial cell lengths are shown in bottom row.
The filaments formation could have an important practical consequence. The
diverse and variable size of Pseudomonas cells in suspensions of wild type and
transformed strains could affect the turbidometric determination of cell concentration.
To confirm this hypothesis, the optical density measured at 600 nm (OD600) was

58
correlated with a number of cells per milliliter of suspension. Cells were counted in
Burker chamber using a bright field microscope. Table 3 shows cell counts
determined in suspensions of 0.2 OD600. One milliliter of virulent wild type (DC3000)
bacteria re-suspended in 10 mM MgCl2 contained 0.5 x 10⁸ cells while the same
OD600 corresponded to 0.7 x 10⁸ cells tagged with pTB93F, 0.6 x 10⁸ pKT-trp and 0.3
x 108 cells labeled with pPNpt-Green.
Two other factors had to be considered. First, not all counted particles could
be vital bacteria with ability to multiply. Second, each filament was rated as one
particle, but it might crumble to several cells in favorable conditions e.g. in apoplast
that would accelerate spreading of pathogen in plant tissue. To clarify these questions,
another method of cell number estimation, viable counting (or colony forming unit
enumeration - cfu), was employed. This microbiology technique is based on the
assumption that each vital bacterium can divide and become a colony. So, it allows
counting viable cells solely. Therefore, it typically reveals lower number than
microscopic counting. Surprisingly, the results (Table 3) did not differ from the
previous ones except a higher variability of the data. This implies a good viability of
cells in a fresh inoculum.
Viable counting also showed that pPNpt-Green carrying strains formed two
types of colonies on plates: smaller and larger. We suppose that the larger ones grew
from filaments. To test this assumption, cells were incubated in detergent TWEEN 20
before plating however without significant result. Since we did not succeed to clarify
this phenomenon, pPNpt-Green mutant does not seem to be suitable for study
infection process in A. thaliana.
Table 3 The correlation of optical density (OD600) to number of cells estimated by microscopic
counting in Burker chamber or to the number of viable bacterial cells estimated as colony
forming units (cfu) by plating. All values are calculated for 0.2 OD600.
Bacterial strain Microscopy counts, cells/ml Viable counts, cfu/ml
DC3000 (0.5 ± 0.06) x 108 (0.5 ± 0.06) x 108
RPM1 (0.9 ± 0.23) x 108
DC3000 / pTB93F (0.7 ± 0.07) x 108
RPM1 / pTB93F (0.7 ± 0.15) x 108
DC3000 / pKT-trp (0.6 ± 0.07) x 108
DC3000 / pPNpt-Green (0.3 ± 0.03) x 108 (0.3 ± 0.12) x 108

59
Pathogenicity and virulence
Because the morphology of strains, carrying gfp plasmids, was modified, their
pathogenicity and virulence were to be further tested. The pathogenicity is the
qualitative ability of a pathogen to cause disease. The virulence is its quantitative
manifestation. The pathogenicity and virulence were characterized by three
parameters: (1) development of visual symptoms, (2) bacterial multiplication in a
host tissue and (3) development of fluorescence symptoms (Berger et al. 2007).
Visual symptoms induced by the gfp-labeled transformants of virulent and
avirulent Pseudomonas strains were compared with symptoms evoked by the non-
transformed strains. The wild-type strains (virulent DC300 and avirulent RPM1)
served as a positive control. Infiltration with MgCl2 solution was used as a negative
control. Leaves infiltrated with MgCl2 remained symptomless (data not shown). Both,
the wild-type and gfp-labeled strains induced typical disease symptoms. When the
virulent wild-type bacteria were infiltrated into a susceptible plant, water soaked
patches appeared as the first visible symptoms. Then, another 24 hours later, the
infected tissue became necrotic. The necrotic lesions turned finally to desiccated
tissue that was surrounded by a typical chlorotic halo (Figure 7A).
Table 4 Infection symptoms of the wild type and GFP transformed Pseudomonas strains: visual
symptoms were scored according to their incidence and severity on at least 5 leaves of 3 plants
before infiltration and 1, 2, and 3 days after it. Water soaking lesions are marked as “+“, “++“
designates appearance of necrosis and collapse of leaf tissue to desiccated patches is shown as
“+++“.
CONTROL VIRULENT STRAINS AVIRULENT STRAINS
wild type
pTB93F
pKTt-rp
pPNpt-Green
wild type
pTB93F
pKT-trp
pPNpt-Green
0 hai
24 hai + + + +
48 hai + ++ +++ + ++ ++ +++ ++
72 hai +++ +++ +++ +++
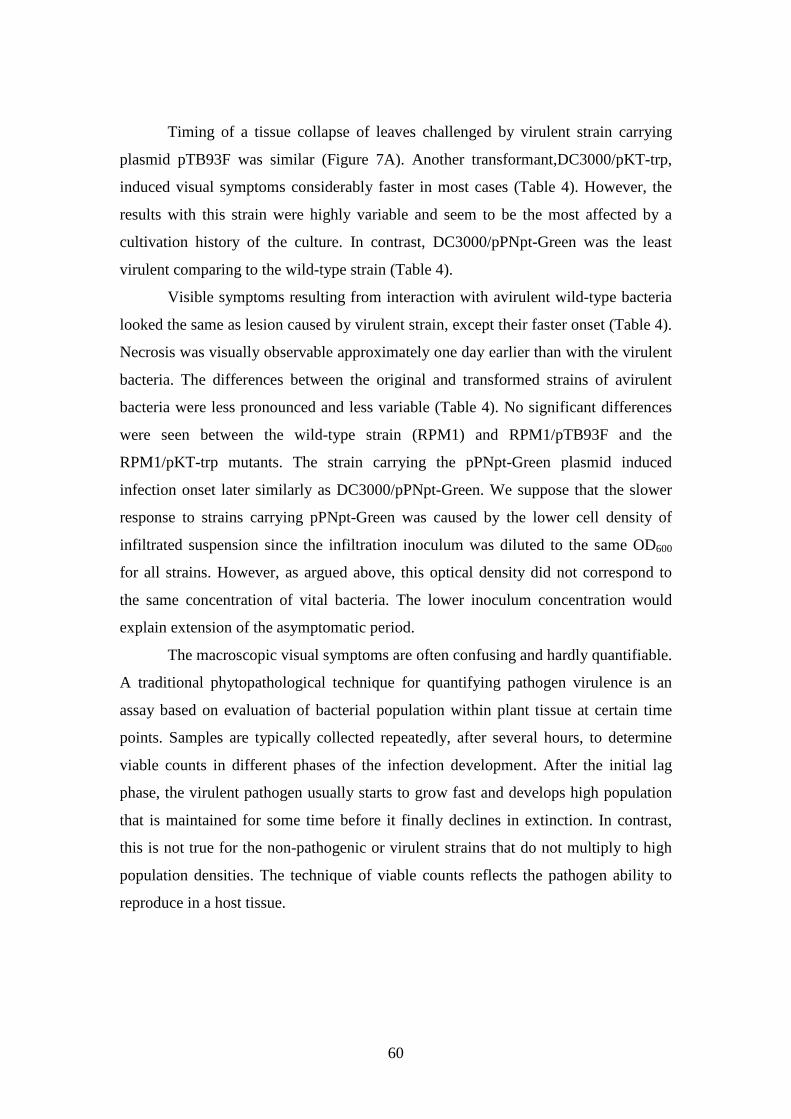
60
Timing of a tissue collapse of leaves challenged by virulent strain carrying
plasmid pTB93F was similar (Figure 7A). Another transformant,DC3000/pKT-trp,
induced visual symptoms considerably faster in most cases (Table 4). However, the
results with this strain were highly variable and seem to be the most affected by a
cultivation history of the culture. In contrast, DC3000/pPNpt-Green was the least
virulent comparing to the wild-type strain (Table 4).
Visible symptoms resulting from interaction with avirulent wild-type bacteria
looked the same as lesion caused by virulent strain, except their faster onset (Table 4).
Necrosis was visually observable approximately one day earlier than with the virulent
bacteria. The differences between the original and transformed strains of avirulent
bacteria were less pronounced and less variable (Table 4). No significant differences
were seen between the wild-type strain (RPM1) and RPM1/pTB93F and the
RPM1/pKT-trp mutants. The strain carrying the pPNpt-Green plasmid induced
infection onset later similarly as DC3000/pPNpt-Green. We suppose that the slower
response to strains carrying pPNpt-Green was caused by the lower cell density of
infiltrated suspension since the infiltration inoculum was diluted to the same OD600
for all strains. However, as argued above, this optical density did not correspond to
the same concentration of vital bacteria. The lower inoculum concentration would
explain extension of the asymptomatic period.
The macroscopic visual symptoms are often confusing and hardly quantifiable.
A traditional phytopathological technique for quantifying pathogen virulence is an
assay based on evaluation of bacterial population within plant tissue at certain time
points. Samples are typically collected repeatedly, after several hours, to determine
viable counts in different phases of the infection development. After the initial lag
phase, the virulent pathogen usually starts to grow fast and develops high population
that is maintained for some time before it finally declines in extinction. In contrast,
this is not true for the non-pathogenic or virulent strains that do not multiply to high
population densities. The technique of viable counts reflects the pathogen ability to
reproduce in a host tissue.

61
Figure 7 The time course of infection symptoms following the challenge of A. thaliana leaves with
original strains of P. syringae pv. tomato and strains carrying plasmid pTB93F. Leaves were
inoculated with 107 cfu/ml. (A) Visual disease symptoms: the right half of each leaf was syringe-
infiltrated with virulent or avirulent bacteria. Re d arrows indicate faint symptoms recognizable
after 24 hours. (B) Multiplication of the pathogen in the leaf tissue: the bacterial populations
were determined immediately after infiltration and, then, daily by counting colony forming units.
The growth of parent virulent and avirulent Pseudomonas strains is plotted in separate upper
graph. The strains tagged with pTB93F are added in color into lower chart. Data are plotted on
a log10 scale. The error bars indicate the standard deviation within 3 replicate samples for each
treatment. (C) The fluorescence symptoms of disease shown by relative changes of mean values of
selected fluorescence parameters as determined by the macroscopic imaging of chlorophyll

62
fluorescence kinetics of plants infected with virulent (squares) bacteria 10 hai (green) and 24 hai
(red) or avirulent bacteria (rings) 10 hai (blue). The wild type strains are shown in the left
diagram and pTB93F labeled are in the right one. The dark-grey segments emphasize dark-
adapted parameters, light-grey represents low actinic light (50 µµµµmol m-2s-1) and white high
actinic illumination (200 µµµµmol m-2s-1).
• F – chlorophyll fluorescence yield (0 minimal, M maximal, V variable), FV/FM –
maximum quantum yield of PSII, ΦΦΦΦPSII - quantum yield of PSII (non-cyclic) electron
transport, qA – absolute quenching of PSII, Rfd – vitality index, ΦΦΦΦP – the efficiency of
excitation energy capture by open PSII in the light adapted state, ΦΦΦΦ‘ PSII – effective quantum
yield of PSII, Φ Φ Φ ΦN – quantum yield of non-photochemical processes in the light-adapted state
Viable counts were determined to compare virulence of the original virulent
and avirulent strains of P. syringae in leaves of A. thaliana with the strains
transformed by gfp plasmid pTB93F. Top graph in Figure 7B shows the
multiplication of virulent and avirulent wild-type bacteria. There was no significant
difference between development of virulent and avirulent bacterial population. The
growth was undistinguishable probably due to relatively high inoculum concentration
used in our experiments. Lower inoculum density and detailed time course of
observation could expand the differential window that separates compatible and
incompatible phenotypes. The typical differences were more pronounced in the case
of gfp labeled strains carrying plasmid pTB93F. Initially, the virulent mutant strain
grew slower than wild-type but developed to a larger pathogen population. In contrast,
avirulent bacteria multiplied to lower population size that might be caused by possible
lower concentration of the viable cells in inoculum. However, the differences among
the strains were not significant and data were highly variable. One of the most
probable variability sources could be a low accuracy of pipetting during the serial
dilution. Cultivation conditions might play an important role too. Fluctuations of
temperature might change the rates of the bacterial growth. Since the inoculated plates
were grown in a varying laboratory temperature, temperature effect is supposed to be
dominant.
The major disadvantage of the viable counting technique is the need for
destructive sampling requiring large volumes of plant material. Therefore, the non-
invasive chlorophyll fluorescence imaging was used to compare and quantify the
development of the disease. The response was the most pronounced with pKT-trp
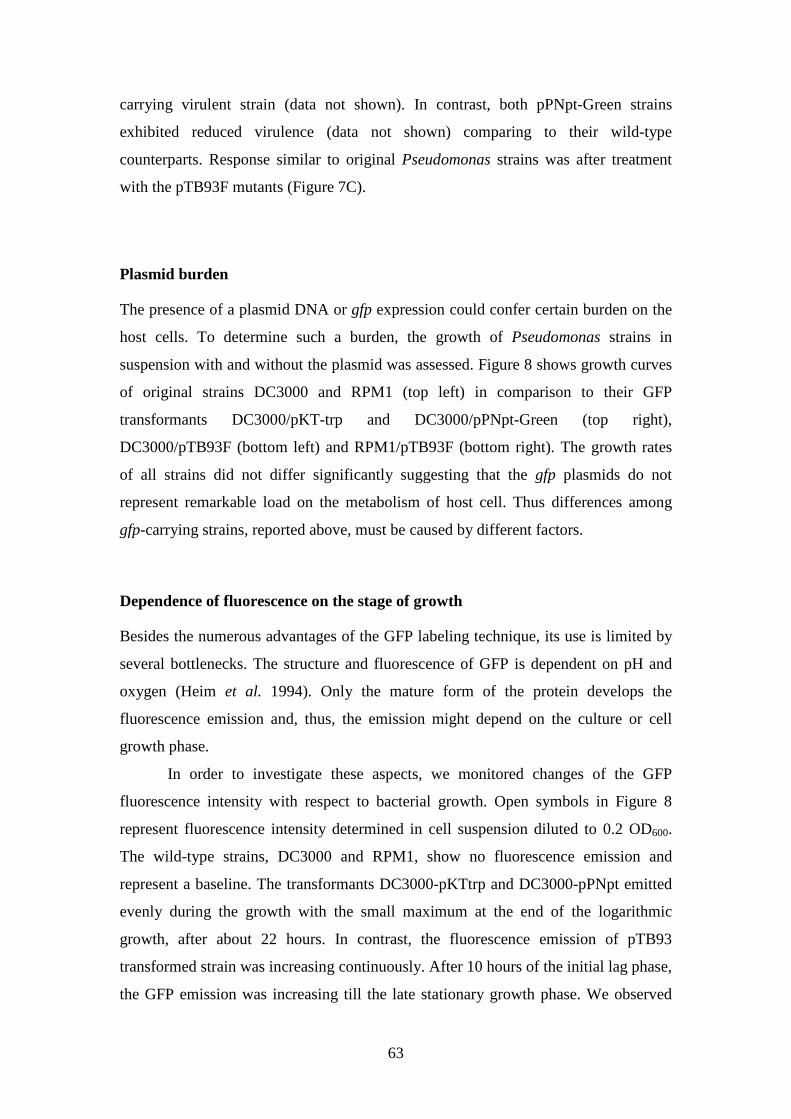
63
carrying virulent strain (data not shown). In contrast, both pPNpt-Green strains
exhibited reduced virulence (data not shown) comparing to their wild-type
counterparts. Response similar to original Pseudomonas strains was after treatment
with the pTB93F mutants (Figure 7C).
Plasmid burden
The presence of a plasmid DNA or gfp expression could confer certain burden on the
host cells. To determine such a burden, the growth of Pseudomonas strains in
suspension with and without the plasmid was assessed. Figure 8 shows growth curves
of original strains DC3000 and RPM1 (top left) in comparison to their GFP
transformants DC3000/pKT-trp and DC3000/pPNpt-Green (top right),
DC3000/pTB93F (bottom left) and RPM1/pTB93F (bottom right). The growth rates
of all strains did not differ significantly suggesting that the gfp plasmids do not
represent remarkable load on the metabolism of host cell. Thus differences among
gfp-carrying strains, reported above, must be caused by different factors.
Dependence of fluorescence on the stage of growth
Besides the numerous advantages of the GFP labeling technique, its use is limited by
several bottlenecks. The structure and fluorescence of GFP is dependent on pH and
oxygen (Heim et al. 1994). Only the mature form of the protein develops the
fluorescence emission and, thus, the emission might depend on the culture or cell
growth phase.
In order to investigate these aspects, we monitored changes of the GFP
fluorescence intensity with respect to bacterial growth. Open symbols in Figure 8
represent fluorescence intensity determined in cell suspension diluted to 0.2 OD600.
The wild-type strains, DC3000 and RPM1, show no fluorescence emission and
represent a baseline. The transformants DC3000-pKTtrp and DC3000-pPNpt emitted
evenly during the growth with the small maximum at the end of the logarithmic
growth, after about 22 hours. In contrast, the fluorescence emission of pTB93
transformed strain was increasing continuously. After 10 hours of the initial lag phase,
the GFP emission was increasing till the late stationary growth phase. We observed

64
a several hours delay of the fluorescence rise behind the bacterial growth. No decline
was observed during further incubation. This finding suggests that GFP accumulates
during the whole cell life of the pTB93F mutant.
Figure 8 Plasmid burden: Growth of Pseudomonas strains with and without GFP plasmids and
their fluorescence emission yields were monitored in suspension for 48 hours. The growth was
quantified as a change of absorbance determined at 600 nm (primary y-axis). Absorbance is
represented by closed symbols. Squares and diamonds denote strains not carrying GFP plasmids,
virulent DC3000 and avirulent RPM1 respectively. Triangles and circles indicate the gfp
transformants as shown in graphs. The fluorescence emission, induced by 475 nm and
determined at 509 nm, is shown in arbitrary units on secondary y-axis. It is represented by open
symbols. The data shown are averages for three replicates. The standard deviation of each point
is also shown.
Plasmid stability under non-selective conditions
Antibiotics are typically toxic to plants, bacteria were washed and infiltrated into leaf

65
without antibiotics. The antibiotic absence might lead to loss of plasmid and/or GFP
fluorescence. The stability of pTB93F, pKT-trp and pPNpt-Green were assessed in
the absence of selectable antibiotic-resistance markers whose genes were carried on
the same plasmids as gfp gene.
Figure 9 Maintenance of plasmid pTB93F in the absence of antibiotic selection: Pseudomonas
syringae DC3000 – pTB93F (closed symbols) and RPM1 – pTB93F (open symbols) was grown
overnight in KB medium supplemented with appropriate antibiotics. Next day, the culture was
diluted to fresh medium without spectinomycin and chloramphenicol that are selective markers
for plasmid pTB93F. Than it was grown to a stationary phase. This was repeated 3 consecutive
times. The effect of dilution is traced by the measurement of absorption at 600 nm (A600) and it is
shown in the top plot. The proportion of spectinomycin and chloramphenicol resistent cells was
determined by plating on selective agar plates supplemented with all antibiotics (middle graph).
The loss of fluorescence per cell is shown in the bottom plot. Last two plots are normalized to
initial conditions. The data are replicates of 3 experiments.
Experiment was started from fresh frozen stock solutions. They were used to
grow overnight inoculum in KB medium supplemented with all appropriate
antibiotics. Then 300 µl of inoculum was added into 30 ml of fresh antibiotic free
medium. It was grown for 24 hours and 50 times diluted. This was repeated 3

66
successive days (top row in Table 5) that is a typical duration of in planta growth
experiment. The loss of plasmid pTB93F was monitored in both transformed strains
virulent and avirulent P. syringae. The stability of plasmids pKT-trp and pPNpt-
Green was tested only in virulent strain DC3000. The proportion of the resistant
bacteria was determined by plating on selective agar plates at the indicated times.
Verification was done by measuring amounts of resistant cells grown in liquid
medium with and without antibiotics. In addition, maintenance of GFP fluorescence
was measured by spectrofluorometer before each dilution. All experiments were done
in three replicates.
Table 5 Stability of plasmids pTB93F, pKTtrp and pPNpt-Green and their fluorescence in the
absence of selection: Fraction of resistant and fluorescent cells was calculated relative to the
values for original culture grown in selective medium at the beginning of the experiment (t0) and
cells transferred to selective medium after at least 10 generations in non-selective conditions (t72).
Results are averages from triplicate experiments, with standard deviations shown in parentheses.
Fraction of resistant cells Fraction of fluorescent cells
Pst strain Plasmid
relative to t0 relative to t72 relative to t0 relative to t72
DC3000 pTB93F 0.34 (0.01) 0.68 (0.14) 0.35 (0.05) 0.60 (0.06)
pKTt-rp 0.33 (0.05) 0.44 (0.12) 0.44 (0.05) 0.47 (0.05)
pPNpt-Green 0.43 (0.09) 0.55 (0.19) 0.36 (0.05) 0.54 (0.02)
RPM1 pTB93F 0.37 (0.04) 0.41 (0.12) 0.80 (0.08) 1.06 (0.08)
The middle row in Figure 9 shows that after at least 10 generations, viable
counts of DC3000/pTB93F strain fell to (28 ± 3) % comparing to fresh overnight
inoculum. Up to (37 ± 2) % of RPM1/pTB93F cells retained their resistance at the end
of experiment. The stability of both strains was further tested as their ability to grow
in liquid medium (Table 5). The optical densities of DC3000/pTB93F and
RPM1/pTB93F cultures were decreased to 34 % and to 37 % of the initial values after
3 non-selective sub-culturing. Table 5 shows that similar scores were found in the
virulent Pseudomonas strain carrying pKT-trp and pPNpt-Green, 33% and 43 % of
cells retained resistance. Similar rate of loss of plasmid MB9000 was reported by
Smith and Bidochka (Smith and Bidochka 1998) after 3 sub-culturing in minimal
medium without ampicillin. However, the proportion of resistant bacteria was higher

67
if the culture transferred to selective medium after 72 hours was compared the same
culture growing henceforth without antibiotics. The highest discrepancy was exhibited
by DC3000/pTB93F strain where the difference was double. This suggests the loss of
viability after sub-culturing in addition to a loss of resistance.
Finally, GFP fluorescence was evaluated as an additional parameter of
stability. The results show (Table 5) that fluorescence was sustained by similar
fraction of cells as the resistance. Up to 60 % of virulent bacteria carrying PTB93F
were fluorescent. The scores were lower for pPNpt-Green (54 %) and pKT-trp (47
%). Surprisingly, fluorescence was not diminished in the case of RPM1-pTB93F
strain. Our results show 106 % fluorescent cells after transfer to selective medium
compared to culture further grown in the absence of antibiotics. Taken into account
the rate of resistance loss, we suppose that GFP accumulated in these cells resulting in
approximately twice increase of fluorescence. The retention of high level of GFP
expression suggests that plasmid pTB93F could serve as valuable tool for studies of
bacterial communities grown in the absence of antibiotic selection.
Visualization of P. syringae in planta
A wide-field microscope was used to test visibility of GFP transformed P. syringae
DC3000/pTB93F within the leaf tissue. Experiments were performed ex vivo.
Bacterial suspension was infiltrated into a leaf by a blunt syringe. The infected leaves
were sampled after several hours. Leaf cuts were mounted in 10 mM MgCl2 into
laboratory-made microscopic chamber. The microscope was equipped with two filter
cubes for quasi-simultaneous detection of GFP and chlorophyll fluorescence. This
allowed co-localization of the bacteria with the red plant auto-fluorescence. Figure
10A shows that individual bacterial cells can be imaged. Bacteria were found
dominantly in intercellular spaces. Mesophyll cells of upper leaf side (palisade
parenchyma) can be recognized by a ring of chloroplasts arranged along the cell
surface adjacent to anticlinal cell walls. This so called avoidance response is
characteristic to exposure by high light (Kagawa 2005b).
A stack of images corresponding to various objective focus positions were
mounted to pseudo 3D scene using the maximum Z projection algorithm. The
maximum intensity is typically attributed to structures in focus. Figure 10B shows a
side view of bacterial colony located beneath a stoma (white arrow) of abaxial

68
epidermis. The stoma is opened because the specimen was mounted in aqueous
solution. However, this image demonstrates the main drawback of wide-field
imaging, the contribution of unwanted light from outside the focal plane to signal in
focus. Unwanted signal affects the information about spatial distribution of various
fluorophores. For instance, the green fluorescence propagating from leaf interior is
diffused toward leaf surface. This green signal is mixed with a red emission of
chloroplasts of guard cells located along both sides of gap that are finally colored
yellow (Figure 10B). Or vice versa, yellow were colored also some bacteria, located
under leaf epidermis, that were overlaid with red emission from neighboring
chloroplasts. This is clearly incorrect because bacteria could not be found inside the
plant cells. They occurred only in collapsed cells at the very late infection state when
plant tissue was infested by the pathogen and damaged severely.
To approximate the shape of the observed bacterial colony, the image was
thresholded. The threshold was experimentally set to approximately two thirds of the
signal maximum and a transversal cut was done at the position of yellow dashed line.
After thresholding the image B, a pipe-like object, located several micrometers
beneath the epidermis, became clearly visible (Figure 10C). We assume it to be a
bacterial colony filling the sub-stomatal cavity.
Figure 10 Wide-field fluorescence microscope images of P. syringae pv. tomato DC3000 growing
in leaves of A. thaliana. Leaves were infiltrated by 107 cfu/ml suspension of virulent bacteria
carrying pTB93F. The bacteria were marked with GFP which contrasts with the red fluorescence

69
of plant cells. The micrographs are false color reconstructions. (A) Individual, GFP labeled
bacteria are visible as green rods within the red plant tissue 24 hai. A stack of 50 images was
collected by refocusing an objective from adaxial leaf surface toward leaf interior (step of motion
1µµµµm). The image stack is represented by its maximum projection. (B) A side view reconstruction
of bacterial colony located beneath the open stoma (white arrow). The image stack was acquired
from abaxial side. (C) Three-dimensional scene of bacterial distribution shown in B was
reconstructed from multiple successive images acquired by objective refocusing with step 1µµµµm.
The image was artificially thresholded, only signal exceeded two thirds of maximum is shown.
Fluorescent labeling of Pseudomonas cells allowed visualization of infection
progress and accumulation of virulent bacteria in planta (Figure 11). Immediately
after infiltration of bacterial suspension from the lower leaf side (0 hai), individual
bacteria were detected on both abaxial and adaxial sides of the leaf. Bacteria were
found dispersed predominantly under epidermis and some were detected also on the
leaf surface. 6 hours later, solitary signal could be detected in few locations within the
infiltration spot. Starting at 14 hours, bacterial colonies were observed in sub-stomatal
cavities and intercellular spaces. The population growth seemed to more intensive at
the lower leaf side, although this difference disappeared at later time-points. The
pathogen typically colonized entire sub-stomatal cavities and apoplast 24 hai. Only
after 48 hours post inoculation, lesions became visible. The fluorescence bacteria
were localized in the region of infection spot. They were rarely found outside the
lesion or epiphytically. 120 hai, infection spot became necrotic and it was infested by
the pathogen. Tissue collapse and necrosis as a final disease stadium were well
documented by ultrastructural studies (Speiers and Haworth 1989; Soylu et al. 2005).
Faint chlorophyll fluorescence could be detected from deep leaf interior. Large
bacterial colonies were filling empty space beneath epidermis. However, bacteria
were not moving inside these colonies in spite they were yet fluorescent. Active cells
could only be found at the lesion edge. The pathogen is supposed to be dead at the
necrotic site. Boureau et al. (Boureau et al. 2002) described outburst of endophytic
Pseudomonas population from leaf interior towards leaf surface after necrosis of
infected tissue. However, we did not detect any noteworthy epiphytic colonization of
the leaf. Indeed, it might be disturbed by a specimen mounting procedure.
70
Figure 11 Visualization P. syringae DC3000-pTB93F colonizing leaf interior by wide-field
microscopy. Bacterial colonization was followed for 5 days after inoculation. The infection
development was visualized from adaxial and abaxial sides of Arabidopsis leaves. The images are
maximum projections of image stacks acquired within the depth 50 - 100 µµµµm below epidermis.
Magnification bars represent 20 µµµµm.
Heterogeneity of tissue response to virulent and avirulent strain of P. syringae
visualized in three dimensions
Visual symptoms accompanying a compatible plant-pathogen interaction (infection by
a virulent strain) can be hardly distinguished from an incompatible interaction
(infection by avirulent strain). Similarly, the imaging of chlorophyll fluorescence
kinetics failed to reveal considerable differences between treatment of A. thaliana
leaves by virulent and avirulent strain of P. syringae (Berger et al. 2004; Bonfig et al.

71
2006; Berger et al. 2007). The only difference at the macroscopic level was the
greater extent and faster onset of symptoms elicited by the avirulent strain (Berger et
al. 2007). However, completely distinct events are behind similar manifestation.
While virulent bacteria are able to multiply in the host tissue and establish a huge
population, avirulent bacteria failed to grow. They are stopped by induction of
hypersensitive reaction (HR). A programmed cell death (apoptosis) is an
indispensable part of the HR, during which the infected cells are eliminated. The
macroscopic symptoms related to the pathogen accumulation, distribution and
arrangement of bacterial population were studied at the cellular level using wide-field
and two-photon fluorescence microscopy.
Figure 12 Different patterns of green fluorescence were elicited in plant tissue by virulent
(DC3000-pTB93F) and avirulent (RPM1-pTB93F) strain of P. syringae. Green fluorescence was
excited by blue LED (475 nm) and collected at 505 – 540 nm spectral window. Micrographs were
acquired by wide-field microscope with low magnification objective 20x Uapo/340 NA 0.75. Scale
bars represent 20 µµµµm.
Figure 12 shows typical patterns of green fluorescence found in tissue infected
by virulent and avirulent gfp-tagged bacteria. Images were acquired by epi-
fluorescence microscope Olympus IX70. The green fluorescence was selected by the
emission filter Semrock FF01 542/50. Vital virulent bacteria labeled by GFP were
observed in infection lesion 24 hai (arrow in Figure 12a). In contrast, no pathogen
cells could be recognized in the tissue infiltrated by the avirulent strain. Only specks
of increased green fluorescence were typically found at the infiltration spot 24hai
(Figure 12c, d). Similar specks without bacteria were also seldom observed in the
infection lesion of virulent strain (Figure 12b). Supposedly, the specks of enhanced
fluorescence are an undetermined plant auto-fluorescence.

72
To further explore the origin of green fluorescence, its 3D distribution was
imaged using a two-photon microscopy (TPM).
The wide-field microscopic images are degraded by an out-of-focus signal. It
is hard to remove it and restore the depth information. However, recent development
in microscopy provides a new opportunity to study distribution of various structures
and compounds localized inside the tissue. Here, two-photon microscopy (TPM) was
used to examine infected samples in three dimensions. The technique relies on the
coincident absorption of two photons of twice the excitation wavelength by a single
fluorophore (Shaw 2006). The absorption of two photons in certain time interval
brings the fluorophore to the excited state. The low probability of two-photon
absorption restricts the effect to the extremely thin plane of focus and allows optical
sectioning.
Figure 13 presents two-photon fluorescence emission from a leaf of
Arabidopsis thaliana that was infected with gfp-tagged bacteria Pseudomonas
syringae. Green pseudo-color is assigned to green emission detected in emission
window 500-540 nm. Red color visualizes chlorophyll fluorescence emanating from
chloroplasts of palisade mesophyll cell layer. It was detected in the 680-700 nm
range. The single excitation wavelength of 900 nm was used to excite both
chlorophyll and GFP (Zipfel et al. 2003). Advantage of using a single excitation
wavelength to elicit multiple color fluorescence minimizes differential effects of the
objective chromatic aberration. One can be sure that the signal obtained from different
emission channels is assigned to the same focal plane. Figure 13A shows the GFP-
tagged Pseudomonas cells, virulent and avirulent strain, detected several micrometers
deep in the leaf tissue (25 µm and 8 µm respectively). Cells of leaf mesophyll are well
defined by the red chlorophyll fluorescence that emanates from chloroplasts outlining
each plant cell. Although, some level of green auto-fluorescence contaminated this
spectral channel, virulent bacteria can be easily distinguished as bright, rod-shaped
objects (arrow) several micrometers long. In contrast, only enhanced green
fluorescence 8 µm beneath the epidermis but no bacteria can be found after treatment
with avirulent Pseudomonas strain.
Figure 13B shows the GFP expressing Pseudomonas cells recorded from
different tissue layers. The depth information was derived from the stomata location
representing surface layer (0 µm). The stomata were clearly visible due to their green

73
auto-fluorescence in the GFP spectral channel. It is obvious that the green auto-
fluorescence is inherent to the plant tissue (control) (Rost 1995). However, it is
considerably weaker compared to the emission of the GFP labeled bacteria. The
bacteria can be easily distinguished owing to their typical shape. The GFP signal was
also differently distributed compared to the green auto-fluorescence. While auto-
fluorescence originated mostly from stomata and chloroplasts of mesophyll tissue
(control), virulent bacteria were dispersed through the entire volume (virulent).
Two strains of Pseudomonas syringae, the virulent and the avirulent, were
compared in their distribution in the leaf tissue 24 hours after infiltration. Figure 13B
shows that the virulent bacteria were dispersed through the inspected tissue depth with
wide maximum between 5 – 20 µm under the surface. In contrast, only few avirulent
bacteria could be seen on the highly fluorescing background which does not
correspond to any internal leaf structure. The signal was predominantly restricted to
several micrometers under the epidermis.
Figure 13C shows a relationship between the distribution of integral
fluorescence intensity of each tissue layer and distance from the leaf surface. The
weak green auto-fluorescence of healthy tissue (control) does not considerably change
over the first 10 µm. With the increasing distance from the epidermis, the auto-
fluorescence gradually declined and reached half value at the depth 20 µm
corresponding to chloroplasts of mesophyll parenchyma. In contrast, the increase of
green emission was linear with the distance from epidermis for the first 10 µm in leaf
infected by virulent strain. A flattened maximum was identified between the layer of
10 and 16 µm which was followed by a rapid decline in fluorescence toward
mesophyll cells. While the signal of epidermis was only 20 % higher than in control
sample, it was approximately doubled close to the maximum. In the case of avirulent
infection, signal from the epidermis was twice the control. It was rapidly increasing
reaching the maximum at 5 µm beneath the surface which was 3 times higher than the
control value. Then, the fluorescence quickly declined reaching value of control
sample 15 µm beneath the surface.

74
Figure 13 Three-dimensional distribution of pathogenic bacteria (Pseudomonas syringae) relative
to steady-state chlorophyll auto-fluorescence of mesophyll cells visualized with two-photon
microscope. The images were captured 24 hours after the pathogen infiltration. Images are
presented in false colors: GFP-expressing bacteria are shown green and chlorophyll fluorescence
red. (a) A single optical sections acquired 25 µµµµm beneath the adaxial epidermis at the center of
the infection lesion caused by the virulent strain of P. syringae. Individual bacteria (white arrow)

75
were dispersed in air spaces of mesophyll tissue. (b - c) The three-dimensional scene was
reconstructed from multiple successive optical sections. The depth separation between individual
slices was 1µµµµm. Reconstructions were performed by mounting a transverse section with slice
surface (b) or by direct volume rendering in ImageJ software (Abramoff et al. 2004). (d) The
majority of green fluorescence was recorded in more superficial layers of tissue infected with
avirulent strain 24 hai. An optical section was taken at 8 µµµµm below the epidermis. (e - f) The
three-dimensional reconstructions of the green and red fluorescence of tissue affected by
avirulent strain. Scale bar represents 20 µµµµm.
Series of optical sections (Figure 13B) corresponding to different focal planes
from the leaf surface to the depth of about 30 µm was combined to generate
reconstructions shown in Figure 13D. Top panel of Figure 13D represents the
reconstructed cross-section of the tissue volume mounted together with borders of the
volume stack. Bottom panel of Figure 13D shows the tissue volume rendered in a 3D
scene. The imaged volume corresponded to the space between the epidermis
characterized by the green auto-fluorescence of stomata and the upper cell layer of
palisade parenchyma. Both reconstructed images show that bacteria were mainly in
the space between epidermis and the first layer of mesophyll. The bacterial colonies
were preferentially formed in the air spaces under stomata. The stomata are not well
visible in the reconstructed image and their position is indicated by the letter 'S'.
Pseudomonas syringae is an aerobic bacterium. Its preferential growth under the
stomata might imply its demand for oxygen availability especially during pathogen
growth (Wilson and Lindow 1994).
Right part of Figure 13D shows the enhanced amount of green fluorescence
8 µm beneath the epidermis after treatment with avirulent Pseudomonas strain. The
green emission was mainly found in the outer tissue layers. The pattern of green
fluorescence did not correspond to any structure resembling bacteria. We suggest that
this green emission originated in compounds naturally occurring in leaf tissue whose
production was induced by plant immune response to the avirulent pathogen. The
interesting feature was the swollen tissue after treatment with virulent strain, which
was not observed in incompatible interaction and neither in control untreated leaf
tissue. Chlorophyll fluorescence bears an evidence of the presence of chloroplasts
belonging to mesophyll tissue already 8 µm under the epidermis.
76
Figure 14 Three-dimensional distribution of green fluorescence visualized by two-photon
microscope: (A) TPM images of GFP tagged Pseudomonas bacteria visualized in Arabidopsis
leaves 24 hai at abaxial leaf surface (0 µµµµm) and 5, 10 and 15 µµµµm from it. Optical sections were
taken at the inoculation site infiltrated by virulent or avirulent strains of P. syringae.
Visualization of stomata indicates surface position, which was designated as 0 µµµµm. The green
fluorescence was excited with 900 nm infra-red laser light and recorded in the spectral window
500 – 540 nm, where also a weak green auto-fluorescence of non-infected tissue is detected
(control). Scale bar is 30 µµµµm. (B) Integral intensities of green fluorescence corresponding to TPM
images acquired at various depths in the non-infected leaf (solid line) and leaves infected with
virulent (black squares) and avirulent (white squares) strains of P. syringae. The average was
calculated from images of the same size 106 x 94 µµµµm. (C) Development of bacterial colonization
by virulent and avirulent strain was monitored after infiltration and 12 and 24 hai. Images
represent the maximum Z projection through a series of optical sections. Scale bar is 20 µµµµm. (D)
The relation of green fluorescence accumulation within various tissue layers was monitored in
time, with infection progression.
The development of green fluorescence signal was monitored at different time
points, before, 12 and 24 hours after infiltration of leaf by virulent or avirulent
bacteria (Figure 14). Immediately after infiltration, both, virulent and avirulent
bacteria were clearly visible dispersed within tissue of infiltration spot (Figure 14A).
Apparent increase of population of virulent pathogen was recognized 12 hours later.
However, the population of avirulent strain seemed to stagnate. Also, the first green
specks appeared at this time-point. 24 hai, the leaf tissue infected with virulent strain
was heavily infested in contrast to incompatible pathogen tissue interaction where
only small amount of bacteria were found in addition to typical green specs.

77
Figure 14B shows the integral fluorescence intensity relative to tissue depth.
The GFP signal from the virulent bacteria increases from epidermis to the depth of
approximately 10 – 15 µm where it reaches the broad maximum. The similar profile
was observed 12 hai as well as 24 hai in compatible and to less extent also in
incompatible plant - pathogen interaction. In contrast, tissue response to avirulent
pathogen induces apparent enhancement of auto-fluorescence about 5 µm under
epidermis 24 hai.
Our data supports a generally accepted model. The reproduction of avirulent
bacteria in the host tissue is restricted by plant immune system already several hours
after inoculation - contrary to the virulent bacteria that succeed to multiply to large
populations. In addition, blue and green plant auto-fluorescence is typically enhanced
by various stress factors (Lichtenthaler and Miehe 1997; Hideg et al. 2002). The
green emission in our sample could be attributed to phenolic compounds
accumulating due to induction of plant defense response. A strong correlation
between cell death and phenolics accumulation was reported in cells undergoing the
HR, whereas it was not observed during compatible interaction (Baker et al. 2005;
Soylu 2006).
Figure 15 Two-photon micrograph of green plant auto-fluorescence (GF). The GF was excited by
745 nm that corresponded to approximately 370 nm (UV-A). Adaxial leaf side of A. thaliana
infected by virulent and avirulent strain of P. syringae was compared for GF signal emanating
from different depth of the leaf tissue. The images of individual optical sections were taken at the
leaf surface and 10, 20, 30 and 40 µµµµm inside. On the most outer leaf surface, the green emission of
stomata (arrows) dominates was used as a reference point ‘0’ for depth determination. Scale bar
xxx µµµµm.
If plant phenolics are the major fluorophore of the auto-fluorescence specs, the

78
similar fluorescence patter must be induced by blue as well as UV illumination. The
distribution of blue light induced green fluorescence was compared with UV induced
green emission of tissue challenged by virulent and avirulent strain. Figure 15 shows
a depth profile of UV induced green fluorescence. Stomata emitted the bright signal
which is detected in the most surface layers. Majority of green auto-fluorescence
corresponds to cells of leaf epidermis or emanates from chloroplasts of the first layer
of mesophyll. Figure 15 clearly shows a selective enhancement of GF during
incompatible interaction with RPM1 strain of Pseudomonas syringae. This pattern
was different from the one induced by blue excitation suggesting their distinct origin.
To elucidate the origin of green fluorescence, fluorescence emission spectra
were measured by spectrometer fiber-coupled with the microscope. The light guide
was mounted into self-made holder inserted into ocular port of the microscope. The
tissue of interest was selected by closing field stop aperture and thus minimizing the
illuminated field. Figure 16 shows emission spectra measured by micro-spectro-
fluorometry under blue excitation 475 nm. Five representative samples with
corresponding spectra are shown in Figure 16. The low level of green auto-
fluorescence was typical for the control, healthy plant tissue. Its emission spectrum
(black line) does not exhibit any extremes. The spot of bright signal is most likely
attributed to the impurity on the leaf surface or a micro injury caused while
manipulating with plant earlier. A suspension of virulent bacteria carrying a gfp gene
represented a positive control. The maximum fluorescence emission (red triangles)
peaked at about 510 nm that is wavelength characteristic for GFP emission maximum.
Similar spectrum (dark blue squares) was obtained from the tissue infected by these
virulent bacteria for 24 hours. Intensity of emission was more than 2 times higher
probably owing to more bacteria concentrated at the illuminated field. In contrast, the
signal detected from tissue treated with avirulent strain of P. syringae (green circles)
displayed broad maximum between 550 - 570 nm. Furthermore, the spectrum of
increased green signal from tissue infected by the virulent strain where no GFP tagged
bacteria were visible (light blue squares – corresponding image not shown) was
compared with the tissue infected with wild-type virulent bacteria not carrying gfp
plasmid (empty blue squares). Interestingly, the shape of both spectra did not show
appreciable variations. The broad peak was shifted to lower wavelengths around 530
– 550 nm comparing to incompatible interaction. The later sample was considered as

79
the negative control and showed the very late phase of the disease, after tissue
collapse (Soylu et al. 2005).
Figure 16 Microspectroscopic analysis of green fluorescence: (A) Wide-field fluorescence
micrographs acquired with green emission filter Semrock FF01 542/50: (a) control, healthy plant
tissue, (b) a suspension of GFP labelled virulent strain of P. Syringae carrying plasmid pTB93F,
(c) single green bacteria and small colonies (white arrows) in leaf tissue infected with virulent
strain of the pathogen, (d) leaf tissue 24 hours after infiltration with avirulent strain carrying the
same GFP plasmid, (e) tissue infected with wild-type virulent bacteria not synthesizing GFP. The
intensity scale of all images is the same. (B) Emission spectra corresponding to micrographs:
spectra were measured without the emission filter using optical spectrometer SM9000 (PSI,
Brno, www.psi.cz): black line – control tissue, red triangles – DC3000-pTB93F bacterial
suspension, dark blue squares – signal from tissue infected with virulent strain carrying pTB93F
(values are displayed on secondary y-axis), light blue squares – tissue of the same infection lesion
without individual bacteria visible (image not shown), green circles – leaf infected by avirulent
GFP labelled strain, empty blue squares – tissue from infection lesion of wild-type virulent
Pseudomonas strain.
80
Plant tissues are in general abundant of auto-fluorescent compounds localized
in cell walls, chloroplasts and vacuoles (Rost 1995). Blue light is strongly absorbed
by chlorophylls and carotenoids of thylakoid membranes inducing red and infra-red
chlorophyll fluorescence emission. However, blue photons elicit also weak auto-
fluorescence of shorter wavelength. The green auto-fluorescence emanated
predominantly from the epidermal tissue layer (data not shown). We demonstrated
that GFP is a dominant green fluorophore in tissue inoculated by the virulent strain
(DC3000/pTB93F). However, the isolated islands of increased yellow-green
fluorescence were detected sporadically at sites where bacteria were absent. Similar
spectrum was acquired also from mesophyll cells which had collapsed 48 hours after
inoculation with wild-type virulent Pseudomonas strain. These specks were
characteristic by their broad emission spectrum suggesting contribution of different
fluorophores that is a typical feature of auto-fluorescence (Agati et al. 2005). The
similar development of UV induced yellow-green and later shift to bright blue
fluorescence was reported in mesophyll tissue after cell collapse (Soylu 2006). He
also observed strong correlation between the bright blue-green auto-fluorescence
induced by UV and HR response on exposure to avirulent pathogen challenge. UV
induced fluorescence spectra integrate various fluorophores: derivatives of
hydroxycinnamic acid as well as flavonoids (Agati et al. 2005). However, blue light
exclusively excites flavonoids (Hutzler et al. 1998). Flavonoids have been shown to
accumulate in epidermal cells (Hutzler et al. 1998) as well as mesophyll of leaves
exposed to UV-B. We suppose that their accumulation induced by avirulent infection
agent might be related to their antioxidative effects. Flavonoids located in chloroplasts
were shown to scavenge singlet oxygen (Agati et al. 2007).

81
Conclusion
The use of GFP was evaluated as a tool to visualize plant pathogen Pseudomonas
syringae in intact leaves of Arabidopsis thaliana. Bacteria were marked with the gfp
gene from Aequorea victoria carried on three different plasmid constructs: pTB93F,
pKT-trp and pPNpt-Green. The transformed strains were tested for their yield of GFP
fluorescence, morphological, and microbiological properties. We showed that plasmid
pTB93F is particularly useful, because of its fluorescence brightness, stability in the
absence of antibiotic selection, undetectable metabolic burden on cell carrying the
plasmid, and the best resemblance to the wild-type strains in pathogenicity and
virulence. The plasmid pTB93F carries the gene encoding enhanced variant of GFP
under control of strong trp promoter from Salmonella typhimurium.
We showed that constitutively expressed EGFP can be used to observe
virulent bacteria in undisturbed plant leaves by wide-field and two-photon
fluorescence microscopy (TPM). TPM allows visualization of GFP reporter bacteria
in three dimensions. However, a depth limitation was found to be around 40 µm - 60
µm beneath the leaf epidermis. Leaf is an inherently thick specimen with uneven
surface. It is abounded of pigments that shield excitation light restricting light
penetration into limited depth. And vice versa, GFP fluorescence is reabsorbed on the
way back to the detector. Another complication is the auto-fluorescence background
or noise from the environment where reporter bacteria are to be analyzed. We showed
that green auto-fluorescence induced by blue light is very weak comparing to bright
reporter bacteria. However, specific green auto-fluorescence excited by blue light was
increased in leaves infected by avirulent pathogen. The auto-fluorescence signal was
distinguish from GFP fluorescence using micro-spectro-fluorometry.
The pathogen was observed in susceptible and resistant plant environment in
different infection stages. The population of the avirulent pathogen decreases in the
resistant cultivar in contrast to virulent bacteria that multiplied to high population
density in susceptible cultivar. Therefore the use of GFP fluorescence can serve as a
real-time in situ reporter of population dynamics in planta that would obviate labor
intensive and time consuming traditional enumeration techniques.

82
3. Chlorophyll fluorescence imaging, a tool for early
pathogen detection
Sources:
Matous K., Benediktyova Z., Berger S., Roitsch T. and Nedbal L. (2006) Case study
of combinatorial imaging: What protocol and what chlorophyll fluorescence image to
use when visualizing infection of Arabidopsis thaliana by Pseudomonas syringae?
Photosynthesis Research 90: 243-253
Berger S., Benediktyova Z., Matous K., Bonfig K., Mueller M., Nedbal L. and
Roitsch T. (2007) Visualization of dynamics of plant-pathogen interaction by novel
combination of chlorophyll fluorescence imaging and statistical analysis: differential
effects of virulent and avirulent strains of P. syringae and oxylipins on A. thaliana.
Journal of Experimental Botany 58 (4): 797-806
Motivation:
Since the beginning of human civilization, plant diseases have had a
catastrophic impact on well-being of our population. Nowadays, the increasing
population and receding agricultural land make all approaches to rescue the world
food supply important. Simple protection of crop from diseases can improve
agricultural production. Although, pesticides can successfully control many diseases,
their excessive use can have an adverse effect on human health (Alavanja et al. 2004).
Approaches involving early and effective infection detection that can be followed by a
prompt and targeted application of minimal chemical doses are preferred. Cultivars or
mutants with an increased tolerance to biotic stress are part of the complex solution
(Chaerle et al. 2007).
For either of these approaches, use of non-invasive imaging methods holds
promise for pre-symptomatic detection or screening (Lenk et al. 2007). Imaging is
particularly suited to visualize heterogeneity within a plant organ or among screened

83
plants. Especially, localized responses can be clearly diagnosed against the unstressed
tissue background. Alternatively, stressed or mutant individuals can be identified in
heterogeneous vegetation.
Several imaging techniques are available in plant research nowadays (Chaerle
and Van der Straeten 2001). They are mostly based on non-destructive monitoring of
different optical signals in various spectral regions: reflection of visible light, blue,
green or red fluorescence, infrared thermal emission or weak chemiluminescence of
oxidated lipids (Bennett et al. 2005). Among them, the chlorophyll fluorescence
imaging has been widely used because of its sensitivity to various stresses. The
chlorophyll fluorescence emission carries information about photochemical
performance and regulation of photosynthesis (Nedbal and Koblizek 2006). Its
sensitivity to biotic stress is thereby not surprising, since most successful pathogens
tend to modulate plant primary metabolism, where the process of photosynthesis plays
a central role.
In the following two papers, the chlorophyll fluorescence imaging was used to
contribute to a better understanding of events occurring in model plant Arabidopsis
thaliana infected by hemibiotrophic pathogen Pseudomonas syringae.

84
Case study of combinatorial imaging: What protocol and what
chlorophyll fluorescence image to use when visualizing infection of
Arabidopsis thaliana by Pseudomonas syringae?
Published:
Matous K., Benediktyova Z., Berger S., Roitsch T. and Nedbal L. (2006) Case study
of combinatorial imaging: What protocol and what chlorophyll fluorescence image to
use when visualizing infection of Arabidopsis thaliana by Pseudomonas syringae?
Photosynthesis Research 90: 243-253
Abstract:
Localized infection of a plant can be mapped by a sequence of images capturing
chlorophyll fluorescence transients in actinic light. Choice of the actinic light protocol
co-determines fluorescence contrast between infected leaf segment and surrounding
healthy tissue. Frequently, biology cannot predict with which irradiance protocol, in
which fluorescence image of the sequence, and in which segment of the image there
will be the highest contrast between the healthy and infected tissue. Here, we
introduce a new technique that can be applied to identify the combination of
chlorophyll fluorescence images yielding the highest contrast. The sets of the most
contrasting images vary throughout the progress of the infection. Such specific image
sets, stress-revealing fluorescence signatures, can be found for the initial and late
phases of the infection. Using these signatures, images can be divided into segments
that show tissue in different infection phases. We demonstrate the capacity of the
algorithm in an investigation of infection of the model plant Arabidopsis thaliana by
the bacterium Pseudomonas syringae.

85
Souhrn:
Lokalizovaná rostlinná infekce může být mapována sekvencí obrázků zachytávajících
přechodový jev chlorofylové fluorescence v aktinickém světle. Výběr měřícího
protokolu spoluurčuje kontrast ve fluorescenci mezi infikovaným segmentem a
okolním zdravým tkanivem. Mnohdy nemůže biologie předpovědět s jakým
fluorescenčním protokolem, ve kterém obrázku sekvence a ve kterém segmentu
obrazu bude největší kontrast mezi zdravým a infikovaným tkanivem. V této práci
jsme představili novou techniku, která může být použita pro identifikaci kombinace
fluorescenčních obrázků s nejvyšším kontrastem. Sada nejkontrastnějších obrázků se
mění během postupující infekce. Takové sety obrázků - otisky stresu, jsou specifické
pro počáteční a pozdní fáze infekce. S použitím těchto otisků mohou být jednotlivé
obrázky rozděleny do segmentů, které zobrazují infekci v různých fázích. Kapacitu
algoritmu jsme demonstrovali na bakteriální infekci Pseudomonas syringae
v modelové rostlině Arabidopsis thaliana.

96
Visualization of dynamics of plant-pathogen interaction by novel
combination of chlorophyll fluorescence imaging and statistical
analysis: differential effects of virulent and avirulent strains of P.
syringae and oxylipins on A. thaliana.
Published:
Berger S., Benediktyova Z., Matous K., Bonfig K., Mueller M., Nedbal L. and
Roitsch T. (2007) Visualization of dynamics of plant-pathogen interaction by novel
combination of chlorophyll fluorescence imaging and statistical analysis: differential
effects of virulent and avirulent strains of P. syringae and oxylipins on A. thaliana.
Journal of Experimental Botany 58 (4): 797-806
Abstract:
Pathogen infection leads to defence induction as well as to changes in carbohydrate
metabolism of plants. Salicylic acid and oxylipins are involved in the induction of
defence, but it is not known if these signalling molecules also mediate changes in
carbohydrate metabolism. In this study, the effect of application of salicylic acid and
the oxylipins 12-oxo-phytodienoic acid (OPDA) and jasmonic acid on photosynthesis
was investigated by kinetic chlorophyll fluorescence imaging and compared with the
effects of infection by virulent and avirulent strains of Pseudomonas syringae. Both
pathogen strains and OPDA caused a similar change in fluorescence parameters of
leaves of Arabidopsis thaliana. The response to OPDA appeared faster compared with
that to the pathogens and persisted only for a short time. Infiltration with jasmonic
acid or salicylic acid did not lead to a localized and distinct fluorescence response of
the plant. To capture the faint early symptoms of the plant response, a novel algorithm
was applied identifying the unique fluorescence signature—the set of images that,
when combined, yield the highest contrast between control and infected leaf
segments. Unlike conventional fluorescence parameters, this non-biased approach

97
indeed detected the infection as early as 6 h after inoculation with bacteria. It was
possible to identify distinct fluorescence signatures characterizing the early and late
phases of the infection. Fluorescence signatures of both infection phases were found
in leaves infiltrated with OPDA.
Souhrn:
Infekce patogenem způsobuje spouštění obranných mechanismů a také změny
v metabolismu cukrů. Kyselina salicilová a oxilipiny jsou zapojeny do aktivace
obranných reakcí, ale není známo, jestli zprostředkovávají i změny v metabolismu
uhlovodanů. V této práci jsme zkoumali účinek aplikování kyseliny salicilové,
oxylipinu 12-oxo-phytodienoic acid (OPDA) a kyseliny jasmonové na fotosyntézu
metodou zobrazování chlorofylové fluorescence. Vliv těchto látek byl porovnáván s
účinky vyvolanými infekcí virulentním a avirulentním kmenem Pseudomonas
syringae. Oba patogeny a OPDA se projevovaly podobnými změnami fluorescenčních
parametrů, ale na rozdíl od vlivu infekce se odpověď na OPDA objevila dříve a
vymizela v krátkém čase. Infiltrace kyseliny jasmonové a salicilové nevedla k
lokalizované fluorescenční odpovědi rostliny. Abychom zachytili slabé symptomy
rané infekce, byl použit nový algoritmus identifikace stresového fluorescenčního
otisku – sada obrázků, která nese v kombinaci největší kontrast mezi zdravým a
infikovaným listovým segmentem. Na rozdíl od konvenční analýzy bylo možné
identifikovat zřetelný fluorescenční stresový otisk již 6 hodin po infikaci. S použitím
této metody jsme také odlišili ranou a pozdní fázi infekce. Fluorescenční otisk obou
fází byl identifikován také v tkanivu infiltrovaném OPDA.

107
4. Micro-imaging of photosynthetic activity
Published:
Matous K., Benediktyova Z., Berger S., Roitsch T. and Nedbal L. (2006) Case study
of combinatorial imaging: What protocol and what chlorophyll fluorescence image to
use when visualizing infection of Arabidopsis thaliana by Pseudomonas syringae?
Photosynthesis Research 90: 243-253
Abstract:
Oxygenic photosynthesis of higher plants requires linear electron transport that is
driven by serially operating Photosystem II and Photosystem I reaction centers. It is
widely accepted that distribution of these two types of reaction centers in the
thylakoid membrane is heterogeneous. Here, we describe two optical microscopic
techniques that can be combined to reveal the heterogeneity. By imaging micro-
spectroscopy at liquid nitrogen temperature, we resolved the heterogeneity of the
chloroplast thylakoid membrane by distinct spectral signatures of fluorescence
emitted by the two photosystems. With another microscope, we measured changes in
the fluorescence emission yield that are induced by actinic light at room temperature.
Fluorescence yield of Photosystem II reaction centers varies strongly with light-
induced changes of its photochemical yield. Consequently, application of moderate
background irradiance induces changes in the Photosystem II fluorescence yield
whereas no such modulation occurs in Photosystem I. This contrasting feature was
used to identify regions in thylakoid membranes that are enriched in active
Photosystem II.
108
Souhrn:
Oxygenní fotosyntéza vyšších rostlin vyžaduje lineární elektronový transport řízený
Fotosystémem II a Fotosystémem I, které jsou organizovány v sérii. Je všeobecně
známo, že distribuce těchto dvou typů reakčních center v tylakoidní membráně je
heterogenní. V této práci popisujeme dvě zobrazovací mikroskopické metody, které
v kombinaci přinesly důkaz o heterogenitě. Pomocí zobrazovací mikrospektroskopie
při teplotě tekutého dusíku byla rozlišena heterogenita membrány na základě odlišné
spektrální charakteristiky fluorescence vyzářené dvěma fotosystémi. Jiným
mikroskopem byly měřeny změny výtažku fluorescenční emise indukované
aktinickým světlem při laboratorní teplotě. Fluorescenční emise reakčních center
Fotosystému II se silně mění se světlem indukovanými změnami výtažku fotochemie.
Změny v osvětlení tedy indukují změny ve výtažku fluorescence Fotosystému II, ale
ne Fotosystému I. Tento rozdíl byl použit k identifikaci oblastí tylakoidní membrány
s větším výskytem aktivného Fotosystému II.

114
SUMMARY
Reporter capacity of various fluorescence signals intrinsic to plant tissues was
examined at macro and micro-scales.
The macroscopic imaging of chlorophyll fluorescence kinetics allowed non-
invasive monitoring of Pseudomonas syringae pathogenesis from whole plants of
Arabidopsis thaliana. Introducing a new data mining procedure, the combinatorial
imaging, detection sensitivity to infection was significantly enhanced over the
conventional analysis. Identification of a set of fluorescent parameters, the
fluorescence signature, yielded recognition of early and late infection phases.
Moreover, the fluorescence signature was used to differentiate between compatible
and incompatible plant – pathogen interaction and to evaluate potential involvement
of several plant hormones in defense induction. The presented technique is supposed
to be applicable for identification of various biotic and abiotic stresses or in other
applications such as species or photosynthetic mutant discrimination.
Adoption of microscopy techniques improved spatial resolution and allowed
exploring pathogenesis at a cellular level. While, the non-invasive imaging of
chlorophyll fluorescence of whole Arabidopsis plants revealed similarities in response
to treatment with virulent and avirulent strain of P. syringae, microscopy discovered
a substantial difference in their population dynamics. Further improvement was
achieved by combined imaging of two or more fluorescence reporter signals and
introduction of advanced microscopy techniques such as two-photon microscopy. It
allowed quantitative in situ monitoring of several fluorescent signals simultaneously
in three dimensions. This capacity opened perspective to study mutual interaction
between two organisms, the proliferating pathogen and affected plant tissue.
Furthermore, the non-linear absorption of two-photons led to visualization of
fluorescence signals which are hidden to conventional single-photon techniques.

115
REFERENCES
Abramoff MD, Magelhaes PJ, Ram SJ (2004) Image processing with ImageJ.
Biophotonics International 11:36-42
Agati G, Galardi C, Gravano E, Romani A, Tattini M (2002) Flavonoid distribution in
tissues of Phillyrea latifolia L. leaves as estimated by microspectrofluorometry
and multispectral fluorescence microimaging. Photochem Photobiol 76:350-
360
Agati G, Matteini P, Goti A, Tattini M (2007) Chloroplast-located flavonoids can
scavenge singlet oxygen. New Phytologist 174:77-89
Agati G, Pinelli P, Ebner SCS, Romani A, Cartelat A, Cerovic ZG (2005)
Nondestructive evaluation of anthocyanins in olive (Olea europaea) fruits by
in situ chlorophyll fluorescence spectroscopy. Journal of Agricultural and
Food Chemistry 53:1354-1363
Alavanja MCR, Hoppin JA, Kamel F (2004) Health effects of chronic pesticide
exposure: Cancer and neurotoxicity. Annual review of public health 25:155-
197
Baker C, Whitaker B, Roberts D, Mock N, Rice C, Deahl K, Aver'yanov A (2005)
Induction of redox sensitive extracellular phenolics during plant-bacterial
interactions. Physiological and Molecular Plant Pathology 66:90-98
Bennett M, Mehta M, Grant M (2005) Biophoton imaging: A nondestructive method
for assaying R gene responses. Molecular Plant-Microbe Interactions 18:95-
102
Berg RH, Beachy RN (2008) Fluorescent protein applications in plants. In: Sullivan
KF (ed) FLUORESCENT PROTEINS, Academic Press, London
Berger S, Benediktyova Z, Matous K, Bonfig K, Müller MJ, Nedbal L, Roitsch T
(2007) Visualization of dynamics of plant-pathogen interaction by novel
combination of chlorophyll fluorescence imaging and statistical analysis:
differential effects of virulent and avirulent strains of P. syringae and of
oxylipins on A. thaliana. J Exp Bot 58:797-806
Berger S, Papadopoulos M, Schreiber U, Kaiser W, Roitsch T (2004) Complex

116
regulation of gene expression, photosynthesis and sugar levels by pathogen
infection in tomato. Physiologia Plantarum 122:419-428
Blankenship RE (2002) Molecular mechanisms of photosynthesis. Blackwell Science
Ltd, London, UK
Bloemberg G, O’Toole G, Lugtenberg B, Olter R (1997) Green Fluorescent Protein as
a Marker for Pseudomonas spp. Appl Environ Microb 63:4543–4551
Bogs J, Bruchmüller I, Erbar C, Geider K (1998) Colonization of Host Plants by the
Fire Blight Pathogen Erwinia amylovora Marked with Genes for
Bioluminescence and Fluorescence. The American Phytopathological Society
88:416-421
Bonfig K, Schreiber U, Gabler A, Roitsch T, Berger S (2006) Infection with virulent
and avirulent P. syringae strains differentially affects photosynthesis and sink
metabolism in Arabidopsis leaves. Planta in press:
Boureau T, Routtu J, Roine E, Taira S, Romantschuk M (2002) Localization of hrpA -
induced Pseudomonas syringae pv. tomato DC3000 in infected tomato leaves.
MOLECULAR PLANT PATHOLOGY 3:451–460
Buschmann C, Langsdorf G, Lichtenthaler HK (2000) Imaging of the blue, green, and
red fluorescence emission of plants: An overview. Photosynthetica 38:483-491
Cerovic ZG, Langrand E, Latouche G, Morales F, Moya I (1998) Spectral
characterization of NAD(P)H fluorescence in intact isolated chloroplasts and
leaves: Effect of chlorophyll concentration on reabsorption of blue-green
fluorescence. Photosynth Res 56:291-301
Cerovic ZG, Morales F, Moya I (1994) Time-resolved spectral studies of blue-green
fluorescence of leaves, mesophyll and chloroplasts of sugar beet (Beta
vulgaris L). BBA-Bioenergetics 1188:58-68
Cerovic ZG, Samson G, Morales F, Tremblay N, Moya I (1999) Ultraviolet-induced
fluorescence for plant monitoring: present state and prospects. Agronomie
19:543-578
Cockell CS, Knowland J (1999) Ultraviolet radiation screening compounds.
Biological Reviews 74:311-345
Croce R, Cinque G, Holzwarth AR, Bassi R (2000) The Soret absorption properties of
carotenoids and chlorophylls in antenna complexes of higher plants.
Photosynth Res 64:221-231
Frank H, Chynwat V, Desamero R, Farhoosh R, Erickson J, Bautista J (1997) On the

117
photosynthetics and photochemical properties of carotenoids and their role as
light-harvesting pigments in photosynthesis. Pure Appl Chem 69:2117-2124
Gage DJ, Bobo T, Long SR (1996) Use of green fluorescent protein to visualize the
early events of symbiosis between Rhizobium meliloti and alfalfa (Medicago
sativa). Journal of Bacteriology 178:7159-7166
Govindjee (1995) Sixty-three years since Kautsky: Chlorophyll a fluorescence.
Australian Journal of Plant Physiology 22:131 - 160
Govindjee (2004) Chlorophyll a Fluorescence: A Bit of Basics and History. In:
Papageorgiou G,Govindjee (ed) Chlorophyll a Fluorescence: A Signature of
Photosynthesis, Springer, Netherlands
Hallmann J, Quadt-Hallmann A, Miller WG, Sikora RA, Lindow SE (2001)
Endophytic colonization of plants by the biocontrol agent Rhizobium etli G12
in relation to Meloidogyne incognita infection. Phytopathology 91:415-422
Hammond-Kosack K, Jones J (1996) Resistance genedependent plant defense
responses. Plant Cell 8:1773–1791
Harborne J, Williams C (2000) Advances in flavonoid research since 1992.
PHYTOCHEMISTRY 55:481-504
Heath MC (2000) Hypersensitive response-related death. Plant Molecular Biology
44:321-334
Heim R, Prasher D, Tsien RY (1994) Wavelength mutation and post-translation
autoxidation of green fluorescent protein. P Natl Acad Sci USA 91:12501-
12504
Hideg E, Juhasz M, Bornman J, Asada K (2002) The distribution and possible origin
of blue–green fluorescence in control and stressed barley leaves. Photoch
Photobio Sci 1:934 - 941
Hilbert M, Wehling A, Schlodder E, Walla PJ (2004) Two-photon-sensitized
fluorescence and excitation spectra of photosystem I of Thermosynechococcus
elongatus. Journal of Physical Chemistry B 108:13022-13030
Hutzler P, Fischbach R, Heller W, Jungblut TP, Reuber S, Schmitz R, Veit M,
Weissenbock G, Schnitzler JP (1998) Tissue localization of phenolic
compounds in plants by confocal laser scanning microscopy. J Exp Bot
49:953-965
Chaerle L, Hagenbeek D, De Bruyne E, Van Der Straeten D (2007) Chlorophyll
fluorescence imaging for disease-resistance screening of sugar beet. PLANT

118
CELL TISSUE AND ORGAN CULTURE 91:97-106
Chaerle L, Van der Straeten D (2001) Seeing is believing: imaging techniques to
monitor plant health. Biochimica Et Biophysica Acta-Gene Structure and
Expression 1519:153-166
Chalfie M, Tu Y, Euskirchen G, Ward WW, Prasher DC (1994) Green fluorescent
protein as a marker for gene-expression. Science 263:802-805
Christie JM (2007) Phototropin blue-light receptors. Annu Rev Plant Biol 58:21-45
Jain V, Nainawatee HS (2002) Plant flavonoids: Signals to legume nodulation and
soil microorganisms. Journal of Plant Biochemistry and Biotechnology 11:1-
10
Jennings RC, Bassi R, Zucchelli G (1996) Antenna structure and energy transfer in
higher plant photosystems. In: (ed) Electron Transfer Ii,
Jensen E, Bassi R, Boekema E, Dekker J, Jansson S, Leister D, Robinson C, Scheller
H (2007) Structure, function and regulation of plant photosystem I. BBA
1767:335-352
Johnson G, Mantha S, Day T (2000) A spectrofluorometric survey of UV-induced
blue-green fluorescence in foliage of 35 species. JOURNAL OF PLANT
PHYSIOLOGY 156:242-252
Kagawa T (2007) Dynamics of chloroplast movement. Plant and Cell Physiology
48:S6-S6
Kiang NY, Siefert J, Govindjee, Blankenship RE (2007) Spectral signatures of
photosynthesis. I. Review of Earth organisms. Astrobiology 7:222-251
Kolter R, Siegele D, Tormo A (1993) The stationary phase of the bacterial life cycle.
Annual Review of Microbiology 47:855.874
Kutsky H, Appel W, Amann H (1960) Chlorophyllfluorescenz und
kohlensaureassimilation. Biochemische Zeitschrift 322:277 -292
Lakowicz JR (1999) Principles of fluorescence spectroscopy. Kluwer Academic,
Plenum Publisher, New York
Landry LG, Chapple CCS, Last RL (1995) Arabidopsis mutants lacking phenolic
sunscreens exhibit enhanced ultraviolet-B injury and oxidative damage. Plant
Physiology 109:1159-1166
Latouche G, Cerovic ZG, Montagnini F, Moya I (2000) Light-induced changes of
NADPH fluorescence in isolated chloroplasts: a spectral and fluorescence
lifetime study. BBA-Bioenergetics 1460:311-329

119
Lenk S, Chaerle L, Pfundel EE, Langsdorf G, Hagenbeek D, Lichtenthaler HK, Van
der Straeten D, Buschmann C (2007) Multispectral fluorescence and
reflectance imaging at the leaf level and its possible applications. J Exp Bot
58:807-814
Lichtenthaler H, Buschmann C (2001) Current protocols in food analytical chemistry.
John Wiley and Sons, Inc.,
Lichtenthaler H, Schweiger J (1998) Cell wall bound ferulic acid, the major substance
of the blue-green fluorescence emission of plants. JOURNAL OF PLANT
PHYSIOLOGY 152:272-282
Lichtenthaler HK (1987) Chlorophylls and carotenoids - pigments of photosynthetic
biomembranes. Method Enzymol 148:350-382
Lichtenthaler HK, Miehe JA (1997) Fluorescence imaging as a diagnostic tool for
plant stress. TRENDS in Plant Science 2:316-320
Lippincott-Schwartz J, Patterson GH (2003) Development and use of fluorescent
protein markers in living cells. Science 300:87-91
Loll B, Kern J, Saenger W, Zouni A, Biesiadka J (2005) Towards complete cofactor
arrangement in the 3.0 angstrom structure of photosystem II. Nture 438:1040 -
1044
Maxwell K, Johnson GN (2000) Chlorophyll fluorescence - a practical guide. J Exp
Bot 51:659-668
Melis A (1991) Dynamics of photosynthetic membrane composition and function.
BBA 1058:87-106
Meyer, S, Cartelat A, Moya I, Cerovic Z (2003) UV-induced blue-green and far-red
fluorescence along wheat leaves: a potential signature of leaf ageing. J Exp
Bot 54:757-69
Miller WG, Leveau JHJ, Lindow SE (2000) Improved gfp and inaZ broad-host-range
promoter-probe vectors. Molecular Plant-Microbe Interactions 13:1243-1250
Monier JM, Lindow SE (2003a) Differential survival of solitary and aggregated
bacterial cells promotes aggregate formation on leaf surfaces. P Natl Acad Sci
USA 100:15977-15982
Monier JM, Lindow SE (2003b) Pseudomonas syringae responds to the environment
on leaves by cell size reduction. Bacteriology 93:1209-1216
Mullet JE, Burke JJ, Arntzen CJ (1980) Chlorophyll proteins of photosystem I. Plant
Physiology 65:814-822
120
Nakatani HS, Ke B, Dolan E, Arntzen CJ (1984) Identity of the Photosystem II
reaction center polypeptide. BBA 765:347 - 352
Nedbal L, Koblizek M (2006) Chlorophyll fluorescence as a reporter on in vivo
electron transport and regulation in plants. In: Grimm B, Porra R,Scheer H
(ed) Chlorophylls and Bacteriochlorophylls: Biochemistry, Biophysics,
Functions and Applications, Springer, The Netherlands
Onaka K, Fujii R, Nagae H, Kuki M, Koyama Y, Watanabe Y (1999) The state
energy and the displacements of the potential minima of the 2A(g)(-) state in
all-trans-beta-carotene as determined by fluorescence spectroscopy. Chemical
Physics Letters 315:75-81
Onyilagha JC, Lazorko J, Gruber MY, Soroka JJ, Erlandson MA (2004) Effect of
flavonoids on feeding preference and development of the crucifer pest
Mamestra configurata Walker. Journal of Chemical Ecology 30:109-124
Ormo M, Cubitt AB, Kallio K, Gross LA, Tsien RY, Remington SJ (1996) Crystal
structure of the Aequorea victoria green fluorescent protein. Science
273:1392-1395
Padmavati M, Reddy AR (1999) Flavonoid biosynthetic pathway and cereal defence
response: An emerging trend in crop biotechnology. Journal of Plant
Biochemistry and Biotechnology 8:15-20
Park JH, Gatewood BM, Ramaswamy GN (2005) Naturally occurring quinones and
flavonoid dyes for wool: Insect feeding deterrents. Journal of Applied Polymer
Science 98:322-328
Paynter C, Salisbury V, Arnold D, Jackson R (2006) The use of bioluminescence for
monitoring in planta growth dynamics of a Pseudomonas syringae plant
pathogen. European Journal of Plant Pathology 115:363–366
Pfundel EE (1998) Estimating the contribution of Photosystem I to total leaf
chlorophyll fluorescence. Photosynth Res 56:185 - 195
Pietta PG (2000) Flavonoids as antioxidants. Journal of Natural Products 63:1035-
1042
Polivka T, Sundstrom V (2004) Ultrafast dynamics of carotenoid excited states -
From solution to natural and artificial systems. Chemical Reviews 104:2021-
2071
Renwick JAA, Zhang WQ, Haribal M, Attygalle AB, Lopez KD (2001) Dual
chemical barriers protect a plant against different larval stages of an insect.
121
Journal of Chemical Ecology 27:1575-1583
Rizzo MA, Piston DW (2004) Fluorescent protein tracking and detection. In:
Goldman RD,Spector DL (ed) Live Cell imaging: A laboratory manual, Cold
Spring Harbor Laboratory Press, New York
Rost F (1995) Autofluorescence in plants, fungi and bacteria. In: (ed) Fluorescence
microscopy, Cambridge University Press, Cambridge
Sabaratnam S, Beattie GA (2003) Differences between Pseudomonas syringae pv.
syringae B728a and Pantoea agglomerans BRT98 in epiphytic and endophytic
colonization of leaves. Appl Environ Microb 69:1220-1228
Sawano A, Miyawaki A (2000) Direct evolution of green fluorescent protein by
versatile PCR strategy for side-directed and semi-random mutagenesis.
Nucleic Acid Research 28:E78
Shaner NC, Steinbach PA, Tsien RY (2005) A guide to choosing fluorescent proteins.
Nat Methods 2:905-909
Shaw J, Dane F, Geiger D, Kloepper J (1992) Use of Bioluminescence for Detection
of Genetically Engineered Microorganisms Released into the Environment.
Appl Environ Microb 58:267-273
Shaw S (2006) Imaging the live plant cell. Plant Journal 45:573-598
Shimomura O, Johnson FH, Saiga Y (1962) Extraction, purification and properties of
aequorin, a bioluminescent protein from luminous hydromedusan, Aequorea.
Journal of Cellular and Comparative Physiology 59:223-&
Schreiber U (2004) Pulse-Amplitude-Modulation (PAM) Fluorometry and Saturation
Pulse Method: An Overview. In: Papageorgiou G,Govindjee (ed) Chlorophyll
a Fluorescence: A Signature of Photosynthesis, Springer, Netherlands
Smith M, Bidochka M (1998) Bacterial fitness and plasmid loss: the importance of
culture conditions and plasmid size. Canadian Journal of Microbiology
44:351.355
Soylu S (2006) Accumulation of cell-wall bound phenolic compounds and
phytoalexin in Arabidopsis thaliana leaves following inoculation with
pathovars of Pseudomonas syringae. Plant Science 170:942-952
Soylu S, Brown I, Mansfield J (2005) Cellular reactions in Arabidopsis following
challenge by strains of Pseudomonas syringae: From basal resistance to
compatibility. Physiological and Molecular Plant Pathology 66:232–243
Speiers A, Haworth R (1989) An ultrastructural study of Pseudomonas syringae pv.

122
syringae infection of poplar and tabacoo foliage. New Zealand Journal of
Botany 27:337-345
Standfuss R, van Scheltinga ACT, Lamborghini M, Kuhlbrandt W (2005)
Mechanisms of photoprotection and nonphotochemical quenching in pea light-
harvesting complex at 2.5A resolution. Embo Journal 24:919-928
Stobiecki M, Skirycz A, Kerhoas L, Kachlicki P, Muth D, Einhorn J, Mueller-Roeber
B (2006) Profiling of phenolic glycosidic conjugates in leaves of Arabidopsis
thaliana using LC/MS. Metabolomics 2:197-219
Taiz L, Zeiger E (1998) Plant physiology. Sinauer Associates, Inc., Publishers,
Sunderland, Massachusetts
Thomma B, Eggermont K, Penninckx I, Mauch-Mani B, Vogelsang R, Cammue B,
Broekaert W (1998) Separate jasmonate-dependent and salicylate-dependent
defense-response pathways in Arabidopsis are essential for resistance to
distinct microbial pathogens. P Natl Acad Sci USA 95:15107–15111
Treutter D (2005) Significance of flavonoids in plant resistance and enhancement of
their biosynthesis. Plant Biology 7:581-591
von Bodman SB, Bauer DW, Coplin DL (2003) Quorum sensing in plant-pathogenic
bacteria. Annual Review Phytopathology 41:
Walla PJ, Linden PA, Ohta K, Fleming GR (2002) Excited-state kinetics of the
carotenoid S-1 state in LHC II and two-photon excitation spectra of lutein and
beta-carotene in solution: Efficient car S-1 -> Chl electronic energy transfer
via hot S-1 states? Journal of Physical Chemistry A 106:1909-1916
Walla PJ, Yom J, Krueger BP, Fleming GR (2000) Two-photon excitation spectrum
of light-harvesting complex II and fluorescence upconversion after one- and
two-photon excitation of the carotenoids. Journal of Physical Chemistry B
104:4799-4806
Wilson M, Lindow SE (1994) Inoculum density dependent mortality and colonization
of the phylosphere by Pseudomonas syringae. Appl Environ Microb 60:2232 -
2237
Wolfbeis OS (1985) Fluorescence of organic natural products. In: Schiulman SG (ed)
Molecular luminescence spectroscopy: Methods and application. Part I, John
Wiley & Sons, New York
Yao Q, Zhu HH, Zeng RS (2007) Role of phenolic compounds in plant defence:
Induced by arbuscular mycorrhizal fungi. Allelopathy J 20:1-13

123
Zhou X, Carranco R, Vitha S, Hall T (2005) The dark side of green fluorescent
protein. New Phytologist 168:
Zipfel WR, Williams RM, Christie R, Nikitin AY, Hyman BT, Webb WW (2003)
Live tissue intrinsic emission microscopy using multiphoton-excited native
fluorescence and second harmonic generation. P Natl Acad Sci USA
100:7075-7080