logi - journals.vstecb.czjournals.vstecb.cz/wp-content/uploads/fullissue/43.pdf · logi scientific...
TRANSCRIPT

LOGI SCIENTIFIC JOURNAL ON TRANSPORT AND LOGISTICS
II/2014
České Budějovice 2014


-3- II/2014
Content
QUALITY STANDARDIZATION OF TRANSPORT SERVICES IN PUBLIC PASSENGER TRANSPORT
Mária KOSTOLNÁ, Vladimír KONEČNÝ ...................................................................... 6
MATERIAL SUPPLIES IN AN ENTERPRISE AND TRANSPORT
Daniel KUČERKA, Milan TIMKO, Iveta KMECOVÁ, Monika KUČERKOVÁ ........ 20
INNOVATIVE SOLUTIONS IN SELECTED LOGISTICS COMPANIES IN SLOVAKIA
Silvia LORINCOVÁ, Žaneta BALÁŽOVÁ ................................................................... 28
CUSTOMER SERVICE - A FINE LINE BETWEEN LOGISTICS AND MARKETING
Peter MAJERČÁK, Ivana WEISSOVÁ, Katarína MORAVČÍKOVÁ .......................... 42
TRENDS AND DEVELOPMENT IN LOGISTICS
Martin PODAŘIL, Soňa RUSNÁKOVÁ ....................................................................... 50
TRANSPORT PROBLEM OF FRESH FRUIT AND VEGETABLES
Ľubor ROVŇANÍK ......................................................................................................... 56
PROCEDURE FOR PROCUREMENT OF PUBLIC PASSENGER TRANSPORT
Štefánia SEMANOVÁ, Lenka KOMAČKOVÁ............................................................. 68
EVALUATION OF A TRANSPORT COMPANY
Anna SIEKELOVÁ, Viera BERZÁKOVÁ .................................................................... 81
KEY PERFORMANCE INDICATORS IN LOGISTICS AND ROAD TRANSPORT
Ivana ŠIMKOVÁ, Vladimír KONEČNÝ ....................................................................... 87
THIRD-PARTY LOGISTICS AS A SOURCE OF COMPETITIVE ADVANTAGE
Ľubica ŠTEFÁNIKOVÁ, Gabriela MASÁROVÁ, Peter MAJERČÁK ........................ 97
COMPARISON OF REVENUE AND EXPENDITURES OF ROAD AND RAILWAY TRANSPORT IN THE SLOVAKIA
Peter VARJAN .............................................................................................................. 108
PREDICTING STOCK PRICES IN BANK VIG
Robert ZEMAN, Jaroslav STUCHLÝ .......................................................................... 116

-4- II/2014
THE IDENTIFICATION OF ERRORS IN THE PROCESSES OF SCANNING OF DYNAMICALLY MOVING LOGISTIC UNITS
Daniel ZEMAN, Jiří TENGLER, Libor ŠVADLENKA .............................................. 130

-5- II/2014
List of reviewers:
prof. Ing. Václav Cempírek, Ph.D. – Jan Perner Transport Faculty, University of Pardubice, Czech Republic
doc. Ing. Jozef Strišš, CSc. – European Polytechnic Institute, Ltd., Kunovice, Czech Republic
prof. Ing. Jozef Majerčák, PhD. - Faculty of Operation and Economics of Transport and Communications, University of Žilina, Slovakia
doc. Ing. Bibiána Buková, PhD. - Faculty of Operation and Economics of Transport and Communications, University of Žilina, Slovakia
doc. Ing. Ivo Drahotský, Ph.D. – Jan Perner Transport Faculty, University of Pardubice, Czech Republic
doc. Ing. Rudolf Kampf, Ph.D. – The Institute of Technology and Businesses in České Budějovice, Czech Republic
doc. Ing. Jozef Gašparík, PhD. - Faculty of Operation and Economics of Transport and Communications, University of Žilina, Slovakia
doc. Ing. Petr Průša, Ph.D. – Jan Perner Transport Faculty, University of Pardubice, Czech Republic
doc. Ing. Libor Švadlenka, Ph.D. – Jan Perner Transport Faculty, University of Pardubice, Czech Republic
doc. Ing. Anna Kejíková, CSc. - Faculty of Operation and Economics of Transport and Communications, University of Žilina, Slovakia
Mgr. Jakub Soviar, PhD. - Faculty Management Science & Informatics, University of Žilina, Slovakia

-6- II/2014
QUALITY STANDARDIZATION OF TRANSPORT SERVICES IN PUBLIC PASSENGER TRANSPORT
Mária KOSTOLNÁ, Vladimír KONEČNÝ
1 Introduction
The quality of services is one of the tools how to influence the passenger demand in public passenger transport. The quality of public passenger transport is characterized by a set of quality criteria. The main objective is the need to standardize the quality level of services like a basic requirement in procurement of transport services. Another important objective is to ensure a level of contractually specified quality requirements between the public authority and operator during the contract. The operator, and public authority too, should on the one hand to identify the requirements of passengers and on the other hand, with regard to the sustainability of passenger demand for public transport services, should meet these requirements the best he knows.
The quality requirements are constantly changing. Therefore we have to constantly review them. It means to identify and then to implement these changes in standard of quality the transport services.
1.1 Structure of passengers over the time Structure of passengers is changing over the years. It is the assumption that
different groups of passenger have different quality requirements. The passenger demand increases or decreases depending on the fulfillment of these requirements. The following figure shows the structure of passengers in Slovak Republic over the years.
Fig. 1 Regular transport of passenger by type of fare
Source: [elaborated by authors on the basis of 12]

-7- II/2014
The picture shows that the number of transported passengers by type of fare "common tickets" in Slovak republic significantly decreased during the period. The number of students remained more or less constant. These facts are important to the economy assurance of transport services for individual operators as well as self-governing regions. Therefore here is performed an analysis of passenger quality requirements based on their age.
2 Legislative requirements in area of quality in public passenger transport in Slovakia
Quality in public passenger transport solves Act No 56/2012 Coll. on Road Transport, Regulation (EC) No 1370/2007 on public passenger transport services by rail and by road (taken from European law) and two European standards apply in the all EU: STN EN 13816 - Transportation. Logistics and services. Public passenger transport. Service quality definition, targeting and measurement and STN EN 15140 - Public passenger transport – basic requirements and recommendations for systems that measure delivered service quality.
2.1 Quality requirements in Act No 56/2012 Coll. on Road Transport In §21 (Service contract) in article 1 states that the purpose of a service contract
is to ensure to public safe, effective and quality services for determined basic tariff and in adequate performance based on needs the transport serviceability of region. It is also necessary to consider the social and environmental factors and the objectives of regional development. These transport services are provided if they are not provided on operators of regular services on a commercial basis. The service contract is concluded between the public authority and the operator of transport services in regular transport for transport services which the operator would not provide at all for their economic disadvantages or which he would not provide in determined range or in quality or for determined basic tariff. This service contract is important because these transport services are necessary for transport serviceability of region.
Article 9 of this Act adds that part of this contract are the requirements for quality (i.e. STN EN 13816 and STN EN 15140) and security standards of regular transport in public interest then technical standards relating to transport of passengers with disabilities and reduced mobility, and requirements for age, equipment and technical level of buses.

-8- II/2014
2.2 Quality requirements in Regulation (EC) No 1370/2007 on public passenger transport services by rail and by road The purpose of this Regulation is to define how, in accordance with the rules of
Community law, competent authorities may act in the field of public passenger transport to guarantee the provision of services of general interest which are among other things more numerous, safer, of a higher quality or provided at lower cost than those that market forces alone would have allowed.
To this end, this Regulation lays down the conditions under which competent authorities, when imposing or contracting for public service obligations, compensate public service operators for costs incurred and/or grant exclusive rights in return for the discharge of public service obligations.
2.3 STN EN 13816 - Transportation. Logistics and services. Public passenger transport. Service quality definition, targeting and measurement Quality of service can be described with criteria which are achieving the certain
level i.e. to determine the qualitative limits in which public service is providing. The overall quality of public passenger transport contains a large number of criteria. The criteria represent the customer view of the service provided, and in this standard they have been divided into 8 categories:
• availability: extend of the service offered in terms of geography, time, frequency and transport mode;
• accessibility: access to the PPT system including interface with other transport modes;
• information: systematic provision of knowledge about a PPT system to assist the planning and execution of journeys;
• time: aspects of time relevant to the planning and execution of journeys;
• customer care: service elements introduced to effect the closest practicable match between the standard service and the requirements of any individual customer;
• comfort: service elements introduced for the purpose of making PPT journeys relaxing and leasurable;
• security: sense of personal protection experienced by customers, derived from the actual measures implemented and from activity designed to ensure that customers are aware of those measures;
• environmental impact: effect on the environment resulting from the provision of a PPT service.

-9- II/2014
Service quality loop
Quality system can be described with service quality loop which evaluates the delivered service from the customer view as well as from service operator view. Individual aspects of quality are closely related. The objective is to minimize differences between expected and provided quality.
Fig. 2 Service quality loop
Source: [8]
2.4 Strategy of development of public passenger transport and non-motorized transport of Slovakia 2020 Strategic document which deals with quality of PPT in the Slovak Republic is
Strategy of development of public passenger transport and non-motorized transport of Slovakia 2020. This document has been published by the Ministry of Transport, Construction and Regional Development (MTCRD SR) in June 2014. It includes Annex A "Strategy of development of public passenger transport in SR 2020", which deals with the quality and quality standardization of public transport services in the Slovak Republic. The objective of this Strategy is to achieve a higher ratio in the modal split in public passenger transport and in non-motorized transport. To achieve the main goal, it is necessary to ensure the following sub-objectives:
• SD1: to ensure a quality legislation, technical standards and strategic documents in support of public passenger transport and non-motorized transport;
• SD2: to ensure an attractive supply of public transport including the high-quality and the available transport information;

-10- II/2014
• SD3: to increase the quality vehicle fleet of public transport and the infrastructure of public and non-motorized transport.
These sub-objectives are specified in the document through the priorities and actions that should help to achieve the main goal of company. However in this strategy is not determined which standard of these conditions will required and how these conditions to measure and evaluate.
3 The analysis of quality requirements in public service contracts
For the standardization and evaluation of quality requirements is important to specify these requirements in the contracts. The quality requirements are defined in the part “Rights and obligations of operator”. Sanctions of these requirements are specified in the part “Tariff for contractual penalties”.
Public service contracts were analysed in May 2014. In public service contracts were most mentioned these criteria: security, comfort for passengers during the transport, information for passengers, identification of bus and of bus line, transport of handicapped and visually impaired people, fluency and regularity of bus, clean facilities for customers, information about change of bus line, electronic check- in system of passengers and omitting of bus links. The most of criteria are set in Žilina self-governing region (24 criteria), then in Banská Bystrica self-governing region (14 criteria), in Košice self-governing region (13 criteria), in Prešov self-governing region (11 criteria), in Trnava self-governing region (10 criteria), in Nitra self-governing region (10 criteria) and at least of criteria is specified in Bratislava self-governing region (10 criteria). In Trenčín self-governing region were not analysed the quality criteria because this self-governing region not provided its contract. The detailed analysis of these contracts is shown below.
Tab. 1 Quality criteria in public service contracts and sanctions for their nonfulfillment
self-governing region quality criterion sanction
ZA, TT, PO, KE, BB, BA safety, comfort, peaceful transportation (active safeguarding by staff in an accident)
to 300 € (ZA), to 6,638 € (PO,KE)
ZA, TT, PO, KE, BB, BA identification of bus, information about a bus in the bus stops
to 300 € (ZA), to 6,638 € (PO,KE)
ZA, TT, PO, KE, BB clean and operational facilities for customers to 300 € (ZA), to 6,638 € (PO,KE)
ZA, TT, PO, KE, BB, BA provision and disclosure of information to 300 € (ZA), to 6,638 € (PO,KE)
ZA, TT, PO, KE, BB, BA skills of staff to 300 € (ZA), to 6,638 € (PO,KE)

-11- II/2014
ZA, TT, PO, KE, BA transport of handicapped and visually impaired people to 300 € (ZA), to 6,638 € (PO,KE)
ZA, TT, PO, KE, BA bigger comfort for mother with children, old people and pregnant women
to 300 € (ZA), to 6,638 € (PO,KE)
ZA, TT, NR, KE, BB, BA fluency, regularity, quality and safety of services, vehicle load factor
to 300 € (ZA)
ZA, TT, PO, KE, BB, BA information about modification of timetable, street direction, change and removing of bus lines
to 300 € (ZA), to 6,638 € (PO,KE)
ZA, NR, KE, BB electronic check-in system of passengers to 300 € (ZA) ZA omitting over 6% bus lines from overall number of bus lines the end of contract (ZA)
ZA, PO, NR, KE, BB the end of public interest for services the end of contract (ZA,PO,KE)
ZA, BB use of other buses than of contracted buses ZA, BB, BA improve the security and culture of traveling
ZA, NR buses maximum 16 years old ZA, NR early bus departure from bus stops to 500 € (ZA,NR)
ZA delay of bus over 15% from overall travelling time from not objective causes
to 500 € (ZA)
ZA repeated and substantial complaints of passengers (mainly no heating in the winter, dirt, etc.)
to 500 € (ZA)
ZA, PO, NR, KE omitting of bus lines (without reason) to 1,000 € (ZA),to 6,638 € (PO,KE), to 700 € (NR)
ZA repeated and essential violation of contractual commitments, mainly omitting of bus lines (more than 3% from overall number)
to 30,000 € (ZA)
ZA operator does not meet of travel performance (buses do not drive) for 5 consecutive days (failure to ensure 80% bus lines)
to 300,000 € (ZA)
ZA, PO, KE repeated violation of contractual commitments the end of contract (ZA), 6,638 € - 16,596 € (PO, KE)
PO other violations to 165 € (PO, KE)
NR, BB heating
1,000 € (do not meet minimum 90% from overall half year travel performance)- NR
NR, KE, BB meeting of standards EN 13 816 and EN 15 140
ZA, TT, PO, NR, KE, BB, BA
coverage area
Source: [elaborated by authors on the basis of valid contracts]
The current public service contracts were signed before 3th of December 2009 i.e. before enter into force the Regulation (EC) No 1370/2007 on public passenger transport services by rail and by road for Slovak Republic. After the expiry of these, contracts will implemented transport serviceability in the Slovak Republic under this Regulation.

-12- II/2014
Tab. 2 Validity of public service contracts
validity of contracts self-governing region 01.12.2009 - 29.11.2019 Žilina (ZA) 01.04.2009 - 31.12.2018 Prešov (PO)
not identified Trnava (TT) 01.01.2010 - 31.12.2013 Nitra (NR) 01.01.2009 - 08.12.2017 Košice (KE) 01.01.2009 - 31.12.2018 Banská Bystrica (BB) 01.01.2009 - 31.07.2017 Bratislava (BA)
not identified Trenčín (TN) Source: [elaborated by authors on the basis of valid contracts]
As we can see the date when the requirements of Regulation 1370/2007 will be valid for individual public service contracts (if do not the termination of contract) is the year 2017. It is necessary to deal with the public procurement before the year 2017. In Regulation (EC) No 1370/2007 in article 7 is written that “Each competent authority shall take the necessary measures to ensure that, at least one year before the launch of the invitation to tender procedure or one year before the direct award, the following information at least is published in the Official Journal of the European Union: a) the name and address of the competent authority; b) the type of award envisaged; c) the services and areas potentially covered by the award.” [6]
4 Identification of passenger requirements and their satisfaction in suburban bus transport in Slovakia
This part of article is dealing with quality criteria in suburban bus transport in Slovak Republic. The criteria which are important for passengers are shown in the table below. These criteria represent the requirements of all passengers regardless of their age.
Because the strategic document about development of public passenger transport for Slovak Republic [11] is very general and it does not offer instructions how to apply the quality criteria, it is necessary to propose the uniform methodology. It is needful to determine the applied quality criteria. The questionnaire was created for verification of ability or suitability the research. This questionnaire was used for the sample of 2 742 people.

-13- II/2014
Tab. 3 Selected quality criteria in suburban bus transport that are important for passengers
criterion arithmetic mean median range
cleanliness 3,69 3,77 1,79 0,621 punctuality 3,61 3,96 1,46 0,619 information 3,45 3,68 1,83 0,578 frequency 3,28 3,32 0,81 0,332
behaviour the staff 3,28 3,34 1,65 0,538 security 3,27 3,27 1,33 0,665
speed transport 2,81 2,88 1,13 0,464 number of people: 2 742
Source: [elaborated by authors]
In the table are 7 quality criteria that are most important for passengers and these criteria are composed by passenger importance of each criterion. Three most mentioned criteria are cleanliness, punctuality and information. Passengers put in the last place the criterion speed transport. It follows that punctuality and comfort during transport in the bus are more important for passengers like speed transport of bus.
Different group of passengers have different quality requirements. It is necessary to take into account this fact in the proposal of quality standard. Therefore was performed the research of passengers requirements in the selected self-governing region on the basis the age of these passengers. This picture shows passengers importance for individual quality criteria based on the structure of passengers.

-14- II/2014
Fig. 3 Passenger requirements in suburban bus transport based on the structure of passengers
Source: [elaborated by authors]
On the picture we can see requirements of passengers who are divided on four groups. These groups are determined on the basis of price quotations which is specified in the public service contract. The people older than 65 years give the most importance individual criteria almost in the all criteria. The group of people in the age 16-25 years gives the least importance to almost all quality criteria. In the detail view we can see that the most differences in the importance of individual quality criteria are in these criteria: look of driver, cleanliness of external area the bus, internal light and to use the mobile phone. The least differences in the important of quality criteria were in criteria comfort and driving technique of driver.
If we want to determine the change in quality requirements, it is necessary to research the service quality. On the one hand, it is necessary to identify the requirements of passengers and on the other hand to identify the satisfaction with the fulfillment of these requirements. The satisfaction with these mentioned quality criteria is shown in the table below.

-15- II/2014
Tab. 4 Perception of fulfillment the selected quality criteria in suburban bus transport
criterion suburban bus transport
arithmetic mean behaviour the staff 3,34 0,561
cleanliness 3,00 0,747 security 3,17 0,230
information 2,80 0,642 punctuality 3,20 0,645
services in the bus 3,27 - Source: [elaborated by authors]
Correlation between the perception of passengers and the expectation of passengers can be expressed using the Customer Satisfaction Index:
(1)
where ........ is the average value of quality perception by passengers
......... is the average value of expected quality by passengers.
If a value is more than 1 the level of quality perception by passenger is higher than his expectations. If a value is less than 1, there are not met the customer expectations by operator.
Based on the research of passengers expectations and their perceptions of the quality level has been performed the relational analysis of the results by the higher mentioned equation. The calculated values of customer satisfaction index are shown in the table 5.
Tab. 5 CSI for selected quality criteria in suburban bus transport
criterion suburban bus transport punctuality 0,89
security 0,97 cleanliness 0,81
behaviour the staff 1,02 information 0,81
Source: [elaborated by authors]
Note: The red fields represent the values where passengers have higher expectations than their actual performance by operators. Green fields represent the opposite when the fulfillment of quality criteria from operators is higher than the passenger requirement.
-16- II/2014
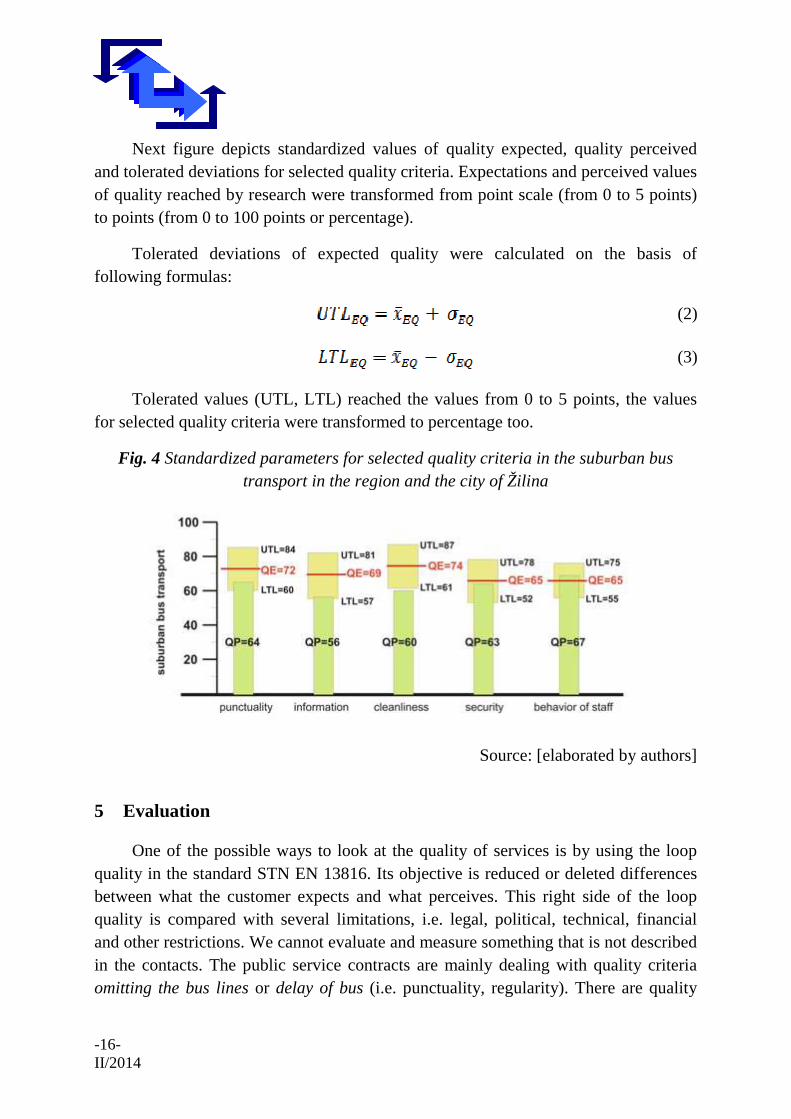
Next figure depicts standardized values of quality expected, quality perceived and tolerated deviations for selected quality criteria. Expectations and perceived values of quality reached by research were transformed from point scale (from 0 to 5 points) to points (from 0 to 100 points or percentage).
Tolerated deviations of expected quality were calculated on the basis of following formulas:
(2)
(3)
Tolerated values (UTL, LTL) reached the values from 0 to 5 points, the values for selected quality criteria were transformed to percentage too.
Fig. 4 Standardized parameters for selected quality criteria in the suburban bus transport in the region and the city of Žilina
Source: [elaborated by authors]
5 Evaluation
One of the possible ways to look at the quality of services is by using the loop quality in the standard STN EN 13816. Its objective is reduced or deleted differences between what the customer expects and what perceives. This right side of the loop quality is compared with several limitations, i.e. legal, political, technical, financial and other restrictions. We cannot evaluate and measure something that is not described in the contacts. The public service contracts are mainly dealing with quality criteria omitting the bus lines or delay of bus (i.e. punctuality, regularity). There are quality

-17- II/2014
criteria security, information, cleanliness and accessibility too. The contracts more or less correspond with requirements of passengers [13-15].
6 Conclusion
Service quality is most often associated with requirements and expectation of customers. But it is important to remember that the customer requirements are not the only factor witch determine the quality standard. It is important to take account legal, political, technical, financial and other restrictions. And of course, do not forget to constantly review the changes of passengers´ requirements with regard to the changes in the demographic structure of the population and the changes in habits and behavior of the population.
This paper has been developed under support of project: MŠVVŠ SR - VEGA č. 1/0320/14 POLIAK, M.: Road Safety Improvement through Promoting Public
Passenger Transport
References
[1] EBOLI, L., MAZZULLA, G.: A Stated Preference Experiment for Measuring Service Quality in Public Transport. In.: Transportation Planning and Technology, Rotledge publisher, member of the Taylor and Francis Group, Vol. 31, No. 5, 2008, ISSN 0308-1060, pp.509-523
[2] FRIMAN, M., FELLESSON, M.: Service Supply and Customer Satisfaction in Public Transportation: The Quality Paradox, In.: Journal of Public Transportation, Vol. 12, No. 4, University of South Florida, 2009, ISSN 1077-291X, pp.57-69
[3] GNAP, J., KONEČNÝ, V.: Meranie kvality prímestskej autobusovej dopravy = Quality measurement of suburb bus transport. In: Kvalita 2009.18. ročník konference s mezinárodní účastí. Ostrava: sborník přednášek. Ostrava: DTO CZ, 2009. - ISBN 978-80-02-02153-7.
[4] KONEČNÝ, V.: Meranie a hodnotenie kvality v hromadnej osobnej doprave. In: Aktuálne problémy v podnikaní v cestnej doprave. CEDOP: 12. odborný seminár, Žilina: Žilinská univerzita, 2011. ISBN 978-80-554-0361-8.
[5] KONEČNÝ, V.: Nástroje a metódy manažérstva kvality. Návody na cvičenia z predmetu manažment kvality. 1. vyd., Žilina: Žilinská univerzita, 2012. ISBN 978-80-554-0601-5
[6] KONEČNÝ, V. – KOSTOLNÁ, M.: The possibilities of standardizing the quality level in public passenger transport from customer point of view. In: Perner´s Contacts. Roč. 9, č. 2 (2014), ISSN 1801-674X
-18- II/2014
[7] Regulation (EC) No 1370/2007 on public passenger transport services by rail and by road
[8] STN EN 13816 - Transportation. Logistics and services. Public passenger transport. Service quality definition, targeting and measurement. Slovak office of technical standards, Bratislava 2003.
[9] STN EN 15140 - Public passenger transport – basic requirements and recommendations for systems that measure delivered service quality. Slovak office of technical standards, Bratislava 2003.
[10] Act No 56/2012 Coll. on Road Transport
[11] Strategy of development of public passenger transport and non-motorized transport of Slovakia 2020. Available on the internet:
http://www.telecom.gov.sk/index/index.php?ids=75682. [12] Statistics of transported passengers by public passenger transport by type of fare.
Available on the internet: http://www.telecom.gov.sk/files/statistika_vud/preprava_osob.htm.
[13] EU energy, transport and GHG emissions trends to 2050. Available on the internet: http://ec.europa.eu/energy/observatory/trends_2030/index_en.htm.
[14] Novotný, J. Investování do reálných a finančních investic. Hradecké ekonomické dny, 2014. Mezinárodní vědecká konference, 2014, s. 340 – 346. ISBN 978-80-7435-367-3.
[15] Novotný, J. Trendy investování podniků do komodit v současném podnikatelském prostředí na základě psychologické analýzy. Mezinárodní vědecká konference – Aktualne problémy podnikovej sféry 2014. Ekonomická Univerzita v Bratislavě, 2014. s. 356 -361. ISBN 978-80-225-3867-1
Resume
Supporting quality of services is a tool of sustainability passenger demand for public passenger transport. The need to standardize the quality level of services is important both for the procurement of transport services and contracting of services, as well as in measuring quality from the public authority. The paper deals with the possibilities of standardizing the quality level of public passenger transport. It includes the possible approaches and methods for determining the standard level of quality services in the bus transport supported by the results of actual measurements in Slovakia. The procedures respect the legislative requirements which are valid in the Slovak Republic. The issue of paper is also related to the priorities and measures of the current document issued by the Ministry of Transport, Construction and Regional Development „Strategy of development of public passenger transport and non-motorized transport of Slovakia 2020“.

-19- II/2014
Key words
Standard, norm, quality, public transport, passenger
Ing. Mária Kostolná
Univerzity of Žilina
Faculty of Operation and Economics of Transport and Communications
Department of Road and Urban Transport
e-mail: [email protected]
doc. Ing. Vladimír Konečný, PhD.
Univerzity of Žilina
Faculty of Operation and Economics of Transport and Communications
Department of Road and Urban Transport e-mail: [email protected]
-20- II/2014
MATERIAL SUPPLIES IN AN ENTERPRISE AND TRANSPORT
Daniel KUČERKA, Milan TIMKO, Iveta KMECOVÁ, Monika KUČERKOVÁ
1 Introduction
Logistics is a very wide scientific discipline. In a lot of areas it influences the level of society. Logistic services in modern society facilitate the human life. We speak about the logistics also regarding the process of storage and transport of material. The logistics also deals with the questions of purchase, storage, picking and distribution of goods. Its aim is to satisfy the customer.
The customers´ demands on the reduction of time intervals of material delivery and on the lowest transportation and overhead costs increase nowadays. Transportation is the result of transport as the implementation of transport requirements. Transport requirements of customers are carried out directly from the manufacturing plant or from the stock. Material storage can be the effective or ineffective process.
2 Storage
Storage of the material is one the logistic tasks. It is considered as the negative element in the material flow. This process causes the disruption of material flow in the logistics chain.
Storage performs the following functions:
1. Levelling function, this is a bridge of problems which arise from problems in the own manufacturing process as a result of raw material or by sales problems (the need of certain products in a certain time – season).
2. Security function – caused by the uncertainty of gaining of material in a certain volume, in a certain date.
3. Speculation function, goods is storaged as a result of speculation which is associated with the development of the price levels, change of exchange rates, etc.
4. Cost function, it is induced due to the need to store the larger volumes of materials (e.g. due to the drying, freezing, etc.).
5. Completing function - is associated with the creation of the range of supply in a shop or enterprise.

-21- II/2014
6. Ennobling function – is associated with the qualitative change of the stored material (e.g. aging, fermentation, maturation, etc.).
The main tasks of the storage process are the input of material to store, transposition of the material in the warehouse and its identification in terms of quality and quantity, store material in warehouse (storage, allocation of space for storing, processing, identification data, etc.), preparing material for dispensing (planning preparation of materials for production, adjustment before dispensing, sorting, assembly etc.) and removal (initial outlay to check before production, transfer to production, etc.).
The warehouse management contains also technical resources. These include a palletizing and supporting units (pallets, containers, platforms, etc.), storage devices (different types of shelves (flow pallet racks (Fig. 1), automated pallet storages (Fig. 2), refrigeration and freezing chambers (Fig. 3), service and handling equipments (transport trucks, container stackers (Fig. 4), pallet stackers, systems of transport of containers (e.g. conveyors Fig. 5, 6).
Fig. 1 Gravity pallet racks and regulatory elements
Construction: 1 - frames, 2 - beams, 3 - shims, 4 - anchor bolts Roller track 5 - bearingrail, 6 - rollers, 7 - brakingdrums, 8 - brakingrollers, 9 - brakingstrips 10 - brakingramps, 11 –catchersofpallets, 12 -
protectionofrollers

-22- II/2014
Fig. 2 Automated Storage Pallet
Source: [4]
Fig. 3 The system for cooling and freezing chambers
Source: [4]

-23- II/2014
Fig. 4 Folders of containers
Source: [4]
Fig. 5 Systems transportscontainers
1 - Roller conveyor, 2 - chainconveyor, 3 - controlgate of pallete
Source: [4]

-24- II/2014
Fig. 6 Systems of transports of containers
a - palletlift b - paller lift
c - TheSystemRadio - Schuttle
Source: [4]
For a comprehensive management of storage supply there are used different computer programmes. EasyWMS system is designed for the operational management of activities in the store.
Warehouse management system (WMS - Warehouse Management System) that integrates storage and distribution systems consists of series of interconnected applications and information tools, which together cooperate with the corresponding

-25- II/2014
communication protocols. Together with the ERP system (Enterprise Resource Planning), warehouse management software manages and controls all warehouse operations (Mecalux, translated).
3 Transport
Transport in logistics is such logistic and transport system that meets the logistical management of circulation processes.
Logistics and transport system is such a management system that in addition to process control activities of the circulatory process optimizes the overall effect of the circulatory process through all the associated information processes.
In terms of the functions of the logistics system it is required to manage traffic from the following aspects:
• optimal service quality
• optimal division of labour among the different modes in the logistic chain
• minimizing the cost of the process for the removal and circulation processes globally
In selecting the most appropriate mode of transport it is necessary to take into account the characteristics of the transport properties of the transported goods and different types of transport.
Characteristics of modes of transport are speed and reliable delivery at a specified time interval, traffic safety, the ability to transport any quantity, availability and usability of the vehicle, respectively of transport system, providing additional services during transport, increasing height of transport costs and the ability to create networks .
Considering the scale of transported processes and restrictive conditions, it is recommended to distinguish the subsystem:
• internal transport and handling, which is used to transport and material handling within the company. Basic criteria for selection of optimal transport system disappear within the company and we can influence them. [1,5] In-house transport system is created by transported material (effective performance of transport and handling operations), transport and handling units (process and the amount of traffic), vehicles and handling equipment (equipment to transport materials such as from stocks to the place of treatment) , staff (management responsibility and output of performed

-26- II/2014
operations) and the method and system of planning , organizing, managing and implementing transport and handling operations .
• off-site transport which is used to transport incoming materials from suppliers and shipping of finished products to customers . The selection of the optimal type is influenced by external conditions on which the enterprise has no direct impact.
For freight it is possible to use different systems and combine them with each other:
• sea,
• road,
• rail,
• air,
• pipeline,
• combined.
Combined transport is used mainly by large companies, logistic companies to transport on very large distances and forces to transport of such materials to the destination of peacekeeping missions and armed conflict for special and emergency measures.
4 Conclusion
Logistic and storage systems and services have their place in the manufacturing enterprise. Storage and transport are linked. Especially without transport we cannot imagine any major logistics projects. The transport system should provide the transport of material from the warehouse or directly from the manufacture to the seller or to the consumer. Transport should be organized as efficiently as possible at the lowest possible cost. Transporters associate the ways of more customers, even at extended intervals of time needed for loading and unloading in multiple collection points.
References
[1] ČAMBÁL, M., CIBULKA, V. Logistika výrobného podniku. Bratislava: STU, 2008. ISBN 978-80-227-2904-8.
[2] JEŘÁBEK, K.: Logistika. Praha: ČVUT, 2000. ISBN 80-01-01823-7.

-27- II/2014
[3] Logistika [Online]. cit. [2013-11-01]. Available at: http://www.euroekonom.sk/download2/diplomovka-teoria-obchod/Teoria-Diplomova-praca-Logistika-predmet-a-obsah-logistiky.pdf
[4] Skladové systémy Mecalux. Company Literature.
[5] Novotný, J. Návrh modelu pro hodnocení průmyslových komodit. Mezinárodní vědecká konference – Ekonomika a řízení podniku ve 21. století. VŠB – Technická Univerzita Ostrava – Ekonomická fakulta, 2014. s. ISBN 978-80-248-3520-4.
Resume
The aim of this article is to give a reader the overview of issues of some logistic activities and outline the basic questions of storage and transport of material. In order to explain the functions of the storage and material flow and refer to one of possible systems of warehouse management and ware housing. Last but not least the authors deal with the types of freight transport and they mention the possibilities of its practical use.
Key words
Storage, manufacturing enterprise, transport, handling equipment
Ing. Daniel Kučerka, PhD., ING-PAED IGIP
The Institute of Technology and Businesses in České Budějovice
e-mail: [email protected]
Ing. Milan Timko, PhD., ING-PAED IGIP
The Institute of Technology and Businesses in České Budějovice
e-mail: [email protected]
Ing. Iveta Kmecová, PhD., ING-PAED IGIP
The Institute of Technology and Businesses in České Budějovice
e-mail: [email protected]
PhDr. Monika Kučerková
The Institute of Technology and Businesses in České Budějovice
e-mail: [email protected]

-28- II/2014
INNOVATIVE SOLUTIONS IN SELECTED LOGISTICS COMPANIES IN SLOVAKIA
Silvia LORINCOVÁ, Žaneta BALÁŽOVÁ
1 Introduction
The most important goal of business activities is to make a profit. Production process or services interesting for customers with respect to their preferences: newness, distinctness, reasonable price, availability and user-friendliness in accordance with technical, economic and social progress are important to meet that goal. Innovations allow us to fulfil these requirements. The role of innovations is to create and launch new products and services onto the market assuming that strict requirements on product function, variability, utility, efficiency, quality, reliability, operating life, design and environmental characteristics as well will be met [7].
2 Innovations
According to Prno [12] innovation is a new, improved product or service launched onto the market based on the results of research and development or business activity; introduction of a new, significantly efficient production process or method of distribution including essential changes in technology, equipment or software; introduction of a new structure of organisation, workplace or external relations; knowledge transfer of the science and technology including identifying and defining research problems; improvement of methods used for quality control and testing products and services; improvement of quality and job safety, environmental impact reduction or more effective utilisation of natural sources of energy.
Innovation, according to Drucker [3], is a special entrepreneurs’ tool which helps to transform any change into an opportunity to start a new activity or to offer new services. In general, innovation is defined as a creative process in which two or more already existing things are combined in a new way for purpose of creating a new unique thing. The term is used to determine a new item, improvement, development, or changes of the original condition of some elements in real systems at all. Innovation is a tool to improve quality and performance [10]. It is a set of activities including creating new ideas and putting them into practice as well [4].
-29- II/2014
According to Spišiakova [16] four basic types of innovations are distinguished in the wide range of literature devoted to the issue of innovation:
• product innovations – new or significantly improved product regarding its essential characteristics, technical specifications, used materials, software, components, availability to customers and other functional characteristics is considered innovative products,
• process innovations – this type of innovation includes new or significantly improved production methods or supply and distribution systems. Significant changes in specific techniques, equipment or software dedicated to quality and efficiency improvement, manufacturing and supply flexibility, job safety or environmental impact reduction are parts of the innovation,
• structural innovations – innovations that includes implementation of new or significant changes in an enterprise structure, i.e. changes in management methods aimed at improving ways to implement the knowledge more effectively, product and service quality improvement, development of human potential. They include also changes in business practice, workplace structure or external relations aimed at improving the quality of innovative capacity of enterprise or performance characteristics, e.g. quality and efficiency of production processes and material flows. They are less dependent on technologies than process innovation,
• marketing innovations – it is an implementation of new or significantly improved product design (packaging) or selling methods aimed at improving product and service attractiveness or launching products into a new market. These innovations include significant changes in ways of buying and selling products and services including changes in design and packaging.
Traditional approach to innovations assumes that all innovative activities occur in enterprise. Subsequently innovations affect the product or service offered to customers. New approach, so called open innovations that provide not only innovative activities and ideas in the enterprise, has recently become more widely recognised. If the enterprise wants to implement innovations successfully, it is not enough to rely upon knowledge and ideas that it disposes of. Knowledge and ideas from the external environment, e.g. from customers, suppliers or other public resources must be taken into account, too [6]. The valuable information from the external environment can help the enterprise adapt to customers’ needs more effectively. Therefore if the enterprise does not want to lose the position in the market, it must pay attention to innovations. Logistics companies must adapt to market requirements as well. They must provide
-30- II/2014
services satisfying broad range of customers and their needs in order to make as big profit as it is possible.
3 Logistics Outsourcing
One of the most important conditions for successful business is the ability to concentrate on the activities essential for running the enterprise for long period of time, i.e. waste no time with activities that do not relate with the enterprise mission. According to Daňková [2] outsourcing is the ideal solution. It is a special form of cooperation concerning internally executed processes where the object of performance is agreed in a contract [17]. Maisner and Černý [8] complete the statement – it is a business relation generally sustained for a certain amount of time, usually for one calendar year. The principle of outsourcing is to assume responsibility for doing specific activity within an enterprise. This activity is based on bilateral contract defining the relevant issues – assent, relationship and mutual responsibility of both sides in all phases of business relation.
Outsourcing is both risk-based and principle-based. On the one hand there is a company planning to cut costs and on the other hand there is a company that want to make profit following the offered service [2]. The process when an external service provider is contracted for some selected service shows some advantages, namely [15]:
• change of responsibility – external provider takes responsibility for quality and proficiency,
• high proficiency – staff in the enterprise providing external services is experienced and skilled,
• flexible adaptation to changing situations – in case of the change in enterprise needs the external service provider can react immediately and provide services corresponding with new requirements,
• lower costs – the solution through outsourcing can cut costs in general, reduction of labour as well as logistics costs,
• financial planning – in terms of finances outsourcing offers two big advantages. On the one hand investment does not represent pressure on the budget forasmuch as services are planned over the long time-horizon, on the other hand there is an opportunity to plan investment in advance and arrange them over a longer period.
-31- II/2014
Some parts of management of the enterprise using outsourcing are given to the specialised company able to ensure that specific activities will be provided at the higher level of quality, faster or at lower costs. Nowadays outsourcing is utilized worldwide as one of tools of the strategic company management, namely as a tool of optimizing company resources consumption aimed at basic strategic company goals [17]. It is utilised in different areas, e.g. in logistics, human resource management, accounting as well as in many other areas. Logistics companies are outsourced to manage logistics activities in the area of logistics. They provide wide range of services associated with transport of goods that would be financially and otherwise difficult for the enterprise.
4 Innovative Solutions in Selected Logistics Companies in Slovakia
Logistics companies offer different types of services – standard, supplementary or individual solutions when specific type of transport or specific care during transport, e.g. of dangerous goods are required. Range of services offered by logistics companies must be adapted to customers’ requirements. Therefore it must be completed and moreover, the companies must be focused on innovation to attract customers.
4.1 DHL – Global Trade Services One of the studied companies is the company DHL. It is the global market leader
in logistics industry also well-known on the Slovak market. It commits its expertise in international express deliveries; global freight forwarding by air, sea, road and rail. With a global network in over 220 countries and territories across the globe, DHL is the most international company in the world and can offer solutions for an almost infinite number of logistics needs.
Every day, DHL Freight Slovakia transports shipments in total weight of more than 500, 000 kg. Its fleet consists of more than 470 contract vehicles, suitable for any kind of shipment. Innovative solution is to check shipment delivery status online. It is not necessary to call customer’s service and you can reveal information about the shipment in real time together with the detailed tracking data within the DHL network.
Within express deliveries DHL offers international freight services as well as parcel shipping within Slovakia. The company ensures also transport of non-standard delivery products (overloaded or dangerous goods) according to certification rules of packages IATA and ADR. DHL is the company globally known for offering services in the area of transport but in case of need customers can also choose warehousing

-32- II/2014
solutions provided by the company as well. Available warehouse space is 325, 500 m2, the area of more than 46 football pitches. DHL provides its clients with a wide scope of supplementary services, e.g. shipment preparation, packaging, insurance, weekend or holiday delivery, exclusive delivery, delivery notification options or personal pick-up.
At the present time the environment and its protection is in the centre of global attention. Therefore the company extends scope of services provided for customers who wish to protest the environment also during transport. DHL Global Forwarding, Freight expands its green service portfolio with a new tracing application on CO2-emissions. Registered customers are able to see the emission footprint of their shipments using DHL’s tracing websites. The reporting methodologies and calculation tools have been verified by the Swiss-based Société Générale de Surveillance (SGS). They are in line with the product standard “Greenhouse Gas Product Lifecycle Accounting and Reporting” from the well-known Greenhouse Gas Protocol as well as with the European Standard EN 16258 for calculation and declaration of energy consumption and GHG emissions of transport services.
Moreover, the company offers innovative complex solutions in different industrial sectors to meet needs of its customers. As the main logistics partner DHL provides services including supply chain, warehousing, interplant handling and aftersales logistics. DHL provides transportation and outsourced logistics services across all segments of the aerospace, automotive, chemical, consumer, energy, mechanical engineering and healthcare industry’s supply chain [www.dhl.sk].
4.2 Information and Communication Technologies in the Company DPD DPD parcel shop is one of the leading international parcel service providers. At
the same time it is a part of international shipping network and an expert in domestic market of shipping services which is focused not only on providing quality services but also on communication with customers, journalists or potential employees.
DPD entered the Slovak market in 2002 to continue in fulfilment of its objective: “To gain an important share in domestic and international market of shipping the parcels even in central and eastern Europe.” Growing requirements of the customers in the Slovak Republic are at present provided by the central sorting centre in Žilina and thirteen regional depots in Bratislava, Trnava, Nitra, Nové Zámky, Trenčín, Prievidza, Vlkanová, Ružomberok, Rimavská Sobota, Poprad, Košice, Prešov and Humenné.
DPD offers its customers a wide portfolio of the services of a parcel shipper, from a basic standard to delivery on the second day in determined time. DPD is a road
-33- II/2014
shipper and this fact substantively saves the costs on delivery of the parcels, delivery times are comparable with air transport but at significantly lower prices.
DPD creates for its customers innovative on-line tool for comfortable shipment processing aimed at making the DPD activities easier and faster. This tool allows the customers comfortable process of the shipment from the order to the print of the labels or saving customer‘s personal shipping preferences for next time by means of address book.
Other innovative solution offered by DPD in order to increase the satisfaction of customers is DPD Predict. It is a unique service that allows consignees to prepare themselves even better for the delivery of their parcels. On the day of delivery consignees receive a message telling them exactly when their parcel will arrive. Depending on the individual country the time window lies between 1 hour and 6 hours. If the consignee is unable to take delivery on the specified day he or she has the possibility of having the parcel delivered on a subsequent day. Depending on the individual country this can vary between a maximum of 3 and 5 days.
New interesting service offered within the city of Bratislava is City Service. It is suitable for the delivery of urgent consignments, documents, samples or contracts which the sender needs to deliver to the consignee as fast as possible. Parcels up to the weight of 31.5 kg can be delivered with the product City Service and combining the City Service with the product Exchange Parcel the DPD clients may send urgent consignments, for example the already signed contracts, back immediately. After entering of the order on the customer line or by e-mail, the DPD courier will pick up the parcel within two hours and deliver it to the consignee. The service price depends on the place of delivery of the parcel and couriers accept also payment by credit card. DPD is the only logistics company running in Slovakia offering this innovative service and expands its portfolio of services to provide the highest service and quality standards worldwide and puts it in a perfect position to meet the requirements of customers [www.dpd.com].
4.3 Storage Systems of the Company DACHSER International logistics provider DACHSER confirmed its leading position in
European market conquering for the first time the pole position in the segment of groupage services in Europe. These results were published in the prestigious study “Die TOP 100 der Logistik 2013/2014” published by DVZ (Deutsche Verkehrszeitung) logistics magazine which brings comparison of logistics providers [9]. In this study, based on the audited turnover of companies for the year 2012, DACHSER placed for the first time as the largest provider of groupage in Europe.

-34- II/2014
DACHSER has also long held fourth place on the rankings of the largest German providers of logistics services. DACHSER European Logistics is active in 29 European countries, has more than 20 of its own country organizations, 169 DACHSER locations, as well as 153 partner locations. 21,650 employees are involved at any given time in connecting the flow of commodities, information and transport companies with each other. Its drivers cover about 1,176,000 km every night to serve customers – with set time schedules and highest logistics quality.
DACHSER entered Slovak market in 2004. According to data available from the year 2012, 92 employees are involved, at any given time, in delivery of 265,300 consignments with total weight of 127,300 tonnes. Because of customers coming from numerous sectors of industry and commerce the company DACHSER transport LTL freight (e.g. pallets, crates, entire machines or components), consolidated freight as well as partial and full truck loads. Three standardized product lines “targospeed”, “targofix” and “targoflex” cover the various requirements of the customers for national and European transport. With the help of detailed concepts and processes which are tailored to specific requirements in the area of so-called hobby stores or DIY industry, the company DACHSER transport goods from the USA and Asia to Europe by air and sea freight.
DACHSER Chem-Logistics presents itself as a reliable logistics partner for companies in the chemical industry. The innovative DACHSER IT system ensures quick and safe handling and management of orders in all locations. In addition, access to all transport data throughout the entire supply chain provides the customer with the highest level of safety even for the transport of chemical products. Logistics experts specially trained in the handling of chemical goods organize the worldwide transport of special products.
In the area of warehousing the company offers an extensive warehouse network with more than 1,500,000 spaces for Euro pallets in global branches with warehouses in Europe, North Africa and China. DACHSER stores all goods according to the individual, customer-specific and legal parameters. This includes proper sanitary handling of food items as part of food logistics, required temperature control (heating and cooling) of the goods, professional storage of dangerous materials, such as in industry solution Chem-Logistics, or tracking of the serial or batch numbers. In addition, DACHSER offers removal from storage based on customer specifications (serial number, shipping unit number and batch) or manual removal. Different storage systems, such as manual or automated pallet racks, shelving racks, or cantilever racks, are combined for various requirements of individual industries to create an overall consistent solution.

-35- II/2014
Besides mentioned services, DACHSER Logistics Consulting will develop customized logistics and warehouse solutions according to the customer’s requirements. Every company has its own way of functioning with its own distinct products, markets, business processes and logistics structures. Logistics experts with in-depth knowledge of products, industries and markets will design a sustainable model and put it into operation in a time-optimized manner. Two new lines of groupage service from Košice to Hungarian towns Tiszaujvaros and Budapest will certainly help meet requirements of customers within this service. Direct lines connect all major transport hubs in the region, therefore shipments from Eastern Slovakia are delivered across Hungary within 24 hours. Ing. Roman Stoličný, Managing Director and a Board Member of DACHSER Slovakia, says that owing to a new direct route system DACHSER optimizes transit time and transportation costs not only for the company, but primarily for customers, resulting in increasing its competitive advantage. The introduction of new connections is marked by DACHSER core values – entrepreneurship spirit and courage to be innovative [www.dachser.com].
4.4 Logistics Solutions for Returnable Packaging Flow in GEFCO Slovakia, Ltd. The company GEFCO started its activity in Slovakia as a subsidiary of the PSA
car manufacturer. It provides logistics services and distribution of Peugeot and Citroën vehicles in Slovakia. GEFCO provides complete, efficient logistics solutions for its industrial customers throughout the world. It is the European leader in automotive logistics that supports car makers and parts suppliers at all stages of the logistics chain.
From vehicle distribution to customization, GEFCO has developed a complete range of high added-value services to meet the needs of industry professionals.
Within the service Overland Network Solution GEFCO inter-connects with the international platform network for both inbound and outbound road freight services.
Comprising of 150 depots interconnected by 600 international lines, GEFCO operates one of the world’s largest integrated overland networks. Goods with the weight up to 2 tonnes are delivered by GEFCO using its regular shipping lines of groupage service.
GEFCO has designed efficient, innovative logistics solutions suited to the requirements and constraints of each sector to support manufacturers in managing and optimising their global logistics chain. With OverseaSolutions, GEFCO designs and implements door-to-door air or sea transport solutions without any weight limits or final destinations. Complete offer of customs and tax representation are obvious. GEFCO Special ensures all priority consignments are delivered for emergency orders and that require a direct delivery door to door, utilizing double-manned,

-36- II/2014
satellite tracked vehicles. The operation of 365 days a year, 24 hours a day ensures an immediate response time.
Packaging waste is a major source of environmental pollution. To reduce this waste, GEFCO has developed an innovative sustainable packaging solution, the GefBoxSystem range. With GefBoxSystem, GEFCO is helping to develop green logistics by providing customers with washable, reusable plastic containers that are more environmentally friendly. Equipped with 6.4 million handling units, GEFCO processes 40 million deliveries throughout Europe each year. The company disposes of 6.2 mils. reusable containers and 22 collection and washing centres all over the world. GEFCO manages flows and plans future requirements using a dedicated information system.
GefBoxSystem provides a range of services. "FullPack" is a one-stop, high added-value service that lets customers focus on their core business while GEFCO takes care of reusable packaging concerns. GEFCO provides a complete service, from the delivery of containers to suppliers to the collection and maintenance at the customer's plant.
GefBoxSystem solutions are tailored to each customer’s specific needs. With “FlowPack”, “FleetPack” and “FreePack” GEFCO manages all or part of logistics operations concerning containers, whether owned by the customer or not. GefBoxSystem uses pool effect, i.e. GEFCO handling units are used by several companies throughout Europe. Particular users are charged only for the time of using the unit and that way fixed costs are divided into several companies. Therefore, the solution is attractive for many customers.
In every aspect of the solution, GefBoxSystem meets customer demands in the area of sustainable development. By pooling and reusing industrial packaging, the system allows GEFCO customers to significantly reduce waste as well as the number of vehicles on the road. Container cleanliness and resistance are regularly inspected. GEFCO designs ergonomic packaging units to protect fragile components [www.gefco.sk].
4.5 Oil Industry Logistics Transportation and storage of crude oil represent a strategically important
component also of the Slovak economy, in particular of its energy sector. In Slovakia this activity is executed only by TRANSPETROL, Inc. via its oil pipeline network. TRANSPETROL, Inc. transported for its customers of 10,790,567 tonnes of crude oil

-37- II/2014
in total. The total volume of transported crude oil in 2009 reached the second highest level since 1999 and was higher by 16% compared with 2000.
In addition to the crude oil transportation, TRANSPETROL, Inc. is also involved in crude oil storage. The present capacity of stacks comes up to 680 thousand cubic meters and its major part corresponds with strict domestic legislative requirements as well as with the European standards in the field of formation and protection of the environment. Except the operative storage of crude oil for business partners, stacks serve as storage of crude oil for the State Material Reserves. In 2009, in accordance with the requirements of the crude oil customers, TRANSPETROL stored crude oil in the weight of 4,661,198 tonnes. It currently equals to a 90-day level of consumption of crude oil and crude oil products.
TRANSPETROL is in favour of applying of progressive information technologies which support safe operation of the oil pipeline system and the prevention of the environmental protection in the territory, it is located. The crude oil pipeline information system (COPIS) is developed as a spatial technical and environmental information system to support the control of the operation and maintenance of the oil pipeline system. TRANSPETROL kept on spreading the COPIS system by adding further geo – spatial data into the database of COPIS and improving of the COPIS system function. COPIS enables its users to gain picture information with tabular data about selected objects of the oil pipeline system, to evaluate the situation and the state of interactions of the oil pipeline system and the surrounding territory of interest, therefore to regulate the operation related to the maintenance and repair plan. Apart from COPIS, TRANSPETROL uses the Management Information System which informs “online” about the parameters of environmental performance, detects approaching to limit states and enables modelling of economic situations and strategic financial aims.
An information system and a system for the identification of oil spills, called LEOS, monitor the safety of the pipeline. The LEOS system identifies the exact position of leakage of even small volumes of liquid hydrocarbons in water-sensitive areas. The pipeline information system supports the evaluation of extraordinary events and the potential risks of interaction between the pipeline and the surrounding environment. The last accident on the pipeline system, caused by the third side, occurred in 2002 in the eastern Slovak village of Belža. The environmental protection system enabled TRANSPETROL to respond to the accident only three minutes after leaking started and therefore to eliminate the environmental pollution. Its disposal is not only time but also money consuming [www.transpetrol.sk].

-38- II/2014
5 Summary
We analysed five logistics companies in Slovakia. Despite the fact that each company offered different scope of services, they are identical in one thing – portfolio of their services must be innovated. Following table shows innovations in studied companies operating in the Slovak market according to the structure described by Spišiaková [16] mentioned in chapter 2.
Tab. 1 Summary of innovative solutions in selected logistics companies
Type of innovation
Company Specific innovation
Product innovations
DPD
- SMS notification about time of shipment delivery - delivery of urgent consignments and their return
shipping - payment to DPD’s courier by credit card
Process innovations
DHL - shipment delivery status online - tracing application on CO2-emissions
DPD - on-line tool for consignment processing
DACHSER - quick and safe handling and management of orders - two new lines of groupage service
GEFCO Slovakia, Ltd.
- logistics solutions for returnable packaging flow
TRANSPETROL - crude oil pipeline information system - management information system
Source: [Own processing]
As we can see in the table, innovations in studied logistics companies were focused on process innovations. Only the company DPD implemented product innovations, too. Other types of innovations (organisational and marketing innovations) were not implemented by studied companies. On the other hand, in the research carried out by EurActiv.sk in cooperation with the National Agency for Development of Small and Medium-sized Enterprises within the project “Support of Innovation in Slovak Small and Medium-sized Enterprises” in industrial enterprises, process innovations took the third place, right after marketing and product innovations. Therefore we can state that innovation implementation is affected by various factors and one of them is the sphere of business activities. Nevertheless, the enterprises have to deal with innovations because all business activities are affected by them. Innovation can result in increasing competitive advantage of the enterprise and subsequent success in the market of goods and services [18-20].
-39- II/2014
6 Conclusion
The question “how to survive the market competition” is in the centre of attention of each enterprise subject. Business that wants to stay successful during this process must manage its activities effectively; therefore, it must outsource some specialists. Logistics companies provide mentioned activities in the area of logistics, e.g. they offer transportation services and the enterprise can perform its main business activity in a more effective way. At the present time logistics companies provide full scope of services to meet individual requirements of customers. However, offered services must be innovated continually in order to find new ways of successful marketing sustainability.
References
[1] Dachser opäť vedie prestížny rebríček poskytovateľov zbernej služby. [online]. 2014. [15.04.2014]. Available on the Internet: <http://www.dachser.com/sk/sk/ DACHSER-tops-the-rankings-of-groupage-providers-in-Europe_843.htm>.
[2] DAŇKOVÁ, A., 2007. Podnikanie malých a stredných podnikov. Prešov: Vydavateľstvo Michala Vaška, 198 p. ISBN 978-80-7165-628-9.
[3] DRUCKER, P. F., 2007. Innovation and entrepreneurship. Oxford: Elsevier, 288 p. ISBN 978-0-06-085113-2
[4] DUPAĽ, A., 1997. Manažment inovácií podniku. Bratislava: EKONÓM, 262 s. ISBN 80-225-0841-1.
[5] Gefco. [online]. 2014. [25.04.2014]. Available on the Internet: <http://sk.gefco.net /gefco-slovakia/o-nas/>.
[6] CHESBROUGH, H., 2009. Open Innovation: The New Imperative for Creating and Profiting from Technology. Boston: HARVARD BUSINESS SCHOOL PRESS, 228 p. ISBN 1-4221-0283-1.
[7] KOVÁČ, M., 2002. Inovácie a technická tvorivosť. Prešov: Vydavateľstvo Michala Vaška, 166 p. ISBN 80-7165-369-1.
[8] MAISNER, M., ČERNÝ, J., 2012. Právní aspekty outsourcingu. Praha: Wolters Kluwer ČR, 180 p. ISBN 978-80-7357-746-9.
[9] Najväčšie dopravné a špedičné spoločnosti. In Trend. [online]. 2013. [08.04.2014]. Available on the Internet: <http://firmy.etrend.sk/rebricky-firiem/ najvacsie-dopravne-a-spedicne-spolocnosti.html>.

-40- II/2014
[10] PANAYIDES, P. H. a i., 2009. The impact of trust on innovativeness and supply chain performance. Production Economics. 2009. Vol. 122, p. 35–46.
[11] Praktické online služby. [online]. 2014. [17.04.2014]. Available on the Internet: <http://www.dpd.com/sk/home/online_sluzby>.
[12] PRNO, I. 2008. Investičná a inovačná politika. Bratislava: Vysoká škola ekonómie a manažmentu verejnej správy, 220 p. ISBN 978-80-89143-85-6.
[13] Profil spoločnosti. [online]. 2014. [10.04.2014]. Available on the Internet: <http://www.dhl.sk/sk/o_nas/profil_spolocnosti.html>.
[14] Ropný priemysel. [online]. 2014. [02.05.2014]. Available on the Internet: <http://www.transpetrol.sk/ropny-priemysel/>.
[15] ROSOVÁ, A., BÁRTOVÁ, P., 2012. Regulovanie stavu zásob verzus outsourcing obstarávania osobných ochranných pracovných prostriedkov v podniku. Žilina: Logistický monitor. 2012. ISSN 1336-5851.
[16] SPIŠIAKOVÁ, E. 2008. Typy inovácií a ich zavádzanie v podnikoch SR. Košice: Transfer inovácií. 2008. Vol. 11, p. 222 – 225.
[17] VETRÁKOVÁ, M. – POTKÁNY, M., – HITKA M. 2013. Outsourcing of facility management. Zvolen: E+M Ekonomie a management. 2013. Vol. 16, No. 1, p. 80-91. ISSN 1212-3609.
[18] Novotný, J. Globalizace a její vliv na spotřebitele. Vědecké spisy FES. Pardubice, 2009. ISBN 978-80-7395-235-8.
[19] KAMPF, R., LIZBETIN, J., LIZBETINOVA, L. Requirements of a transport system user. (2012). Communications. Vol. 14 (4). pp. 106 – 108, ISSN: 1335-4205.
[20] KUBASÁKOVÁ, I., KAMPF, R., STOPKA, O. Logistics information and communication technology. (2014). Communications. Vol. 16 (2). pp. 9 – 13, ISSN: 1335-4205.
Resume
Whereas transport of goods was ensured by the enterprises in the past, nowadays there are logistics companies providing various solutions for transporting goods from producers to final customers. Constant innovation drives success and that is why logistics companies extend the scope of their services and provide more complex services. Economic aspect of outsourcing may not be ignored. The enterprise utilising outsourcing is able to spare money that can be invested in further development subsequently. Saving the time is other important aspect. Freight specialists select the

-41- II/2014
most appropriate services for the customer’s requirements. Therefore, outsourcing is considered mature business strategy with positive effects on customers.
Key words
Innovations, outsourcing, logistics companies
Ing. Silvia Lorincová, PhD.
Technical University in Zvolen
Faculty of Wood Sciences and Technology
Department of Business Economics
e-mail: [email protected]
Mgr. Žaneta Balážová
Technical University in Zvolen
Institute of Foreign Languages
e-mail: [email protected]
-42- II/2014
CUSTOMER SERVICE - A FINE LINE BETWEEN LOGISTICS AND MARKETING
Peter MAJERČÁK, Ivana WEISSOVÁ, Katarína MORAVČÍKOVÁ
1 Introduction
Customers are important to organizations, and organizations that view customers as a “nuisance” may not last very long in today’s highly competitive business environment. Moreover, a frequently cited business metric is that it costs approximately five times as much to develop a new customer as it does to retain an existing one. Regardless of the exact figure, it’s easier for an organization to keep an existing customer than it is to acquire new customers. To this end, customer service strives to keep customers happy and creates in the customer's mind the perception of an organization that is easy to do business with.
2 Understanding of Customer service in logistics and marketing
Customer service can be an excellent competitive weapon and is more difficult for competitors to imitate than other marketing mix variables such as price and promotion. Nordstrom’s (a high-end retailer) has a long-standing reputation for excellent customer service, and this customer focus often leads Nordstrom’s to do things that competitors cannot or will not match. For example, one of the authors was shopping at a local Nordstrom’s and found a belt that he liked, but the store didn't have the correct size in stock. Several days later, the author received a call from a Nordstrom’s salesperson indicating that the desired belt was available for purchase at the local store. The salesperson had located the belt at another Nordstrom’s and had the belt expedited—via air to the local store. With a retail value of approximately $45, it’s likely that the particular Nordstronfs lost money on this purchase. It’s a reasonable assumption, however, that few other retailers would copy Nordstrom’s behavior in servicing the customer. Customer service is sometimes used interchangeably with customer satisfaction, but the two concepts are not synonymous; rather, customer service can be a component of customer satisfaction. See Figure 1.

-43- II/2014
Fig. 1 Reflecting Customer views
Customer satisfaction compares a customer’s actual experience with the expected experience, and if the actual experience equals or exceeds the expected experience, then a customer would be satisfied. (3) Conversely, if the actual experience does not measure up to the expected experience, then a customer would be dissatisfied. Customer service can influence both the expected and actual experience and hence influence customer satisfaction. Although many examples could be used to illustrate this point, consider that toll-free telephone numbers are a common customer service option provided by many organizations. Those without toll-free numbers could cause customer dissatisfaction because of the customers expectation that this is a service that should be offered by all organizations. (Note that we haven’t even discussed the customer‘s reason(s) for telephoning an organization.) Macro environmental changes, such globalization and advances in technology, are causing organizations and individuals to demand higher levels of customer service.
As was pointed out in an earlier chapter, customer expectations continue to increase over time: if the associated performance (service) levels fail to keep up, then customer dissatisfaction is a likely outcome. In addition, as emphasized in this chapter, reliable service enables a firm to maintain a lower level of inventory, especially of safety stocks, which produces lower inventory holding costs. Third, in an increasingly automated and computerized world, the relationships between customers and vendors can become dehumanized. This situation is both frustrating and inefficient from the customer‘s viewpoint. [1, 2]

-44- II/2014
The firm that can offer a high level of customer service, especially on a personal basis, will find that it has a powerful sales advantage in the marketplace. Furthermore, the increased use of vendor quality-control programs necessitates higher levels of customer service. In recent years, many firms, especially retailers and wholesalers, have become more inventory conscious. This emphasis has resulted in computer-assisted analysis to identify vendors who consistently give either good or bad levels of service. In the past, with manual systems, repeated and serious customer service errors occurred before a vendor’s activities were singled out for corrective action. (3) Today, these factors are automatically programmed into computers, and companies are able to closely monitor the quality of service they receive from each vendor. We’ve talked at some length about customer service, but we've yet to offer a formal definition of it. Keeping in mind that there are myriad customer service definitions, for our purposes customer service will be defined as “the ability of logistics management to satisfy users in terms of time, dependability, communication, and convenience.” Let’s take a closer look at each of these four dimensions of customer service.
Time
Clearly, the order cycle is a major component of the time dimension of customer service. At the risk of sounding redundant, businesses today are looking to reduce order cycle times longer cycle times translate into higher inventory requirements.
Dependability
Dependability refers to the reliability of the service encounter and consists of three elements, namely, consistent order cycles, safe delivery, and complete delivery. Our earlier discussion of the order cycle highlighted the importance of consistency (reliability/dependability)-inconsistent order cycles necessitate higher inventory requirements. And although order cycle time is important, an increasing number of companies are trading off order cycle speed for order cycle consistency.
More specifically, these companies are willing to accept a slower order cycle so long as it exhibits a high level of consistency. Safe delivery brings loss and damage considerations into play. Product can be lost or damaged for a multitude of reasons, but they are rather immaterial to a customer—a lost or damaged product can cause a variety of negative ramifications for a customer, such as out-of-stock situations. Order fill rate, or the percentage of orders that can be completely and immediately filled from existing stock, is one way of measuring the completeness of delivery. As is the case with loss and damage, incomplete deliveries result in negative customer ramifications, such as out-of-stock situations. It is unlikely that loss and damage can

-45- II/2014
ever be totally eliminated; because orders are picked and assembled, they are handled—-and every time product is handled provides opportunities for loss and damage. However, the seller may be able to minimize the number of times an order is handled, perhaps by redesigning the order pick process. And, even if an organization has highly accurate demand forecasting, it’s also unlikely that it will be able to achieve a 100 percent fill rate (i.e., all incoming orders are filled completely). Consider the situation of the McDonald’s restaurant where two people walked in and placed a take-out order for 142 Egg McMuffins! Although the restaurant was successfully able to fill this order (but not before ensuring that the two customers could pay for it), the inventory needed to fill it meant that a lot of other orders for Egg McMuffins went unfilled, at least until the next scheduled delivery of foodstuffs.
Communication
Effective communication should be a two-way exchange between seller and customer, with the goal of keeping both parties informed. Moreover, effective communication requires that the correct parties be involved in the process; if a customer has a logistics-related question, then the customer should be communicating with someone with logistics expertise. Moreover, customer service can be enhanced if complete information is exchanged between the participants; a delivery address can be helpful, but outstanding characteristics of the delivery address would be even more helpful, as illustrated by the case of the transportation company that was responsible for delivering a $750,000 shipment of computer racks. What the transportation company didn’t find out-—until it actually made the delivery—was that the customer was located on the 17th floor of an office building in the central business district of a major city. Because neither the transportation company nor the office building had the appropriate equipment to facilitate the shipment’s handling, the delivery was delayed until the proper equipment could be locate and brought to the building.“ Two-way communication between seller and customer has certainly benefited from technological advances such as cell phones, personal digital assistants, and the Internet. These technological advances allow for less costly and more frequent contacts between the two parties Having said this, technology such as text messaging and the Internet can depersonalize the communication process, which is why periodic telephone interaction and even face-to-face contact between seller and customer are recommended.” (You should recognize that person: communication is an essential part of conducting business in many cultures.)
-46- II/2014
Convenience
The convenience component of customer service focuses on the ease of doing business with seller. Having said this, different customers may have different perceptions of the “ease doing business” concept. For example, for a college student the “ease of doing business” with bank might mean access to automatic teller machines, whereas for a small business owner: might mean bank tellers who specifically focus on commercial deposits and withdrawals. A such, sellers should have an understanding of their customer segments and how each signer views the “ease of doing business.” Moreover, from the seller’s perspective, certain costs may be associated with convenience for example, there may be a charge for pizza that’s delivered to your residence (or “free delivery areas” might be very small in geographic coverage). As a result, sellers must assess the extent to which their customers are willing to pay for convenience. In recent years many ail lines have discovered that allowing customers to arrange their own travel via the Internet i quite cost effective for the airlines in that the costs of processing an electronic ticket are approximately $1 compared to $10 for processing a paper ticket. As a result, customers why arrange their travel by telephoning an airline’s customer service agent may now be charged fee for talking to the service agent (a service that for many years was “free” to the customer).
3 Establishing customer service objectives
Because customer service standards can significantly affect a firm’s overall sales success, establishing goals and objectives is an important senior management decision. Distribution is close related to customer service, so the outbound logistics department plays an important role in the establishment of customer service goals and objectives. Some companies distinguish goals from objectives when establishing customer service standards. Goals tend to be broad, generalize statements regarding the overall results that the firm is attempting to achieve. Unfortunately some firms’ statements of customer service goals are couched in platitudes lacking specify objectives specifying how the goals are to be achieved. This is a serious problem because if the customer service objectives or standards are not stated in specific terms, they may be ignored o be too vague to provide any real guidance to operating personnel.
Objectives, the means by which goals are to be achieved, state certain minimum requirements and are more specific than goals. Objectives should be specific, measurable, achievable, and cost effective; the latter two are extremely important because relatively small increases in the overall level of customer service objectives

-47- II/2014
can substantially increase the costs of maintaining the increased level of customer service. In other words, although it might be possible to achieve a particular objective, to do so might be cost prohibitive.
Consider, for example, an objective to reduce order picking errors from 5 to 2 percent within a 12-month time period. Let’s assume that this objective is specific and measurable. Although 12 months might be a reasonable time period in which to achieve the 3 percent reduction in order pick errors, what will it cost to achieve this reduction? Will the company be forced to hire additional personnel to check the picked orders? Will the current order picking process need to be restructured, perhaps through the addition of new technology? Can the company afford new people or new technology? If so, is the somewhat marginal improvement in customer service worth the additional costs? A central element in establishing customer service goals and objectives is determining the customer’s viewpoint. This means asking customers for their insights about customer service. What services would the customer like to receive that presently are not available from the seller? What services do customers view as the most important? How well does the seller currently provide what the customer wants? What could be improved? Because customer service is a competitive tool, it’s also important to learn how the customer evaluates the service levels of competing sellers.
Many companies evaluate their service performance through benchmarking (comparison of an organization’s performance to the performance of other organizations), and well-run organizations benchmark not only against competitors but against best-in-class organizations as well. The benchmarking should not only involve numerical comparisons of relevant metrics (e.g., fill rates) but should also learn about the processes associated with the metrics (e.g., how a best-in-class organization achieves its fill rates). The nature of the product also affects the level of the customer service that should be offered. Substitutability, which refers to the number of products from which a firm’s customers can choose to meet their needs, is one aspect. If a firm has a near monopoly on an important product (i.e., few substitutes are available), a high level of customer service is not required because a customer who needs the product will buy it under any reasonable customer service standard. However, if many products can perform the same task, then customer service standards become important from a competitive marketing point of view.
Another product-related consideration when establishing customer service goals and objectives is where the product is in its product life cycle. A product just being introduced needs a different kind of service support than one that is in a mature or declining market stage. When introducing a new product, companies want to make

-48- II/2014
sure that there is sufficient supply of it to meet potential customer demand, and so companies might use expedited transportation to protect against out-of-stock situations. It is far less likely that the same company would use expedited transportation to guard against an out-of-stock situation with a product in the decline phase of the product life cycle [4-6].
The article is an output of a scientific project 1/0931/12 Majerčák, P. et al: Uplatnenie Teórie obmedzenia (TOC) v logistickom riadení výroby podniku registered
by VEGA MŠ and SAV.
References
[1] Nedeliakova, E., Dolinayová, A., Nedeliak, I. 2013. Metódy hodnotenia kvality prepravných služieb. Žilina : EDIS, 2013. ISBN 978-80-554-0817-0.
[2] Nedeliaková, E., Nedeliak, I., Blinova, E. 2013. Dynamic models of service quality as a new trend in quality management. In: Ekonomika a manažment podnikov 2013. Zvolen. 8. medzinárodná vedecká konferencia. ISBN 978-80-228-2565-8
[3] Nedeliaková, E., Nedeliak, I., Čamaj, J. 2013. Ekonomická efektívnosť intermodálneho prepravného reťazca v kontexte identifikácie úzkych miest. In: Eurokombi – Intermodal 2013. 14. medzinárodná vedecká konferencia, Žilina. ISBN 978-80-554-0708-1.
[4] Novotný, J. Faktory ovlivňující spotřebitele při poskytování hypotéčních úvěrů. Vědecké spisy FES. Pardubice, 2009. ISBN 978-80-7395-209-9.
[5] Duspiva, P., Novotný, J. Využití kvantitativních metod při rozhodování manažera. Vědecké spisy FES. Pardubice, 2010. ISSN 1211-555X.
[6] KAMPF, R., PRŮŠA, P., SAVAGE, C. Systematic location of the public logistic centres in Czech Republic. (2011). Transport 26 (4) pp. 425 – 432, ISSN: 1648-4142.
Resume
This paper considers the highly topical issue which is important in an environment of logistics and marketing. Customer service is a place where it meets the requirement of the customer with offer from manufacturer. Customer service strives to keep customers happy, and the four dimensions of customer service were discussed in the paper.
Key words
Customer service, dependability, convenience
Ing. Peter Majerčák, Ph.D.

-49- II/2014
University of Žilina
Faculty of Operation and Economics of Transport and Communications, Department of
Economics
e-mail: [email protected]
Ing. Ivana Weissová
University of Žilina
Faculty of Operation and Economics of Transport and Communications, Department of
Economics
e-mail: [email protected]
Ing. Katarína Moravčíková
University of Žilina
Faculty of Operation and Economics of Transport and Communications, Department of
Economics
e-mail: [email protected]

-50- II/2014
TRENDS AND DEVELOPMENT IN LOGISTICS
Martin PODAŘIL, Soňa RUSNÁKOVÁ
1 Introduction
Originally, the term of logistics was associated with mathematics, later, with the military terminology and now it is also used in economic terms. In general, it can be said that logistics is the motion of materials and in some cases even the people. The first use of this term was associated with military strategy, but its use gradually spread also to commercial activities.
In 1991 the Council of logistics management has defined this term as „the process of planning, implementation and colntrol of the efficient and effective flow of resources, services and related information from the point of origin to the point of need with specified requirements“. [1] Královenský et al. [2] defines logistics as an interdisciplinar science that deals with the coordination, harmonization, relation and optimization of the raw materials flow, semi-finished products and services, but also the information and finance flows in terms of costumer satisfaction for the lowest outlay.
Logistics on the one hand leads to the costs savings, reduced stocks, releasing the capital and thereby to increasing efficiency and profit, on the other hand, logistics is a tool for attracting and retaining costumers, because it provides benefits, by which the company that applies the logistics acquires greater competitivness and has higher market performance.
The most important objective of a business logistics is „generally to increase or optimize the market performance of company“. [3] This is reflected in three factors: in the quality of product, in the price of product and in supply service.
Královenský and Gnap [3] among the objectives of logistics include also the increase of business flexibility by adapting on condition changing in the field of purchase and sales and the elimination of management conflict between various logistics areas through coordinated planning.

-51- II/2014
2 Modifiations and development in logistics
In recent years, the conditions in which the companies operate have changed and this change affected also the field of logistics. Trends in logistics were summarized by Bán on the following figure:
Fig. 1 Trends in logistics
Source: [4]
The modification in the field of strategy and company objectives can be seen already. While in the past decade have played a major role the costs, currently the reliability has a higher priority. In addition to the modifications of priority objectives, the modification of the status of logistics in the company is expected. The future of companies lies in the identification of opportunities for logistics solutions and their use as a competitive advantage for improving the marketing. To increase the satisfaction with the costumer service it is necessary to focus on the quality of processes. Total

-52- II/2014
Quality Management is a philosophy focused on continuous quality improvement of performance by conscious planning, implementation, monitoring and control. Although this method is used for a longer time, its advantage of smaller and mid-term improvements compared to the large and occasional modifications still promises a long-term perspective.
Costs are the most sensitive item in the company. By reducing costs companies have to think about the centralization of production and distibution. Rising energy prices make life difficult for carriers in particular, but also other partners will need to consider the reflection of thises increases in final prices or, more likely, to find the places in processes, in which can money be saved. In the future we therefore expect the further development of lean logistics and just-in-time system associated with the outsourcing of services. For better understanding of the logistics costs, it is recommended to switch on ABC system (activity-based costing) to save the costs by logistics activities. [4]
In the field of cooperation with external companies it is expected the further development of outsourcing of side activities. Although this is a tendency of backsourcing, the giving up of the control over certain activities is always more affordable for most companies. Another megatrend is the consolidation of markets in fields with high capital intensity. This will also include the logistics and warehousing. Development of cooperation within the supply chains raises the need of an uniform system for communication among the partners. The need of standardization at national, European and global level is therefore a question of near future.
Logistics connects the whole world and provides the commodity flows. That is why this field is especially exposed to globalization. The most important global trends, according to Bán [4], are the development of information technology, supply chain management and globalization.
Trends in human resources are mainly characterized by an increasing demand for professional logisticians. The education of logisticians must be a multi-disciplinary, including the knowledge mainly from logistics, transport, information technology and management areas. Professionals are missing mainly in the area of strategy and planning. Currently new phenomenon was developed to postpone the activities that are labour-intensive to countries with low labour costs called offshoring. World Trade Organization percieves this tendency strongly in postponing the manufacturing to China, or postponing the IT centres to India. This tendency will continue to apply because of the costs pressures.

-53- II/2014
Technologies enable the logistic industry to create a remarkable added value. Advances in information technology and the spread of the internet have opened the door to linking of individual information networks. Electronic order processing ensures faster, qualitative and costs economical servise.
The environmental protection is one of the main topics of the future, which causes long-term modifications in the development of logistics value. Global warming and various changes in seasons directly or indirectly affect the lives of everyone. All fields should optimize their processes with the respect to saving of precious resources. Green logistics is the way of the future, but it must first prove its effectiveness. Logistics and transport should be mainly focused on:
• Green logistics – process optimization with the respect to the environment, life-cycle analysis of products, support of reusable resources (plastic pallets, crates instead of cardboard),
• externalities caused by transport – air pollution, greenhouse gas emissions, congestions, destruction of existing infrastructure,
• disposal of hazardous materials and separation of recyclable waste,
• in the production to support the least energy-consuming products made of recycled materials.
Within the green logistics, the reverse logistics has a perspective, which is used in the processes of recycling, reusing and reducing the materials used in manufacture. Green logistics starts in the development phase of the product by deciding about materials used, in order to minimize the material consumption and subsequent costs of separation of components.
Uncertainty and modification of conditions in enterpreneurship can be met only by accepting logistics as and equal partner of corporate leadership and recognition of the fact that logistics spans the entire enterpreneurial process, that „the development of advanced logistics systems based on compatible communication and transportation standards requires high technological know-how, financial investment and management skills“. [5-7]
He further states the crucial modifications in the field of logistics, namely:
• Integration of logistics performance – not improve various parts of logistics chain, but achieve overall optimization,
• increased investment into logistics systems,
• assume a large number of activities within the value chain by suppliers and companies providing specialized logistics services,

-54- II/2014
• active use of new information and communication technology – procurement through internet, ways of marketing (online shops), modification in distribution and mail-order structures,
• increasing demands for product individualization.
3 Conclusion
Current trends in the field of logistics are successively applied also in conditions of Slovak and Czech companies considering the ever growing competitive pressure. There is a wide range of industrial engineering techniques, which are applied still in larger scale. If the company wants to carry out any modifications in logistics, it is necessary to consider whether they really know the status quo, if they can describe weaknesses and problem areas and suggest optimization steps. If not, it is necessary to consider the possibility of rapid corporate audit. With the failure of modification projects in their infancy, it only leads to unnecessary distrust to possible changes in solving team and by that we set the distrust and reluctance to any of modifications in the future. Every company has possibilities to optimize the logistics, it is only necessary to think whether it would be appropriate to pay more attention to them and what would they bring to us.
References
[1] UHROVÁ, M: Štíhla logistika. 2012 [online]. cit. [2013-10-06]. Dostupné na internete: http://www.ipaslovakia.sk/sk/ipa-slovnik/stihla-logistika
[2] KRÁLOVENSKÝ, J.- GNAP, J.- MAJERČÁK, J. – ŠULGAN, M.: Postavenie dopravy v logistike, 1. vydanie, Žilinská univerzita v EDIS – vydavateľstvo ŽU, Žilina 2001
[3] KRÁLOVENSKÝ, J.- GNAP, J.: Čo je logistika [online]. cit. [2013-10-06]. Dostupné na internete: http://www.zlz.sk/sk/informacie-o-zvaeze/o-je-logistika.html
[4] BÁN, Z.: Postavenie logistiky v global supply chain : diplomová práca. Bratislava : Ekonomická univerzita v Bratislave, Obchodná fakulta, 2009, 88 s. vedúci diplomovej práce: doc. Ing. Heda Hansenová, PhD
[5] BAKOŠOVÁ, H.: Trendy a možnosti ďalšieho vývoja logistiky. 2003 [Online]. cit [2013-10-06]. Available at: http://www.fce.vutbr.cz/ veda/dk2003texty/pdf/5-2/rp/bakosova.pdf.
[6] Novotný J., Mikulecký, P. Znalostní management a jeho uplatnění v menších podnicích. Vědecké spisy FES. Pardubice, 2011. ISSN: 1211-555X.
[7] STOPKA, O., KAMPF, R., KOLÁŘ, J., KUBASÁKOVÁ, I., SAVAGE, CH. Draft guidelines for the allocation of public logistics centres of international importance. (2014). Communications. Vol. 16 (2). pp. 14 – 19, ISSN: 1335-4205.

-55- II/2014
Resume
The world economy begins to accept uncertainty and risk factors as constant factors that are present in company management. Logistics represents a mean of reducing turbulence and uncertainty in business, while its primary role is the systemic solution, coordination and synchronization of material chains and information flow within the company and with the environment. There are new opportunities and requirements on logistics regarding the process management, e-logistics and supply chain management and exactly on these changes and new trends in logistics is addressed this article.
Key words
Logistics, logistics changes, logistics trends
Ing. Martin Podařil, Ph.D.
The Institute of Technology and Businesses in České Budějovice
e-mail: [email protected]
doc. Ing. Soňa Rusnáková, Ph.D.
The Institute of Technology and Businesses in České Budějovice
e-mail: [email protected]

-56- II/2014
TRANSPORT PROBLEM OF FRESH FRUIT AND VEGETABLES
Ľubor ROVŇANÍK
1 INTRODUCTION
This article is focused of the description conditions during transport, storage and ripening of fruit and vegetables. Main part will focus on describe the processes associated with the transport of bananas.
2 CONDITIONS OF TRANSPORT, STORAGE AND RIPENING OF FRUIT AND VEGETABLES
The transport of fresh fruit and vegetables is a complicated topic. Differing fruit and vegetables have widely varying requirements for their safe preservation. The rate at which living fruits and vegetables age and eventually submit to senescence, attack by micro-organisms and inevitable demise depends upon the environmental status afforded during storage and transit. The most important factor that must be observed to maintain the temperature of transported goods at an optimal level. For safe carriage this will usually require that the commodities are pre-cooled and maintained at that temperature prior to being loaded into the transport unit, be it refrigerated ship, container or other mode of transport. It must be maintained throughout the period of shipment unchanging the optimum temperature in a transport unit with respect to the type of goods transported. Every kind of fruit and vegetables require different temperature.
All fresh fruits and vegetables are living products and their life processes continue after harvest; the two most important being respiration and transpiration. The normal respiration results in the fruit and vegetables consuming oxygen and giving off carbon dioxide; water; and varying, albeit immense, amounts of heat. The higher the ambient temperature surrounding the commodity the greater will be the temperature of the commodity itself and consequently the larger its rate of respiration. The second process, transpiration, is the loss of water by evaporation which will occur once the fruit or vegetable is removed from its tree or plant which has been the source of water

-57- II/2014
during its formative period. Thus the storage/carriage conditions afforded the produce should be such that excessive water loss does not ensue.
2.1 Temperature Many reference books include tables which provide data, including optimum
temperatures, for the safe storage of commodities. Other publications specifically list the optimum transit (carriage) conditions. Published data applicable to sea-going carriage requirements may indicate slightly higher optimum temperatures. However it is essential to understand that published values of optimum temperatures for storage or transit are not absolute – the accurate optimal requirements are dependent upon varietal, climatic and other details of the produce. The optimum and required transport temperature of fruits and vegetables should be provided in writing by the shipper who will, or should, have full knowledge of the history of the produce and which temperature must be maintained by the carrier throughout the period under his control. Generally speaking the higher the temperature the faster will be the growth of moulds and bacterial infections.
2.2 Freezing points The lowest safe limit of temperature for each commodity is its highest freezing
point. This temperature is invariably slightly below 0°C Generally speaking the main contents being sugars the sweeter the produce the lower the freezing point. Nonetheless it must also be remembered that stalks of fruit contain much less sugar and may freeze at a higher temperature than the fruit itself, resulting in death of the stalk tissue with possible consequences when the fruit is restored to ambient temperatures with likely loss of sound market values.
2.3 Chill damage A second factor which establishes the lower safe limit of carriage temperature of
some produce is that of chilling, which is a reduction in temperature that does not reach the freezing point of the produce. Numerous commodities especially those grown in tropical climates, or alternatively from plants originating from the tropics, are easily affected by low temperatures and inclined to injury to their tissues at temperatures well above their freezing point.
2.4 Relative humidity Relative humidity may be defined as the ratio of the water vapour pressure
present in air at an existing temperature to the water-vapour pressure which would be present if the vapour were saturated at the same temperature.

-58- II/2014
Thus the relative humidity of the air within a cargo compartment of a refrigerated vessel, insulated refrigerator container or trailer directly determines the retention of the condition of the products carried. Relative humidity below the optimum range will result in shrivelling or wilting in most produce. The maintenance of an optimum range of humidity is often one of the more difficult to resolve during the carriage of fresh produce.
Relative humidity of air of 85% to 95% is usually recommended for the carriage of most perishable produce in order to preclude/impede wilting or shrivel caused by moisture loss. Exceptions to the above include the carriage of onions, dates, coconuts, ginger rhizomes, yams, dried fruits and some horticultural produce. If the relative humidity increases to 100% condensation may occur which would increase the likelihood of mould growth within the compartment and on the produce itself.
2.5 Air circulation The circulation of cooling air within cargo compartments must be kept at an even
required temperature throughout. Despite variable heat leakages which may occur in various parts of the system, and the inevitable increase in the circulating air temperature at return compared with delivery, the result of removal of respiratory heat from the produce, only a small increase should be acceptable. As the majority of produce carried should be presented to the vessel/container or trailer as precooled. The circulating cooling air should therefore only be required to remove respiratory heat of the produce and the heat exchanged via exterior surfaces. A high velocity of circulating air should be unnecessary and in fact undesirable. Cooling air in modern refrigerated vessels and containers is usually circulated vertically, from the deck/floor, upwards. The system is designed to produce equal air pressures over the full area of the cargo space. However, any elaborate arrangement for air distribution can be rendered useless if incorrect stowage of the produce eliminates or reduces efficient airflow which tends to follow the route of least resistance. The difficulties of ‘properly and carefully’ stowing packages of fresh produce have become more complex with the use of palletised units and pallet boxes/bins.
2.6 Air exchange During the carriage of fresh fruits and vegetables under ordinary conditions of
refrigeration accumulations of gases such as carbon dioxide (CO2) and ethylene (C2H4) will occur. Undesirable odours or volatiles may also contribute to off-flavours and hasten deterioration of the produce. These problems can be prevented by repeatedly refreshing the circulating air within the holds by admitting atmospheric air into the system. The introduced air entering at a point of lowest pressure within the
-59- II/2014
circulation and the polluted air exiting the system at a point of highest pressure, or alternatively by use of an auxiliary air system driven by separate fans.
2.7 Climacteric fruit and vegetables The climacteric is a stage of fruit ripening associated with increased ethylene
production and a rise in cellular respiration. Some varieties of fruit and vegetables have rates of respiration which do not decline during their ripening period – that is between maturation and the onset of senescence. Many fruits are climacteric, such as peach, apricot, banana, mango, papaya, avocado, plum, tomato and guava and tend to ripen rapidly during transit and storage. Examples of non-climacteric fruit and vegetables include cucumber, grape, lemon, lime, orange, temple fruit (satsuma, tangerine, mandarin) and strawberry.
2.8 Weight loss in transit Weight loss from harvested produce can be a major cause of deterioration during
transit and storage. Most fruit and vegetables contain between 80% and 95% of water by weight, some of which may be lost by transpiration (water loss from living tissue). To minimise loss of saleable produce weight and to preclude wilting and shrivelling, the produce must be maintained during transit at the recommended humidity and temperature. Whereas some weight loss will inevitably occur due to the loss of carbon during respiration, this will only be of relative minor proportions.
2.9 Supplements to refrigeration Opportunities have been tried and tested to slow down ripening after harvest and
thus extend the transit, storage and shelf life of fruit and vegetables – especially those in the climacteric category. This can be achieved with controlled atmosphere (CA) storage and carriage; modified atmosphere packaging (MAP), storage and carriage (MA); or alternatively with edible coatings.
Basically and in all cases the atmosphere created is one of low oxygen (O2) and high carbon dioxide (CO2 ) when compared to atmospheric air. The low oxygen and high level of CO2 depress the production of ethylene (C2 H4), a gas emitted in small quantities by plant tissues, which accelerates during the ripening process and in turn expedites the process itself in the form of a chain reaction, especially true in the case of bananas.
2.10 Crriage of mixed produce At times carriers are required to load and stow different produce in the same
vessel, hold, or cargo container. Should a mixture be necessary it is essential that the produce is compatible in respect of:

-60- II/2014
● Temperature ● Relative humidity ● Odour production ● Ethylene production.
Cross tainting should be avoided at all costs whereby strongly scented fruit and vegetables are stowed together. The many products which produce considerable ethylene naturally, including apples, avocados, bananas, pears, peaches, plums, melons and pineapples should not be stowed with or in adjacent compartments to kiwi fruit, water melons, lettuce, carrots etc. which can all be seriously affected by the ethylene.
One of the most commonly transported fruits are bananas. To carry this type of fruit is mainly used for road and maritime transport. Means of transport as containers, road trailers and boats.The article will be describe packaging, mode of transport and ripening of this type of fruits, because it is specify comodity.
3 Package, carriage and ripening of bananas
Banana is the most important perishable commodity in international trade. Cargoes of bananas are carried either in the holds of reefer (refrigerated) vessels or in refrigerated shipping containers, and a voyage may take a few days or several weeks. The period between harvesting of bananas and initiation of normal ripening, i.e., the duration of the pre-climacteric phase, is sometimes called ‘green-life’. The international banana trade is based on the harvesting and transportation of hard, green, unripe fruit, which is later ripened in the country of consumption. The aim of refrigerated carriage of bananas is to deliver fruit that is still in the preclimacteric state, so that the climacteric may subsequently be artificially induced, in a uniform and controlled manner, by injection of a measured quantity of manufactured ethylene into the commercial ripening room. In this way it is feasible, within limits, to release ripened fruit on to the market according to demand.
Most cargoes arrive in good condition, but occasionally some of the fruit ripens prematurely aboard ship, or suffers chilling injury, resulting in substantial losses and protracted litigation.
3.1 Preshipment factors Fruit characteristics may be influenced by temperature, rainfall, cloud cover and
so forth. These factors also determine the likelihood of disease.
Bananas must be cut at a maturity that will allow them, under normal transport conditions, to arrive at their destination (i.e., in the ripening room) before ripening has
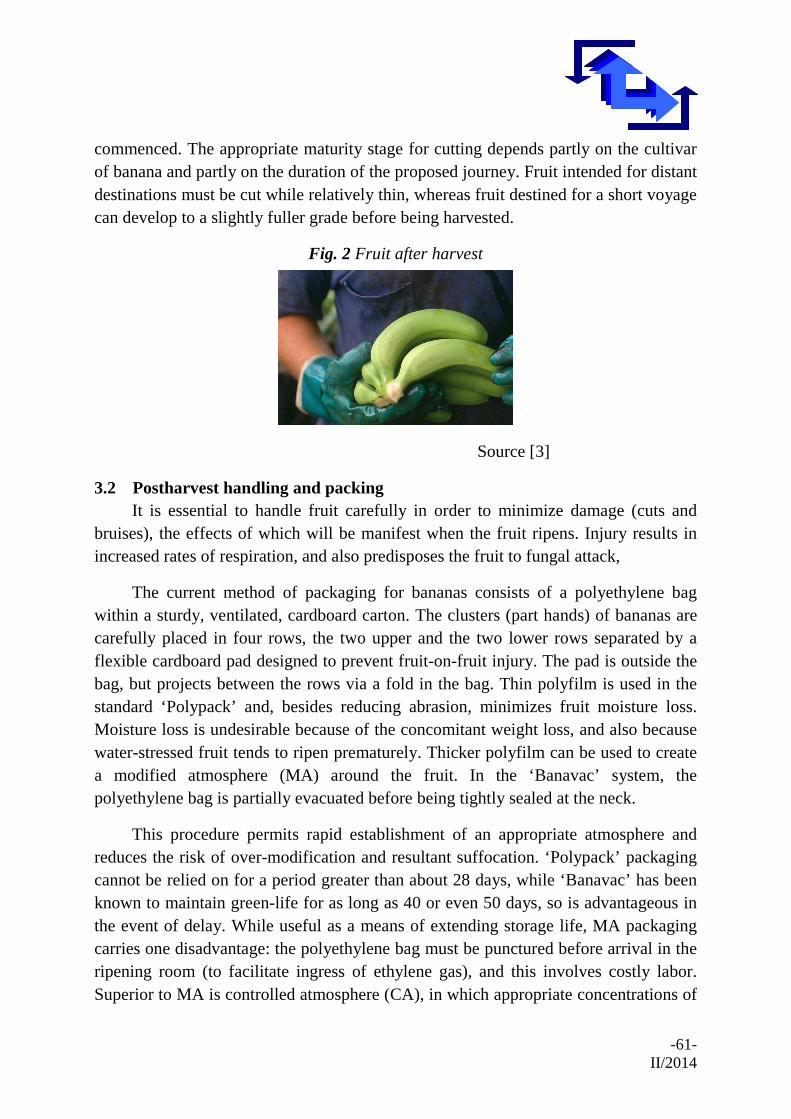
-61- II/2014
commenced. The appropriate maturity stage for cutting depends partly on the cultivar of banana and partly on the duration of the proposed journey. Fruit intended for distant destinations must be cut while relatively thin, whereas fruit destined for a short voyage can develop to a slightly fuller grade before being harvested.
Fig. 2 Fruit after harvest
Source [3]
3.2 Postharvest handling and packing It is essential to handle fruit carefully in order to minimize damage (cuts and
bruises), the effects of which will be manifest when the fruit ripens. Injury results in increased rates of respiration, and also predisposes the fruit to fungal attack,
The current method of packaging for bananas consists of a polyethylene bag within a sturdy, ventilated, cardboard carton. The clusters (part hands) of bananas are carefully placed in four rows, the two upper and the two lower rows separated by a flexible cardboard pad designed to prevent fruit-on-fruit injury. The pad is outside the bag, but projects between the rows via a fold in the bag. Thin polyfilm is used in the standard ‘Polypack’ and, besides reducing abrasion, minimizes fruit moisture loss. Moisture loss is undesirable because of the concomitant weight loss, and also because water-stressed fruit tends to ripen prematurely. Thicker polyfilm can be used to create a modified atmosphere (MA) around the fruit. In the ‘Banavac’ system, the polyethylene bag is partially evacuated before being tightly sealed at the neck.
This procedure permits rapid establishment of an appropriate atmosphere and reduces the risk of over-modification and resultant suffocation. ‘Polypack’ packaging cannot be relied on for a period greater than about 28 days, while ‘Banavac’ has been known to maintain green-life for as long as 40 or even 50 days, so is advantageous in the event of delay. While useful as a means of extending storage life, MA packaging carries one disadvantage: the polyethylene bag must be punctured before arrival in the ripening room (to facilitate ingress of ethylene gas), and this involves costly labor. Superior to MA is controlled atmosphere (CA), in which appropriate concentrations of

-62- II/2014
oxygen and carbon dioxide are accurately maintained within the hold space (by special apparatus), rather than approximately maintained within each package (by means of the fruit’s own respiration). For CA carriage, bananas must be packed in‘Polypack’. The cartons are provided with perforations to ensure a proper flow of cooling air around the bananas. The side faces each have four oblong perforations of 1.5 cm x 6 cm and the end faces each have a handle-type opening of 3.5 cm x 10 cm and a further two holes 3.5 cm in diameter.
Fig. 3 Type of boxes
a) Plan view b) side face c) End face Source [4]
In the box is saved in the 4 rows above each other, always two and two separate cartons. Shipment to the recipient shall be made in reefer maintaining the desired temperature.
Furthermore, these cartons stored on a pallet, which is on one pallet together 48 cartons (8 layers of 6 cartons in a single layer). Is used to transport non-returnable pallet with dimensions 1000 x 1200 mm. One box of bananas weighs about 20 kg in total, so one pallet has a gross weight of about 985 kg. Cartons on a pallet has been locked from the side edge of the cardboard and polypropylene tape.
Bananas should be stowed in refrigerated space preferably within 24 hours, certainly within 48 hours, of harvest; a common stipulation is that a period of 36 hours should not be exceeded. If bananas remain at high ambient temperature for longer than this, their green-life will be curtailed. Factors influencing the initiation of ripening include cultivar, growing conditions, age and grade at harvest, storage temperature and humidity after harvest, and the presence or absence of ethylene in the atmosphere. The following examples illustrate the time scales involved.
Since the onset of ripening is characterized by an increase in respiration (the climacteric rise), and since respiration involves the evolution of heat, the first obvious indication that ripening has begun may well be the increase in pulp temperature of the fruit. This is the reason for temperature checks at the time of loading; pulp temperatures above 32°C give cause for concern, and ‘hot fruit’, if detected, will be

-63- II/2014
refused for loading. If ripening fruit is inadvertently loaded it will complete the ripening process during the first few days of the voyage, and by the time of discharge, is likely to have become overripe, brown or black, even moldy and collapsed, depending on its initial state coupled with the environment and duration of the journey.
3.3 Carriage instructions In road vehicles carrying bananas from the plantations to the port are handled
using a pallet truck. For ships to which pallets loaded with bananas directly into the cell ships are loaded by crane located on the ship. Unloading port in Europe is conducted so that the palette of cells loaded on a ship deck, where workers loaded them in a cell using a pallet truck. Containers are unloaded from a ship using riverside gantry crane, or by crane located directly on the boat.
Shippers’ carriage instructions must take into account the cultivar, the weather during the growing season, the maturity of the fruit at harvest, and the expected duration of the voyage. Most usually, the recommended delivery air temperature (DAT) for bananas is in the region of 13.3°C.
Fig. 4 Refrigeration container
Source [6]
3.4 Shipboard factors
Refrigerating power The refrigerating plant must cool the warm fruit and also dissipate the heat
produced by continuous respiration of the bananas. The heat output of pre-climacteric bananas at different temperatures is given in round figures in Table 1. Once bananas have entered the climacteric phase their respiratory heat output may be three, four or even five times the quoted figures.

-64- II/2014
Air circulation system The first reefer vessels built specifically to carry bananas were generally
designed with a horizontal airflow because at that time bananas were transported ‘on the stem’, and such an airflow permitted effective air circulation through the bunches. With the advent of carton-packing in the 1960s, it became more appropriate to have a vertical system, the usual method being powerful underdeck air delivery and deckhead exhaust to force air upwards through the cargo.
Stowage In vessels with a powerful vertical airflow, a ‘solid stow’, without specific air
channels, is essential. Because the resistance of a tightly packed stack of cartons is much greater than that of the loosely stowed bunches of earlier times, it is important to take care when constructing a stow of cartons. They should be stowed in register, so that air can flow through the interstices between the cartons. Cartons should also be stowed as level as possible, so that airflow will be uniform. Furthermore, it is necessary to leave sufficient headspace above the stow for the passage of the return air. If cartons are palletized, it is even more important to take care with stowage, since air tends to take the line of least resistance through the spaces between the pallet loads [7-9].
Fig. 5 Special ship for transporting bananas
Source [6]
Ripening The banana ripening process has several parts. The first part is on the plant
(separated from plant), the second part is hormone controlled (with ethylene), third part is conversation starch to sugar and fourth part is process „from green to yellow“. In transport unit are green bananas and after unloading in recipient start second part of ripening proces. Four major factors used of ethylene gas, temperature control, relative humidity control and adequate air circulation. In ripening rooms used ethylene gas. This process is usually performed in specially ripening room. Banana fruits are exposed to the gas for about 24 hours. The room must be ari tight, adequate

-65- II/2014
refrigration, air circulated. The boxes of banans should be „air stacked“. That is, the boxes shoul dthe air to circulate among all the boxes.
Fig. 6 Ripening process of bananas
Source [4]
There are the most commonly ripening systems:
Fig. 5 Tarp
Source [4]
Fig. 6 Air bags (vertical air circulation)
Source [4]

-66- II/2014
Fig. 7 Horizontal air circulation
Source [4]
The ripening bananas is at the requiements of the final customer. Last shipment must be carried out under strict conditions. Observed to be the optimum temperature as well as during transport from the grower to the storer [8,9].
References
[1] UK P&I CLUB; Carefully to carry; Fresh fruits and vegetables (http://www.ukpandi.com/fileadmin/uploads/uk-pi/LP%20Documents/Carefully_to_Carry/Fresh%20fruit%20and%20vegetables.pdf)
[2] http://en.wikipedia.org/wiki/Climacteric_(botany)
[3] A.L.Snowdon; Wolfson College; University of Cambridge; Carriage of Bananas (Musa spp.) in Refrigerated Ships and Containers:Preshipment and Shipboard Factors Influencing Cargo Out-Turn Condition
[4] Interko B.V, The ripening of bananas
[5] Dr. Scot Nelson; University of Hawai; Banana ripening:Principles and practice
[6] http://www.africaexpressline.com/
[7] Kampf, R., Cejka, J., Stopka, O. Proposal of New System for Regular Public Transport, (2014). SYLWAN Journal. Vol. 158 (11). ISSN 0039-7660.
[8] STOPKA, O., KAMPF, R., KOLÁŘ, J., KUBASÁKOVÁ, I. Identification of Appropriate Methods for Allocation Tasks of Logistics Objects in a Certain Area. (2014). Our Sea, International Journal of Maritime Science & Technology, Vol. 61, No. 1-2, May 2014. ISSN: 0469-6255.
[9] Novotný J., Duspiva, P. Rozhodování manažera při uvolňování pracovníků z podniku. Acta academica karviniensia. Karviná, 2013. ISSN 1212-415X.

-67- II/2014
Resume
The most important factors in the transport of fruit and vegetables is proper storage of goods prior to shipment, maintenance of correct temperature throughout the period of transport. It is essential for the proper ripening of goods in the hold to maintain proper relative humidity, provide ventilation and extraction and air supply. One of the most frequently transported fruits are bananas. These are specific because they are harvested as green and during transport is the minimum allowable ripening process. This is the most common transport up and running in chambers. Ripening takes place in strict compliance with the conditions, especially temperature, amount of substance and maturing fruit that spends time in the chamber.
Key words
Fruit, bananas, ripening
Ing. Ľubor Rovňaník
Univerzity of Žilina
Faculty of Operation and Economics of Transport and Communications
Department of Road and Urban Transport
e-mail: [email protected]

-68- II/2014
PROCEDURE FOR PROCUREMENT OF PUBLIC PASSENGER TRANSPORT
Štefánia SEMANOVÁ, Lenka KOMAČKOVÁ
1 Introduction
Properly concluded contractual relationship allows the creation of a strong partnership through which public authorities can pursue their policy objectives. Such a partnership should prevent from neglecting fulfilment of the tasks or abusing position of one from parties. Majority of public passenger services cannot be provided on a commercial basis because they are unprofitable from the view of public service operators. Therefore, it is necessary to ensure financing transport services from public funds. However, the need for funding public passenger transport is constantly growing, and therefore, it is necessary to implement proper elements into contractual relationships. These elements should motivate the public service operators to efficient and economical provision of transport services.
The key factor for providing public transport services is an adequate regulatory framework and contracting conditions that should be set to support the competitive behaviour of bidders – service providers. The regulatory framework consists of three levels [3]:
• strategic (setting basic objectives to be achieved: transport policy, public budgets, intermodality, and etc.),
• tactical (emphasis mainly on design of services and fares, requirements for staff, vehicles, additional services),
• operational (ensuring the service provision in the market according to objectives: sale activities, information for the public, deployment of vehicles, maintenance).
2 Analysis of regulatory framework
Legal framework containing a set of rules, by which providing transport services and the procurement procedure of transport services are regulated, consists mainly of:

-69- II/2014
• Regulation (EC) No. 1370/2007 on public passenger transport services by rail and by road.
• Public Procurement Directives (Directive 2004/17/EC coordinating the procurement procedures of entities operating in the water, energy, transport and postal services sectors, and Directive 2004/18/EC on the coordination of procedures for the award of public works contracts, public supply contracts and public service contracts).
• National legislation. The basis for every procurement process, which is embedded in the above-
mentioned regulations, is non-discrimination, transparency, and equal treatment of all parties. Fig. 1 shows a process of identifying the procedure for awarding contracts.
Fig. 1 Procedure for awarding contracts in bus and tram transport
*Competitive tendering Source: Authors based on [9]
Basically, contracts dealing with public passenger transport by bus or tram fall under the regime of the Public Procurement Directives, when they are not a service concession. A concession, as defined by the Public Procurement Directives, being a contract where the consideration for the provision of services consists either solely in the right to exploit the service or in this right together with payment.
A substantial difference between the Regulation and Public Procurement Directives is that the directives process the procurement procedure more detailed whereas the regulation is related only to certain fundamental principles. However, EU
-70- II/2014
regulations are directly enforceable in the SR or other EU Member States. Directives are not compulsory for individuals or legal entities. Directives must be implemented into national regulations for their application in practice.
It should be also noted that a careful preparation must be preceded of any procurement process. The chosen procedure depends on local political, legal and financial conditions.
3 Process of public service procurement
The process of public service procurement is complex and consists of several procedural steps which must be done from public authorities’ position (see Fig. 2). The basis of each process should be sufficient preparation. Good preparation can bring quality in services provided and effective use of public funds. Therefore, this part of procurement process cannot be underestimated from the position of a public authority. In the first step, it is necessary to set the basic strategic objectives based on identified requirements of the public. Further, the services to be provided are characterized and designed. The services should be defined with respect to the criteria by which it will be possible to evaluate to what extent (range) a candidate (public service operator) is able to fulfill the provision of transport services. Last but not least, it is important to develop framework conditions of public service contract. Further step is related to award procedure which can represents the direct award of contract or a competitive tendering. In the last step, a public authority implements the control procedures during contractual period whether a service operator meets its obligations.
3.1 Identification of the objectives Identifying the needs of the public
The first essential step in the procurement is to determine the demand for public services – public passenger transport. Public service requirements can be found out by using different methods. One of the methods is an interview with passengers or potential passengers. The person responsible for obtaining information firstly selects a group of citizens who will be asked to answer simple questions. Ranking of requirements for public services in terms of quality and quantity is compiled at the end based on the answers.
Another method of identifying requirements of passengers is a form of questionnaire. The first step in creating a questionnaire is to determine the existing problem in public services. Information about the problem can be obtained based on written complaints or verbal manifestations of citizens. Further, it is necessary to

-71- II/2014
determine the objectives and indicators of questionnaire and to select a group of people to be queried. The advantage of questionnaires is fast obtaining the information in a short time and at relatively low costs. The questionnaires are sent directly to citizens or may be in the form of anonymous questionnaires.
By gathering information on requirements for public services, the strategic objectives can be determined.
Fig. 2 Procedure of public authority while contracting
Source: Authors based on [9],[11]

-72- II/2014
Identifying the strategic objectives
The transport policy addresses public passenger transport and its objective is to ensure the sustainable development of mobility, coordination of public passenger transport with individual transport and improvement of road safety. Regarding the provision of public passenger transport, it is also necessary to take into account other policies such as social, environmental policy, and etc.
Analysis of local constraints
To be able to properly transform strategic objectives into tactical means (service concepts), the relevant local circumstances (constraints) have to be identified and taken into account. Numerous aspects, tasks and competencies can have an impact on public transport.
Firstly, it is appropriate to analyse the local organisation of a concerned territory and to gain a good overview of the current distribution of tasks, competencies and responsibilities between the operators and the public authorities. Some further aspects to analyse are legal and economic aspects and the existing market structure as well as the existing transport system and geographical aspects.
3.2 Determination of characteristics and requirements for services The further step prior the conclusion of public service contract is a
characterization of services and definition of requirements for services. It is also necessary to divide the tasks, competencies and responsibilities between the operators and the public authorities in order to ensure efficient provision of public service.
Determination of technical specifications (conditions)
Technical specifications and conditions are understood to be the determination of characteristics and requirements which must be fulfilled in the bids submitted by tenderers in order to obtain a contract. Technical conditions are part of the tender documentation. Technical conditions may be determined either by the form of references to the documents, standards, regulations, and acts or by the form of requirements for parameters of expected utility, e.g. setting requirements for performance, capacity, and etc.
Individual characteristics and requirements for services must be set so that none of the tenderers and candidates is discriminated and the principles of transparency, economy and efficiency must be applied.
Identifying the objectives of contract

-73- II/2014
The objectives should not be specified too general. It is favourable if the concretization of subject of the contract in the form of objectives is a part of tender documentation. This can contributes to the improvement of evaluation process, award procedure as well as control process. Correct determination of objectives is an assumption for easier definition of evaluation criteria. Requirements for the characteristics of objectives are presented in Tab. 1.
Tab. 1 Requirements for the characteristics of objectives
Characteristic of objectives Description Example
verifiability an objective can be
verified technical parameters
quantifiability an objective can be
measured
number of kilometres travelled, hours of
operation
objectivity an objective relates directly to the purpose of contract
quality of the carriage of passengers
consistency mutual continuity of
objectives
reduction the transport impact on the
environment by promoting public
transport Source: Authors based on [11]
3.3 Choice of evaluation criteria A public authority must determine evaluation criteria which reflect the
expectations that are to be achieved through public transport services. The evaluation criteria can be distinguished in terms of type and kind. Individual types and kinds of evaluation criteria with stated examples are presented in Tab. 2.

-74- II/2014
Tab. 2 Types and kinds of evaluation criteria
Types of evaluation criteria
Kinds of evaluation criteria
Examples
quantitative
cost
the lowest offer price repairs and
maintenance operating costs
return on investment
utility
technical level
technical parameters
environmental impact
time
interchanges
continuity
time of transport
qualitative quality safety and comfort
caring for passenger
Source: Authors based on [11,12]
In order to determine to what extent the feature of quality is fulfilled, it is necessary to find a way to measure particular feature of quality. Transformation of qualitative criteria into quantitative criteria is performed due to the measurability of quantitative criteria. The intensity of quality can be measured, for example, by using ten-point scale. Interval of scoring is compiled from the unsatisfactory quality up to the perfectly satisfactory quality.
3.4 Preparation of contract Basically, the forms of individual contracts differ in an allocation of risks
between contractual parties and the resulting structure of payments.
The contract forms are as follows (Fig. 3):
• management contract,
• gross cost contract,
• net cost contract.

-75- II/2014
Fig. 3 Different contract forms depending on the risk allocation
Source: Authors based on [9]
The essential advantages and disadvantages of gross and net cost contracts are presented in Tab. 3.
Scope of contract
In terms of the scope of the contract, a public authority can decide on:
• route contracts – used for a specific bus line or can include a group of shorter bus lines located close to each other,
• network contracts – these contracts cover whole city territory and network of city public transport or they are related to more transport modes such as metro, bus, and tram,
• sub-network contracts – related only to a certain part of city (e.g. suburb of city) and only one mode of transport.

-76- II/2014
Tab. 3 Advantages and disadvantages of gross and net cost contracts
Advantages Disadvantages
Gross cost
contract
• reliable calculation for operator,
• low barriers for market entry, • high legal certainty, • enforcement of public interests
(e.g. tariffs), • competition neutrality.
• no entrepreneurial interest, • high level of regulation, • no budget reliability for public
authorities, • high monitoring efforts.
Net cost contract
• preservation of entrepreneurial interest,
• lower monitoring charges – customer as “adjustment factor”,
• constant amount of compensation payments,
• minimal requirements have to be defined.
• low legal certainty (in case of tendering because of missing database),
• higher risk for operators – risk premium and higher compensation payments
• no incentives to consider social, environmental and political goals.
Source: Authors
Duration of contractual period
Period for which it is possible to conclude public service contract is limited by Regulation (EC) No. 1370/2007 in its Article 4.3 and 4.4.
When designing the length of contract period the public authority should takes into account the level of revenue risk borne by the operator in order to allow him to develop market activities for increasing the number of passengers.
Payment structure
Payments to operators could be fixed, variable or a combination of both. Authorities should determine a clear and verifiable payment structure to avoid disputes during the contract period. Please note that it is recommended to separate financing of infrastructure from financing of operations for transparency reasons.
3.5 The award of contract When deciding about award procedure, the regulatory framework which was
analyzed in Chapter 2 of this paper must be taken into account. Basic principles in procurement are non-discrimination, proportionality, transparency and equal treatment. A contract can be awarded directly or through a competitive tendering process.

-77- II/2014
3.6 Control and monitoring Control of compliance with obligations can be done through the use of self-
fulfilling contractual features such as incentives or by monitoring systems (classical control of services provided).
Incentives can be used to utilise the profit maximising aims of operators to achieve the policy aims of the authority instead of just writing down rules and prohibitions into the contract, as these need to be thoroughly monitored by the authority to be effective. They might be used to compensate for reduced or difficult monitoring to create self-fulfilling contractual features. They are an instrument to secure the quality level.
Monitoring, controlling and supervision of the service delivered by the operator might be an alternative or a complement to the incentive instruments already selected. During the contract period the authority will have to verify, whether the operator respects the conditions of the contract he has agreed upon.
4 Experience of procurement procedure in providing transport services abroad
Various methods of contracting exist in practice of providing public transport services. Tab. 4 summarizes the contracts commonly used for providing transport service abroad. The most used award procedure is a competitive tendering which often brought costs savings for public authorities. But in some cases, also the direct award, negotiation with previous service provider, and competitive tendering with pre-selection are used. In terms of a contract scope, the most frequently concluded contract is a network contract. By using this type of contract, public authorities often pursue promotion of the integration of transport systems. The commonly used contracts are gross cost contract and net cost contracts. Management contracts are less used and they can be seen, for example, in France. In general, the contracts incorporate several type of incentives, for example, quality and passenger incentives. Public authorities can pursue their political objectives through introduction of incentives into contract, for example, increase in transported passengers, improvement in service quality, promotion of public passenger transport against to individual motoring, the environmental protection, improving city life. The most frequent contractual period is 5 years. In the case of rail passenger transport, this period can be longer, for example, 14 years for city of Krakow. In many cases, the extension of contractual period based on satisfying performance of contracts is a part of public service contracts [12-14].

-78- II/2014
Tab. 4 Experience of contracts commonly used for providing transport service abroad
grosscost
netcost
route or bundle of routes
network quality passengersenviron.
protectionrealised
km
Budapest * x x 8
Dublin x x 5+5 x
Brussels * x x 5 x
Amsterdam * x x 5
Haarlem x x 2 x x
Grenland x 5 x x
Stockholm x x 5+5 x
Halmstad x x 8 x
Sundsvall x x 6 x
Elmshorn x x 5 x
Frankfurt/M x x 6 x x
Munich x x 6-7
Warsaw x x 10
Krakow * x x 8/14
London x x 5+2 x
Manchester x x 5
Adelaide x x 5+5 x
City
Incentives for:Contract with: Contract for:Contract period (years)
*the direct award of contract
Source: Authors based on [9]
5 Conclusion
The need for funding public passenger transport is constantly growing and demand for public transport is decreasing. Therefore, it is necessary to implement proper elements into contractual relationships. The process of public service procurement is very complex and consists of several procedural steps. The basis of each process should be sufficient preparation. Only good preparation can bring quality in services provided and effective use of public funds. Preparation of procurement process cannot be underestimated from the position of public authorities, because a properly concluded contractual relationship can prevent from neglecting fulfilment of the tasks or abusing position of one from parties.
This paper was developed under the support of project: MŠVVŠ SR - VEGA č. 1/0320/14 POLIAK, M.: Zvyšovanie bezpečnosti cestnej dopravy prostredníctvom
podpory hromadnej prepravy cestujúcich.

-79- II/2014
References
[1] BRAY, D. – WALLIS, I.: Adelaide bus service refrom: Impacts, achievements and lessons, Research in Transportation Economics 22, 2008, s. 126-136
[2] HENSHER, D. A. – WALLIS, I. P.: Competitive Tendering as a Contracting Mechanism for Subsidising Transport, Journal of Transport Economics and Policy, Vol. 39, Part 3, 2005, ISSN 0022-5258, s. 295-321
[3] MACÁRIO, R.: Managing and Assessing Regulatory Evaluation in Local Public Transport Operations in Europe, paper presented at the 7th International Conference on Competition and Ownership of Land Passenger Transpor, Molde, Norway, June.
[4] Nariadenie Európskeho parlamentu a Rady (ES) č. 1370/2007 o službách vo verejnom záujme v železničnej a cestnej osobnej doprave, ktorým sa zrušujú nariadenia Rady (EHS) č. 1191/69 a (EHS) č. 1107/70
[5] POLIAK, M. – KONEČNÝ. V.: Trh hromadnej osobnej dopravy a jej financovanie. 1. vyd. Žilina : Žilinská univerzita v Žiline, 2009, 176 s. ISBN 978-80-8070-999-0
[6] POLIAK, M. – SEMANOVÁ, Š. – KILIANOVÁ, K.: The risk analysis in public passenger transport, Transport and Communications - scientific journal, Vol. 1, 2013, ISSN 1336-7676, s. 21-24
[7] SEMANOVÁ, Š. – POLIAK, M.: The impact of competitive tendering on the costs of competent authorities related to service provision, TRANSCOM 2013 : 10-th European conference of young research and scientific workers: Žilina, June 24-26, 2013, Slovak Republic. - Žilina: University of Žilina, 2013. ISBN 978-80-554-0691-6. - S. 201-204
[8] SEMANOVÁ, Š.: Risk management in providing transport services by public passenger transport, Logistika – Ekonomika – Prax: 2. ročník medzinárodnej vedeckej konferencie: Žilina, 26. november 2013, Slovenská republika. ISSN 1336-5851, s. 114-119
[9] STANLEY, J. – VAN DE VELDE, D.: Risk and Reward in Public Transport Contracting, Research in Transport Economics, 22, č. 1, 2008, s. 20 – 25
[10] VAN DE VELDE, D. – BECK, A. – VAN ELBURG, J. – TERSCHUREN, K.: Contracting in Urban Public Transport. Amsterdam: European Commission, 123 s.
[11] OCHRANA, F.: Zadávání, hodnocení a kontrola veřejných zakázek. 1. vyd. Praha : Ekopress nakladatelství, s.r.o., 2008, 153 s. ISBN 978-80-86929-46-0.
[12] STOPKA, O., KAMPF, R., KOLÁŘ, J., KUBASÁKOVÁ, I., SAVAGE, CH. Draft guidelines for the allocation of public logistics centres of international importance, (2014), Communications, Vol. 16 (2), pp. 14 – 19, ISSN 1335-4205.
[13] Novotný, J., Duspiva, P. Faktory ovlivňující kupní chování spotřebitelů a jejich význam pro podniky. Vědecký ekonomický časopis E+M. Liberec, 2014, s. 152 – 166. ISSN 1212-3609.
-80- II/2014
[14] KAMPF, R., GAŠPARÍK, J., KUDLÁČKOVÁ, N. Application of different forms of transport in relation to the process of transport user value creation. (2012). Periodica Polytechnica Transportation Engineering 40 (2) pp. 71 - 75 , ISSN: 0303-7800.
Resume
The paper deals with procedure for procurement of public passenger transport. The first part of the paper analyses regulatory framework that contains a set of rules which regulate providing of transport services and procurement procedure for transport services. Next part describes in detail individual steps that should be done in procurement process for ensuring service quality of public transport in an effective manner. The last part summarizes the contracts commonly used for providing transport service abroad.
Key words
procurement, process, public, passenger, transport
Ing. Štefánia Semanová
University of Žilina
Faculty of Operation and Economics of Transport and Communications
Department of Road and Urban Transport
e-mail: [email protected]
Ing. Lenka Komačková
University of Žilina
Faculty of Operation and Economics of Transport and Communications
Department of Road and Urban Transport
e-mail: [email protected]

-81- II/2014
EVALUATION OF A TRANSPORT COMPANY
Anna SIEKELOVÁ, Viera BERZÁKOVÁ
1 Introduction
The history of the property valuation goes back to the 30s of the last century. Each measurement standard had been evolved in individual states during the 60s and 70s. As a result of globalization it was necessary to harmonize these standards. In 1981was officially formed The International Assets Valuation Standards Committee (TIAVSC) and later, in the early 1990’s, was the committee renamed as the International Valuation Standards Committee (IVSC). The Committee gathers the professional valuation associations all around the world.
Evaluation can be characterized as an economic act establishing the value of the company. There is constantly increasing importance of valuation in corporate practice as well as the rate of application. Process of evaluating of the company gains more and more attention of economic public and the experts are still developing and improving the methods. Methods of business evaluation serve for detecting the market value of the company. There are various purposes of determining the market value of the company and being based on the purpose it is possible to establish an adequate manner and scope of the chosen method. There are following purposes of assessing, which mean that the need of evaluation of the enterprise or part thereof arises in the in certain situations, for example:
• purchase and sale of the business or assets of the enterprise,
• cash and in-kind contribution to the company,
• entry of foreign capital,
• contributions of businesses in newly founded company,
• increasing capital of an undertaking,
• transformation of the company,
• merger of enterprises,
• credit operations,
• assessment of expected revenues from business activities for the purpose of developing a business plan,
• putting a company on financial markets (stock),

-82- II/2014
• determine the creditworthiness of the company, solvency,
• internal audit,
• disposal, remediation of business, insolvency and restructuring business,
• succession and other settlement of members,
• because of the insurance company,
• to determine the success rate of the company management,
• other reasons.
The procedure of corporate evaluating obviously needs to be modified according to specific conditions in the company, especially under the purpose of assessing, categories of observed values, selected methods and availability of data. On the other hand there is a great part of evaluating that depends on subjective perspective of evaluator, for example because of the important factors of evaluating – time factor and the risk – the core items affecting the results. That means that every evaluator determines the result value of the company or part thereof in a different way and evaluating itself is always demanding. The company creates the value only if it has a competitive strength and it dispose with some significant competitive advantage.
2 Evaluation methods
Legislation valid in the Slovak republic provides just certain limited methods of valuating:
• equity method,
• business method,
• combined method,
• liquidation method,
• and comparative method.
We also know many other methods from the corporate finance theory and the most common are those ones based on the assessment of income. Choice of method is an important step but all these methods are usually used in the combination.
3 The process of evaluation of a company
The issue of evaluating enters into all areas of corporate activity, not excluding transport companies. Under the term of transport can be understood an organized economy activity providing transport of persons, goods and things. The majority

-83- II/2014
component of tangible assets in the case of enterprises engaged in transport activities are usually the vehicles with high book value shown in the balance sheet.
Literature [1] recommends use the following steps by the valuating process:
1. Collecting of input data 2. Data analysis
a) Strategic analysis b) Financial analysis for detection of financial health of the company c) Distribution of assets on operationally necessary and unnecessary d) Analysis and forecast of value generators e) Approximate valuation based on value generators
3. Financial Plan 4. Evaluation itself
a) Choice of method b) Evaluation of a company based on selected methods c) Summary of evaluation
Evaluation by synergy of used methods is the most difficult part of valuating process. It actually means that there are used more evaluating methods at the time, so that the explanatory power of the results is improved. Each method must be assigned with a function and weight, leading to a single final value. Experience has also proven that an incorrect assessment can be one of main reasons of failure of an acquisition projects.
For assessing business performance is increasingly used method of economic value (EVA). EVA indicator represents an essential criterion which provides valuable information for many areas of business management. In summary EVA quantifies the value added to the operational activities of the company during the period. Indicator of economic value added can then be understood as net income from operating activities reduced by cost of capital.
Practical example of calculating EVA, Equity evaluation of the transport company encluded:
All provided information:
We assume that the company has just an operating activities and just interest-bearing capital. Determined economic result is already adjusted to the required form, balance sheet items are stable and profits will be achieved indefinitely. Another

-84- II/2014
assumption is the value of debt/capital ratio equals 75 %. All numbers are in millions of euro.
Tab. 1 Input data for EVA caltulation
Equity (book value attributed to the operating activities) (E)
30
Debt (interest-bearing capital) (D) 90
Net operating assets (NOA) 120
Operating economic result 25
Interest expenses 5
Economic result from ordinary activities
20
Cost of equity (Re) 18 %
Cost of debt (Rd) 8 %
Income tax rate (t) 20 %
Source: own processing
First of all we need to calculate Economic value added:
EVA = NOPAT – NOA * WACC (1)
NOPAT = Operating economic result * (1 - Income tax rate) = 25 * (1 – 0.2) = 20 (2)
(3)
(4)
EVA = 20 – 0,093 * 120 = 8.84 (5)
Next use of the EVA result can be an evaluation of the company through MVA:
Value of equity = NOA + MVA – D (6)
(7)
Market value of operating assets = NOA + MVA = 120 + 95.05 = 215.05 (8)

-85- II/2014
Value of equity = 215.05 – 90 = 125.05 (9)
We have just determined the value of equity of the transport company that equals 125 050 000 €.
Note: MVA
The issue of EVA is frequently (almost always) explained with so called MVA – market value added, which makes simpler to understand both of these categories and connection between them.
4 Conclusion
Corporate practice is located in a quick developing environment which requires a change in the attitude of management towards evaluating of a company and methods used in it. Business owners and managers must have some vision of the company in the future and the basic assumption for it is to find out how good runs the company now and what is its actual value. After achieving specific results comes next important part of management – management of an enterprise value – and if it will be done the right way it would lead to substantial improvements in their performance.
The paper is an output of Majerčák, P. a kol.: Projekt VEGA 1/0931/12 Uplatnenie teórie obmedzenia (TOC) v logistickom riadení výroby podniku.
References
[1] MAŽÍK, M. A KOL.: Metody oceňování podniku. Ekopress: 2011. ISBN 9788086929675
[2] MAŽÍK, M. – MAŽÍKOVÁ, P.: Moderní metody hodnocení výkonnosti a oceňování podniku. Ekopress: 2005. ISBN 8086119610
[3] MAŽÍK, M.: Metody oceňování podniku pro pokročilé. Ekopress: 2011, ISBN 9788086929804
[4] CISKO, Š. – KLIEŠTIK, T. : Finančný manažment podniku I. EDIS: 2009. ISBN 9788055400761
[5] CISKO, Š. – KLIEŠTIK, T. : Finančný manažment podniku II. EDIS: 2013. ISBN 9788055406848
[6] KISLINGEROVÁ, E. – HNILICA, J.: Finanční analýza – krok za krokem. C. H. Beck: 2005. ISBN 8071793213.
[7] MOYER, R. CH. – MCGUIGAN J. R. – KRETLOW W.: Contemporary Financial Management. SouthWestern: 2005. ISBN 9780324289084

-86- II/2014
Resume
Related issue of increasing intensity in transport becomes to be more significant in the time of ever-growing global economy. Activity of transport enterprises allows connection between production and consumption. In different stages of the business life cycle leads to situations where not only the management but also external users need to know the value of a company. There are a wide range of well-known methodologies to determine the market value of the company that can be applied in practice. The main aim of this paper is to determine the value of the transport enterprise based on the data sheet using the method of economic value added.
Key words
Value of the company, transport enterprise, methods of evaluating, economic value added
Ing. Viera Berzáková
University of Žilina
Faculty of Operation and Economics of Transport and Communications
Departement of Economics
e-mail: [email protected]
Ing. Anna Siekelová
University of Žilina
Faculty of Operation and Economics of Transport and Communications
Departement of Economics
e-mail: [email protected]
Ing. Peter Majerčák, PhD.
University of Žilina
Faculty of Operation and Economics of Transport and Communications
Departement of Economics
e-mail: [email protected]
-87- II/2014
KEY PERFORMANCE INDICATORS IN LOGISTICS AND ROAD TRANSPORT
Ivana ŠIMKOVÁ, Vladimír KONEČNÝ
1 Introduction
There are many different Key Performance Indicators (KPIs) that can be used to measure the performance in a road transport and logistics and it can be difficult to know which ones might be right for enterprises. A KPI should be relevant and SMART - Specific, Measurable, Achievable, Realistic and Timed, as well.
KPIs should be specific, simple to use and easy to understand. Complicated statistics and formulae can lead to the confusion and uncertainty about what is actually being measured in the first place. If KPIs are specific and kept simple, they can be easily communicated across the business and there is no need for staff to have an in - depth knowledge of the area being measured.
KPIs can show changes in performance over time. For this to happen, it is inevitable to compare like – with – like data. It is easy to fall into the trap of comparing two drivers on different routes for time utilisation or km per litre. If one route is more demanding than the other, this could be misleading. Similarly, comparing the drivers when they drive vehicles of substantially different age or vehicle type can also be deceptive. However, there are ways that you can get around these problems, such as rotating drivers onto different vehicles and different routes and then monitoring both drivers and vehicle performance, to spot consistently high and poor performers.
The frequency of monitoring is an important consideration. Weekly or monthly monitoring is recommended for many KPIs but this can depend on the measure and the needs of a particular enterprise. If certain measures are not recorded and presented to the agreed timescales, the risk of changes in performance going unnoticed rises.
The size, type and management structure of a company is likely to influence the range and type of KPIs that might be used. KPIs can be used to help managers develop strategy, plan and make decisions, while at the operational level they can show clearly the areas that need improvement, or a change in approach. [4]

-88- II/2014
2 Logistics Performance Index (LPI)
The Logistics Performance Index is based on a worldwide survey of operators on the ground (global freight forwarders and express carriers), providing feedback on the logistics “friendliness” of the countries in which they operate and those with which they trade. They combine in-depth knowledge of the countries in which they operate with informed qualitative assessments of other countries with which they trade, and experience of global logistics environment.
The LPI measures on-the-ground trade logistics performance – year 2012, in 155 countries - helping national leaders, key policymakers, and private sector traders understand the challenges they and their trading partners face in reducing logistical barriers to international commerce.
World Bank conducts the LPI Survey every two years to improve the reliability of the indicators and to build a dataset comparable across countries and over time.
A multidimensional assessment of logistics performance, the LPI compares the trade logistics profiles of 155 countries and rates them on a scale of 1 (worst) to 5 (best). The ratings are based on 6,000 individual country assessments by nearly 1,000 international freight forwarders, who rated the eight foreign countries their company serves most frequently.
The LPI’s six components include:
• The efficiency of the clearance process (speed, simplicity, and predictability of formalities) by border control agencies, including customs.
• The quality of trade - and transport-related infrastructure (ports, railroads, roads, information technology).
• The ease of arranging competitively priced shipments,
• The competence and quality of logistics services (transport operators, customs brokers).
• The ability to track and trace consignments.
• The frequency with which shipments reach the consignee within the scheduled or expected delivery time.
The components were chosen based on recent theoretical and empirical research and on the practical experience of logistics professionals involved in international freight forwarding. Earlier methodologies developed in 1993 used a survey format, a 2 - point scale, and open-ended questions — to measure the perceived importance and

-89- II/2014
influence of different component attributes affecting the logistical friendliness of countries.
The methodology was refined with contributions from interviews conducted for the Trade and Transport Facilitation Audits performed by the World Bank and others over more than a decade. The figure 1 maps the six LPI indicators in two main categories:
• Areas for policy regulation, indicating main inputs to the supply chain (customs, infrastructure, and services).
• Supply chain performance outcomes (corresponding to LPI indicators of time, cost, and reliability — timeliness, international shipments, and tracking and tracing).
Fig. 1 Input and outcome LPI indicators
Source: [5]
The LPI uses standard statistical techniques to aggregate the data into a single indicator. This single indicator can be used to compare countries, regions, and income groups. It can also be used for country-level work.
Supply chain service
delivery
Customs
Infrastructure
Services quality
Timeliness
International Shipments
Tracking and tracing
Area for policy
regulations (inputs)
Service delivery
performance outcomes Time, cost

-90- II/2014
3 Transport Performance Index (TPI)
The performance of road freight transport may be established through TPIs. The starting point for any performance improvement program should be to understand the current performance of the operation. This means to collect the data on key aspects of the operation, and turn this information into specific measures that can help to identify fields for improvement - for instance, how much it costs to deliver the products to the customers, how many kilometres the vehicles run empty or the number of late deliveries are made. These measures are known as key performance indicators or TPIs.
The transport TPIs are designed to be relevant and appropriate to small and medium – sized operations and focus on the most important aspects of the vehicle operation. The TPIs cover six core areas:
• Costs - It can be useful to understand how overall business revenues or business volumes change but also how revenue from different parts of your business fair relative to one another. Measures under this area could be average cost per unit delivered or average driver costs per kilometers.
• Operational - Fuel represents around 30% of costs in the majority of transport operations. Measuring and monitoring fuel consumption is vital, as well as average miles per gallon, average vehicle fill and average time utilization may be measured. Planning efficiency could be measured by vehicle fill, driver utilization, levels of empty running and kilometers per drop.
• Service - Knowing how operational performance impacts on customer service can dramatically influence your actions, measures can include number of late deliveries, percentage of product damage and the number of customer complaints.
• Compliance - Achieving high standards of compliance is a prerequisite to operating an efficient vehicle fleet with measures such as number of overloads, vehicle traffic infringements and number of accidents.
• Maintenance - Maintenance performance is also important, and the fleet maintenance manager might want to look at defect report completion and rectification, tire wear and replacement rates, volume of breakdowns and MOT pass rates.
• Environmental.
There were found three studies abroad that estimated TPIs in freight transport area from Great Britain. The TPIs were compared and made intersection of all the TPIs, plus indicators of customers were added and some more indicators that are known.

-91- II/2014
Selection of the most important TPIs in road transport
For the purpose of selection of the most important TPIs, the questionnaire was created. The questionnaire included indicators of performance that are measurable at present. The respondents had to rate TPIs importance, which indicators are the most important for measurement of performance (scale: 0 - insignificant, 1 - the least important, 5 - the most important).
The indicators that was measured:
• Average fuel efficiency,
• total empty run,
• average costs per unit delivered,
• transport Performance [tons/ km],
• average running cost,
• average standing cost,
• number of orders,
• total number of km run by your fleet,
• percentage empty running total (Percentage of distance run by your fleet without a payload)
• new customers,
• number of transportation with payload / total number of transportation,
• average driver cost,
• average cost of removing faults,
• average cost of fees,
• total number of traffic accidents,
• total number of overloads,
• improper fixation of load,
• simpler/clearer documentation,
• number of infringements of social legislation,
• percentage of failed or overdue safety inspections for you fleet,
• total number of vehicle traffic infringements,
• number of damages on transported goods,
• timeliness,
• number of satisfied customers,
• number of complaints,
• safeness of work.

-92- II/2014
The questionnaire was sent to companies, which have certificate EN ISO 9001. There was a problem with definition of customer sample. In the Slovak Republic, list of freight road transport companies does not exist. Ministry of Transportation, Construction and Regional Development of the Slovak Republic (MDVRR) made electronic database of companies in road transport available. The name of database is European Register of Road Transport Undertakings (ERRU) and through the database, it is possible to find a transport company by name or identification number of organization.
Based on ERRU, association of road transport operators of the Slovak Republic (ČESMAD) and European databank more than 1 000 road transport companies were checked. The results showed that only 55 companies had valid certificate EN ISO 9001 till the end of July 2014.
The minimum sample was determined with help of "Sample size calculator". Where the confidence level was 95 %, confidence interval was 5% and population was 48; the result of those parameters is that 48 samples are needed but up to September 2014 only 19 companies filled the questionnaire.
The survey was attended in total 20 organizations:
• 0 micro companies (up to 19 employees),
• 6 small companies (from 20 up to 49 employees),
• 12 medium companies (from 50 up to 249 employees),
• 1 big company (more than 250 employees).
The average values of statistical data were calculated on the basis of the arithmetic average by formula 1 for each type of companies.
(1)
where n ............ number of items
xi ............ value of i- item
............ arithmetic average of items
The results of survey in road transport companies are shown in figure. 2 - 3.

-93- II/2014
Fig. 2 The average results of survey from all companies
Source: Processing of author based on data PPZ SR
Fig. 3 The average results of survey by each size of company
Source: Processing of author based on data PPZ SR
The average results of survey from all companies showed that the most important TPIs are number of satisfied customers, number of orders, new customers and timeliness.
As it is shown in figure 3, the importance of TPIs is different in small, medium and big companies. In small companies the most important TPIs are: timeless, average fuel
-94- II/2014
efficiency, total empty run, average costs per unit delivered and number of satisfied customers.
In medium companies the most important TPIs are: number of satisfied customers, number of orders, new customers, number of complaints and average running cost.
The results of big companies are not objective because there is result only from one company, for this reason any objective conclusion can be said.
4 Conclusion
TPIs covers a range of indicators designed to give operators a consistent basis from which to measure their performance and they are good tools to monitor performance of fleet of transport companies. The company can see the value of each TPIs and it can identify strengths and weaknesses of company.
Once the company implements TPI, it will be the tool automatically produces a number of weekly, monthly and annual reports. The weekly report gives a simple overview of the fleet’s activities in terms of operations and costs. The monthly report provides more detailed information on the performance of the fleet and also details individual performance on a range of compliance TPIs (e.g. vehicle infringements and maintenance).
The annual report builds as the year progresses and gives information on operational performance, operating costs and customer satisfaction. The report shows a cumulative figure for the year (year to date), which is presented as either a total or average, according to the performance measure. Each vehicles level of activity, operating costs, number of complaints is presented and compliance information aggregated.
Further research will develop a vehicle check sheet based on the inputs required for the TPIs to be calculated; a method how to go about inputting and collecting data, which has enabled the company to monitor and measure performance effectively on a daily and weekly basis.
This paper has been developed under support of project: MS SR VEGA No. 1/0320/14 POLIAK, M.: Increasing of road safety through support of public transport
References
[1] http://web.worldbank.org/WBSITE/EXTERNAL/TOPICS/TRADE/0,,contentMDK:23196552~pagePK:148956~theSitePK:239071,00.
[2] http://www.sciencedirect.com/science/article/pii/S0019850197000783

-95- II/2014
[3] Bowersox, D. J., and Closs, D. J.: Logistical Management, the Integrated Supply Chain Process. McGraw-Hill, New York, 1996.
[4] Freight Best Practice - Safety in Freight Transport Operations. Department of Transport - UK. March 2011. Available at: www.businesslink.gov.uk/freightbestpractice.
[5] Connecting to Compete 2012 Trade Logistics in the Global Economy, The International Bank for Reconstruction and Development/The World Bank 1818 H Street NW Washington, DC 20433
[6] http://web.worldbank.org/WBSITE/EXTERNAL/TOPICS/TRADE/0,,contentMDK:23196552~pagePK:148956~theSitePK:239071,00.html
[7] Šimková, I. & Konečný, V. The Evaluation of Services Quality Forwarding. Perner´s Contacts. 2013. Vol. 8. No. 4. P. 76-85. Available at: http://pernerscontacts.upce.cz/33_2013/Simkova.pdf.
[8] http://tfig.unece.org/contents/logistic-performance-index.htm
[9] Šimková, I. & Konečný, V. The Issue of Measurement the Impacts of Quality on the Performance. In: Development of Automotive Engineering and Safety AES PROGRESS. Warsaw. 2014.
[10] http://web.worldbank.org/WBSITE/EXTERNAL/TOPICS/TRADE/0,,contentMDK:23196552~pagePK:148956~theSitePK:239071,00.
[11] http://www.sciencedirect.com/science/article/pii/S0019850197000783
[12] STOPKA, O., KAMPF, R., KOLÁŘ, J., KUBASÁKOVÁ, I. Identification of Appropriate Methods for Allocation Tasks of Logistics Objects in a Certain Area. (2014). Our Sea, International Journal of Maritime Science & Technology, Vol. 61, No.1-2, May 2014. ISSN: 0469-6255.
[13] Bowersox, D. J., and Closs, D. J.: Logistical Management, the Integrated Supply Chain Process. McGraw-Hill, New York, 1996.
[14] Šimková, I. & Konečný, V. The Evaluation of Services Quality in Road Freight Transport and Forwarding. In: Transcom 2013 - 10th European Conference of Young Researchers and Scientists. Zilina. 2013.
[15] KUBASÁKOVÁ, I., KAMPF, R., STOPKA, O. Logistics information and communication technology. (2014). Communications. Vol. 16 (2). pp. 9 – 13, ISSN: 1335-4205.
Resume
The LPI measures logistics efficiency, now widely recognized as vital for trade and growth. A country’s ability to trade globally depends on its traders’ access to global freight and logistics networks. And the efficiency of a country’s supply chain (in cost, time, and reliability) depends on specific features of its domestic economy (logistics performance). Better overall logistics performance and trade facilitation are strongly associated with

-96- II/2014
trade expansion, export diversification, attractiveness to foreign direct investment, and economic growth.
Transport Performance Indicators (TPI), help an organization define and measure progress toward organizational goals. Once an organization has analyzed its mission, identified all its stakeholders, and defined its goals, it needs a way to measure progress toward those goals. TPIs are those measurements. In the article was presented results from road transport area of Slovak Republic and the results of the questionnaire that was made and defined the most import TPIs in transport companies. There was also proposed recommendations for transport companies, how the TPIs be used for measurement of fleet performance.
Key words
Performance, logistics, road transport, transport company
Ing. Ivana Šimková
University of Žilina
Department of the Road and Urban Transport
Faculty of Operation and Economics of Transport and Communications
Univerzitná 8215/1
010 26 Žilina
e-mail: [email protected]
Doc. Ing. Vladimír Konečný, Ph.D.
University of Žilina
Department of the Road and Urban Transport
Faculty of Operation and Economics of Transport and Communications
Univerzitná 8215/1
010 26 Žilina
e-mail: [email protected]

-97- II/2014
THIRD-PARTY LOGISTICS AS A SOURCE OF COMPETITIVE ADVANTAGE
Ľubica ŠTEFÁNIKOVÁ, Gabriela MASÁROVÁ, Peter MAJERČÁK
1 Introduction
Only the enterprise that focuses on continuous development and improvement of their goods and services can be successful in today's global world, and under the action of uncompromising competition. The basis for gaining a competitive advantage over rivals is the benefit of a certain added value to customers. This enterprise can obtained this value through the implementation of value-creating activities more efficiently than its competitors, or by carrying them out by such a unique way that creates greater differentiation from the competition. Logistics outsourcing i.e. Third-Party Logistics (3PL) is one of tool to achieving a competitive advantage, and of course to keeping it for a longer period.
2 Distribution Logistics via Third-Party Logistics
Straka and Malindžák state that distribution logistics is responsible for all storage and transport movements of the goods to consumer and also the associated information, management and control activities. [4] Stehlík perceives the distribution policy in the same way, and he understands it as the sum of the tasks and measures for preparation and implementation of distribution - sales. He further states that the distribution policy has to provide manufactured goods defined by type, quantity, time and space so that the specified delivery time could be followed or that the expected demand could be most successfully satisfied. [6] Graphical representation of the distribution logistics boundary is shown in Figure 1. The role of distribution policy is to ensure the most appropriate way, selection and analysis of transport which is most suitable for the transfer of products manufactured by enterprises so in order to achieve trouble-free operation of the market. Therefore, the demands for qualified professional, external advisors and consultants have grown in recent years. Enterprises are interested in establishing long-term strategic partnerships that would bring even greater savings, thereby ensuring competitiveness in the future.

-98- II/2014
Fig. 1 Distribution logistics boundary
Supplier Customer
Inventory - Warehouse
Producing Material entry Expedition
Distribution logistics
Source: CHUDADA, M., TARABOVÁ, Z. Distribučná logistika ako súčasť riadenia dodávateľského reťazca, 2012, s. 2
Business success in the market depends on increasing quality, reducing costs and increasing flexibility, which is related to the trend of variation from seller's market to a buyer's market, which sets out the requirements for goods and also for the process of its delivery. Achievement of a high flexibility is conditional on a good personnel and technical equipment, perfect management, which are very costly for businesses and companies normally do not have, nor do not want to invest in these resources. It leads to crowding out support activities outside the company and using of external companies for their providing - Third-Party Logistics.
It used to be that many enterprises are managed logistics activities internally. Recently, companies have realized the need to focus their energies on managing of the core business and therefore are they beginning to discover the possibilities of outsourcing logistics activities through the 3PL service providers. In addition to the contribution of required professionalism in the field, 3PL companies benefit from obtaining economies of scale. In developed markets, global 3PL company can go beyond the traditional roles and may additionally integrate the skills, resources and technologies in order to provide comprehensive supply chain solutions to its customers. Companies using logistics outsourcing expected to reduce costs, increase service levels to customers and thus considerable assistance in obtaining long-term sustainable competitive advantage.

-99- II/2014
These findings are based on data from the report, which presents the results of research conducted in 2014. Its purpose was to document the growth and development of the 3PL industry in which it has been questioned 1393 respondents representing users and non-users of 3PL services. Survey responses from 633 third-party logistics executives and managers confirm that 3PLs continue to provide strategic and operational value, provide new and innovative ways to improve logistics effectiveness and are key contributors to shippers overall business success. According to this year’s study results, 3PL users report an average of 44% of their total logistics expenditures are related to outsourcing. This compares with an average of 39% reported last year, and 42% reported in the previous year. Total logistics expenditures include transportation, distribution, warehousing and value-added services. [8] The table 1 shows the logistic cost reduction, inventory cost reduction and logistic fixed asset reduction in the companies by logistic outsourcing. These percentages support the finding that global markets for 3PL services continue to expand.
Tab. 1 3PL Services Deliver Measurable Benefits
Results 2013 Study 2014 Study
Logistics Cost Reduction 15 % 11 %
Inventory Cost reduction 8 % 6 %
Logistics Fixed Asset
Reduction
26 % 23 %
Source: 2014: 18th Annual Third-Party Logistics Study, 2014, p.10
The most logical reason for using third-party logistics services after cost reduction is lack of internal capabilities. Companies with little transportation and logistics expertise would be wise to outsource rather than attempting to build internal operations. Instead that they can leverage the knowledge, skills, networks and resources of experienced 3PLs. [1] Table 2 provides a list of factors why the company used as well as do not use 3PL services assistance.
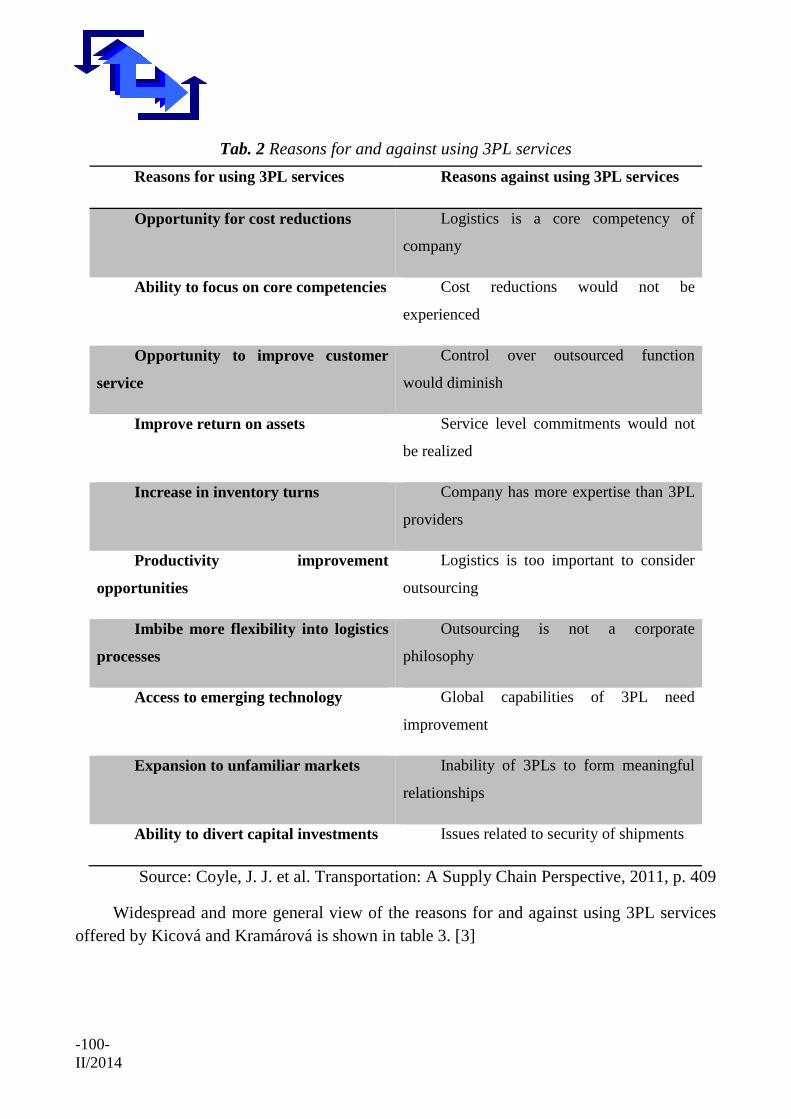
-100- II/2014
Tab. 2 Reasons for and against using 3PL services
Reasons for using 3PL services Reasons against using 3PL services
Opportunity for cost reductions Logistics is a core competency of
company
Ability to focus on core competencies Cost reductions would not be
experienced
Opportunity to improve customer
service
Control over outsourced function
would diminish
Improve return on assets Service level commitments would not
be realized
Increase in inventory turns Company has more expertise than 3PL
providers
Productivity improvement
opportunities
Logistics is too important to consider
outsourcing
Imbibe more flexibility into logistics
processes
Outsourcing is not a corporate
philosophy
Access to emerging technology Global capabilities of 3PL need
improvement
Expansion to unfamiliar markets Inability of 3PLs to form meaningful
relationships
Ability to divert capital investments Issues related to security of shipments
Source: Coyle, J. J. et al. Transportation: A Supply Chain Perspective, 2011, p. 409
Widespread and more general view of the reasons for and against using 3PL services offered by Kicová and Kramárová is shown in table 3. [3]

-101- II/2014
Tab. 3 List of advantages and disadvantages of outsourcing
Advantages Disadvantages
Organization Create a time-space for
core business activities and
streamline business operation
Cost savings may not
meet company’s expectation
Increasing of
production, productivity and
efficiency in core as well as
non-core activities
Outsourcing contract
and level service agreement
are kinds of unnamed
contracts and thereby the
satisfaction with outsourcing
services depends on concrete
specifications
Access to expert
solutions, skilled workforce,
professional services in high
quality
Process of preparing an
outsourcing contract may
take longer time
Increase the flexibility
of organizational and
management structure
Contract costs and
overall costs of outsourcing
Carter to the new and
potentially profitable
customers ‘needs
reduction in the quality
of products or services,
delayed supplies
Improvement of
operational management
Outsourcing provider
may not be innovative
enough and may not
understand the industry,
where the company operates
in

-102- II/2014
Reduction of operating
costs
Lack of customer focus
Reduction of investing
costs because the latest
technologies, software,
infrastructure and know-how
are in competence of
outsourcing provider
Fragmentation of the
corporate image and identity
Transformation some
kinds of fixed costs into
variable costs
Risk which is
determined by the switch of
suppliers
Free up the company´s
cash flow
Risk of leakage of
sensitive and confidential
information
Risk reducing from
long-term perspectives by
sharing it with the provider
Source: Kicová, E. Kramárová, K. Innovations in outsourcing. In: 7th International Days of Statistics and Economics, Prague. 2013
Note that there is some conflict between the results as a reason for outsourcing may also be listed as a reason for not outsourcing. Clearly, outsourcing transportation and logistics is not for every organisation. Before choosing to us third-party logistics services, an enterprise should spend time developing clear transportation objectives and then analyse if and how 3PLs can provide key support. The transactional, operational, repetitive activities are more often outsource. The strategic and technology intensive ones tend to be less frequently handled through 3PL companies. Table 3 shows the factors that positively influenced the outsourcing of transport and logistics. Conversely Table 5 enumerates the reasons why some companies do not use this opportunity.

-103- II/2014
Tab. 4 Reasons for using 3PLs change over time
Reason North
America (%)
Wester
n Europe
(%)
Asia-
Pacific (%)
Latin
America
(%)
New markets 75 78 69 88
Globalization 78 91 84 91
Pharmaceutics
concern
28 45 29 27
Pan-European
changes
43 82 8 18
Security problems 69 55 46 78
Intensification of
government intervention
and regulatory policies
64 75 57 85
Consolidation,
mergers, acquisitions
75 83 93 79
Implementation of
new information technology
76 76 75 80
Rapidly accelerate the
introduction of a new product
on the market
77 88 68 89
Considerable pressures
to improve customer service
83 98 83 90
Emphasis on improving
supply chain management
90 98 100 94
Significant pressures to 95 99 95 96

-104- II/2014
reduce costs
Source: Terry, L. et al. 16th Annual Third-Party Logistics Study, 2012, p.12
Tab. 5 Reasons for not using 3PLs change over time
Reason %
Logistics is a core competency at our firm 15
Logistics too important to consider outsourcing 12
Cost reductions would not be experienced 15
Too difficult to integrate our IT Systems with the 3PL´s
Systems
7
Control over the outsourced functions would diminish 7
Service – Level commitments would not be realized 9
Company has more logistics expertise than most 3PL
providers
8
Source: Terry, L. et al. 17th Annual Third-Party Logistics Study, 2013, p.12
Over time, there is not only a change in skills of the provider of external transport and logistics, but there is also the change in expectations of 3PL services users. Based on the many researches we can determine trends in the 3PL industry in the future. The expansion of global markets and required services will result in the continued development and consolidation of the 3PL industry through expanding the services offered range within the supply chain and within the extensive outsourcing process of transport and logistics services.
In the provision of these services there will be the emphasis on their added value by using the following attributes: creation of a strategic relationship between the user and 3PL providers and their subsequent adaptive and flexible cooperation, obtaining extensive experience based on information and knowledge, risk sharing and dissemination of technological capabilities. In the future, we can expect increased efforts to update, strengthen and enhance of the relationship between 3PL user and provider. The emphasis will be put for renewal of defunct relations and the importance of mechanisms for continuous improvement and innovation will be accentuated.
-105- II/2014
3 Third-Party Logistics as a source of competitive advantage
Regardless of how quickly these trends will be evident, the topic of outsourcing logistics will be crucial for the future success of logistics and supply chain management and it will become a major source of gaining competitive advantage because in today's challenging and dynamic environment the structure of competitive advantage has become complex and variable. The initial view highlighting only some components of competitiveness becomes unsatisfactory at the present time. Competitive advantage is transformed into a phenomenon, which is a multicomponent, integrated, dynamic, and mutually reinforcing. M.E. Porter in this context introduces the concept of value chain.
Value chain is based on the recognition that the causes of competitive advantage cannot be identified and evaluated by looking at the enterprise as a whole. Undertaking must be divided into sub-files of the examined activities according to the benefits to total value of production. All these value added activities form the basis for a competitive advantage. The methods of making individual activities compared to competitors reveals differences the enterprise, upon which it can build a competitive advantage. Particular enterprise should be able to specify the various categories of value-creating activities in more detail and divided them into sub-categories that relate to the specific production. Enterprise can easily find place for competitive advantage precisely on such a narrow definition [9-11].
The paper is an output of Majerčák, P. a kol.: Projekt VEGA 1/0931/12 Uplatnenie teórie obmedzenia (TOC) v logistickom riadení výroby podniku.
References
[1] COYLE, J. J. et al. Transportation: A Supply Chain Perspective. 7th ed. Mason: South-Western Cengage Learning, 2011, ISBN 978-0-324-78919-5
[2] CHUDADA, M. - TARABOVÁ, Z. Distribučná logistika ako súčasť riadenia dodávateľského reťazca. In: Logistický monitor. [online]. 2012 [cit. 2012-11-10] Available at: http://www.logistickymonitor.sk/en/images/prispevky/tarabova-5-2012.pdf
[3] KICOVÁ, E. - KRAMÁROVÁ, K. Innovations in outsourcing. In: 7th International Days of Statistics and Economics. [online]. 2014 [cit. 2014-7-7] Available at: http://msed.vse.cz/files/2013/172-Kicova-Eva-paper.pdf
[4] STRAKA, M., MALINDŽÁK D.: Distribučná politika, Košice 2005, 208 s., ISBN 80-8073-296-5
[5] PORTER, M. E. Competitive Advantage: Creating and Sustaining Superior Performance. New York: THE FREE PRESS, 1985, ISBN 0-684-84146-0

-106- II/2014
[6] STEHLÍK, A.: Logistika – strategický faktor manažerského úspěchu. 1. vyd. Brno: Studio Kontrast, 2003
[7] TERRY, L. et al. 16th Annual Third-Party Logistics Study. [online]. 2012 [cit. 2012-14-10] Available at: http://www.outreach.psu.edu/programs/hadly-waters/files/2012_3pl_study.pdf
[8] TERRY, L. et al. 18th Annual Third-Party Logistics Study. [online]. 2014 [cit. 2014-3-8] Available at: http://www.capgemini.com/resource-file-access/resource/pdf/3pl_study_report_web_version.pdf.
[9] Novotný, J. Investování do reálných a finančních investic. Hradecké ekonomické dny, 2014. Mezinárodní vědecká konference, 2014, s. 340 – 346. ISBN 978-80-7435-367-3.
[10] Kampf, R., Cejka, J., Stopka, O. Proposal of New System for Regular Public Transport, (2014). SYLWAN Journal. Vol. 158 (11). ISSN 0039-7660.
[11] KUBASÁKOVÁ, I., KAMPF, R., STOPKA, O. Logistics information and communication technology. (2014). Communications. Vol. 16 (2). pp. 9 – 13, ISSN: 1335-4205.
Resume
Distribution logistics is part of the primary activities of the company. Currently process of globalization and internationalization on the world market is still continuing and supports outsourcing. Outsourcing is the process in which company delegates support activities and the work from its internal structure to external company. The external companies are specialized to carry out these activities. The aim of the paper is to describe the reason for use or non-use 3PL services, their advantages and disadvantages. In addition, we want to emphasize the impact of 3 PL to increase competitive advantages.
Key words
3PL, outsourcing, logistics, distribution logistics
Ing. Ľubica Štefániková, PhD.
University of Žilina
Faculty of Operation and Economics of Transport and Communications
Departement of Economics
e-mail: [email protected]
Ing. Gabriela Masárová
University of Žilina
Faculty of Operation and Economics of Transport and Communications

-107- II/2014
Departement of Economics
e-mail: [email protected]
Ing. Peter Majerčák, PhD.
University of Žilina
Faculty of Operation and Economics of Transport and Communications
Departement of Economics
e-mail: [email protected]

-108- II/2014
COMPARISON OF REVENUE AND EXPENDITURES OF ROAD AND RAILWAY TRANSPORT IN THE SLOVAKIA
Peter VARJAN
1 Introduction
The task of the state is ensuring of correct and quality operation of passenger but also freight transport. For this task are necessary sizeable financial resources, which are used to keeping current level of transport quality but also its next necessary development. Main states expenses are costs on transport infrastructure and ensuring public passenger transport.
State had to introduce not only direct but also indirect charges for obtaining needed sources. Sources are necessary for operation of road and railway transport. It is charges for using transport infrastructure but also mineral oil tax.
2 Revenue
State obtains sizeable financial revenue by right operation of road and railway transport. No matter if charges are related directly or indirectly with transport operation. Direct revenue of transport is charges for using transport infrastructure. In road transport it is revenue from sale of vignette and revenue from toll. In railway transport it is charge for using railway line (RL). Indirect revenue is tax from mineral oils, which are used for operation road and railway transport. Then it is motor vehicle tax (collected by self-government regions).

-109- II/2014
Tab. 1 Revenue from road and railway transport
in mil. € 2008 2009 2010 2011 2012 2013 Mineral oil tax 1 174 1 053 1 032 1 074 1 043 1 074
Vignette NDS1 75,95 74,36 33,86 46,25 50,55 52,10
VAT 2 (state) 15,19 14,87 6,77 9,25 10,11 10,42 Total 91,14 89,23 40,64 55,50 60,66 62,52
Toll
NDS - - 141,81 154,10 155,50 159,10 VAT
(state) - - 28,36 30,82 31,10 31,82
Total - - 170,17 184,92 186,60 190,92 Motor vehicle tax 80,89 125,82 118,61 129,47 134,63 140,10 Railway line charge 194,51 180,33 188,51 95,56 89,03 92,41 TOTAL 1 540,5 1 448,4 1 549,9 1 539,4 1 513,9 1 560,0
Source: authors’ processing on the base of dates from [1], [2], [3], [4], [5-11], [12]
Total revenue from transport is noted in tab. 1. Its value is on level over 1,5 bill. € per year in period 2008-2013(except 2009). Mineral oil tax has the highest part of total revenue (even 2/3). Tax has had value more than 1 bill. € for last six years (2008-2013). Toll revenue is much less than revenue from mineral oil tax. Toll revenue is on second place in total sequence. It has average value on level 180 mil. € per year.
Fig. 1 Graphical comparison of revenue from road and railway transport
Source: authors’ processing on the base of dates from [1], [2], [3], [4], [5-11], [12]
1NDS – National highway company - owned by state 2VAT - value added tax

-110- II/2014
Motor vehicle tax is on third place. Its value has been rising and it is on level 140.1 mil. € in 2013. Charge for using railway line has been decreasing (double decrease in compare with 2008) what causes that charge is on penultimate place. Its value is on the level 92.41 mil. € in 2013. The lowest revenue for state is from sold vignette and it is on level 62.52 mil. € in 2013. In 2010, revenue from vignette markedly decreased what was caused by introducing toll in this year. However toll revenue is much higher than revenue from vignette. Comparison of values transport revenue is graphical illustrated on figure 1.
3 Expenditures
State needs a lot of financial resources for providing right and quality operation of transport. Expenditures on transport have two main parts. First of them is transport infrastructure – expenditures on maintenance or expenditures to acquire tangible fixed assets. Second part is providing serviceability – grant for regular public passenger transport.
Grants for providing serviceability are noted in tab. 2. Total grant for public passenger transport has increasing tendency. Grant was on level 564 mil. € in 2013. Grant for suburban bus transport has increasing character and grant for railway passenger transport has slightly fluctuating character. Urban public transport has balanced course of grant, which value is about 80 mil. € per year.
Tab. 2 Value of grants for regular public passenger transport
in mil. € 2008 2009 2010 2011 2012 Railway transport 166 270 228 205 362 Suburban bus t. 71 98 100 106 122 Urban public t. 78 80 79 79 80 Total 315 448 407 390 564
Source: authors’ processing on the base of dates from [1]
In 2012, total expenditures for railway infrastructure were on level 224.6 mil. € and from this value was 216 mil. € needed for to acquire tangible fixed assets (TFA). Last part - 8.6 mil. € was used for maintenance transport infrastructure. Development of expenditures for railway infrastructure has fluctuating character and its value is on level from 200 to 300 mil. € per year. Values of expenditures for railway infrastructure are noted in tab. 3 for period 2008-2012.

-111- II/2014
Tab. 3 Expenditures for railway transport infrastructure
in mil. € 2008 2009 2010 2011 2012 Acquire TFA 199,8 175,3 273,4 289,2 216,0 Maintenance 14,6 15,0 12,4 6,4 8,6 Total 214,4 190,3 285,8 295,6 224,6
Source: authors’ processing on the base of dates from [1]
Course of total expenditures for road transport infrastructure has fluctuating character, too. In 2012, amount of expenditures was on level 503.7 mil. €. From this value was 311.1 mil. € used to acquire tangible fixed assets and 192.6 mil. € was used to maintenance transport infrastructure. Difference between acquire and maintenance isn’t so marked in compare with railway transport. Expenditures of acquire tangible fixed assets has mainly decreasing character. Values of expenditures are noted in table 4 for individual year 2008-2013.
Tab. 4 Expenditures for road transport infrastructure
in mil. € 2008 2009 2010 2011 2012 Acquire TFA 587,7 661,6 342,1 431,9 311,1 Maintenance 167,4 192,4 174,7 159,6 192,6 Total 755,1 854,0 516,8 591,5 503,7
Source: authors’ processing on the base of dates from [1]
In monitored period, the highest total value of expenditures for road and railway transport was in 2009 and it was on level 1 492.3 mil. €. In 2012, this value decreased on level 1 292.3 mil. €. However, in last three years expenditures have again increasing character. Values of individual expenditures items of transport are noted in table 5 for monitored period.
Tab. 5 Total expenditures for road and railway transport
v mil. € 2008 2009 2010 2011 2012 Acquire TFA 787,5 836,9 615,5 721,1 527,1 Maintenance 182,0 207,4 187,1 166,0 201,2 Public passenger transport 315,0 448,0 407,0 390,0 564,0 Total 1284,5 1492,3 1209,6 1277,1 1292,3
Source: authors’ processing on the base of dates from [1]
Comparison of individual expenditures items of road and railway transport in percentages is graphically illustrated in figure 2. Acquiring tangible fixed assets comprises more than half part. However in 2012, there was a change. Expenditures for public passenger transport comprised the biggest item of expenditures and it was 44 % of total

-112- II/2014
expenditures. It is markedly increase in compare with past year. In the same year, expenditures for maintenance has its the highest part and it was 16 % for monitored period.
Fig. 2 Graphical compare of expenditures for road and railway transport
Source: authors’ processing on the base of dates from [1]
4 Comparison of expenditures and revenue
Comparison of direct and indirect revenue, which are obtained by operation road and railway transport, with expenditures on transport infrastructure and public passenger transport, is noted in table 6. Comparison shows the fact that revenue of transport exceeds expenditures of transport (except 2009). In 2012, revenue of transport was on level 1 513.9 mil €.The greatest part of it was mineral oil tax (about 71%). Expenditures were on level 1 292.3 mil €. The greatest expenditure item was expenditure for transport infrastructure - acquire tangible fixed assets (24 %).
Tab. 6 Comparison of revenue and expenditure in road and railway transport
in mil. € 2008 2009 2010 2011 2012 Expenditures 1 284,5 1 492,3 1 209,6 1 277,1 1 292,3 Revenue 1 540,5 1 448,4 1 549,9 1 539,4 1 513,9 Difference 256,0 -43,9 340,3 262,3 221,6
Source: authors’ processing on the base of dates from [1], [2], [3], [4], [5-11], [12]

-113- II/2014
Percentage ratio of expenditures on revenue in road and railway is graphically illustrated in fig. 3. Only in 2009, value of expenditures was higher than value of revenue and it was higher about 3%. Ratio of expenditures to revenue of transport was from 78 to 85 % in monitored period. Ratio of expenditures to revenue has been increasing value from 78 to 85 %, since 2010.
Fig. 3 Graphical comparison of expenditures in road and railway transport
Source: authors’ processing on the base of dates from [1-12], [16]
5 Conclusion
Revenue of mineral oil tax is main financial resource of transport for state. Ratio of this tax to total revenue is more than two-thirds. Revenue of charges for using road communications increased from reason introducing toll. Revenue decrease of charge for using railway line is caused by decreasing transport performances of freight transport.
The most funds are using for transport infrastructure (56 %) and the greatest part was used for acquire tangible fixed assets of road transport. The greatest part of funds for public passenger transport (44 %) is comprised by funds for railway transport (28 %), which is threefold higher than funds for bus transport. According to comparison between revenue and expenditures it is possible to say that transport is able to self-financing without revenue, which aren’t in connection with transport. Revenue of transport has been higher (minimum about 15 %) than expenditures of transport for period last three years.

-114- II/2014
This paper has been developed under support of project: MŠVVŠ SR - VEGA č. 1/0320/14 POLIAK, M.: Zvyšovanie bezpečnosti cestnej dopravy prostredníctvom podpory
hromadnej prepravy cestujúcich.
References
[1] Statistics of Ministry of transport, construction and regional development of the Slovak republic Štatistické údaje MDVRR SR Available: <http://www.telecom.gov.sk/index/index.php?ids=55622>
[2] Final accounts of Self-governing region of Bratislava for 2008 – 2013
[3] Internal data of SkyToll, a. s.
[4] National highway company – Financial indicators in 2014, Available: <file:///C:/Users/Ultimate/Downloads/NDS_Financne_ukazovatele_2014.pdf>
[5] Final accounts of Self-governing region of Banská Bystrica for 2008 – 2013
[6] Final accounts of Self-governing region of Košice for 2008 - 2013
[7] Final accounts of Self-governing region of Nitra for 2008 - 2013
[8] Final accounts of Self-governing region of Prešov for 2008 - 2013
[9] Final accounts of Self-governing region of Trenčín for 2008 - 2013
[10] Final accounts of Self-governing region of Trnava for 2008 – 2013
[11] Final accounts of Self-governing region of Žilina for 2008 – 2013
[12] Budget of chapter General cash report for 2013 - (Annex no. 1: Revenue of chapter – General cash report), Available: < http://www.finance.gov.sk/Default.aspx?CatID=8819>
[13] POLIAK, M. - KONEČNÝ. V. Trh hromadnej osobnej dopravy a jej financovanie. 1. edition Žilina: Žilinská univerzita v Žiline, 2009, 176 p. ISBN 978-80-8070-999-0.
[14] POLIAK, M. (2013). Vzťah primeraného zisku a rizika v hromadnej osobnej doprave na Slovensku. Ekonomický časopis (Journal of Economics), vol. 61, no. 2 (2013), p. 206-220. ISSN 0013-3035
[15] STANLEY, J. – VAN DE VELDE, D. (2008): Risk and Reward in Public Transport Contracting. Research in Transport Economics, 22, no. 1, p. 20 – 25.
[16] Novotný, J. Trendy investování podniků do komodit v současném podnikatelském prostředí na základě psychologické analýzy. Mezinárodní vědecká konference – Aktualne problémy podnikovej sféry 2014. Ekonomická Univerzita v Bratislavě, 2014. s. 356 -361. ISBN 978-80-225-3867-1.
[17] KAMPF, R., GAŠPARÍK, J., KUDLÁČKOVÁ, N. Application of different forms of transport in relation to the process of transport user value creation. (2012). Periodica Polytechnica Transportation Engineering 40 (2) pp. 71 - 75 , ISSN: 03037800.

-115- II/2014
Resume
The paper deals with financing road and railway transport. The first part provides summary of direct but also indirect revenue related on transport. The second part deals with transport infrastructure expenditures and expenditures of public passenger transport. In conclusion there is comparison between total revenue and expenditures of road and railway transport.
Key words
Revenue, expenditures, road transport, railway transport
Ing. Peter Varjan
University of Žilina
Faculty of Operation and Economics of Transport and Communications
Department of Road and Urban Transport
e-mail: [email protected]

-116- II/2014
PREDICTING STOCK PRICES IN BANK VIG
Robert ZEMAN, Jaroslav STUCHLÝ
1 Introduction
The aim of the work will be to describe the different possibilities of modelling the time series describing the evolution of stock prices in order to obtain effective prediction models. To apply these results for the finite time series of stock prices VIG from individual business days at the Prague Stock Exchange. We will evaluate the accuracy of predictions by the usual common measures of the accuracy of predictions, such as it is for example the mean square error MSE or the mean absolute deviation MAD (see eg. Cipra 1986 or Stuchlý 2011). At the regression models the coefficient of determination or the standard error of regression s can be used. We will compare the obtained results and choose the adequate model that will give the most accurate predictions for these data. The relevant numerical calculations will be performed by using Excel, R, Statgraphics Plus for Windows 3.0 or PcGive 2.10.
2 Methods – materials and methodology
Some of the most widely used methods of statistical prediction are methods of extrapolation of time series, regression analysis methods and methods based on a systemic approach and complex models. The essence of classical extrapolation methods lies in the fact that the history of the projected object is studied and the regularities of its development in the past and the present will be transferred to the future. They are consequently based on the principle of stability of the time series, which characterizes the studied object. The methods are decisively influenced by the choice of the model. But there is no such thing as the best predictive model, applicable in all situations.
We will use the historical data from VIG exchange rate sheets for the period from 5 February 2008 to 28 February 2014. We will get the variables: the final share price (price), the data of business days - we will number them to the variable business days ( t = 1, 2 , ..., 1530) . The data with used variables can be found on the website https: //is.vstecb.cz/auth/dok/rfmgr.pl?upload_id=5094844 in the viena.xlsx data file .The representation of the final prices of the stocks is in the graph1.For the consequent comparison of predictions we will complete the data by the period from 3 March 2013 to 7 March 2014 (5 trading days, t = 1531, ..., 1535).
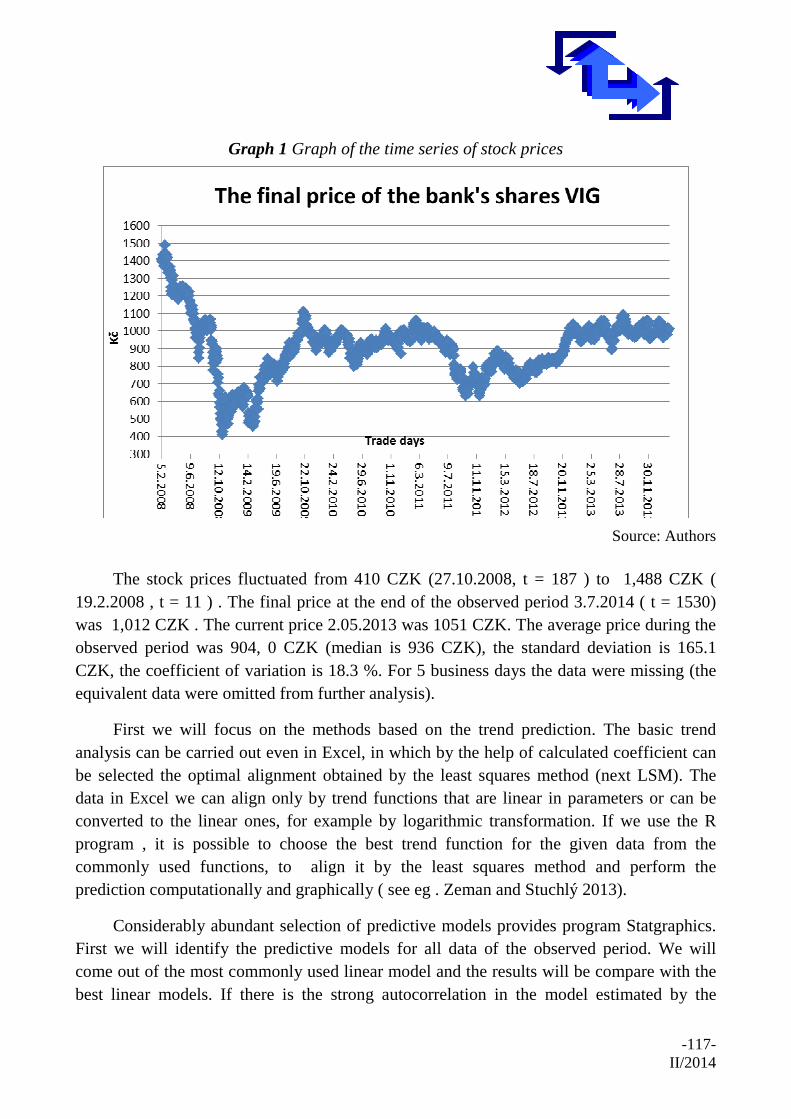
-117- II/2014
Graph 1 Graph of the time series of stock prices
Source: Authors
The stock prices fluctuated from 410 CZK (27.10.2008, t = 187 ) to 1,488 CZK ( 19.2.2008 , t = 11 ) . The final price at the end of the observed period 3.7.2014 ( t = 1530) was 1,012 CZK . The current price 2.05.2013 was 1051 CZK. The average price during the observed period was 904, 0 CZK (median is 936 CZK), the standard deviation is 165.1 CZK, the coefficient of variation is 18.3 %. For 5 business days the data were missing (the equivalent data were omitted from further analysis).
First we will focus on the methods based on the trend prediction. The basic trend analysis can be carried out even in Excel, in which by the help of calculated coefficient can be selected the optimal alignment obtained by the least squares method (next LSM). The data in Excel we can align only by trend functions that are linear in parameters or can be converted to the linear ones, for example by logarithmic transformation. If we use the R program , it is possible to choose the best trend function for the given data from the commonly used functions, to align it by the least squares method and perform the prediction computationally and graphically ( see eg . Zeman and Stuchlý 2013).
Considerably abundant selection of predictive models provides program Statgraphics. First we will identify the predictive models for all data of the observed period. We will come out of the most commonly used linear model and the results will be compare with the best linear models. If there is the strong autocorrelation in the model estimated by the

-118- II/2014
method of the least squares, we will improve the estimate for example by the RALS method offered by the program PcGive . From the Graph 1 we see that the stock prices after 7 November 2012 ( t = 1201) stabilize around 1,000 CZK . Therefore we will focus in the next part of the analysis on the reduced period, it means on stock prices after this date. We will show that the analysis based only on these reduced data give more accurate predictions. In the conclusion of the article will also deal with models based only on the analysis of time series themselves.
3 Trend analysis for all data
3.1 Linear model For all the data we estimate a LSM linear model, expressing the regression dependence
of the price on time t. In the next line we will specify the value of the test criterion (t) for the test of the significance of the regression coefficients. We will get the result
price = 898.206 + 0.007673 t, R2 = 0.042, s = 165.1
(t) 106,30,801
Point and interval predictions for 5 successive trading days are:
Tab. 1 Point and interval predictions for 5 successive trading days
Day Point prediction Lower limit Ceiling 1531 909,99 585,91 1234,07 1532 910,00 585,92 1234,08 1533 910,01 585,93 1234,09 1534 910,02 585,93 1234,10 1535 910,02 585.94 1234.10

-119- II/2014
Graph 2 Alignment of stock prices by the linear trend function
Linear model
t
Pric
e
0 400 800 1200 1600400
600
800
1000
1200
1400
1600
Source: Authors
The model is not good, we will use it only for comparison. Better results are given by the following non-linear models.
3.2 Hyperbolic model (reciprocal v t) For all the data we will estimate a LSM linear model expressing the regression
dependence of the price on time 1 / t. We will get
price = 896.943 + 1374.46 / t, R 2 = 0.0729, s = 159
(t) 217.5 125.6
Point and interval predictions for 5 successive trading days are:
Tab. 2 Point and interval predictions for 5 successive trading days
Day Point prediction Lower limit Ceiling 1531 897,841 585,796 1209,886 1532 897,840 585,795 1209,886 1533 897,840 585,795 1209,885 1534 897,839 585,794 1209,884 1535 897,839 585,793 1209,884

-120- II/2014
Graph 3 Alignment of stock prices by the hyperbolic trend function
Hyperbolical model
t
Pric
e
0 400 800 1200 1600400
600
800
1000
1200
1400
1600
Source: Authors
The results are now significantly better. The estimated regression parameters are significant. Errors are lower.
3.3 Cubical model From the non-linear model the cubic model provides the best alignment (cubic
regression function)
price = 1094.46-0.997064 t + 0.00111854 t2-0, 000000335412t3, R2 = 0.155, s = 151.9
(t) 70.2 -11.3 8.36 -5.83
Point and interval predictions for 5 successive trading days are:
Tab. 3 Point and interval predictions for 5 successive trading days
Day Point prediction Lower limit Ceiling 1531 986,100 686,532 1285,667 1532 986,168 686,586 1285,752 1533 986,237 686,638 1285,835 1534 986,304 686,689 1285,918 1535 986,370 686,740 1286,000
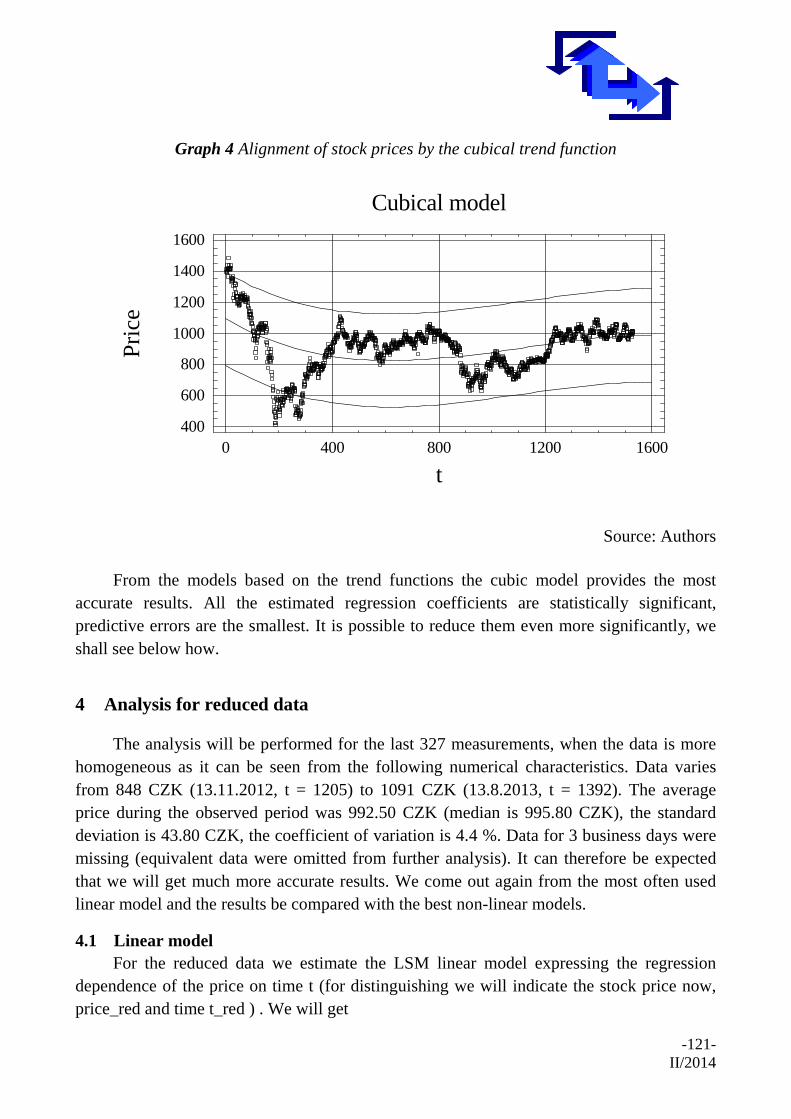
-121- II/2014
Graph 4 Alignment of stock prices by the cubical trend function
Cubical model
t
Pric
e
0 400 800 1200 1600400
600
800
1000
1200
1400
1600
Source: Authors
From the models based on the trend functions the cubic model provides the most accurate results. All the estimated regression coefficients are statistically significant, predictive errors are the smallest. It is possible to reduce them even more significantly, we shall see below how.
4 Analysis for reduced data
The analysis will be performed for the last 327 measurements, when the data is more homogeneous as it can be seen from the following numerical characteristics. Data varies from 848 CZK (13.11.2012, t = 1205) to 1091 CZK (13.8.2013, t = 1392). The average price during the observed period was 992.50 CZK (median is 995.80 CZK), the standard deviation is 43.80 CZK, the coefficient of variation is 4.4 %. Data for 3 business days were missing (equivalent data were omitted from further analysis). It can therefore be expected that we will get much more accurate results. We come out again from the most often used linear model and the results be compared with the best non-linear models.
4.1 Linear model For the reduced data we estimate the LSM linear model expressing the regression
dependence of the price on time t (for distinguishing we will indicate the stock price now, price_red and time t_red ) . We will get

-122- II/2014
price_red = 738.265 + 0.186186 t_red, R2 = 0.162, s = 40
(t) 23.9 7.99
Point and interval predictions for 5 successive trading days are:
Tab. 4 Point and interval predictions for 5 successive trading days
Day Point prediction Lower limit Ceiling 1531 1023,31 943,992 1102,638 1532 1023,50 944,173 1102,829 1533 1023,68 944,355 1103,020 1534 1023,87 944,537 1103,210 1535 1024,06 944,719 1103,401
Graph 5 Alignment of stock prices by the linear trend function
Linear reduced model
t_red
Pric
e_r
ed
1200 1300 1400 1500 1600840
890
940
990
1040
1090
1140
Source: Authors
The model has significantly better statistical properties than the linear model calculated for all data. The estimated regressive coefficients are statistically significant. Prediction errors are lower. From the non-linear models the following double reciprocal reduced model is significantly better.
4.2 Double reciprocal regression model LSM we will get

-123- II/2014
price_red = 1 / (0.00071669 0.39802 + / t_red), R2 = 0.1943
(t) 21.6 8.85
Point and interval predictions for 5 successive trading days are:
Tab. 5 Point and interval predictions for 5 successive trading days
Day Point prediction Lower limit Ceiling 1531 1023,89 943,757 1118,89 1532 1024,07 943,905 1119,11 1533 1024,24 944,053 1119,32 1534 1024,42 944,201 1119,54 1535 1024,60 944,349 1119,76
Graph 6 Alignment of stock prices by the double reciprocal trend function
Double reciprocal reduced model
t_red
Pric
e_re
d
1200 1300 1400 1500 1600840
890
940
990
1040
1090
1140
Source: Authors
Model has better statistical properties than all previous models.
4.3 Cubical model By applying the LSM for reduced data we will obtain
price_red = -41189.9 + 90.0878 t_red-0, 0640056t_red2 +0.0000151329 t_red3, R2 = 0.360, s = 35.2
(t) -5.70 5.65 -5.47 5.29
Point and interval predictions for 5 consecutive trading days are:

-124- II/2014
Tab. 6 Point and interval predictions for 5 consecutive trading days
Day Point prediction Lower limit Ceiling 1531 1014,036 943,110 1084,961 1532 1014,557 943,553 1085,560 1533 1015,089 944,004 1086,173 1534 1015,632 944,464 1086,801 1535 1016,187 944,930 1087,444
Graph 7 Alignment of stock prices by the cubic trend function
Cubical reduced model
t_red
Pric
e_r
ed
1200 1300 1400 1500 1600840
890
940
990
1040
1090
1140
Source: Authors
This model seems to be the most optimal model from all trend models. We will verify by residual analysis whether the conditions for a standard normal regression model are fulfilled. The normality of residues we test by Shapiro - Wilk test in program R. We will get W = 0.9928, p-value = 0.119. Thus, the abnormality of residues was not demonstrated. Homoscedasticity of residues we test by Breusch - Pagan test in program R. We will get BP = 0.9886, p-value = 0.320. Thus, the test didn´t show heteroscedasticity of residues. Autocorrelation of residues we test by Durbin - Watson test in program R. We will get DW = 0.151, p-value = 2,2.10-16 . This means that the residues are linearly dependent. We can reduce the autocorrelation by estimating the cubic model by using the RALS method by the help of program PcGive.

-125- II/2014
4.4 Cubical model estimated by method RALS in PCGive
The estimated regression model is corrected for shape
price_red = -30643.9 + 67.4045 t_red - 0, 0477743t_red2 +0.0000112690 t_red3 , s = 13.4
Values of five point forecasts are: 1011.18; 1011.54; 1011.92; 1012.30; 1012.69.
Graph 8 Alignment of stock prices and prediction by cubic trend function by RALS method
Source: Authors
The program PcGive does not calculate the predictive intervals. From the size and process of graph we can see that the predictions match the data accurately.
5 Predictions based on alignment of time series
Program Statgraphics enables to analyze and compare different models based only on the analysis of time series itself. Description and use of these methods can be found eg.in Cipra 1986, Stuchlý 2004, Zeman and Stuchlý 2013. Here we will be limited only by tabular and graphical introduction and comparison of models that match the best with the used data (for comparison we also show the optimal model of the trend analysis in the first place).

-126- II/2014
5.1 Comparison of models while using all values of the time series
Graph 9 Comparison of predictions in models based on analysis of all data
Time Sequence Plot for cenaQuadratic trend = 1034,06 + -0,524447 t + 0,000347809 t^2
cena
1500 1505 1510 1515 1520 1525 1530 1535700
800
900
1000
1100
1200
1300
1400
Time Sequence Plot for cenaHolt's linear exp. smoothing with alpha = 0,9971 and beta = 0,1
cena
1500 1505 1510 1515 1520 1525 1530 1535700
800
900
1000
1100
1200
1300
1400
Quadratic trend function: MSE=23531,3; MAE=116,7
Holt´s linear alignment: MSE=376,9; MAE=13,8
Time Sequence Plot for cenaSimple exponential smoothing with alpha = 0,9971
cen
a
1500 1505 1510 1515 1520 1525 1530 1535700
800
900
1000
1100
1200
1300
1400
Time Sequence Plot for cenaARIMA(1,0,0) with constant
cen
a
1500 1505 1510 1515 1520 1525 1530 1535700
800
900
1000
1100
1200
1300
1400
Simple exp.alignment: MSE=356,8; MAE=13,3 Model ARIMA(1,0,0): MSE=354,6; MAE=13,3
Source: Authors
In the next table I introduce the first five trading days´ values t, point predictions obtained by the models and the real values of stock prices:
Tab. 7 First five trading days´ values t, point predictions obtained by the models and the real values of stock prices
Day t Quadr.model Holt´s alignment Exp.alignment ARIMA(1,0,0) Real values 1531 1046,4 1013,0 1012,0 1010,9 990 1532 1046,9 1014,1 1012,0 1009,7 985 1533 1047,5 1015,1 1012,0 1008,6 986 1534 1048,0 1016,1 1012,0 1007,5 992 1535 1048,6 1017,2 1012,0 1006,4 985
Source: Authors

-127- II/2014
We see that the best results gives the model of exponential alignment with balancing constant α = 0.9971 and especially model ARIMA (1,0,0).
5.2 Comparison of models while using the last 357 values of time series
Graph 10 Comparison of models while using the last 357 values of time series
Time Sequence Plot for cena_redQuadratic trend = 925,872 + 0,841073 t + -0,00198824 t^2
cena
_red
300 305 310 315 320 325 330 335700
800
900
1000
1100
1200
1300
1400
Time Sequence Plot for cena_redHolt's linear exp. smoothing with alpha = 0,9376 and beta = 0,0052
cena
_red
300 305 310 315 320 325 330 335700
800
900
1000
1100
1200
1300
1400
Quadratic trend function: MSE=1343,2; MAE=29,7
Holt´s linear alignment: MSE=184,0; MAE=10,2
Time Sequence Plot for cena_redSimple exponential smoothing with alpha = 0,9709
cena
_red
300 305 310 315 320 325 330 335700
800
900
1000
1100
1200
1300
1400
Time Sequence Plot for cena_redARIMA(1,0,0) with constant
cena
_red
300 305 310 315 320 325 330 335700
800
900
1000
1100
1200
1300
1400
Simple exp.alignment: MSE=182,4; MAE=10,2 Model ARIMA(1,0,0): MSE=176,6; MAE=10,1
Source: Authors
In the next table, I introduce again the first five trading days´ values t, point predictions obtained by particular models and the real values of stock prices:
Tab. 7 First five trading days´ values t, point predictions obtained by the models and the real values of stock prices
Day t Quadr.model Holt´s alignment Exp.alignment ARIMA(1,0,0) Real values 1531 986,4 1012,2 1011,9 1011,3 990 1532 986,0 1012,7 1011,9 1010,5 985 1533 985,5 1013,1 1011,9 1009,9 986 1534 985,0 1013,6 1011,9 1009,2 992 1535 984,5 1014,1 1011,9 1008,6 985
Source: Authors

-128- II/2014
The most accurate results are given again by the simple exponential alignment with balancing constant α = 0.9709, and in particular the model ARIMA (1, 0, 0).
6 Conclusion
All models based on the reduced data give much more accurate results than models using all data. This is in harmony with the fact that the prices of stocks of the bank VIG fluctuated at first and since November 7, 2012 they have stabilized around 1,000 CZK. Models based only on time series analysis give much more accurate predictions. Model ARIMA gives the most accurate predictions (1, 0, 0) and good results are also given by the simple exponential alignment model (but predictions for individual days are the same) and Holt´s alignment model as well (here the forecasts for individual days vary) [5,6].
References
[1] Cipra, T. (1986)Analýza časových řad s aplikacemi v ekonomii. Praha: SNTL a Alfa
[2] Stuchlý, J. (2004) Statistické metody pro manažerské rozhodování. Jindřichův Hradec: VŠE, Fakulta managementu. ISBN 80-245-0153-8
[3] Zeman, R. &Stuchlý, J. (2013)Prognoznyjemodelidljaakcií “Erste bank” Rosija, Vestnik AGTU, Ser.: Ekonomika. 2013, No. 2, ISSN: 2073 – 5537, pp. 104 – 111.
[4] Novotný, J. Návrh modelu pro hodnocení průmyslových komodit. Mezinárodní vědecká konference – Ekonomika a řízení podniku ve 21. století. VŠB – Technická Univerzita Ostrava – Ekonomická fakulta, 2014. s. ISBN 978-80-248-3520-4.
[5] STOPKA, O., KAMPF, R., KOLÁŘ, J., KUBASÁKOVÁ, I. Identification of Appropriate Methods for Allocation Tasks of Logistics Objects in a Certain Area. (2014). Our Sea, International Journal of Maritime Science & Technology, Vol. 61, No. 1-2, May 2014. ISSN: 0469-6255.
Resume
The aim of the work is to describe the various ways of modelling used for predicting stock prices in the bank VIG (hereinafter in VIG) made using trend analysis and time series analysis in order to obtain effective predictive models. Time series of 1525 final prices of VIP shares on stock exchanges in Prague are used and the models are applied to determine point and interval predictions of the prices of these stocks during the successive 5 trading days. The results are compared using the rates of accuracy and it is selected optimum application on the selected time series.

-129- II/2014
Key words
Trend analysis, time series analysis, predicting, predictive models, stock prices, bank VIG, comparing predictions
Ing. Robert Zeman, Ph.D.
The Institute of Technology and Businesses in České Budějovice
e-mail: [email protected]
doc. RNDr. Jaroslav Stuchlý, CSc.
The Institute of Technology and Businesses in České Budějovice
e-mail: [email protected]

-130- II/2014
THE IDENTIFICATION OF ERRORS IN THE PROCESSES OF SCANNING OF DYNAMICALLY
MOVING LOGISTIC UNITS
Daniel ZEMAN, Jiří TENGLER, Libor ŠVADLENKA
1 Introduction
In recent years, RFID technology came to the fore and in many cases replaced older identification technologies (e.g. barcode). Reduced technical and economic requirements enabled its better availability, as well as development of new hardware and software solutions and more opportunities in further research and use. The main objective of RFID technology is an exact identification and keeping records of objects, goods, material, incomplete products etc. [2].
It is used mainly in production, logistics, warehouse management, postal and express services, sale, safety systems etc. In most of the above stated areas, reliability, accuracy and the speed of operation processes is very important; the combination of these parameters can be determinative factor for improving its position on the market. It is the RFID technology, which together with continual development and research of its improvement possibilities and reducing imperfections/errors leads to absolute satisfying and ensuring of these requirements. The potential and possibilities of RFID technology always depend on current technical progress and development; therefore it would be useful to look for solutions, which could improve already implemented technology and its operation conditions without need of procuring a new one.
2 Parameters and conditions of the research
From the viewpoint of practical application, as well as with respect to the dynamic nature of tag scanning, the greatest emphasis in the processes of improving of the existing situation is given on parameters such as e.g. received signal strength indication (RSSI) value, error rate, the speed of scanning tag / object with tag; number, position and the angle between scanning antennas. Individual parameters, to a greater or lesser extent, influence the scanning process; the main objective of presented research, however, is aimed at elimination scanning errors resulting from the relationship between the object with the tag and the value of the reflected signal, that is, change and quantity of reading (or not reading)

-131- II/2014
of RSSI value is recorded. In general, within dynamic parameters of measurement the speed of tag / object with tag movement is changing, while static parameters, such as number of antennas, performance and the angle between the antennas stay constant during one series of measurement. When defining the relationship between the speed and RSSI value in relation to time, we primarily focus on verification of the following research assumptions – propositions:
• increased speed causes change (reduction) in quantity of reading tag
• constant speed on a specified path does not cause any change (reduction or increment) of RSSI value
The tag placed on the object usually keeps its static position; however, it may change its orientation on selected area, therefore we discuss only its orientation to the antenna. From this point of view, we are mainly interested in influence of particular number of antennas of RFID system and their positioning in the space on the quantity and values of RSSI signal reflected / received from the tag.
2.1 Specification and calculation of RSSI values The intensity (strength) of reflected RF signal can be also indicated by other than RSSI
units, e.g. dBm (decibel-milliwatts), mW (milliwats), or as a percentage. Middleware solution by Aton OnID Company, which was used during the measurement, provides output values of signal reflected from the tag in form of RSSI; therefore, in the following sections we will use this indicator. RSSI is quantitative dimensionless quantity expressing the strength of received signal. Based on this quantity also the RSSI error rate is determined, which indicates the quality of received / reflected signal, while it is true that the lower error rate, the better is reflected signal. [5] Also, the lower final (negative) RSSI value, the better is the intensity of reflected signal, for example, reflected signal with the value –44 is better than the signal with the value –59. In general, RSSI value consists of quantities stated in the following formula 1 [4]:
RSSI = TP + AG1 + AG2 - PL (1)
where TP .......... transmission power of the source
AG1 ....... gain of antenna 1
AG2 ....... gain of antenna 2
PL .......... path loss in free space
As already stated, RSSI does not use an exactly defined unit (dimension); hardware producers (producing antennas, readers, sensors), however, often give conversion formulas for changing RSSI values to values of signal intensity. In addition, it is possible to define RSSI values in dBm (decibel-milliwatts) as follows:

-132- II/2014
RSSI [dBm] = - 10nlog10(d) + A [dBm] (2)
where n ............ signal propagation constant or path loss exponent (in dBm), may vary from 2 – 4 (free space has n = 2 for reference)
A ............ received signal strength in dBm at 1 metre distance without any obstacle
d ............. relative distance (in metres) between the communicating nodes (from the sender to receiver)
In case of using omnidirectional antenna, RSSI value (in dBm) is expressed also by means of the formula (3), which in greater degree accepts losses caused by signal propagation, whether in free area or within antenna downspout of the transmitter or receiver. [4]
RSSI [dBm] = Pt + Gt2 + Gr - Lo - Lt2 - Lr - Rez - A (3)
where Pt ........... represents output power of the transmitter (in dBm)
Gt ........... gain of the transmitting antenna (in dBm)
Gr .......... gain of the receiving antenna (in dBm)
Lo ........... loss due to the propagation in free space (in dBm)
Lt ........... loss of the antenna downspout at the transmitting end (in dBm)
Lr ........... loss of the antenna downspout at the receiving side (in dBm)
Rez ......... reserve (in dB)
A ............ indicates the value of the antenna attenuation (in dB)
2.2 Specification of speed of the handling equipment As we have mentioned earlier, the presented research is aimed, first of all, on
simulation of dynamically changing value of the speed. From practical point of view, given parameter represents the speed of movement of various handling devices, such as forklift truck, pallet truck, or belt conveyor, by means of which we perform transport and handling units manipulations in RFID gate area. In this case, the transport unit is represented by the plastic crate with the tag placed on its front side.
Fig. 7 Definition of the speed of the handling equipment
Source: Authors
Range of the maximum speed of the forklift truck (3.6 – 8.6 m/s) → off scale
0 0,2 0,4 0,6 0,8 1,0 1,2 1,4 1,6 1,8 2,0
Conveyor belt (range from 0.05 – 0.9 m/s) Pallet truck (range from 1.4 – 1.7 m/s)
m/s

-133- II/2014
The analysis of speed values of crate containing tag moving on linear line and their comparison with the speeds of handling units movement is based on the Figure 1, which defines the relationship of pre-defined speeds of laboratory measurement and approximate speeds of selected handling units movement. Maximum speed of object movement that can be reached on linear line is 2.0 m/s; we have tested ten possible variants of speed with the intervals of 0.2 m/s in order to evaluate the change of RSSI value with regards to the speed. Thus, minimum speed of scanned tag movement was 0.2 m/s and maximum speed was 2.0 m/s. For particular handling units speed simulation we give the range of its maximum, or, in case of belt conveyor, standard operation speed. After reaching stated speed, the speed of the object containing tag was in certain part of measurement constant, while the relative distance between the tag and antennas was changing.
Maximum speed of forklift truck movement (it is not in the defined range on Figure 1) is, depending on the type, in the range of 3.6 m/s – 8.6 m/s (13 – 31 km/h); when talking about pallet truck, this speed is limited by maximum walking speed of the operator, that is approximately 1.4 – 1.7 m/s (5 – 6 km/h). Standard operational speed of conveyor belt, depending on frequention of frequency changer, ranges from 0.05 m/s to 0.9 m/s (3 – 54 m/min). Exact specification of individual handling units enables us taking appropriate measures, which could eliminate possible errors and imperfections in processes, during which goods, products, etc. are handled.
3 Simulation of scanning of logistic units using RFID technology
All sets of measurement were performed in the AIDC Lab laboratory at the University of Žilina. The used system included the Motorola FX7400 (4 ports) reader, various number of Motorola AN480 antennas (the combination of different positions of 1 – 3 antennas), and used UHF frequency bandwidth in the range specified for Europe (865.6 – 867.6 MHz). For speeding up and simulation of consignment unit (object containing tag) movement, linear line was used, which was approximately 6 metres long. For the measurement were selected following three different types of tags (see Table 1):
Tab. 1 Specification of the tags used in the measurement
Name Description
Type of tag Dimensions (length x width x height)
Current ID at the time of measurement
TTF M-Prince Tag plastic UHF 90 x 34 x 6 mm 1234 0000 0000 0000 0000 0000 Hella Company sticky tag UHF label 60 x 40 x 1 mm 4830 3130 3431 3731 3730 3037 Alien ALN-9540-02 Squiggle UHF label 97 x 11 x 1 mm E200 3411 B802 0114 1224 4113
Source: Authors

-134- II/2014
During the measurement five test variants with different number and orientation of antennas were realized. Within each variant ten transits were simulated (ten speed levels of linear line as shown on Figure 1) for two positions (horizontal and vertical position at the object) of each of the three tags; RSSI values as well as change of speed in time were recorded (start → acceleration → constant speed → slowing down → stop). Tag was located on front side of the plastic crate and the scanning took place only when moving from the beginning to the end of the linear line.
All antennas of RFID gate had circular polarization and remained static during the measurement; their distance to the object with the tag was changing only as a result of the movement of this object on linear line. RFID gate was located in the middle of total length of linear line (6 metres), in order to ensure sufficient space for moving off and finishing of the object with the tag being scanned, and to prevent scanning immediately after starting corresponding processor of control application (Aton OnID), or after stopping.
Early tag reading (without movement of the crate containing the tag) was ensured also by regulating the power of individual antennas, which was by means of the software reduced to 25% of overall emitting power. The number and placement of antennas, as well as the distance between these antennas and the linear line / tag, the angle between them and horizontal surface / crate with the tag can be seen in the following Table 2, which represent the variants of antennas’ deployment of the tested RFID gate (distinguished by different colours of antennas).
Tab. 2 Specification of variants of antennas’ deployment
Variant Description
A (green colour) One antenna (Antenna 1) at the distance of 1 metre from the linear line (tag) B (blue colour) Two against each other built antennas, each at the distance of 1 metre from the linear line
C (red colour) Two antennas, where Antenna 1 (AN1) is at the distance of 1 metre from the linear line and the second antenna (AN2) is above the linear line at the distance of 1.2 metre from the tag
D (grey colour) Three antennas; the antennas AN1 and AN3 are placed opposite each other at the distance of 1 metre from the linear line and the location of Antenna 2 (AN2) is similar to variant C, above the linear line (1.2 metre distance)
E (black colour) Two against each other rotated antennas (AN1 and AN2), which are inclined at the angle of 45 degrees with respect to the vertical plane
Source: Authors
4 The impact of the change of speed to the errors of scanning
According to recent studies by Hunt, Puglia A. and Puglia M. (2007), Jones and Chung (2008) and also based on physical properties of electromagnetic waves, there were assumptions that first research proposition is true; without the need to perform the

-135- II/2014
measurement. By means of measurement we found out that within speed range from 0.2 m/s to 2.0 m/s, the quantity of tag 1 reading has exponentially leaping course, which was even more noticeable at lower speeds. The quantity of reading is decreasing, while with increasing speed this course becomes even and constant.
4.1 Analysis and evaluation As we can see on the following Figure 2, the change of speed has the greatest
influence on the quantity of reading when comparing the reading by speed 0.2 m/s (v1) and 0.4 m/s (v2), where the loss of read values is nearly 50%, e.g. variant A (vp – vertical position): v1 / 108 values → v2 / 56 values (48% change), variant B (hp – horizontal position): v1 / 83 values → v2 / 44 values (47% change) or variant C (hp): v1 / 60 values → v2 / 31 values (48% change).
Fig. 2 The quantity of reading tag 1 – horizontal and vertical position (variants A, B, C, D, E)
Source: Authors
Despite the fact that according to parameters, tag 1 should have better readability in horizontal plane, best values (greatest quantity of reading) were achieved in vertical position on the crate. In this regard, it is also appropriate to assess the change of the number of reading values that occurred as a result of change in the position and orientation of second

-136- II/2014
antenna between variants B and C (28% decrease of the quantity of values at speed 0.2 m/s). Tag 1 responded to changes relatively less flexibly when distant from the RFID gate (slow change of RSSI with values around –65 to –72) and in case of variant E (vp) (45° orientation of the antennas to the tag, vertical position of tag on the crate) the tag was not scanned at all.
The quantity of reading for tag 2 has again exponentially leaping course depending on the speed, while it decreases continually with increasing speed. This tag from Hella Company responded more dynamically in the electromagnetic field of RFID gate, as well as with change in distance from the antennas, when the quantity of reading at speed v1 both in horizontal and vertical position is greater on average 72% when compared to the first tag (e.g. variant B (vp): v1 (t1) / 91 values → v1(t2) / 305 values (70% increase), variant D (hp): v1 (t1) / 54 values → v1(t2) / 158 values (66% increase) or variant E (hp): v1(t1) / 73 values → v1(t2) / 269 values (73% increase)). Changing the position of second antenna from vertical to horizontal (variant B → variant C) caused about 50% increase in the quantity of reading in horizontal position of the tag and also about 50% decrease in the quantity of reading in vertical position of the tag.
This decrease or increase decreases with increasing speed. According to the estimated orientation of the tag antenna, the readability should be better in the horizontal position of the tag on the crate, but this hasn´t been confirmed by measurement. RSSI values ranged from –53 to –77, when tag already has not responded to antenna signal. In variant E there were no problems with reading of the tag. As in case of previous tags, the quantity of reading of tag 3 has again exponential course, which decreases with increasing speed. Tag 3 has characteristics similar to those of the second tag and it has flexibly responded to the change of distance from the antennas, when maximum values of the quantity of reading are around the value 350. The difference occurs at the RSSI value that is within the range from –43 to –64; when it is exceeded then no more tag is scanned.
Based on these results, the truth of first research assumption, which states that increased speed causes change (reduction) in quantity of tag reading, has been verified. This change in quantity of reading has an exponential course, which in response to the increase of speed is almost constant (at the maximum possible speed of linear path from 1.6 to 2.0 m/s).
The following Figure 3 shows the course of RSSI values depending on time. All values are for horizontal tag 1, but with different variants of antenna position (A, B, C, D and E) and in the time interval of 3 seconds.

-137- II/2014
Fig. 3 The course of RSSI values depending on time – for horizontal tag 1 (variants A, B, C, D, E)
Source: Authors
Y-axis represents the negative value of RSSI; X-axis is the measurement interval of three seconds, when the tag was read. The speed of movement of the object with tag is 1.0 m/s (v5). In the picture we can see that there occurs change in the value of RSSI at the constant speed, therefore second research assumption was not truthful.
4.2 The identification of errors Correction or complete elimination of RFID identifiers scanning errors always
depends on possibilities and conditions of the particular RFID system. Based on performed measurements and gained results, we have defined the following scanning errors:
• wrong position of the tag on the postal crate / wrong orientation of the tag to the antennas
• wrong change of the position or orientation of RFID antennas
• inadequate speed of the movement of the object with tag (too high)
• wrong tag for required speed of the movement
• inadequate or too large antenna performance
5 Conclusions
Correct operation of each RFID system in logistics is influenced by many parameters, which are connected with the requirements for its reliability, accuracy, robustness, as well as easy operability. In practice, it is not always possible to ensure all parameters of the ideal system, as there are negative influences of the setting, as well as technical restrictions leading to various limitations and errors, which have to be taken into consideration. The elimination of these errors or restrictions represents the way of increasing the potential of using modern technologies and contributes to sustaining high standard of products and services, which are dependent on the application of these technologies.

-138- II/2014
In the article, we focused on the simulation of dynamic scanning parameters, which change in dependence on time: the speed of moving object with tag, received signal strength indication (RSSI) value, quantity of reading, etc. The results are comprised of verification of two research assumptions, specification of main scanning errors together with the possible ways of their correction; and partial specification of basic elements and parameters of the RFID system.
Acknowledgements
This article is published within the solution of projects
Internal development competition at University of Pardubice IRS2014/24 – The use of automatic identification technology as a tool for innovation of the subject Mechanization and automation of postal services.
EE2.3.30.0058 – The development of high-quality scientific research team at the University of Pardubice/ ROUTER, reg. no.: CZ.1.07/2.3.00/30.0058.
Support for internships and professional activities in innovation in tertiary education DFJP and FEI University of Pardubice, reg. no.: CZ.1.07/2.4.00/17.0107 in the Team of Technology and Management of Postal Services Sector and Electronic Communications.
4/KS/2014 – Research on the factors affecting the content of transported parcels through sensors of motion, temperature, vibration, and more.
References
[1] HUNT, D. V., PUGLIA, A., PUGLIA. M. RFID: A Guide to Radio Frequency Identification. 1st Edition. New Jersey (United States): John Wiley & Sons, Inc., 2007. ISBN 978-0-470-10764-5.
[2] JONES, E. C., CHUNG. C. RFID in Logistics: A Practical Introduction. 1st Edition. Boca Raton, Florida (United States): CRC Press - Taylor & Francis Group, 2008. ISBN 978-0-8493-8526-1.
[3] KAUR, M., SANDHU, M., MOHAN, N., SANDHU, P. S. RFID Technology: Principles, Advantages, Limitations & Its Applications. International Journal of Computer and Electrical Engineering. 2011, 3 (1), s. 151-157. DOI: 10.7763/IJCEE (ISSN 1793-8163).
[4] NAGY, Ľ., KARÁSEK, J., HOLEŠINSKÝ, P. Localization based on RSSI method. Elektrorevue. 2010, 12 (4). DOI: 55-1-55-6. (ISSN 1213-1539).
[5] VACULÍK, J., KOLAROVSZKI, P., TENGLER, J. Radio Frequency identification from system to applications: Possibility of RFID in conditions of postal operators. InTech. Rijeka: Croatia, 2013. s. 397–450.

-139- II/2014
Resume
The aim of the research presented in this paper is to find possible ways of corrections of errors and scanning of static RFID identifiers, which are located on dynamically moving logistic transport units. The main reason for examination of these issues and for its testing is looking for solutions, which will be able to improve current systems of automation and processing of consignments, goods and material, increase in accuracy and reliability. Laboratory measurement includes simulated operation parameters of the real RFID gate, as well as machine equipment of the logistic chain, such as conveyor belt, pallet truck, and forklift truck. Combination of these devices and RFID gate, together with the need for performing scanning and identification of particular goods and material create specific conditions for the formation of the bottleneck, which subsequently needs to be eliminated; or set the rules for its 100% use.
Key words
Dynamic movement, conveyor belt, logistic unit, radio frequency identification, tag
Ing. Daniel Zeman, Ph.D.
University of Pardubice
Jan Perner Transport Faculty
Department of Transport Management, Marketing and Logistics
e-mail: [email protected]
Ing. Jiří Tengler, Ph.D.
University of Žilina
Faculty of Operation and Economics of Transport and Communications
Department of Communications
e-mail: [email protected]
doc. Ing. Libor Švadlenka, Ph.D.
University of Pardubice
Jan Perner Transport Faculty
Department of Transport Management, Marketing and Logistics
e-mail: [email protected]
LOGI
Scientific Journal on Transport and Logistics
II/2014
Published by Institut Jana Pernera, o.p.s., 2014
and
Institute of Technology and Business in České Budějovice
Printed by TRIBUN EU, Brno
ISSN 1804-3216