university of rwanda-huye campus college of …
TRANSCRIPT

UNIVERSITY OF RWANDA-HUYE CAMPUS
COLLEGE OF BUSINESS AND ECONOMIC
MBA-FINANCE
ACADEMIC YEAR 2013/2014
.
.
Management Research Project Submitted to the
College Of Business and Economics in Partial
Fulfillment for the Award, Masters of Business
Administration (MBA), Finance of the
University of Rwanda
By: ISHAAZI SHARON
REG No: PG112001057
SUPERVISOR: Dr. BARAYANDEMA Jonas
Huye, July, 2014
THE IMPACT OF WORKING CAPITAL MANAGEMENT ON
PROFITABILITY OF A SMALL AND MEDIUM ENTREPRISE IN
RWANDA
Case study - Nyirangarama Enterprise
(Period of study 2009 - 2012)

ii
DECLARATION
Student‟s declaration
This research project is my original work and has not been presented for a degree in any other
university.
Sign: .......................................... Date: ..........................
ISHAAZI SHARON

iii
APPROVAL
This is to certify that this dissertation has been submitted with my approval as Supervisor.
Dr Jonas BARAYANDEMA
--------------------------
Date and signature

iv
DEDICATION
This work is first dedicated to Almighty God for his grace to me and for protecting me day and
night, to my parents and to my much loved family who struggle along with me so as to lead me
to the success.
I dedicate this Work to Inge Beekman and Late Jan Brandt as a recognition for their generous
heart and for every unforgettable thing they have done for me since my earlier childhood up to
date, to all my former class mates for everything I accomplished with them and the rest of the
entire community of University of Rwanda as whole, particularly the management team and the
academic staff.

v
ACKNOWLEDGEMENT
I am pleased to address my thanks to the entire community of University of Rwanda, my
classmates and everyone for the contribution or assistance for this course.
Great thanks to my supervisor Dr Jonas BARAYANDEMA, for his gratitude guidance and moral
support during my thesis writing.
My special thanks go to University of Rwanda, specifically to Huye Campus for having granted
me the precious opportunity to conduct my academic thesis within the above mentioned
Institution.
.

vi
TABLE OF CONTENTS
DECLARATION....................................................................................................................................... ii
APPROVAL ............................................................................................................................................. iii
DEDICATION .......................................................................................................................................... iv
ACKNOWLEDGEMENT ......................................................................................................................... v
TABLE OF CONTENTS .......................................................................................................................... vi
LIST OF ABBREVIATION AND ACRONYMS ..................................................................................... ix
LIST OF TABLES ..................................................................................................................................... x
LIST OF FIGURE ..................................................................................................................................... xi
LIST OF EQUATIONS ........................................................................................................................... xii
ABSTRACT ........................................................................................................................................... xiii
CHAPTER ONE: GENERAL INTRODUCTION .................................................................................... 1
1.1 Background of the Study .................................................................................................. 1
1.2 Statement of the problem ................................................................................................. 3
1.3 Objectives of the study ..................................................................................................... 4
1.3.1 General objective ...................................................................................................... 4
1.3.2 Specific objectives .................................................................................................... 4
1.4 Research questions ........................................................................................................... 4
1.5 Research hypothesis ......................................................................................................... 5
1.6 Scope of the study ............................................................................................................ 5
1.7 Significance of the study .................................................................................................. 5
1.8 Organization of the study ................................................................................................. 5
CHAPTER TWO: LITERATURE REVIEW ............................................................................................ 6
2.1. Introduction ...................................................................................................................... 6
2.1.1. Working Capital Management .................................................................................. 6
2.1.2. Small and Medium Enterprises ................................................................................. 7
2.1.3. Profitability ............................................................................................................... 7
2.2. Concept of Working Capital ............................................................................................. 7
2.2.1. Working Capital ........................................................................................................ 7
2.2.2. Position of Capital..................................................................................................... 8
2.2.3. Capital of the Business.............................................................................................. 8
2.2.4. Working capital can be classified .............................................................................. 9

vii
2.2.5. Working Capital Characteristics of Different Business .......................................... 10
2.2.6. Determination of Working Capital .......................................................................... 10
2.2.7. Approaches to Working Capital Management .........................................................11
2.3. Profitability Concept. ..................................................................................................... 18
2.3.1. Profitability measures ............................................................................................. 18
2.4. Impact of Working Capital Management on Profitability .............................................. 22
2.5. Challenges faced by Small and Medium Enterprises in Rwanda................................... 24
CHAPTER THREE: METHODOLOGY ................................................................................................ 25
3.1. Introduction .................................................................................................................... 25
3.2. Research design .............................................................................................................. 25
3.3. Study Population ............................................................................................................ 25
3.4. Research instrument ....................................................................................................... 25
3.5. Data gathering procedures .............................................................................................. 25
3.6. Administration of the Interviews and Financial Records ............................................... 25
3.7. Data analysis .................................................................................................................. 26
3.8. Ethical consideration ...................................................................................................... 26
CHAPTER FOUR: DATA ANALYSIS DISCUSSIONS AND INTERPRETATION ............................. 27
4.1. Introduction .................................................................................................................... 27
4.1.1. URWIBUTSO Enterprise's Historical and Evolution ............................................. 27
4.2. Analysis of the financial performance of Urwibutso enterprise .................................... 28
4.2.1. Analysis of Products and Sales of Urwibutso Enterprise. ...................................... 28
4.2.2. Evolution of Sales of Akabanga Pepper from 2009 to 2012. .................................. 29
4.2.3. Evolution of sales of Agashya Juice from 2009 to 2012. ....................................... 29
4.2.4. Evolution of sales of Banana Wine called Akarusho from 2009-2012 ................... 30
4.2.5. Evolution of Sales of Bakery Products from 2009 -2012. ...................................... 31
4.2.6. Evolution Sales of Kimaranzara restaurant service from 2009 to 2012 ................. 31
4.2.7. Analysis of working capital management in urwibutso enterprise. ........................ 32
4.2.8. Current liabilities items ranked in percentage ........................................................ 34
4.2.9. Techniques for effective Working Capital management ......................................... 35
4.2.10. Cash Budgeting/ management technique ............................................................ 35
4.2.11. Inventory Management ....................................................................................... 36
4.2.12. Profit analysis ...................................................................................................... 36
CHARPTER FIVE: CONCLUSION AND RECOMMENDATION ...................................................... 38
5.1. Introduction .................................................................................................................... 38

viii
5.2. Conclusions .................................................................................................................... 39
5.3. Recommendations .......................................................................................................... 40
5.3.1. Recommendations to URWIBUTSO Enterprise ..................................................... 40
5.3.2. Recommendation to stakeholders in the SMEs sector ............................................ 40
5.3.3. Recommendations to the Rwandan government ..................................................... 40
5.4. The impact of working capital management of SMEs in Rwanda ................................. 41
5.5. Contribution to Knowledge and Practice ....................................................................... 42
5.6. General Conclusion ........................................................................................................ 43
REFERENCES ........................................................................................................................................ 44

ix
LIST OF ABBREVIATION AND ACRONYMS
WCM: Working Capital Management
RDB: Rwanda Development Board
SME: Small and Medium Enterprise
GWC: Grossing Working Capital
CA: Current Asset
EOQ: Economic Order Quantity
JIT: Just in Time
COD: Cash on Delivery
CBD: Cash before Delivery
ROA: Return on Asset
ROE: Return on Equity
EBIT: Earnings Before interest and Taxes
ISO: International Standard Organization
RWF: Rwandan Francs
DTO: Debtors Turnover Ratio
CTO: Creditors Turnover Ratio
ITO: Inventory Turnover Ratio
CR: Current Ratio

x
LIST OF TABLES
Table 1: Key Current Assets and Liabilities. .................................................................................. 9
Table 2: Sales evolution of Akabanga Pepper product, during the period 2009-2012 Rulindo,
2012,.............................................................................................................................................. 29
Table 3: Table showing the Evolution of sales of Agashya Juice from 2009 to 2012 .................. 29
Table 4: Evolution of sales of Banana Wine called Akarusho from 2009-2012 ........................... 30
Table 5: Table showing the Evolution of Sales of Bakery Products from 2009 -2012 ................. 31
Table 6: Showing the Evolution Sales of Kimaranzara restaurant service from 2008 to 2011 .... 31
Table 7: Showing current assets items ranked in percentage ........................................................ 32
Table 8: Showing Current liabilities items ranked in percentage ................................................. 34
Table 9: Evolution of Net Profit in Urwibutso industry from 2009-2012(amount in Rwf) .......... 36
Table 10: Evolution of Turnover in urwibutso industry from 2009-2012 (amount in Rwf) ......... 37

xi
LIST OF FIGURE
Figure 1: Theoretical Framework of Working capital management and Profitability. ................... 4
Figure 2: Showing the Capital of the Business Frank and Fabozzi (2003) .................................... 8

xii
LIST OF EQUATIONS
Equation 1: Grossing Working capital ............................................................................................ 9
Equation 2: Total conversion cost per period can calculated by the use the formula, .................. 13
Equation 3: Miller-Orr model ....................................................................................................... 14
Equation 4: Accounts receivable period payment period ............................................................. 17
Equation 5: Rate of return ............................................................................................................. 18
Equation 6: Profit Margin ............................................................................................................. 19
Equation 7: Return on Assets ........................................................................................................ 19
Equation 8: Return on Equity ....................................................................................................... 19
Equation 9: Basic Earning Power ................................................................................................. 20
Equation 10: Gross profit margin.................................................................................................. 20
Equation 11: Net profit margin ..................................................................................................... 20

xiii
ABSTRACT
Working Capital Management affects the Profitability of a small and medium enterprise in
Rwanda. Generally working capital consists of various components of current assets like
inventories, bills, receivables, debtors, cash and bank balances and prepaid expenses. This
implies that enterprises main target is making profits and this can only be successful if working
capital concepts stated are fully managed.
This research aims to analyze the significant effect of working capital management on
profitability of an enterprise in Rwanda.
Working capital management affects profitability and this leads to development of an SME.
Therefore what is the level of managing all the components of managing capital in SMEs? How
does each relate to the other? What is the correlation of their relationship impact the success of
the business entity? This indicates that there is a gap for appropriate management of capital in
SMEs, what can be done to enlace working capital management and all its components in
growing SMEs?

1
CHAPTER ONE: GENERAL INTRODUCTION
1.1 Background of the Study
The term working capital management is globally a business technique for financial
management; it is illustrated in many ways and included in the daily assignments of a financial
manager. Working capital management has got main objectives that need effective management
at all levels such as current assets and current liabilities and the adequate maintenance of both
amounts of currents assets and current liabilities. Working capital has got components like cash,
inventories, receivables and payables of which, all these should be appropriately managed for a
successful enterprise. Working Capital management mainly focuses on four principals‟ types of
current assets, Inventory, accounts receivables and cash balances (Myers Allen, 2011).
Working capital is the capital that managers can immediately put to work to generate the benefits
of capital investments. Short-term, or current, assets and liabilities are collectively known as
working capital Brealey Myers (2011).
According to Fabozzi (2003) a corporation invests in long -term assets such as plant and
equipment and short term assets such as cash, accounts receivable, inventory and marketable
securities. Frank (2003) refers to short-term assets as working capital, since there are put to
work, to generate sales that result to cash flow which ultimately generates profits.
Working Capital is composed of two types of working capital, temporary and permanent working
capital of which all are illustrated and managed differently to maintain the success of the
business Fabozzi (2003).
Further Frank (2003) suggests here that anecdotal evidence that working capital management
results to the success of a business entity, how to operate, components, structures and how to
manage whatever capital available and the different sources of capital.
Paramasivan and Subramanian (2009) argues that small business financial manager must look at
financing their working capital as a long range continual process. Financial managers spend

2
most of their time and energy financing their enterprises than marketing and selling their
products and services.
According to Michael & Nichols (2007) in either debt or equity financing, the lending sources
will insist that the owner has made a major investment of his or her own asset in the business and
will therefore improvise to the borrower the amount that was requested for, the lending sources
normally calculates the interests, the terms of payment and period of recovering the loan given
out. This is a very smart and good stage for a business starter and the issues normally evolved
around the technique of managing working capital to maintain a profitable enterprise.
Most small and medium businesses only use a 12-months frame of planning their financial
needs, eventually this wastes the business manager`s time, increases the cost of capital or
funding and dilutes eventual ownership (Robert Calvin 2002).
According to the current report from African Development Fund (ADF) through RDB leveraging
capital markets for SMEs financing in Rwanda (2012) Most SMEs remain small in size and they
largely depend on internally generated equity and borrowing.
Therefore financial institutions consider SMEs to be highly risky and the transaction costs of
lending to these institution are considered to be high, particularly quantity business development
services have recommended and introduced, regularization and advancement in support of using
capital markets for financing to SMEs among others have been highly considered. Nevertheless
WCM impacts on SMEs as a turnaround tool to formation of high profits and revenue in
Rwanda. Small businesses are particularly important for bringing innovative products or
techniques to the market. However they are perceived to lack adequate financing nevertheless the
available finances used to run the business (working capital) lack proper management of all the
components of working capital in their relations for a profitable enterprise.
Therefore it is in this regard that proper management of working capital plays abig role for a
profitable entreprise. Working capital management for any growing business is a crucial factor
where by its management at all levels leads to the growth or down fall of an entreprise.

3
In this regards, this research seeks to analyze the impact of working capital management on
profitability of SMEs in Rwanda.
1.2 Statement of the problem
Working capital management involves the set control of the inflow and outflow of cash, as for
the entire management of all activities in an enterprise. Capital being the initial value that
upholds the success of an enterprise. There is need to acknowledge the component relationship of
working capital management as the impact to profitability in SMEs.
Working capital management relates to profitability and this leads to development of an SME,
growing capital, and opening up of new other branches hence business booming. For a profitable
enterprise working capital management is the major technique to apply because it lines with the
management of cash, inventory, payables and receivables.
However profits can only be analyzed when working capital concepts are fully managed in
SMEs. Initially if cash, inventory, payables and receivables are not fully managed profits cannot
be gained; results to failure, growing debts, accumulating expenditures and loss of assets. This
implies that there would be an issue of high cash outflows compared to cash inflows hence
closure of the enterprise with heavy debts.
Therefore what is the level of managing all the components of managing capital in SMEs? How
does each relate to the other? What is the correlation of their relationship impact the success of
the business entity? This indicates that there is a gap for appropriate management of capital in
SMEs, what can be done to enlace working capital management and all its components in
growing SMEs?
.The research study will be carried out from a selected SME in Rwanda, How the concept of
working capital management is applied, whether there are profits or in particular if this SME is
successful or not, their level of managing WC and appropriate measures and recommendation for
a profitable enterprise in Rwanda.

4
1.3 Objectives of the study
1.3.1 General objective
This study aims at analyzing how working capital management affects the profitability of SMEs.
1.3.2 Specific objectives
To carry out the study, the following specific objectives will be achieved:
1. To analyze the impact of working capital management on profitability in SMEs
2. To find out challenges encountered by SMEs in working capital management
3. To formulate recommendations on improvement of working capital management in
SMES
Figure 1: Theoretical Framework of Working capital management and Profitability.
The theoretical frame work; Working capital management rolls directly to the control set ups and
systems of proper accounting measures of managing all activities in business of which include
managing components, cash, inventory, accounts receivables and accounts payables of which
lead to the growth rate in sales in a business, gaining of profits and also improve the rate of
shareholders wealth as well as growth of the enterprise.
Profitability for that matter depends on the level of working capital management measures put in
place of an enterprise. Profitability in business is one of the major targets in business.
1.4 Research questions
The research questions for which the study will seek to answer are:
What is the impact of the working capital management on profitability of SMEs in Rwanda?
What are the challenges encountered by SMEs in managing their working capital?
Working capital management
Cash
Inventory
Accounts receivable
Accounts Payable
Profitability:
Profit
Sales
Shareholders wealth
Growth of the Enterprise

5
1.5 Research hypothesis
H1: Working capital management has a significant impact on profitability of SMEs in Rwanda.
H2: Challenges encountered by SMEs in managing their working capital
1.6 Scope of the study
This study will be taken from SME around Kigali through analyzing their working capital
management in relation to the profitability of their business. This scope is initially selected to
further research whether in the main capital where market is available and more booming
compared to other districts, population sizes among others if working capital concepts are
managed.
1.7 Significance of the study
In Rwanda, the concept of enterprising is growing, this implies that less is known and a lot needs
to be disclosed in the Rwandan context. This study will contribute to the extension of the
existing knowledge and literature related to the field of the study. It will be done by means of
investigation into small business managers‟ level of managing the available capital and the level
of profitability in SMEs so as to establish the relationship between the two. Policy makers and
decision makers (government) in financing small businesses or growing enterprises will also rely
on findings.
1.8 Organization of the study
The thesis will be organized as follows:
Chapter 1will contain the background, the statement to the problem, objectives, research
questions, hypothesis, the significance, the scope, limitations and the organization of the study.
Chapter 2will deal with relevant theories related to the topic of the study.
Chapter 3will lay out the appropriate methodology that will be followed during the study.
Chapter 4will use qualitative and quantitative techniques to analyze collected data and interpret
the results thereof.
Chapter 5the consistency of the results will examine from the literature review and
methodology.

6
CHAPTER TWO: LITERATURE REVIEW
2.1. Introduction
In this chapter, this research reviews literature relates to management of working capital in small
and medium enterprise and the level of its management in relation to their business financiers.
2.1.1. Working Capital Management
Osisioma (1997) explains working capital management as the regulation, adjustment, and control
of the balance of current assets and current liabilities of a firm in that maturing obligation are
met, and the fixed assets are properly serviced. In order to manage working capital efficiently,
there must exist two elements as necessary components and desirable quantities.
Shin and Soenen (1998), points out that a firms working capital results from the time lag
between the expenditure for the purchase of raw materials and the collection from sale of
finished goods.
According to their submission, this entails various areas of company‟s operational management
that includes receivables, inventories management, management and use of trade credit.
Also Ross (2008) adds that, these three components and how they are managed, determines some
of a company‟s most vital financial ratios, e.g. the „inventory turnover, the „average collection
period and the „quick ratio.
Hence, (García and Martínez, 2008) assert that, working capital management reflects a firms
short-term financial performance. Given that current assets usually account for more than half of
a company‟s total assets and owing to the fact that this investment tends to be relatively volatile
the management of working capital deserves special attention.
Although working capital management is the concern of all firms, it is the small firms that
should address this issue more seriously. Given their vulnerability to a fluctuation in the level of
working capital, they cannot afford to starve of cash. The study undertaken by Peel et al., (2000)
revealed that small firms tend to have a relatively high proportion of current assets, less liquidity,
exhibit volatile cash flows, and a high reliance on short-term debt.

7
2.1.2. Small and Medium Enterprises
CAPMER (2004) notes that, SMEs are businesses which are owned, controlled, and managed by
family members with an annual turnover of 0.3 to 12 million Rwandan Francs. Likewise they
employ workers ranging from 3 to 30, who are semi to skilled laborers owning capital assets of
at least 50 million Rwandan Francs (MINICOM, 2007).
2.1.3. Profitability
After providing operational definitions of key concepts and a brief review of working capital,
profitability of SMEs review is done under the objectives of the study and focuses mainly on
small and medium enterprises working capital management, level of involvement of financing
institutions and other government projects and their relationship with small and medium
enterprises under the study in operation. Documentation such as policy documents, reports,
library (books, magazines, scholarly publication and seminar papers,) and surfing of relevant
websites will facilitate the review.
2.2. Concept of Working Capital
2.2.1. Working Capital
Working capital is the capital which is needed to meet day to-day transactions of the business
concern in that this may cross working capital and networking capital. Working capital consists
of various components of current assets like inventories, bills, receivables, debtors, cash and
bank balances and prepaid expenses.
Brealey Myers Allen (2011) states that management of short-term assets and Liabilities are
collectively known as Working capital. Net working Capital is equal to current assets less current
liabilities.
Hillier and Ross (2010) also says, Net working Capital is current assets minus currents liabilities,
Net working capital is positive when current assets are greater than current liabilities. This
implies that the cash that will become available over some period will be greater than the cash
that must be paid out.
Paramasivan and Subramanian (2009) states that working capital is needed to meet a number
of purposes that include: Purchase of raw materials, Payment of wages to workers, Payment of
day to day expenses, Maintenance expenditure etc.

8
2.2.2. Position of Capital
Working Capital in many different ways;
Working capital means Current Assets.
The sum of currents assets is the working capital of a business
Working capital refers to firm`s investments in short- term assets, cash, short-term securities,
accounts receivables and inventories.
Figure 2: Showing the Capital of the Business Frank and Fabozzi (2003)
2.2.3. Capital of the Business
Frank and Fabozzi (2003) stated that working capital is the capital managers can immediately put
to work to generate the benefits of capital investment. He further defines working capital as
current capital or circulating capital. Firms invest in current assets for the same reason they
invest in long term, capital assets, to maximize owner`s wealth.
Hiller, Ross and Westerfield (2010) working capital is referred to as net working capital and an
important part of any capital budget analysis.
An investment in net working capital arises whenever;
a) Inventory is purchased
b) Cash is kept in the project as a buffer against unexpected expenditure
c) Credit sales are made, generating trade receivables rather than cash
d) Investment in net working capital is reduced by credit purchases, which generate trade
payables.
Investment in net working capital represents cash outflow because cash generated elsewhere in
the firm is tied up in the project.
9
2.2.4. Working capital can be classified
Working capital is classified with the help of two important concepts,
a) Grossing Working capital is the general that determines the working capital, this is
capital invested in total current assets of the business concern.
Equation 1: Grossing Working capital
GWC= CA
b) Net Working capital is the specific concept that determines both current assets and
current liabilities of the concern.
Net working capital is the excess of current assets over the current liabilities of the concern
during a particular period.
As for Paramasivan and Subramamian (2009) if the current assets accessed the current liabilities
it is said to be positive working capital, it is reverse, it is said to be negative working capital.
Working capital is termed as part of capital which is needed to meet day to day requirement of
the business concern. For example it required to pay off creditors, salary paid to workers,
purchase of raw materials and so and so forth. It consists of recurring in nature and it can easily
be converted into cash hence termed as short- term capital.
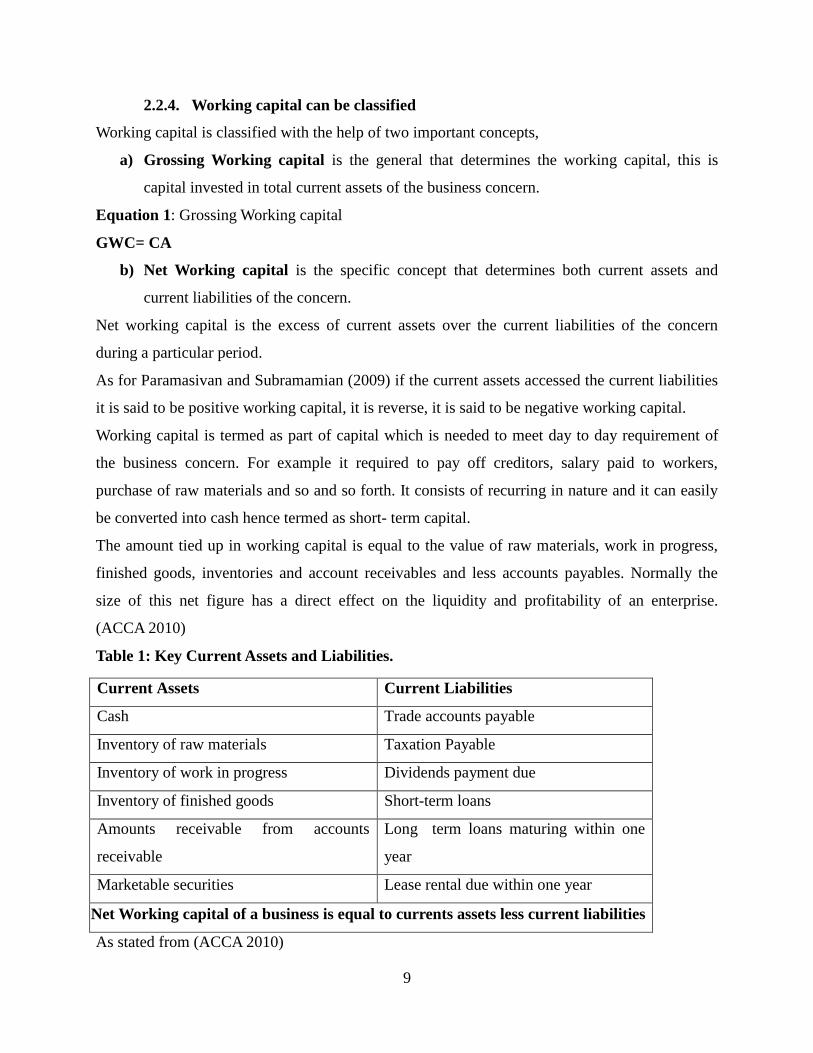
The amount tied up in working capital is equal to the value of raw materials, work in progress,
finished goods, inventories and account receivables and less accounts payables. Normally the
size of this net figure has a direct effect on the liquidity and profitability of an enterprise.
(ACCA 2010)
Table 1: Key Current Assets and Liabilities.
Current Assets Current Liabilities
Cash Trade accounts payable
Inventory of raw materials Taxation Payable
Inventory of work in progress Dividends payment due
Inventory of finished goods Short-term loans
Amounts receivable from accounts
receivable
Long term loans maturing within one
year
Marketable securities Lease rental due within one year
Net Working capital of a business is equal to currents assets less current liabilities
As stated from (ACCA 2010)

10
2.2.5. Working Capital Characteristics of Different Business
Different businesses normally have different working capital characteristics and there are three
main aspects to these differences;
a) Holding inventory (from their purchase from external suppliers through the production
and warehousing of finished goods, up to the time of sale)
b) Taking ltime to pay supplier and other accounts payable
c) Allowing customers (accounts receivable) time to pay.
Management of accounts receivable, accounts payable and inventory deals with specific
techniques that include overall credit control policies.(Should the business offer credit, if so,how
much and to whom) and ensuring amounts owned are not excessive. Whistling working through
to manage available capital, one tries not to think accounts receivable and accounts payable in
isolation; they are part of working capital, each element will have a knock –on effects when there
is a change in another. For example, an increase in the credit period taken by accounts receivable
will reduce the amount of cash available to pay accounts payable and invest in inventory and this
will affect the success of the business positively or negatively (make a profit or loss).
2.2.6. Determination of Working Capital
Paramasivan and Subramanian (2009) there are factors that determine working capital, Working
capital requirements depends on various factors which determine working capital requirement
and these include;
Nature of the Business: working capital of a business depends upon the nature of the business.
If the business concerns follow rigid credit policy and sells goods only for cash, they can
maintain lesser amount of working capital.
Production cycle: working capital of a business depends upon the length of the production
cycle. If the production cycle length is small, they need to maintain lesser amount of working
capital, if it is not, they have to maintain large amount of working capital.
Business cycle: working capital here also depends upon the fluctuation that lead to cyclical and
seasonal changes in the business condition and it will affect the requirements of the working
capital. When condition are booming, Working Capital requirement is larger and in the
depression condition, requirement of working capital will reduce. Better business results lead to
increase the working capital requirements.

11
Production cycle; this is one of the factor s that affect working capital requirement of the
business concern. When a company maintains the production policy, there is a need of regular
working capital. If the production policy of the company depends upon the situation or condition,
working capital requirements will depend upon the conditions laid down by the company.
Credit policy; credit policy of sales and purchases also affect the working capital of the business
concern. When a company maintains liberal credit policy to collect payments from its customers,
they have to maintain more working capital and if the company pays the dues on the last date it
will create the cash maintenance in hand and bank.
Growth and Expansion; During growth and expansion time of the business , working capital
requirements are higher due to the need of additional working capital and incurs some extra
expenses at the initial stages.
Availability of raw materials; working capital also depends largely on the availability of raw
materials, raw materials are the basic components of the production process. If raw materials are
not available it leads to production stoppage.
Earning capacity; when the business consists of higher level of earning capacity, they can
generate more working capital with the help of cash from operation.
2.2.7. Approaches to Working Capital Management
Management of working capital and its main objective is to manage current assets and currents
liabilities effectively and to maintain adequate amount of both current assets and current
liabilities.
Normally working capital consists of various compositions of currents assets such as inventories
„2bills, receivables, debtors, cash and bank balances and prepaid expenses. Paramasivan and
Subramanian (2009) referred to management of working capitalwith the components of working
capital like cash, bank balance inventory, receivables, payables, overdraft and short-term loans.
Working Capital Management being one of the most important parts of financial management it
is concerned with the short – term Finance of the business concern which is closely related trade
between profitability and Liquidity.
The study of working capital management is not only an important part of financial management,
but also are overall management of the business concern Paramasivan and Subramanian (2009).
When it comes to business concern ones either makes profit or loss therefore for one to have
profits, control setups of managing working capital appropriately leads to the profitability and

12
success of an enterprise. Working capital is normally described as the capital which is not fixed
but the more common uses of the working capital is to consider it as the difference between the
book value of current assets and current liabilities.
Working capital management provides simple terms as,
1. The amount of capital needed to carry on a business.
2. Accounting. Current assets – Current liabilities.
3. Liquid capital assets as distinguished from fixed capital assets.
Working capital management ensures a company has sufficient cash flow in order to meet its
short- term debt obligation and operating expenses.
Working capital measure both a company`s efficiency and its short-term financial health. The
working capital ratio is calculated as; positive working capital means that the company is able to
pay off its short-term liabilities. Negative working capital means that a company currently is
unable to meet its short-term liabilities with its current assets (cash, accounts receivables and
inventory) (Michael & Nichols, 2007).
If a company`s current assets does not exceed its current liabilities, then it may run into trouble
paying back creditors in short term. The worst case scenario is bankruptcy. A declining working
capital ratio over a long time period could also be a red flag that warrants further analysis. For
example it could be that the company`s sale volume are decreasing and a s result, its accounts
receivables number continues to get smaller and smaller (Michael & Nichols, 2007).
Working Capital also gives investor an idea of company`s underlying operational efficiency.
Money that is tied up in inventory or money that customers still owe to the company cannot be
used to pay off any of the company`s obligation, if a company is not operating in the most
efficient manner (slow collection), it will show up an decrease in the working capital. This can
be seen by comparing the working capital from one period to another , slow collection may
signal underlying problem in the company`s operations.
As for Brealey Myers (2011) working capital management tends to focus on the four principal
types of current assets that include; management of inventory, accounts receivable, cash balances
and marketable securities.

13
2.2.7.1. Cash management
According to David Hillier, Ross, Jeffery and Jaffe (2010) cash is one of the most important
issues a firm needs to consider. Even though a firm is growing and has excellent performance, if
it runs out of cash then it cannot survive. David states that ` the economic definition of cash
includes, currency, savings account deposits at bank and undeposited cheques. However, cash
management is concerned more with how to minimize cash balances by collecting and
disbursing cash effectively.
Paramasivan and Subramanian (2009) Cash is one of the most important and key parts of current
assets. Cash is the money which the business concern can disburse immediately without any
restrictions. Cash is normally referred to, in terms of coins, currency, cheques held by business
concern and balance in its bank accounts. Therefore its management means the control set up of
the inflow and the outflow with the concerns as planned.
As for Fabozzi (2003) cash flows out of the firm as it pays for goods and services it purchases
from others and in other wards cash flows into the firm as customers pay for the goods and
services they purchase. Therefore cash management refers to the management of cash inflows
and outflows as well stock of cash on hand.
Brealey Myers (2011) cash management evolves the use of two techniques. Managing cash flow
constitutes two important parts;
a) Speed cash collection
b) Slowing disbursement
Brearley (2011) states that, ` Good cash management implies some degree of centralization. `
Cash management involves the use models used in finance which are called cash management
models. There are three popular finance models which include;
a. Baumal model; its objective is to determine the minimum cost amount of cash
conversion and the lost opportunity cost.
Equation 2: Total conversion cost per period can calculated by the use the formula,
Where; T = Total transaction cash needs for the period
c = Cost per conversion
b = Value of marketable securities

14
b. Miller-Orr model; as suggested by Miller- Orr this model is to determine the optimum
cash balances level which minimizes the cost of management of cash and this can be
calculated with help of a formula;
Equation 3: Miller-Orr model
Where;
C = total cost of cash management
b = fixed cost per conversion
E (M) = expected average daily cash balances
E (N) = expected number of conversion
t = numbers of days in the period
I = lost opportunity cost
c. Orgler`s Model; this model provides for the integration of cash management with
production and other aspects of the business concern. Orgler`s model is formulated
basing on the set of objectives of the firm and specifying the set constrains facing the
firm. Therefore these models can be used in the management cash to determine amount of
funds to transfer in and out of cash.
The connection between investment of working capital and cash can be illustrated by means of
cash operating. This cash operating cycle is the period of time which elapses between the point at
which cash begins to be expanded on the production of the product and the collection of the cash
from a purchaser (ACCA 2010).
The cash operating cycle in a manufacturing business equals;
The average time raw materials remain in inventory
Less the period of credit taken from the suppliers
Plus the time taken to produce the goods
Plus the time taken by customers to pay for the goods.
If the turnover period for inventories and accounts receivables lengthen or the payment period of
accounts payable shortens then the operating cycle will lengthen and the investment in working
capital will increase (ACCA 2010).

15
2.2.7.2. Inventory Management
As for Frank Fabozzi (2003), stock of physical goods for eventual sale, Inventory is raw
materials, work –in- process and finished goods available for sale. There are several reasons for
holding inventory but the most obvious one is that if you sell a product you can‟t transact
business out inventory.l2
Brealey (2011) evaluates that to do business; firms need to reserve raw materials, work in
process and finished goods. Many times inventories are expensive to store and they tie up
capital, inventory management involves trade-off between the advantages of holding large
inventories and the costs. Most firms keep inventories of raw materials, work in process or
finished goods awaiting sale and shipment but many are not obliged to do so. For example, they
can buy materials day by day in regards to the need but they will pay higher prices for ordering
in small lots, and they would risk production delays if the materials are not delivered on time.
This can be avoided by ordering more than the firm`s immediate needs. In addition to this firms
similarly can do away with inventories of finished goods by producing only what they expect to
sell immediately or the next day.
According to Brealey (2011) On the other hand this can also be a dangerous strategy, a small
inventory of finished may mean shorter and more costly production runs, and it may not be
sufficient to meet an unexpected increase in demand.
There are also costs to holding inventories that must be set against the benefits, money tied up in
inventories does not earn interest, storage and insurance must be paid for, and there may be risk
of spillage or obsolescence.
Therefore firms need to strike a sensible balance between the benefits of holding inventory and
the costs. Most companies carry any sort of inventory even if there are inventories of consumable
such as stationary. For a manufacturing business, inventories in form of raw materials, work in
progress and finished goods may account to a substantial proportion of the total assets of the
business.
There are scientific attempts of controlling inventories that may be analyzed include;
The economic order quantity (EOQ) model can be used to decide the optimum order size for
inventories which will minimize the costs of ordering and holding inventories.

16
If discounts or bulk accounts are available, it may b cheaper to buy inventories in large order
sizes so as to obtain the discounts.
Uncertainty in the demand of inventories and /in the supply lead time may lead a company to
decide to hold buffer inventories in order to reduce or eliminate the risk of stock out( running
out of inventories). Uncertainties in demand and lead times taken to fulfill orders mean that
inventory will be ordered once it reaches the re-order level. (Re-order level = maximum usage x
minimum lead time)
Just- in- time (JIT) Procurement, some manufacturing companies sought to reduce their
inventories of raw materials and components to as low a level as possible. Just in time
procurement is term which describes a policy of obtaining goods from suppliers at a latest
possible time (ie when they are needed) and so avoiding the need to carry any materials or
components inventory. (ACCA 2010)
2.2.7.3. Accounts Receivables
Firms allow customers to pay for goods and services at a later date, it creates accounts
receivables and this implies granting credit which is referred to as trade credit. Trade credit is
granted when a customer buys goods or services.
According to Frank J. Fabozzi (2003) Firms extend credit to customers to help stimulate sales.
When a firm extends credit to its customers, it does so to encourage sales of its goods and
services and the most direct benefit is the profit on increased sales.
When a firm has a variable cost margin (that is, variable costs/sales) of 80%, then increasing
sales by $100,000 increases profit before taxes by $200,000. This is illustrated in a way that any
credit has got a cost where by a firm granting credit is forgoing the use funds for a period which
creates an opportunity cost associated with giving credit.
As for Brealey Myers (2011) accounts receivables, companies frequently sell goods and services
on credit so that it may be weeks or even months before the company is paid. These unpaid bills
are shown in the accounts receivables.
This normally involves terms of sale where by not all sales involve credit, like if one supplies
goods at a wide variety of irregular customers you may demand cash on delivery (COD) and if
your product is custom-designed, it may be sensible to ask for cash before delivery (CBD) or to
ask for progress payments as the work is carried out.

17
According to David Hillier, Ross, Jeffery and Jaffe (2010) when it come it comes to credit
management there are terms of sale developed which are referred to as the period for which
credit is granted, the cash discount, and the type of credit instrument. When sales are seasonal a
firm might use seasonal dating.
A trade or account receivable is created when credit is granted; a trade or account payable is
created when a firm is receives credit. And the term `trade credit` refers to credit granted to other
firms.
Accounts receivable normally holds a period which is known as Accounts receivable payment
period or accounts receivable days.
Equation 4: Accounts receivable period payment period
Accounts receivable period payment period =
The trade accounts receivable are not the total figures of accounts receivables in the statement of
financial position, the trade accounts receivable will be itemized in an analysis of the total
accounts receivable in a note to the accounts. (ACCA 2010)
2.2.7.4. Marketable Securities
Marketable securities are referred to as substitute for cash.
This can be illustrated as a process where cash management deals with the storing of excess cash
in an asset that earns a return such as marketable securities as it concerns Fabozzi (2003).
Models of cash management assume that managers stash cash they don‟t need right away into
marketable securities and they later convert them into cash as needed.
Marketable securities are temporary investment. For instance, if short term borrowing is not
possible, or is costly marketable securities can be used. Buy marketable securities if cash flows
exceed outflows. Sell marketable securities when cash inflows are less than outflows.
Marketable securities are stores for cash that is not needed immediately. There are types of
marketable securities including; money marketable security that have little purchasing power risk
according to Fabozzi and they also have less interest rate risk. Among others we have certificate
of deposits, commercial paper, Eurodollar deposits etc.

18
Brealey (2011) states that many money –market investment are pure discount securities, and this
implies they don‟t pay interest. The return difference between the amount you pay and the
amount you receive at maturity. Among others he illustrates the international securities.
Securities that cannot be converted so quickly and cheaply into cash need to offer relatively high
yields.
2.3.Profitability Concept.
Profitability is the degree of uncertainty of that future economic benefits associated with an item
will flow to or from the entity and this is normally judged on the characteristics of the entity`s
environment and the evidence available when financial statements are prepared.( ACCA 2010)
The profitability concept depends on the state growth of a firm. Paramasivan (2009) says that
`profitability of the business concern purely depends on the effectiveness and utilization of the
available funds.
As for Paramasivan and Subramanian (2009) profitable position of a firm is when dividend
decision is build on profitable position of the business concern. That is when the firm earns more
profits and it can distribute more dividends to its shareholders.
High growth rate also indicates profitability of a firm and can therefore disburse dividends
between its shareholders accordingly.
2.3.1. Profitability measures
According to Brealey Myers (2011) profitability should be measured in principle. The easiness is
to compute the true, or economic, rate of return for a common stock that is continuously traded.
It needs recording cash receipts (dividends) for the year, add the change in price over the year,
and divide by the beginning price.
Equation 5: Rate of return
As for Hiller and Ross (2010) Profitability is best-known and more widely used of all financial
ratios. There are intended to measure how effectively the firm uses its assets, and how efficiently
the firm manages its operations. This focuses normally on the net income.

19
He further goes on to say that profitability is determined in three measures, profit margin, return
on assets and return on Equity. Companies pay a great deal of attention to their profit margins.
Equation 6: Profit Margin
A relatively high profit margin according to Hiller and Ross (2010) is obviously desirable and
this corresponds to low expense ratios relative to sale. Lowering sales price usually increase unit
volume but will normally go up or down so the fact that margins are smaller isn`t real bad. Profit
margins are very different for different industries.
2.3.1.1. Return on Assets
Return Assets (ROA) is a measure of profit per asset value.
Equation 7: Return on Assets
2.3.1.2. Return on Equity
Return on equity (ROE) is a measure of how the shareholder fared during the year. Benefiting
shareholders is normally the target; ROE is in an accounting sense the true bottom-line measure
of performance.
Equation 8: Return on Equity
The above measures should properly be called return on book assets and return on book equity.
According to Frank J. Fabozzi (2003) to assess a firm`s operating performance then one wants to
know if it is applying its assets in an efficient and profitable manner. When you asses a firm`s
financial condition, you want analyze if the firm is profitable. This can be through use of
financial ratios by evaluating the aspects of operating performance and financial condition these
include;
2.3.1.3. Return on investment
Return on investment ratios compares measures of benefits, such as earnings or net incomes with
the measures of investment. If you want to evaluate firm`s operation process of its assets,

20
calculate the return on assets known as basic earning power ratio as the ration of earnings before
interests and taxes (EBIT) which is normally termed as operating earnings, to total assets;
Equation 9: Basic Earning Power
2.3.1.3.1. Liquidity
Liquidity reflects the ability of the firm to meet its short term obligations using those assets that
are most readily converted into cash. Assets that are likely to be converted into cash in short
period are known as liquid assets, which are listed in the financial statement as currents assets
which are referred to as working capital.
2.3.1.3.2. Profitability
Profitability ratio helps to gauge how well a firm is managing its expenses. Profit margin ratios
compare components of incomes with sales. This tends normally to focus on the gross profit
(sales less cost of goods sold) comparing gross profit with sales produces the gross profit margin
Equation 10: Gross profit margin
Gross profit margin and operating profit margin reflect a company`s operating performances but
normally do not consider how these operations were financed, to evaluate both, it needs to
compare the net income ( that is earnings after deducting interest and taxes) with sales and obtain
net profit margins.
Equation 11: Net profit margin
2.3.1.3.3. Activity
Activity for most parts turn over ratios can be used to evaluated the benefits produced by specific
assets like inventory, accounts receivables or to evaluate the benefits produced by the totality of
the firm`s assets.

21
2.3.1.3.4. Financial Leverage
Refers to an increased means of accomplishing some purpose. In Finance there are ratios that
asses the level of financial risk when a firm is intending to seek finance its assets either by equity
or debt. Financing a firm with debt legally obligates to pay by interest and to repay the principal
as promised and with equity it is different but obligates dividends to be paid after the discretion
of the board of director, there are always some risk encountered which are termed as financial
risks.
Financial risks are associated with the firm`s ability to satisfy its debt obligation often measured
to which extent debt financing is used relative to equity and this leads to the use of financial
leverage.
There are two types of leverages;
1. Component percentages compare a firm`s debt with either its total capital (debt plus
equity) or its equity capital.
2. Coverage ratios compare a firm`s ability to satisfy fixed financing obligations like
interest, principle repayment or lease payment.

22
2.4.Impact of Working Capital Management on Profitability
The results of the research show that there is a significant impact of the working capital
management on profitability of an SME, Therefore, managers may enhance the profitability of
their enterprises by minimizing the inventory turnover, account receivables ratio and by
decreasing creditors turnover ratios, there is no significant effect of increasing or decreasing the
current ratio on profitability. So, the results indicate that through proper working capital
management SMEs can increase profitability.
An enterprise ought to optimize its liquidity and profitability while conducting its daily business
operations. Working Capital Management contains proportion balance of working capital
European Scientific Journal January 2014 edition vol.10, No 1 ISSN: 1857 – 7881 (Print) e -
ISSN 1857- 7431 375 components i.e. – debtors, inventory and payables and the use of cash
effectively for daily business operations. Proper optimization of working capital balance means
minimizing the working capital requirement and realizing maximum possible revenues Ganesan,
(2007). There is a strong linear relationship between profitability of the firm and its working
capital efficiency. The ability of an enterprise to earn profit can be referred to as the profitability
of its business. Profit is determined by deducting expenses from the revenue incurred in
generating that revenue. The amount of profit can be a good measure of the performance of a
growing enterprise, so we can use profitability as a measure of the financial performance of a
business.
Effective working capital management is very important due to its significant effect on
profitability of an enterprise and thus the existence of that particular business in the market. If it
minimizes its investment in current assets, the resulting funds can be invested in value creating
profitable projects, so it can increase the firm‟s growth opportunities and shareholders return.
However, management can also face liquidity problems due to underinvestment in working
capital. The ability of financial managers to effectively and efficiently manage their receivables,
inventories, and payables has a significant impact on the success of the business and on
profitability as well. The study attempts to enhance the knowledge of companies by identifying
the ways that SMEs manage their working capital in order to increase profitability.

23
Research question: impact of working capital on profitability, there is significant relationship
between profitability (ROA) and working capital management (DTO,CTO, ITO, CR). IB-Key
terms and their definitions Return on assets ratio (ROA): Return on assets is a ratio of net income
(annual) divided by the total assets (average) of a business during its financial year. It explains
the performance and progress of the business in utilizing its resources to generate the income. It
is a profitability ratio. The formula to calculate return on assets is total annual net income divided
by the average total assets during a financial year. Debtors turnover ratio (DTO): It shows how
many times enterprises collect its account receivable. High ratio increases the liquidity of the
company. It calculates by dividing net credit sales by average account receivable. Creditors
turnover ratio (CTO): Accounts payable turnover ratio shows how much credit worthy is the
business.
Inventory turnover ratio (ITO): Inventory turnover ratio may vary significantly from business to
business. A high ratio means fast moving inventories and a low ratio means slow moving or
obsolete inventories in hand. A low ratio can also be the result of maintaining excessive amount
of inventory needlessly. Maintaining excessive inventories means tidying up the capital that
could be used in other profitable operations. Therefore, the formula for calculating inventory
turnover ratio is sales divided by inventory. Current Ratio: Current ratio is the ratio of current
assets of a business to its current liabilities. It is the most commonly used method for testing the
liquidity of a business and measures the ability of a business to repay its short term debts. Hence,
the formula for calculating current ratio is current assets divided by current liabilities of a
particular financial year. Current ratio should be greater than 1. Current ratio below 1 shows
critical liquidity problems faced by the business because it shows that the total amount of current
liabilities are more than the total amount of current assets and that the business is not in the
position to pay its short term debts. Abnormally, high current ratio may be the result of
underutilized resources in the business.

24
2.5.Challenges faced by Small and Medium Enterprises in Rwanda.
There is a high rate of growth in SMEs never the less there are still some hindrances to the
desired level especially in many low developed centers.
Due to different factor in and around these growing SMEs, they are faced with some challenges
that include;
a. Limited knowledge about SME management and its daily operations of their account, the
entire SMEs business.
b. Majority of the growing SMEs, ignore the procedures of working papers, documentation
of key issues to access loans from banks that giving them loans for their businesses.
c. Poor presentations of their daily operation and flow up of the key requirements, how to
manage monthly cash flows, maintain accurate book of accounts for the entire business
that is continuously maintained.
d. There is the issue of finding customers for the particular business that affects the growth
of the SMEs, for development.
e. There is high increasing rate of competition in the growth of SMEs today and high
interest rate based of insufficient capital.
f. Due to the issue of increase of competition, there normally face the challenge of access to
finances or capital hence failure to development.
g. In the same range majority of the SMEs that access the finances face the challenge of
managing loans given and this leads to failure of the business.
h. SMEs growth on another point are usually faced with the challenge of where by their lack
awareness of what business to deal with, particular goods or services to do that‟s
indicates the availability of customers.

25
CHAPTER THREE: METHODOLOGY
3.1. Introduction
The methodology applied for this research is through financial data collections, measurement of
variables and data analysis for financial statements and balance sheet period 2009 2012, from
Nyiragarama enterprise for the study.
3.2. Research design
A cross sectional design is used together with the research design to answer the research
questions. In order to obtain reliable and representative study results within the limited time, this
study is designed as the secondary data in nature. The survey was designed mainly through the
financial managers of small and medium enterprise including managers of the supporting
financial institutions like banks, microfinance and supporting government Institutions.
3.3. Study Population
The population was consisted of manufacturing small and medium enterprise operating from
most around Kigali. Nyiragarama enterprise is in different sectors including manufacturing,
Agricultures, furniture among others in Rwanda.
3.4. Research instrument
The researcher will use an interview and analyzing documentary review as instruments of data
collection. Interview will be designed for Rwandan financing Institutions, government projects,
managers and owners of SMEs including other association authorities.
3.5.Data gathering procedures
During the research period, the researcher will seek for the authorization to conduct study from
respondents‟ institutions and thereafter, contacts will be made and interviews will be conducted
for data collection. After having collected data, the researcher will proceed with editing, coding
and tabulation for better data analysis which will end up with writing and defending final report.
3.6. Administration of the Interviews and Financial Records
Before the administration the researcher will seek a recommendation letter from UR/Huye
Campus and an authorization to conduct the study from the respondents‟ institutions. Then the
researcher will select research assistant who will assist in administering what will be provided to
them. Thereafter, the researcher and his assistants will make retrieval of the information given as
required by the supervisor.

26
3.7. Data analysis
Data analysis will be done using financial records after collecting data, the researcher will
organize all financial records and interview sets for validation and checking purpose. Questions
will be coded and data entered into computer system. Processed data will be stored in form of
tables and charts from which meaningful information will be produced.
3.8. Ethical consideration
During the research period, the researcher will seek the authorization to conduct the study from
respondents‟ institutions and the consent of the respondents. The researcher has no intention
whatsoever to reveal the source of confidential information that will be obtained through the
research. The researcher will be guided by integrity, respect towards respondents, humility and
neutrality during the research by ensuring the confidentiality and neutrality to respondents. In
order to be available after the research for whoever interested by the findings the researcher will
provide required contacts.

27
CHAPTER FOUR: DATA ANALYSIS DISCUSSIONS AND
INTERPRETATION
4.1. Introduction
This chapter presents a comprehensive analysis and the discussions of the results as obtained
from various interviews held with a few different business sectors in Rwanda. The design of the
analysis it elaborates the summarized answers of the study interviewed questions and financial
records analyzed that were stated before in chapter one. Each research question will be answered
and discussed by the results obtained from the data analysis appropriate for each question.
4.1.1. URWIBUTSO Enterprise's Historical and Evolution
URWIBUTSO Enterprise started in 1983 by a young and dynamic Rwandan man with one
employee as compared to 421 employees today. It uses local human capacity and resources to
develop business that benefits over 3000 families. URWIBUTSO means something to remember.
It started with a small shop located in Ruhengeri or current Musanze and the bakery started
working in 1985 at Nyirangarama.
At first SINA Gerard offered free beef stews and bread to travelers and drivers with the aim of
allowing them to taste his products. Later in 1993 after 10 years in business experience, SINA
Gerard legally registered his business under the name of URWIBUTSO delivered from people
who taste his beignet or amandazi.

28
4.2. Analysis of the financial performance of Urwibutso enterprise
Analysis of the financial performance of urwibutso enterprise
In 1996, the enterprise diversified its activity portfolio and is oriented towards agro pastoral
activities (passion fruits, banana and pineapple, red and yellow pepper, cattle farming, pig). In
1998, as producer of great quantity of fruits particularly passion fruit, commercialized at a weak
price on national market, the producer has taken a decision of introducing his proper little unit of
production of commercialized juice under the mark Agashya.
In 1999, the carpentry workshop opened in URWIBUTSO with the major aim of developing
skills of the local people engaged in carpentry. Enterprise URWIBUTSO provided trainings to
over 200 workers in carpentry workshop. Today carpentry workshop competes with other
companies once there is bidding for any market nationally and many occasions, they have been
successful.
In 2002, the enterprise began the production of banana beer called Akarusho and the condition of
natural honey. In 2003, the enterprise introduced on the market red and yellow pepper called
Akabanga. In 2004, the enterprise began the construction and public work activities. In 2006, Mr.
SINA Gerard received award in Frankfurt.
In 2007, the business of URWIBUTSO Enterprise was certified by the International Standard
Organization (ISO) hinged on achievement of adding value to local raw agricultural products
such as fruits and vegetables.
The major focus however, was to produce and process organic fruit and vegetable product in
Rwanda.
4.2.1. Analysis of Products and Sales of Urwibutso Enterprise.
In this section we are making an analysis on the products and their sales at Urwibutso Enterprise.
Urwibutso has different products which are: AKABANGA, AGASHYA, AKARUSHO,
RESTAURANT SERVICE, BAKERY, and other Activities. In the following lines we briefly
present performance of these products, in terms of sales:

29
4.2.2. Evolution of Sales of Akabanga Pepper from 2009 to 2012.
Table 2: Sales evolution of Akabanga Pepper product, during the period 2009-2012 Rulindo,
2012,
Years Sales in Evolution in percentage
2009 153,848
2010 199,900 29.9%
2011 221,234 11.6%
2012 240,146 8.5%
Source: Enterprise Urwibutso, Sales of the Akabanga products 2009-2012
According to the data presented in the table 4 above, sales of Akabanga have evolved under the
study time period, from 2009 to 2010 there was an increase of 46,052,OOORwf representing
29.9% of increase. From 2010 to 2011 Akabanga sales have varied 21,334,000Rwf, representing
11.6% of increase and lastly from 2010 to2011, the enterprise has gained increased revenue from
the sales of Akabanga product which were of 18,912,000Rwf, representing 8.5%. From the
percentage obtained, it is showed that from 2009 to 2010, Urwibutso gained more income from
the sales of Akabanga compared to other years. According to views from interviews, Sales of
Urwibutso have been increased due to the promotions through media (TV, Radio, News papers,
etc.), also, the quality of.
This product was the main cause of the increase and hence, products were also used by many
restaurants, hotels, bars and households.
4.2.3. Evolution of sales of Agashya Juice from 2009 to 2012.
Table 3: Table showing the Evolution of sales of Agashya Juice from 2009 to 2012
YEARS SALES (frws 000) EVOLUTION IN PERCENTAGE
2009 450,288
2010 463,020 2.8%
2011 460,025 (0.64%)
2012 468,813 1.9%
Source: Urwibutso Enterprise sales of Agashya product 2008-2011
30
Data from the table above do show that sales from Agashya juice changed from 2009 to 2012, it
shows that from 2009 to 2010, there was a variation of 12,732,000Rwf representing 2.8% of
increase. In 2009-2010, the enterprise obtained a decrease of 2,995,000 Rwf representing 0.64%
of sales increase of Agashya, due to the lack of raw materials and competition from other
companies which produce similar products like Inyange Industry and products that came from
abroad. During the period from 2010 to 201 l Urwibutso tried to increase the sales of Agashya
product which changed by 8,788,000Rwf representing 1.9% of increase. This increase was
influenced by the quality of the Agashya product and advertisements done by the enterprise in
the country and abroad.
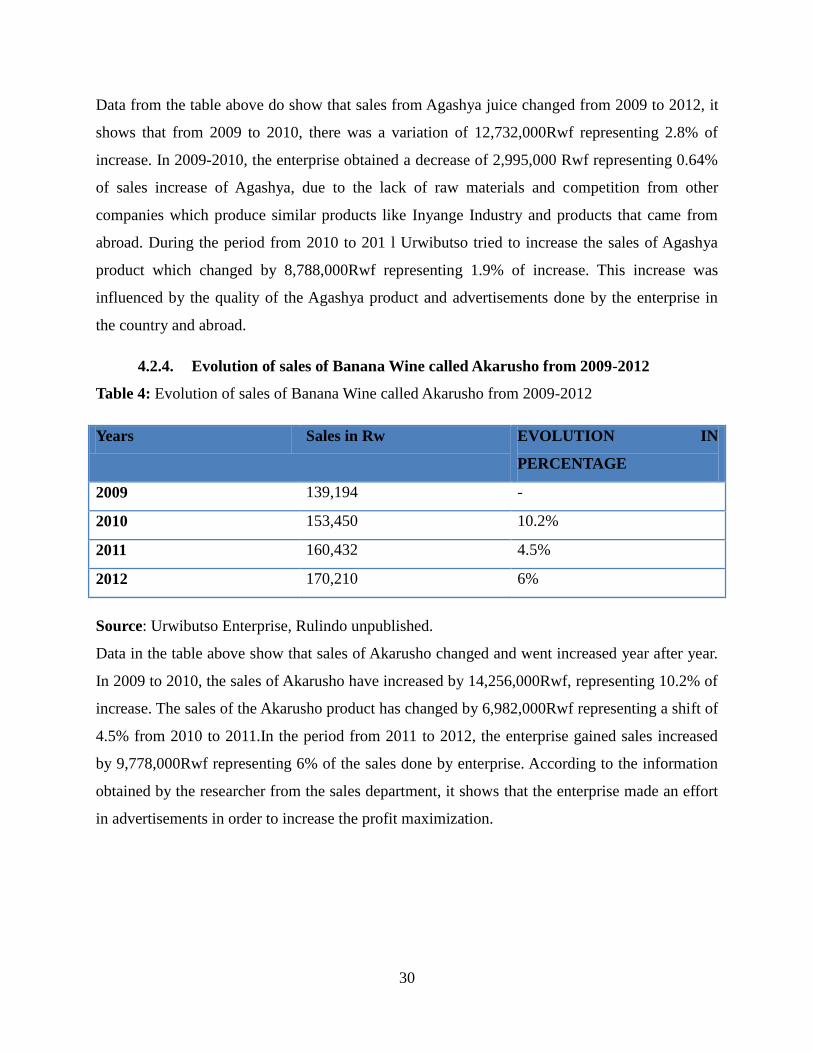
4.2.4. Evolution of sales of Banana Wine called Akarusho from 2009-2012
Table 4: Evolution of sales of Banana Wine called Akarusho from 2009-2012
Years Sales in Rw EVOLUTION IN
PERCENTAGE
2009 139,194 -
2010 153,450 10.2%
2011 160,432 4.5%
2012 170,210 6%
Source: Urwibutso Enterprise, Rulindo unpublished.
Data in the table above show that sales of Akarusho changed and went increased year after year.
In 2009 to 2010, the sales of Akarusho have increased by 14,256,000Rwf, representing 10.2% of
increase. The sales of the Akarusho product has changed by 6,982,000Rwf representing a shift of
4.5% from 2010 to 2011.In the period from 2011 to 2012, the enterprise gained sales increased
by 9,778,000Rwf representing 6% of the sales done by enterprise. According to the information
obtained by the researcher from the sales department, it shows that the enterprise made an effort
in advertisements in order to increase the profit maximization.

31
4.2.5. Evolution of Sales of Bakery Products from 2009 -2012.
Table 5: Table showing the Evolution of Sales of Bakery Products from 2009 -2012
YEARS SALES (rwf’000) EVOLUTION IN
PERCENTAGE
2009 287,200 -
2010 303,456 5.6%
2011 309,458 1.9%
2012 313,014 1.1%
Source: Urwibutso Enterprise, Rulindo unpublished
The sales of bakery products (Amandazi, cakes and breads) as showed by the table above
increased under the study period: 2009 to 2012. From 2009 to 2010, the sales have increased
with a high level of 16,256,000Rwf representing 5.6% due the quality of these products. From
2010 to 2012, these products obtained a variation of 6,002,000Fwf representing1.9%. Lastly
From 2011 to 2012, these products have generated sales increase of 3,556,000 Rwf representing!
1%. This variation was influenced by its quality and the way they are liked by customers' .For
example in restaurants, in hotel like Serena, and in super markets like Nakumatt and Simba. Also
these sales increased due to the effort used by enterprise in to advertisements on TV, on Radio,
etc.
4.2.6. Evolution Sales of Kimaranzara restaurant service from 2009 to 2012
Table 6: Showing the Evolution Sales of Kimaranzara restaurant service from 2008 to 2011
YEARS SALES (frws000) EVOLUTION IN PERCENTAGE
2009 19,389 ~
2010 32,340 66.7%
2011 43,234 33.6%
2012 51,590 19%
Source: Urwibutso Enterprise, Sales of Kimaranzara services, 2009-2012,
DATA from the table above shows the sales variation of Urwibutso restaurant call Kimaranzara,
from 2009 to 2012. As the table above shows it, sales from the restaurant has increased year after
year. From 2009 to 2010, the sales have changed from 12,951,000Fwf representing 66.7% of

32
increase, but from 2010 to 2011, sales from Kimaranzara have increased by 10,894,000 Rwf,
representing 33.6%. Lastly from 2011 to 2012, the enterprise gained a sales variation of
8,356,000 Rwf representing 19% of increase. The variation was influenced by the good quality
customer care in Kimaranzara restaurant and the enterprise uses a system of self service in order
to satisfy the need of each customer.
URWIBUTSO enterprise has other different activities which are tailoring shops, a
Garage, Lodges, Shop for various products, bar and agriculture activities including rearing of
pigs ,dogs ,goats, hens and cows. These activities contribute to the increase of profit to the
enterprise. The list of product in this study was not exhaustive, the researcher considered only
main products that are very sound to the Rwandan population
4.2.7. Analysis of working capital management in urwibutso enterprise.
Managing working capital means managing current assets. Major focus is on current assets
because current liabilities arise due to current assets only.
Therefore, controlling the current assets can automatically control the current liabilities. Through
the management of both current assets and liabilities, the researcher will look at the effective
working capital management in ENTREPRISE URWIBUTSO in this part
Table 7: Showing current assets items ranked in percentage
CURRENT ASSETS 2009 2010 2011 2012
Amount % Amount % Amount % Amount %
Inventory 265,959,499.0
0
90.01 584,564,205.0
0
88.76 339,481,986.0
0
92.20 399,319,773.00 90.36
Trade
receivables
28,392,090.00 9.61 67,224,062.00 10.21 15,156,140.00 4.12 23,630,780.00 5.35
Prepaid expenses
- - - - - - -
Accrued Income
- - - - - - - -
Cash at Ba nk 1,120,340.00 0.38 3,960,000.00 0.60 3,456,792.00 0.94 18,250,846.00 4.13
Cash in Hand 847.00 0.00 2,863,000.00 0.43 10,100,575.00 2.74 692,352.00 0,16
Total 295,472,776.0
0
100.0
0
658,611,267.0
0
100.00 368,195,493.0
0
100.0
0
441,903,751.00 100.00
Source: ENTREPRISE URWIBUTSO Financial statement, 2009-2012

33
In the above table the researcher found the following results:
1.In the years 2009, 2010, 2011 and 2012 the percentage of the percentage of inventory arc
90.01%, 88.76%, 92.20% and 90.36% respectively compared to the total amount of current
assets. Normally, inventory in most businesses has a big share (around 50%) in the total value of
the current assets but for the case of ENTREPRISE URWIBUTSO, obviously, the company has
invested more in inventory compared to other current assets items as the its percentage is kept
around 90% apart from the year 2009 where it has been seen that the inventory percentage is
rounded to 50%. One of reasons that may have pushed the company to invest more in inventory
is that its products requires enough raw materials and products ready to be consumed in order to
satisfy customers' demand which keeps increasing intensely. However, holding such a huge
amount invested in inventory ties-up the company's investment thus reducing its profitability.
For trade receivables in the four consecutive years (2009-2012) their percentages were 36.20%,
9.61%. 10.21%. 4.12% and 5.35% respectively compared to the total amount of current assets, it
has been noticed that the percentage of trade receivables kept on falling. This may explain two
assumptions: (a) that the company has decreased the amount of credit sales allowed to trade
receivables or (b) the collection period has been decreased over the past three years.
The researcher noticed again that the percentage of cash at bank in 2008 was 11.76% but
dramatically decreased in 2009, 2010 and 2011 to 0.60%, 0.94% and 4.13% respectively. This
may be explained by the fact that the company was newly established and it invested almost all
cash at the bank in other operating activities.
The cash at hand was 0.43% in 2010; it went up to 2.74% in 2011 and fallen down again to
0.16% in 2012. The amount of cash balance kept on fluctuating due to its use in the business.
5. The researcher found that there were neither accrued incomes nor prepaid expenses.
However as the management of current assets involves the management of all current assets
items combined as well as the management of these items individually, more detailed
clarifications will be given when dealing with the management of current assets individually.

34
4.2.8. Current liabilities items ranked in percentage
Table 8: Showing Current liabilities items ranked in percentage
CURRENT
LIABILITIES
2009 2010 2011 2012
Amount % Amount % Amount % Amount
%
Short-term
loan
211,000,000 83.43 300,000,000 62.37 335,000,000 80.49 292,479,653 62.19
Trade
payables
41,917,661 16.57 181,032,216. 37.63 56,991,272
13.69
170,278,649 36.21
Accrued
expenses
24,235,116 5.82 7,511,790 1.60
Prepaid
income
Bank
overdraft
TOTAL 252,917,661 100 481,032,216 100 416,226,388 100 470,270,092 100
Source: Enterprise Urwibutso Financial Statement, 2009-2012
Table above shows us that:
1. Short term loan has a big portion over the total current liabilities: 80.88% in 2007, 83.43% in
2009, 62.37% in 2010, 80.49% in 2011 and 62.19% in 2012. Short term loan percentage
decreased only in 2010 and 2012 meaning in these years the company was using more trade
payables than short term loan to finance its current assets.. Obviously, the company's
management has adopted the moderate or matching policy to finance its current assets.
2. In the same period trade payables were 19.12%, 16.57%, 37.63%, 13.69% and 36.21%
respectively. But noticed-that in 2010 the percentage went down meaning that in this year the
company preferred short term loan as an alternative to trade payables to finance the current
assets. These percentages the claim that trade payables over the current assets as a results of
credit purchases made by the company Accrued expenses in ENTREPRISE URWIBUTSO are
basically, taxes and were held in the business as follows: 0.00% in 2007-2009, 5.82% in 2010

35
and 1.60% in 2011. Often the tax declaration period differ from accounting period (when
financial statements and other final accounts are prepared)
4. There was neither prepaid income nor bank overdraft in ENTREPRISE URWIBUTSO.
4.2.9. Techniques for effective Working Capital management
Working Capital Management techniques are used for finding optimal level of working capital.
These Techniques are important and are very effective in managing working capital. It has been
seen earlier that working capital management techniques are very effective tools in managing the
working capital efficiently and effectively. Therefore, this section the effectiveness of working
capital management on profitability and liquidity of firms wanted to know the techniques used in
ENTREPRISE URWIBUTSO to reach the optimum level of working capital in order to ascertain
the effectiveness of working capital management in this company.
4.2.10. Cash Budgeting/ management technique
A cash budgeting and management technique is extremely important because it allows a
company to assess whether it has sufficient cash to fulfill regular operations and/or whether too
much cash is being left in unproductive capacities and to determine how much credit it can
extend to customers before it begins to have liquidity problems. The effectiveness of working
capital management on profitability and liquidity of firms wanted to know how effective was this
technique used in ENTREPRISE URWIBUTSO.
Generally, the major source of receipts was from sales. The disbursement section consists of all
cash payments that are planned for the budgeted period. These payments include raw materials
purchases, direct labor payments, manufacturing overhead costs, and so on. They argued that, .if
there was a cash deficiency (shortage) during any period; the company would need t o borrow
funds in form of bank overdrafts and/or short-term loans. If there is cash excess during any
budgeted period, funds borrowed in previous periods could be repaid or the excess funds can be
reinvested.
According to Urwibutso Enterprise, cash management is carried out by:
Monitoring the daily cash position daily, the cash manager typically spends the first part of the
day developing the cash position. This exercise identifies shortages and surpluses in time to
either borrow funds to cover the shortfall or invest excess funds.

36
Controlling balances on deposit, cash manager maintains bank balances at an adequate level to
avoid overdrafts and to compensate the bank for cash management services. Moving funds as
necessary.The transfer of cash from one account to another is often a daily exercise to prevent
cash shortages in the accounts and to promptly invest surpluses. Managing short-term (working
capital) borrowing and investing. Forecasting future shortages and surpluses, Managing banking
relationships; maintaining a mutually beneficial relationship with the company's bankers and,
Performing analytic reviews and feasibility studies of banking services.
4.2.11. Inventory Management
Inventory management as the process of efficiently overseeing the constant flow of units into and
out of an existing inventory, thus the researcher wanted to know how this process is carried out
in EXTREPRISE URWIBUTSO.
4.2.12. Profit analysis
Profit generally is the making gain in business activity and is the basic index for measuring the
impact of marketing strategy in success of company. Urwibutso Industry for the periods of three
years was increasing its profits mainly because this comes from good marketing strategy on
company success as a result of increasing of sales through its products and services which are
provided by this company and Urwibutso Industry is experienced enough in marketing strategy
in production Industry, this was helping the company to increase its profit due to the increase in
turnover because shareholders have tried reinvest the dividends.
Table 9: Evolution of Net Profit in Urwibutso industry from 2009-2012(amount in Rwf)
Year Net Profit Evolution (%)
2009 94,709,747 -
2010 102,502,961 7.6
2011 109,348,459 6.7
2012 124,265,214 21.2
Source: Urwibutso Industry, financial report, 2009-2012
In 2009, the bank realized the benefice result of 94,709,747Rwf. In 2009 the result was of
102,502,961Rwf; in 2011 the result was 109,348,459Rwf and in 2012 the net profit increase of
124,264,214Rwf. According the results obtained the net profit increase from 2010 to 2012

37
respectively result of 7.6% and 2009 to 2011 the percentage decrease of 6.7% because of unpaid
loans and 2011 to 2012 these percentage increase to the 21.2%.
The analysis of turnover
Table 10: Evolution of Turnover in urwibutso industry from 2009-2012 (amount in Rwf)
Year Turnover Evolution
2009 220,485,524 -
2010 338, 057,746 34.7
2011 427, 465,797 26.4
2012 501, 123,314 48.2
Source: Secondary urwibutso industry financial report, August 2011.
The total sales of the company as it refers to us as turnover, the table above indicates that
urwibutso has realized a positive result whereby the turnover for the studied years were
respectively: 220,485,524Rwf; 338, 057,746Rwf, 427, 465,797Rwf, and 501, 123,314Rwf, with
corresponding evolutions respectively 34.7%, 26.4% and 48.2% showing that there has been a
decrease in 2012 due to various facts especially to competition and other factors.

38
CHARPTER FIVE: CONCLUSION AND RECOMMENDATION
5.1. Introduction
Working capital management is a concept in financial management that sets cash outflow and
inflow to any business especially growing small enterprises in Rwanda. This counts the purpose
of profit making growing business, nevertheless the researcher realized that small medium
enterprise lack sufficient working capital management concepts, sufficient funds, financial
knowledge and the finance record order keeping.
The study revealed that the URWIBUTSO Enterprise keeps financial records due to finance
knowledge that managers have. There is some use of finance information to support financial
performance measurement.
The study also showed that, in URWIBUTSO Enterprise they prepare financial information in
order to meet the requirements of the shareholders, business registration and revenue authorities.
They are aware that financial information useful to measure the enterprise performance, growth,
financial position and continuously make smart profits. URWIBUTSO Enterprise considers
financial information as an important tool for the management of their daily activities.
SMEs‟ managers believe that financial information add comprehensive value to their enterprise.
Therefore, this should be the main factor for high increase of their financial capacity.
It is recommended that, SMEs‟ managers should always prepare and utilize financial information
in their daily activity in order to hold sound financial decisions that will boost take their
enterprises.

39
5.2. Conclusions
Working capital management is that company‟s capital which is used for purchasing raw
materials and it is involved in paying current liabilities, current assets are very significant to
operate long-term assets. This study revealed that communication of working capital
management goals was very important to the strategic competitiveness of Urwibutso enterprise.
For effective working capital management, an enterprise will ensure that sufficient cash is
available to meet day to day cash flow needs, pay creditors to ensure continued supplies of goods
and services, the payment of wages and salaries when they fall due etc. Management of
receivable is also a condition for the success in management of working capital, clients should be
evaluated and monitored according to credit policy in order to establish acceptable credit
standard this has been confirmed by 67% of the respondents who argued that the customer are
supposed to be evaluated in order to assess whether their credit obligation will be met.
The study revealed that when approaches to inventory management are effectively employed this
may control to help to solve the problem of liquidity and increase strategic competitiveness of
the enterprise this was confirmed by 100% of the respondents.
The results portray that performance of Urwibutso Enterprise was influenced by diversification
of its product as well as differentiation of its product. It has been revealed also that both
customer loyalty and the firm‟s access to the distribution channels were other ingredients to the
success of the enterprise; this was confirmed by 72.5% of the respondents. Besides that, there is
a strong positive relationship between working capital management and strategic competiveness
of the enterprise.

40
5.3. Recommendations
Based on the results of this study, the researcher wants to give the recommendation to various
stakeholders in the management finances of SMEs sector in order to affect profit as a right factor.
Therefore recommendations include the following:
5.3.1. Recommendations to URWIBUTSO Enterprise
It is recommended that, managers of URWIBUTSO Enterprise should always prepare and utilize
financial information in their daily management of the enterprise. And should further be an
implication to all product centres of the enterprise.
5.3.2. Recommendation to stakeholders in the SMEs sector
This study recommends that the regulators should come up with some SME-specific financial
guidelines and provide template forms for capturing information to SMEs.
Shareholders need to come up with further continuous study of working capital management
concepts in order improve their finances, understand finance controls and its measurement when
it comes to receivables and profit mechanisms.
5.3.3. Recommendations to the Rwandan government
The ministry responsible for SMEs should initiate finance training programs to Rwanda growing
entrepreneurs. Further, this study recommends that record keeping in SMEs must be made
mandatory to improve their financial measurements and increase chances of them formalizing
their business operations.

41
5.4. The impact of working capital management of SMEs in Rwanda
To determine working requirements of SMEs there are no specific rules and regulations, there are
a number of factors that influence working capital of SMEs; these include among others;
Nature of Business: Working capital requirement of a firm is normally influenced by the nature
of the business, its norms of cash flow and outflows. As matter to small firms investing in fixed
assets require huge sums of money invested in this working capital.
Sales and Demand Conditions: Sales and working capital of an organization normally have
significant relationship; however it is not easy to determine the volumes of sales and working
capital needs. In general currents assets will have to be employed before growth takes place.
Therefore advance planning on working capital of an enterprise in a critical level that is
necessary for profit making of SMEs.
Technology and manufacturing Policies: Production process carries an impact on the
management of working capital in SMEs. The manufacturing cycle comprises of the purchases
and use of raw materials and the quality of the finished goods. The time level of the production
process the more working capital is required.
Credit policy of the SME: Credit policy of a firm affects the working capital by influencing the
level of debtors and credit terms granted, therefore this influences the cash flow in terms of
working capital of a firm.
Operating Efficiency: this rotates at the optimum utilization of available resources at minimum
costs. This affects the working capital investment at a lower level if it is efficient in controlling
operating costs and utilizing current assets.
Credit granted by Suppliers: SMEs can also be affected by the credit terms of their creditors
and this draws impact on the management of working capital. A firm will need less working
capital if liberal credit terms are available. The availability of credit from banks also influences
the working capital needs of a firm. Therefore a firm that can get bank credit easily on favorable
conditions will operate with less working capital than a firm without.
Price Level Changes: Purchasing of materials and all other needs influence price levels, the
increase in shifts in pricing make functions influences working capital of SMEs. In general
pricing levels require a firm to maintain higher amount of working capital. Same levels of
current assets will need increased investment when prices are increasing.
42
5.5. Contribution to Knowledge and Practice
There is a need for SMEs maintain adequate working capital concepts. This is not just to meet
the daily operations of the organizations or SMEs but also to enhance the various performances
of the SMEs. The time has come when managers or owners of the SMEs should not only look at
various sections and parts of organizations as it concern them but rather look at a determining
factor which is working capital management that can generate a positive or negative effect on
SMEs.
Hence, other researchers, managers or owners must look beyond the financial Statements of their
working capital because it will go a long way in determining the overall profitability, efficiency
and survivals of the organizations.

43
5.6. General Conclusion
In regards to the business world, gaining profit is the main target. Profitability therefore can only
be ensured by percentages input in clear management of working capital concept. Cash
managements, inventory, payable and receivables are the leading cause of profitability of SMEs
in Rwanda.
URWIBUTSO enterprises as analyzed from the period it opened up business management of
their finances is still developing, Even though the institution faced some operation periods were
theirs profits had a decreasing rate, much effort was put in the working capital management
leading to an increase in the profitability of the enterprise periodically.
Therefore any business especially small and medium enterprise draws a huge impact on the end
results of making good profits, hence sustainable development of the business.
Therefore cash flow in SME should be regularly managed in terms of ensuring continuous
sufficient liquid resources in business and this implies that working capital management draws
an impact on profitability of SMEs.

44
REFERENCES
ACCA (2010); Financial Reporting, Paper F7
ACCA 20100; Financial Management, Paper F9
Brealey Myers Allen (2011).Principles of Corporate Finance 10th
ed. Mcgraw-Hill/Irwin, a
business unit of the Mcgraw-Hill companies.
Charles Harvie and Boon-Chye lee.(2005) Sustaining growth and Performance in East Asia.
University of Wollongong, Austrialia.
CAPMER(2004). Strategic plan document (2003-2007), Center for Support of Small and Medium
Enterprises in Rwanda, Kigali
Frank J. Fabozzi and Pamela P. Peterson( 2003). Financial Management Analysis (2nd
ed.)
Garcia –Teruel, Pedro Juan and Pedro Martinez –Solano (2007).” Effect of working capital
management on SME profitability”, International Journal of Managerial finance3:2, pp 165.
Ganesan, V. (2007). “An Analysis of Working Capital Management Efficiency in
Telecommunication Equipment Industry”, Rivier Academic Journal, Vol. 3, No. 2, pp 13.
Hillier, Rose, Westerfield, Jaffe &Jordan (2010).Corporate Finance Mcgraw-Hill Higher
Education, Shoppenhangers Road, Maidenhead Berkshire.
Hina Agha, (2014) “Impact of Working Capital Management on Profitability‟‟ European
scientific Journal, Vol.10 No. 1 pp 185.
Ministry of Commerce(2013). SMEs- product –cluster in Rwanda.
Paramasivan C., Subramanian T. Financial Management (2009).New Age International Limited,
Publishers Ansari Road, Daryaganji, New Delhi.
Ministry of Commerce (2007).Small and medium enterprises policy, strategic framework for
promoting SMEs development, Ministry of Commerce, Trade, Industry and Cooperatives, kigali,
2007.
Paul J.A.Robson, Robert J. Bennet small Business Economy (2001).The relationship with
Business Advice and SMEs Growth; External Collaboration. Netherlands.
Ranjit Kumar (2005).Research methodology. SAGE Publication Ltd,1 Oliver`s Yard 55 City
Road London ECIY ISP.
Rwanda Development Board (2012). “Report leveraging capital markets for SME
Financing in Rwanda”.African Development Fund
Rwanda Development Board (2011).Establishment census - Analytical report

45
Robert B.Burns and Richard A. Burns( 2008). Business Research Methods and Statistics
Robert. J. Calvin (2002). New business Enterprise Management Mcgraw-Hill, Two Penn Plaza,
New York.
Rowland Hayler .Michael & Nichols (2007).Six Sigma for Financial Services Mcgraw Hill, New
York, Chicogo, Sanfracisco.
Shin, H.H. and L. Soenen (1998), „Efficiency of Working Capital and Corporate Profitability‟ ,
Financial Practice and Education, Vol 8, No2, pp. 37-45.