rwanda agricultural policy note - world bank · pdf filereport no: acs9719 . republic of...
TRANSCRIPT
Report No: ACS9719 .
Republic of Rwanda Rwanda Agriculture Policy Note
Promoting Agricultural Growth in Rwanda: Recent Performance, Challenges and Opportunities
June 7, 2014
. AFTA2
AFRICA
.
Pub
lic D
iscl
osur
e A
utho
rized
Pub
lic D
iscl
osur
e A
utho
rized
Pub
lic D
iscl
osur
e A
utho
rized
Pub
lic D
iscl
osur
e A
utho
rized
Pub
lic D
iscl
osur
e A
utho
rized
Pub
lic D
iscl
osur
e A
utho
rized
Pub
lic D
iscl
osur
e A
utho
rized
Pub
lic D
iscl
osur
e A
utho
rized
. Standard Disclaimer:
.
This volume is a product of the staff of the International Bank for Reconstruction and Development/ The World Bank. The findings, interpretations, and conclusions expressed in this paper do not necessarily reflect the views of the Executive Directors of The World Bank or the governments they represent. The World Bank does not guarantee the accuracy of the data included in this work. The boundaries, colors, denominations, and other information shown on any map in this work do not imply any judgment on the part of The World Bank concerning the legal status of any territory or the endorsement or acceptance of such boundaries.
.
Copyright Statement:
.
The material in this publication is copyrighted. Copying and/or transmitting portions or all of this work without permission may be a violation of applicable law. The International Bank for Reconstruction and Development/ The World Bank encourages dissemination of its work and will normally grant permission to reproduce portions of the work promptly. For permission to photocopy or reprint any part of this work, please send a request with complete information to the Copyright Clearance Center, Inc., 222 Rosewood Drive, Danvers, MA 01923, USA, telephone 978-750-8400, fax 978-750-4470, http://www.copyright.com/. All other queries on rights and licenses, including subsidiary rights, should be addressed to the Office of the Publisher, The World Bank, 1818 H Street NW, Washington, DC 20433, USA, fax 202-522-2422, e-mail [email protected].
Acknowledgements
This report was prepared by a World Bank Task Team that included Mark Austin (Task Team Leader, AFTA2), Aparajita Goyal (Co-Task Team Leader, AFTA2), Valens Mwumvaneza (Rural Development Specialist, AFTA2), Yoichiro Ishihara (Senior Economist, AFTP2), Lucy Fye (Senior Private Development Sector Specialist, AFTFE), Alice Usanase (Junior Professional Associate, AFMRW), Andrew Karanja (Senior Agriculture Economist, AFTA2), Michael Morris (Lead Agriculture Economist, LCSAR), and Belinda Mutesi (Team Assistant, AFMRW). Valuable contributions were also made by the following World Bank colleagues: Severin Kodderitzsch (Sector Manager, AFTA2) and Pauline McPherson (Senior Operations Officer, AFTA2). Madhur Gautam (Lead Economist, SASDA), Loraine Ronchi (Senior Economist, CICIN/IFC), Maurice Saade (Senior Agriculture Economist, MNSAR) served as Peer Reviewers.
The Task Team was privileged to receive the support of many colleagues in the Government of Rwanda, including Hon. Agnes Kalibata (Minister of Agriculture and Animal Resources, MINAGRI), Mr. Ernest Ruzindaza (former Permanent Secretary, MINAGRI), Mr. Tony Nsanganira (Permanent Secretary, MINAGRI), and Mr. Raphael Rurangwa (Director of Planning, MINAGRI).
A special debt of gratitude is owed to the authors of two background studies: Dirck Stryker, Mukhtar Amin, and Jonas Munyurangabo from Associates for International Resources and Development (AIRD) and Xinshen Diao, Godfrey Bahiigwa and Angga Pradesha from the International Food Policy Research Institute (IFPRI).
Funding for these background studies was provided by the World Bank, The United States Agency for International Development (USAID), the Comprehensive Africa Agriculture Development Programme (CAADP) Multi-Donor Trust Fund, The Common Market for Eastern and Southern Africa (COMESA) and The Food and Agriculture Organization of the United Nation Technical Cooperation Program (FAO-CP).
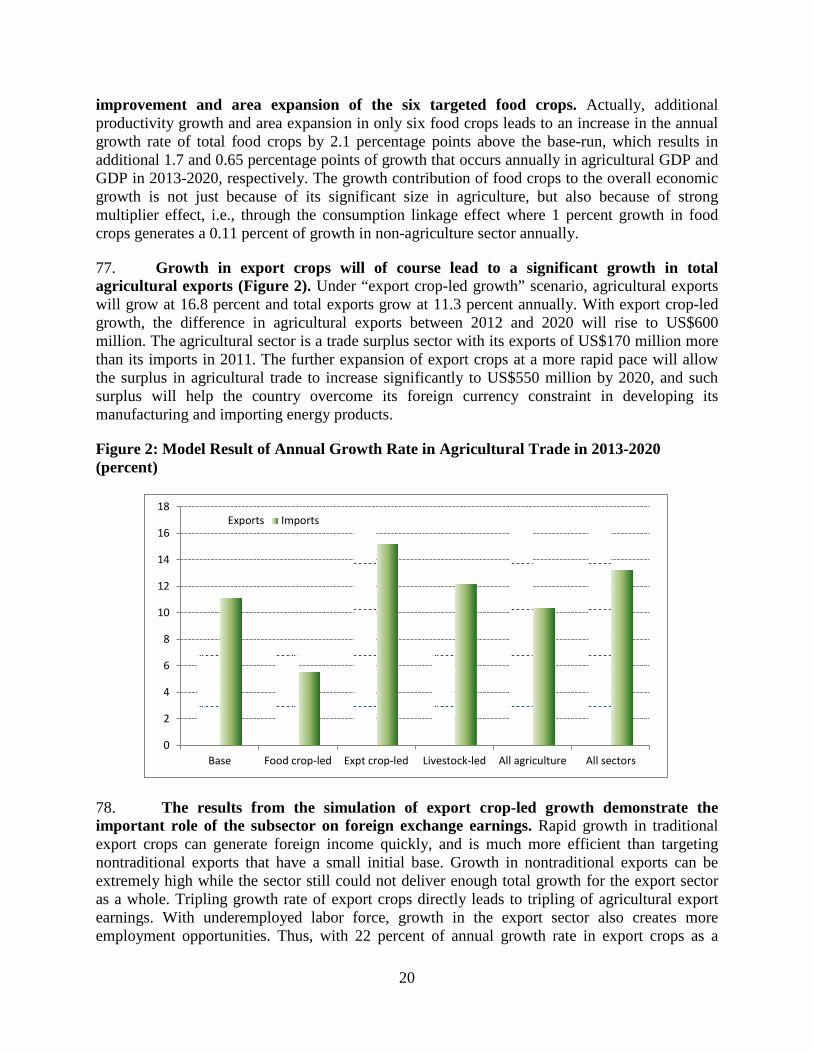
Table of Contents Abbreviations and Acronyms ......................................................................................................... ii Executive Summary ....................................................................................................................... iii 1. Introduction and Objectives .................................................................................................... 1 2. Importance of Agriculture in Rwandan Economy .................................................................. 2 3. Recent Performance of the Agriculture Sector and Emerging Insights .................................. 6 4. Achieving Government's Growth and Poverty Reduction Policy Objectives in PSTA 3..... 16 5. Potential Future Drivers of Growth and Poverty Reduction ................................................. 24 6. Key Actions to Sustainable Agriculture Growth and Poverty Reduction ............................. 34 7. References ............................................................................................................................. 42 Appendix 1: PSTA 3 Programs and Sub-Programs ...................................................................... 46 Appendix 2: Domestic Resource Cost Analysis Tables ............................................................... 47
i
Abbreviations and Acronyms AGOA African Growth and Opportunity Act AIRD Associates for International Resources and Development BNR Banque Nationale du Rwanda (National Bank of Rwanda) CAADP Comprehensive Africa Agriculture Development Programme CBT Cross-Border Trade CGE Computable General Equilibrium (IFPRI model) CIP Crop Intensification Program COMESA Common Market for Eastern and Southern Africa DRC Domestic Resource Cost EAC East African Community EDPRS Economic Development and Poverty Reduction Strategy EICV Enquête Intégralesur les Conditions de Vie des Ménages (Integrated
Household Living Conditions Survey) EPA European Partnership Agreement EPC Effective Protection Coefficient FDI Foreign Direct Investment FWC Fully Washed Coffee GDP Gross Domestic Product GoR Government of Rwanda ICT Information and Communications Technology IFPRI International Food Policy Research Institute ISAR Institut des Sciences Agronomiques du Rwanda (Rwanda Agricultural
Research Institute) LUCP Land Use Consolidation Program LWH Land Husbandry, Water Harvesting and Hillside Irrigation Project M&E Monitoring and Evaluation MCC Milk Collection Centers MDG Millennium Development Goal MINAGRI Ministry of Agriculture and Animal Resources MINICOM Ministry of Trade and Industry NEPAD New Partnership for Africa's Development NIS National Investment Strategy NISR National Institute of Statistics of Rwanda PSTA Plan Stratégique pour la Transformation Agricole (Second Strategic Plan for the
Transformation of Agriculture) RAB Rwanda Agriculture Board RBS Rwanda Bureau of Standards RSSP Rural Sector Support Program RWF Rwandan Franc SOPYRWA Société de Pyrèthre au Rwanda (Rwandan Pyrethrum Industry Horizon) TFP Total Factor Productivity VAT Value Added Tax WFP World Food Programme
ii
Executive Summary 1. Rwanda is experiencing its best growth performance since independence. With average annual GDP growth rate of 8 percent and 5.2 percent for agricultural GDP from 1999-2012, Rwanda’s recent growth is a historical record. The poverty headcount fell from 59 percent in 2001 to 45 percent in 2011, and agriculture continues to be one of the main drivers of growth and poverty reduction in Rwanda, significantly lifting rural households out of poverty. Yet, challenges in the agriculture sector remain. Specifically, to: (i) sustain the productivity gains in the short and medium-term, which have contributed to strong agriculture growth and raised rural incomes; ii) increase and improve nutrition security for the rural population; iii) strengthen and deepen value chain development including increasing agro-processing to create non-farm employment; iv) secure and strengthen linkages to domestic and international markets for agriculture production; and v) enhance the enabling environment to attract the private sector to invest in the sector and add value to the productivity increases.
2. The objective of this policy note is to review the performance and results of Rwanda First Comprehensive Africa Agriculture Development Program (CAADP) and Second Strategy for the Transformation of Agriculture Sector (known by its French acronym, PSTA 2) as input into the preparation of the Second Rwanda CAADP and review of PSTA 3 investment plan to assure the soundness of its assumptions and the efficiency with which Rwanda will achieve its goals going forward. The note aims to recommend agricultural market opportunities at the national, regional, and global levels analyzing the patterns of competitiveness and comparative advantage in Rwandan agriculture.
3. There were several factors responsible for Rwanda’s rapid rate of economic growth in the last five years, including the establishment of a good business enabling environment and well directed public investments. Agriculture growth has been a result of expansion of food production, scaled-up public investments in the Crop-Intensification Program (CIP), Land Use Consolidation Program (LUCP), input subsidies on fertilizers and seeds, and other public activities to promote production of priority crops. It is vitally important that public investment be sustained under PSTA 3 and that it be directed in ways that are most cost-effective in achieving the goals of EDPRS 2 and Vision 2020. Moreover, efficiently directed public investment is critical to inducing private investment along with a more focused approach to increase foreign direct investment (FDI). PSTA 3 needs to continue to include the development of a strategy for the extreme poor rural farmer, expand CIP, LUCP, non-farm employment, value addition of key value chains, increase soil conservation coverage, selectivity in hillside irrigation schemes, expand livestock intensification, increase awareness of horticulture opportunities, establish feeding limits for The Girinka Program, expand coffee and tea production, and increase reliability of agriculture statistics.
4. Going forward, the analysis in this note suggests that agriculture continues to be the leading engine for growth and poverty reduction in Rwanda. While, some agricultural sub-sectors will grow more rapidly than others, the contribution of each sub-sector to GDP growth depends not only on the rate of growth achieved in that sub-sector, but also on the absolute size of the sub-sector. Taking into account the large absolute size of the food crops sub-sectors, most of the growth in agriculture continues to come from growth in food crops. Export crops will
iii
make a significant contribution to growth, but the importance of this contribution will be limited so long as the export crop sub-sector remains small relative to the food crops and livestock sectors.
5. For the agriculture sector, the future approach is not an issue of either/or but one of maintaining appropriate level of emphasis on each strategy. Based on the analysis of future economic growth prospects, a three-fold strategy is recommended for agriculture to play an active role in Rwanda’s future economic growth.
6. First, continue to promote domestic market demand to lead agricultural growth. If overall economic growth will continue to be around 8 percent in the next 5-10 years as it has been in recent years, and when such growth continues to be supported by the similar foreign financed investment, meeting domestic market demand will be the dominant force to lead agricultural growth. In this case, food crops and livestock will need to grow more rapidly, similar as what has happened in recent years, and such growth will be driven primarily by market forces as an outcome of increased household income from rapid growth for the economy as a whole. This type of agricultural growth will benefit farmers both from income generation and improving food and nutrition security, and also benefit consumers particular urban consumers by adequate food supply at reasonable and stable domestic prices, provided that the growth is not incentivized through trade protective policies, which penalize poor consumers
7. Second, promote regional markets for food crops and livestock growth. Exploring regional market demand is important for agriculture sector growth led by food crops and livestock growth. Regional markets differ significantly from international markets for Rwanda’s agriculture and is close to the domestic market in nature as most agricultural commodities traded in the region are similar goods produced for local demand, such as maize, Irish potato, dry beans, livestock and livestock products.
8. Third, broaden international trade basket and explore nontraditional export niche markets and promote increasing value-addition in the production and processing of tradition export commodities. With improved competitiveness and private sector investment, export agriculture will grow more rapidly and will increase its role in leading overall agricultural growth. While broadening international trade and exploring nontraditional export niche markets are important, Rwanda’s international trade will continue to be dominated by its two traditional export commodities, coffee and tea. Thus, increasing value-addition and price premium by improving quality of these two commodities in their production and processing is important.
9. Different components of this agricultural growth strategy require different types of government support, policy interventions and enabling environment actions. Agricultural growth led by productivity improvement in broad food crop sector depends critically on public investment. Without accelerated growth in agricultural public investment, the 8.5 percent target for agricultural annual growth, in which growth in food crops has a dominant role, is difficult to achieve. Acceleration in export crops would depend on the facilitative role of the government in promoting private investments to lead such growth. Growth in agriculture public investment along with significant promotion of private investment and market led growth in the sector is recommended.
iv
1. Introduction and Objectives Background 1. Agriculture continues to be one of the main drivers of growth and poverty reduction in Rwanda, significantly lifting rural households out of poverty. Although the share of agriculture decreased from 45 percent in 2001 to 34 percent of GDP in 2011, the sector remains the mainstay of the Rwandan economy in terms of employment and income-generation for the majority of households.1 Driven by increased investments in agricultural inputs, land use consolidation, and infrastructure, agricultural production at the household level more than doubled between 2001 and 2011. Together with increased commercialization, reflected in the rising share of harvests being sold in local markets, the expansion in production accounted for one-third of the growth of rural consumption over the decade.
2. Despite this impressive performance in the last decade and particularly in the last 5 years, challenges remain. Rwanda remains a low income country with annual income per capita of US$644 in 2012, and more than 45 percent below the national poverty line.2 About one in four rural households live in extreme poverty. Poverty is still mostly a rural phenomenon with 49 percent of the poor living in rural areas compared to 22 percent in urban areas. Average farm sizes have declined in the face of steady population growth, putting pressure on farm income. If Rwanda is to achieve its targets to reduce the 2002 poverty rate of 72 percent by half and to less than 20 percent living below the national poverty line by the year 2020, inclusive economic growth from the agriculture sector will have to continue to increase significantly.3
3. Key challenges facing the agriculture sector currently are how to: (i) expand and increase productivity gains in the short and medium-term, which have contributed to strong agriculture growth and raised rural incomes; (ii) increase and improve nutrition security for the rural population; (iii) strengthen and deepen value chain development including increasing agro-processing to create non-farm employment; (iv) secure and strengthen linkages to domestic and international markets for agriculture production; and (v) enhance the enabling environment to attract the private sector to invest in the sector and add value to the productivity increases.4 The performance of Rwanda’s agricultural sector in recent years has significantly improved but continued food and high value commodity production and productivity increases are essential to secure further reductions in rural poverty and convert the largely subsistence sector to a more
1National Institute of Statistics of Rwanda (NISR), 2013. 2 63 percent of the population lives on less than US$1.25 per day using the international poverty line. The World Bank sets the international poverty line at US$1.25 per day in 2005 prices. This corresponds to the average poverty line of the 15 poorest countries among the 75 developing countries surveyed in Ravallion et al (2009). The international poverty line provides a standardized benchmark for cross-country comparisons of poverty. Within any given country however there can be considerable differences between the national and the international poverty line. For the case of Rwanda, the national poverty line amounts to US$0.99 per day in 2005 PPP prices, which is lower than the international poverty line of US$1.25. This explains the higher poverty headcount when using the international poverty line. 3 If Rwanda is to achieve its targets to reduce the number of people living below the national poverty line to less than 20 percent and eliminate extreme poverty by the year 2020, continuation of the past strong growth performance will not be sufficient. A further acceleration of inclusive growth would be needed, on top of further reductions in inequality. 4GoR recognizes the need to shift its focus to one of creating an enabling environment and facilitating and crowding-in of private investment in the sector.
1
knowledge-intensive, market-oriented sector which will sustain growth and add value to production.
Objectives
4. This report summarizes the findings of two studies commissioned by the World Bank at the request of the Government of Rwanda (GoR) to (i) review the performance and results of Rwanda’s First Comprehensive Africa Agriculture Development Programme (CAADP) investment plan and Second Strategy for the Transformation of Agriculture Sector (known by its French acronym, PSTA 2), and (ii) as input to the preparation of the Rwanda’s Second CAADP investment plan and review of PSTA 3 investment plan, to assure the soundness of the Government’s assumptions and the efficiency with which it will achieve its goals. Specifically, the objectives of this report are to:
(i) identify the key outcomes and lessons learned from implementing PSTA 2 (2008-2012) and Rwanda First Comprehensive Africa Agriculture Development Program (CAADP 1) compact by the Ministry of Agriculture and Animal Resources (MINAGRI);
(ii) recommend agricultural market opportunities at the national, regional, and global levels by analyzing the patterns of competitiveness and comparative advantage in Rwandan agriculture; and
(iii) analyze prospects for achieving sustainable agriculture growth in Rwanda.
Organization of the report
5. This report consists of six sections. Section 1 provides the introduction and report objectives. Section 2 describes the importance of agriculture in the Rwandan economy within the context of national agriculture policies and strategies. Section 3 analyzes the recent performance of the agricultural sector and presents some emerging insights. Section 4 discusses what it will take to achieve the Government's strategic policy objectives and presents the results of a modeling exercise that explores the likely future impacts of alternative growth strategies on income, poverty, and foreign exchange earnings. Section 5 explores possible future drivers of growth and poverty reduction, considering the demand, supply, competitiveness and comparative advantages and constraints of key commodities in the agriculture sector. Section 6 concludes by recommending key actions that Government could undertake within the agricultural sector to continue to stimulate needed sustainable agriculture growth and poverty reduction.
2. Importance of Agriculture in Rwandan Economy Macroeconomic overview 6. Rwanda is a small (26,340 km2) landlocked country with few natural resources and a population of 10.7 million (2012). Its hilly terrain covers 85 percent of the land mass and the country has the highest population density in Africa with 416 people per square kilometers. Rwanda has made a remarkable transition from genocide to peace and development. Between 2000 and 2012, GDP growth averaged 8.1 percent per year. This strong macroeconomic growth
2

performance was accompanied by substantial improvements in living standards, as witnessed by a two-thirds decline in child mortality, and the attainment of near-universal primary school enrollment. There was commendable progress in the provision of health services. Household consumption grew rapidly resulting in the poverty headcount falling from 59 percent in 2001 to 45 percent in 2011.
7. These results reflect the steadfast commitment of the Government on reforms in health, education, general policy environment and investment in infrastructure. According to the World Bank Group’s Doing Business Report for 2013, Rwanda progressed from 58th to 32nd position in the ease of doing business ranking world-wide. This impressive performance makes Rwanda the second most reformed economy in the world over the last five years and the third easiest country for doing business in Africa, as well as being the first in the East African Community.5
Agriculture’s role in the economy
8. During the rapid economic growth period of 1999-2012, Rwanda also experienced the highest agricultural growth in the country’s history. Agricultural GDP grew at a rate of 5.2 percent per annum from 1999-2012, and growth accelerated to 5.7 percent per year between 2006-2012.Performance of the food crop sector is particularly impressive. From 2006-2012, the food crop value-added growth rate of 6.2 percent per year is higher than the growth rate for the overall agricultural GDP. Between 2001 and 2011, agriculture remained the main occupation for over 70 percent of working Rwandans. Of the 1.4 million people entering the workforce in Rwanda, the largest percentage went into agriculture, which accounts for almost half of aggregate household income and about 63 percent of total consumption for poor households.6 The proportion of Rwandan households cultivating at least one plot of land has remained stable at 90 percent.
9. The Government has a medium-term strategy for stimulating rapid and sustainable economic growth and reducing poverty. The agriculture sector is identified as a key sector and a major engine of growth in the national strategy. In the recent Rwanda Economic Update, Maintaining Momentum report7 it states that increasing agriculture productivity is the main driver of poverty reduction in Rwanda. While agricultural productivity is increasing, there is considerable potential to accelerate and continue to raise productivity and achieve significant income gains. Increased marketing of agricultural products is also an important factor in increasing consumption of the poor. In addition, with relatively limited growth opportunities in the non-agriculture tradable sector in the near future, the important role of agriculture should be considered in the broad development strategy, not only for its role in poverty reduction, but also in economic growth and transformation.
10. Rwandan agriculture is characterized by small production units. The average landholding size is 0.33 ha. Land is a binding constraint with only 1.5 million ha of arable land
5 World Bank and IFC, Doing Business 2014, Economy Profile: Rwanda, 2013. 6 NISR, EICV3 Thematic Report: Patterns of Consumption, n.d., p. 21. 7Rwanda Economic Update, Maintaining Momentum with a special focus on Rwanda’s pathway out of poverty, World Bank, May 2013, Edition No. 4.
3
which rules out extending the agricultural frontier if growth is to be environmentally sustainable. Improvements in the agriculture sector in the last 5 years have principally been driven by improvements in land management, input provision and irrigation. The intensification agenda for Rwandan agriculture has been and continues to be critical. Given limited arable land, yield increases of staple crops are vital for increasing rural incomes and agriculture growth. Expanding high-value commodity crops is also important for increasing exports, increasing foreign exchange, reducing imports and sustaining growth of incomes for the long-term.
National agricultural policy and strategy environment
11. Over the last ten years, Rwanda has had a favorable agriculture policy environment which has provided the overall framework for designing sector strategies and programs that have driven both overall GDP and sector growth. These programs and strategies have also been an effective engine for poverty reduction as it has helped many Rwandans move closer to the poverty line as well as graduate from poverty.8 The overarching policy environment framework comprises Rwanda’s Vision 2020; Poverty Reduction Strategy Paper; National Agricultural Policy; Economic Development and Poverty Reduction Strategy 1 and 2;PSTA 1, 2 and 3; and CAADP 1 and 2.
12. During the first years of the new millennium, the Government, in dialogue with the principal participants among farmers, the private sector, and civil society, fashioned a long-term development strategy, which was articulated in the “Vision 2020” and “Poverty Reduction Strategy Paper” (PRSP) with the ultimate goals of eliminating poverty and attaining middle-income status by the year 2020. The strategy calls for the transition from a subsistence agriculture economy to a knowledge based society, with high levels of savings and private investment, resting on six pillars as a foundation for change: (i) Reconstruction of the nation and its social capital anchored on good governance, underpinned by a capable state; (ii) Transformation of agriculture into a productive, high-value, market-oriented sector, with forward linkages to other sectors; (iii) Development of an efficient private sector spearheaded by competitiveness and entrepreneurship; (iv) Comprehensive human resources development, encompassing education, health, and ICT skills aimed at public sector, private sector, and civil society; (v) Infrastructure development, entailing improved transport links, energy and water supplies, and ICT networks; and (vi) Promotion of regional economic integration and cooperation. These pillars are accompanied by three cross-cutting themes related to demography, health, and gender.
13. The Government of Rwanda formulated a National Agricultural Policy (NAP) in 2004.9 The goals of the NAP are to contribute to national economic growth, improve food security and the nutritional status of the population, and increase rural incomes. NAP’s five areas of focus are: (i) Food and nutrition security through the creation of an environment favorable to income generation and the implementation of nutrition interventions; (ii) Modern, professional, innovative, and specialized agriculture, becoming a profitable, all- year-round income generating activity; (iii) A market-oriented and social responsible agriculture, targeting domestic, sub-
8Ibid. 9 National Agricultural Policy, October 20, 2004.
4
regional, regional, and international markets; (iv) Fair distribution of benefits from all products resulting from different stages of production and processing; and (v) Integrated and diversified agriculture that is friendly to the environment.
14. MINAGRI developed the PSTA Phase 1 (2004-2007), Phase 2 (2008-2012) and Phase 3 (2013-2018) to implement the NAP. PSTA 1 was elaborated in 2004 with the main objective over the first 4 years to contribute to national economic growth, to achieve improved food security and nutritional status of the population, and to increase the incomes of the rural households. The strategy called for the transformation of agriculture into a modern, professionally operated, and market-oriented economic undertaking through promotion of professionalism, specialization, technological innovation, and public–private partnerships.
15. In its first Economic Development and Poverty Reduction Strategy (EDPRS 1, 2008-2012), the Government summarized its achievements and shortfalls under PSTA 1 to help articulate the goals and objectives of PSTA 2. The policy focus under EDPRS 1 was: (a) to accelerate growth and diversification by giving the private sector a bigger role; and (b) to further decentralize government functions, taking development decision-making closer to the people, but accompanied by strengthened accountability mechanisms. In the agricultural sector, the focus was on increasing and diversifying household incomes, while ensuring food security for all the members of the population.
16. Rwanda’s PSTA 2 agriculture strategy was also guided by, and in support of, the overall CAADP agenda.10 Rwanda was the first country to sign a CAADP Compact and prepare a sector investment strategy (PSTA 2) that was fully aligned with CAADP. One of the key objectives of the CAADP Compact and the Investment Plan was to progressively reach the 10 percent commitment of national budget allocated to agriculture to reach 6 percent agricultural annual growth by 2015. Four programs were developed to achieve the goals and objectives of PSTA 2/CAADP 1: (1) identify a series of actions to intensify and develop sustainable production systems in agriculture and animal husbandry; (2) build the technical and organizational capacity of farmers; (3) promote commodity chains and support for the development of agribusiness; and (4) strengthen the institutional framework of the sector at central and district levels. Having fulfilled CAADP 1, the country is preparing a second CAADP Compact and Investment Plan based on the PSTA 3.
17. The Government has begun implementation of the Second EDPRS 211 and PSTA 3 for the period 2013-2018. The objectives of PSTA 3 are to transform Rwandan agriculture from a subsistence sector to a knowledge-based sector and accelerate agricultural growth to increase rural incomes and reduce poverty. The strategy encompasses four broad program12 areas: (i) Agriculture and animal resource intensification; (ii) Research, technology transfer and professionalization of farmers; (iii) Value chain development and private sector investment; and (iv) Institutional development and agricultural cross-cutting issues.
10CAADP aims to help African countries reach a higher path of economic growth through agriculture-led development. CAADP's vision is to addresses policy and capacity issues across the entire agricultural sector on the African continent. CAADP is entirely African-led and African-owned and represents African leaders' collective vision for agriculture in Africa. 11Approved by Cabinet on May 8, 2013 and implementation began on July 1, 2013. 12 See Appendix 1 for detailed program information.
5
18. Under PSTA 3, the target for agricultural growth over the next five years is 8.5 percent per annum.13 GoR’s assumption is that achieving 8.5 percent agriculture growth will increase rural incomes, ensure inclusive growth and will contribute to achieving the EDPRS 2 target of 11.5 percent GDP growth per annum. The PSTA 3’s goal for poverty reduction is to reduce the incidence of poverty from 45 percent in 2012 to 20 percent in 2020. Other targets for year 2020 include: (i) external trade (exports plus imports) equal to 60 percent of GDP; (ii) the proportion of the population in the agricultural sector reduced to 50 percent; (iii) the share of agricultural operations mechanized equal to 40 percent; (iv) the Gini coefficient as a measure of income inequality to fall from 0.454 to 0.350; (v) the number of off-farm jobs to increase from 200,000 in 2000 to 3,200,000 in 2020; (vi) 100 percent of the population to have access to clean water and sanitation; (vii) 35 percent of the population living in urban areas; (viii) an infant mortality rate of 27 percent; and (ix) a literacy rate of 100 percent.14
3. Recent Performance of the Agriculture Sector and Emerging Insights Key Accomplishments of PSTA 2 and CAADP 1 (2008-2012) 19. During PSTA 2/CAADP 1 five year implementation period, the agriculture sector has been responsible for over 50 percent of the total poverty reduction of 12 percentage points. This was driven by increased production (productivity gains) and increased sales of production. Interventions which drove productivity gains (yield increases by up to 7 times and an average of 4 times across many crops), include implementation of the land use consolidation policy, protection against soil erosion, increased area under irrigation, access to agricultural finance, improved advisory services, expansion of input distribution networks and increased use of compost, agrochemicals and improved seeds inputs, increased market accessibility, improved marketing and product quality, and increased post-harvest infrastructure.15
20. Quantitative objectives and accomplishments of PSTA 2/CAADP 1 were measured using 23 specific performance indicators. Three main groupings of performance indicators, comparing established baselines and targets, measured: (i) sector macro performance; (ii) land intensification, improved inputs and irrigated land; and (iii) livestock, food and export crop performance.
Sector macro performance
21. The first grouping of performance indicators for PSTA 2/CAADP 1 which measured sector macro performance saw agriculture sector GDP growth average at 5.6 percent in 2012 and with agricultural investment as a percentage of GDP at 22.5 percent. Off-farm employment, as a share of total employment, was 26.6 percent, reduction in the share of rural population living in poverty was 49 percent, and the share of population falling below the minimum food requirement was 21 percent. Finally, the share of female-headed households
13 This is a 60 percent increase over the average annual rate over the last 10 years. 14 Cabinet Paper for Revised Vision 2020 Indicators and Targets, June 2012. 15 This led to a reduction in post-harvest losses to less than 15 percent of production.
6
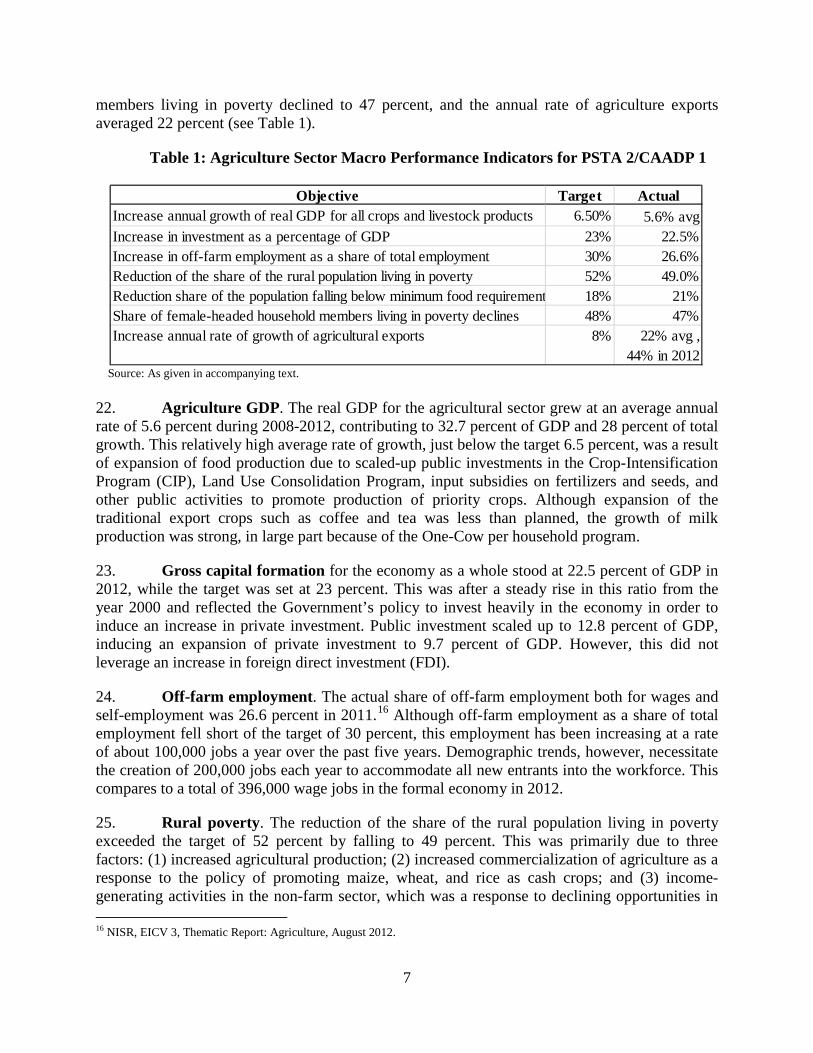
members living in poverty declined to 47 percent, and the annual rate of agriculture exports averaged 22 percent (see Table 1).
Table 1: Agriculture Sector Macro Performance Indicators for PSTA 2/CAADP 1
Source: As given in accompanying text. 22. Agriculture GDP. The real GDP for the agricultural sector grew at an average annual rate of 5.6 percent during 2008-2012, contributing to 32.7 percent of GDP and 28 percent of total growth. This relatively high average rate of growth, just below the target 6.5 percent, was a result of expansion of food production due to scaled-up public investments in the Crop-Intensification Program (CIP), Land Use Consolidation Program, input subsidies on fertilizers and seeds, and other public activities to promote production of priority crops. Although expansion of the traditional export crops such as coffee and tea was less than planned, the growth of milk production was strong, in large part because of the One-Cow per household program.
23. Gross capital formation for the economy as a whole stood at 22.5 percent of GDP in 2012, while the target was set at 23 percent. This was after a steady rise in this ratio from the year 2000 and reflected the Government’s policy to invest heavily in the economy in order to induce an increase in private investment. Public investment scaled up to 12.8 percent of GDP, inducing an expansion of private investment to 9.7 percent of GDP. However, this did not leverage an increase in foreign direct investment (FDI).
24. Off-farm employment. The actual share of off-farm employment both for wages and self-employment was 26.6 percent in 2011.16 Although off-farm employment as a share of total employment fell short of the target of 30 percent, this employment has been increasing at a rate of about 100,000 jobs a year over the past five years. Demographic trends, however, necessitate the creation of 200,000 jobs each year to accommodate all new entrants into the workforce. This compares to a total of 396,000 wage jobs in the formal economy in 2012.
25. Rural poverty. The reduction of the share of the rural population living in poverty exceeded the target of 52 percent by falling to 49 percent. This was primarily due to three factors: (1) increased agricultural production; (2) increased commercialization of agriculture as a response to the policy of promoting maize, wheat, and rice as cash crops; and (3) income-generating activities in the non-farm sector, which was a response to declining opportunities in
16 NISR, EICV 3, Thematic Report: Agriculture, August 2012.
Objective Target ActualIncrease annual growth of real GDP for all crops and livestock products 6.50% 5.6% avgIncrease in investment as a percentage of GDP 23% 22.5%Increase in off-farm employment as a share of total employment 30% 26.6%Reduction of the share of the rural population living in poverty 52% 49.0%Reduction share of the population falling below minimum food requirement 18% 21%Share of female-headed household members living in poverty declines 48% 47%Increase annual rate of growth of agricultural exports 8% 22% avg ,
44% in 2012
7

agriculture for those with limited land holdings and low wages available to the poor in the non-farm sector.17
26. Minimum food requirement. The share of the population falling below the minimum food requirement was reduced to 21 percent, slightly above the target of 18 percent. This statistic comes from the 2012 Comprehensive Food Security and Vulnerability Analysis and Nutrition Survey that is sensitive to seasonal timing so it is probable that a year-long survey might have shown a higher percentage of households with acceptable food consumption.18 The survey is also influenced by year to year variations in food production and income, with 2012 being a particularly low year in production due to weather extremes. The policy of promoting maize, wheat, and rice did not encourage production of food crops such as bananas, beans, and cassava for the food insecure.
27. Share of female-headed household members living in poverty. According to Enquête Intégralesur les Conditions de Vie des Ménages (Integrated Household Living Conditions Survey) (EICV 3), the share of female-headed household members living in poverty declined to 47 percent, which was below the target of 48 percent. This was due to the fact that the consumption standard of the poorest households, in which women-headed households are disproportionately represented, gained more in percentage terms than that of any other group.19
28. Growth rate of agriculture exports. The annual rate of growth from 2007 to 2012 of the value of agricultural and livestock exports was 22 percent. The most important increases occurred for live bovine animals, wheat flour, and beverages. Although the share of processed products in total agricultural and livestock exports was only 26 percent in 2012, processed exports grew at an annual rate of 53 percent from 2007 to 2012, contributing to overall export growth. The annual growth of the value of primary product exports was 17 percent, still a very respectable rate.
Land intensification, inputs and irrigated land performance
29. In the second grouping of performance indicators, between 2008-2012, the area protected against soil erosion rose to 73 percent, land protected by trenching and terraces increased by 46,246 ha of newly constructed terraces, 23,000 ha of marshlands developed, hillside irrigated land increased by 2,490 ha and land area under consolidated use increased from 28,788 to 502,916 ha, use of inorganic fertilizer increased from 12 to 29 percent and fertilizer imports increased from 29,900 to 44,000 metric tons (see Table 2).
17 World Bank, Rwanda Economic Update: Maintaining Momentum, with a special focus on Rwanda’s Pathway out of poverty, May 2013, Edition No. 4. 18 MINAGRI, NISR, and World Food Program (WFP), “Comprehensive Food Security and Vulnerability Analysis and Nutrition Survey 2012,” December 2012, pp. 31-35. 19 World Bank, Rwanda Economic Update: Maintaining Momentum, with a special focus on Rwanda’s Pathway out of poverty, May 2013, Edition No. 4.
8

Table 2: Land Intensification, Inputs and Irrigated Land Achievements for PSTA 2/CAADP 1
Source: As given in accompanying text. 30. Area protected against soil erosion. The percentage of coverage and effectiveness of soil conservation infrastructure increased from 600,000 ha to 1,095,914 ha out of total cultivable area of 1.5 million ha, for a total of 73 percent coverage. While the target was 100 percent, the achievement of almost doubling the coverage of area protected against soil erosion is impressive. This was driven by the CIP and externally financed projects which included a soil conservation focus.
31. Land protected by trenches and progressive terraces. Land management, including progressive terracing where this could be applied and was needed, was improved on approximately 300,000 ha. This increased from 504,000 ha to 802,292 ha. Much of this land had already been terraced prior to PSTA 2, but these terraces and trenches were in need of maintenance and some improvement. The Government at both the federal and local levels spearheaded this effort.
32. Hectares of newly constructed terraces. As a major component of the CIP and Land Use Consolidation Program, the area of land developed with bench/radical terraces attained 46,246 ha in 2012, substantially exceeding the target of 32,000 ha. This form of land protection is more costly than progressive terracing since it involves removing the topsoil, cutting into the hillside, and returning the topsoil and other interventions to restore and improve soil fertility. Since this type of work is done manually, it has the advantage of employing a significant amount of labor. Even though the employment is temporary, it injects substantial cash resources into the rural economy, which was shown to be used to purchase livestock or equipment and to invest in non-agricultural activities. Furthermore, the economic cost of this labor is less than the wages actually paid since the workers hired had few alternative opportunities.
33. Area of developed marshland increased. Development of marshlands was a major element in the Government’s effort to expand rice production and increase food security. The area under irrigation in the marshlands increased to 23,000 ha, well above the target of 20,000 ha. Although the cost of marshland development for irrigation (US$6,000 - $8,000 per/ha) is much lower than the cost of developing irrigation on many of the hillsides (up to US$23,000 per/ha), marshland development costs are rising as the easiest, lowest-cost locations are being developed. However, these costs are to a large extent borne by the Government in cooperation
Objective Baseline Target ActualAgriculture area protected against soil erosion increased 40% 100% 73%Land protected by trenches and progressive terraces increases 504,000 860,000 ha 802,292 haHectares of newly constructed terraces 0 32,000 ha 46,246 haArea of developed marshland increased 0 20,000 ha 23,000 haIrrigated area on hillsides increased 0 13,000 ha 2,490 haLand area under consolidated use 28,788 - 502,916 haApplication of inorganic mineral fertilizer increased 12% 25% 30%Increase in tonnage of fertilizer imported (MT) 22,900 56,000 44,000
9
with the development partners. The marshland rice development program is very popular with the farmers, having provided cash income to about 150,000 farm households.
34. Hillside irrigation was developed during PSTA 2 on 2,490 ha compared with the target of 13,000 ha. A major reason for this gap was its high cost of up to US$23,000 per ha. This compares with the cost of small-scale irrigation schemes of about US$1,500. Cost recovery requires high-value horticultural or other high income crops.
35. Land area under consolidated use. No explicit target was established for increased land area put under consolidated use, it was an important focus of the crop intensification program by improving the efficiency of land use and facilitating extension. Actual results were significant. From 28,788 ha of total area under consolidated use in 2007, it rose to 502,916 ha in 2012. Although farmers had some reservations in the beginning, most became willing converts once the benefits were established of achieving economies of scale in securing inputs and marketing production.
36. Application of fertilizer. The percentage of farmers who reported having purchased fertilizers increased from 7 percent in 2001 (12 percent in 2008) to 30 percent in 2011 compared with the target rate of 25 percent. More specifically, the fertilizer application rate in CIP areas reached an annual average of 29 kg/ha in 2012 compared to a national average of 4.2 kg/ha during 1998-2005. Such increases were due partly to the 50 percent subsidy policy on fertilizer applied to maize and wheat, as well as the transport subsidy on fertilizer for rice and potatoes. As a result, average maize yields increased from 0.73 MT/ha in 2007 to 2.76 MT/ha in 2012, while wheat yields increased from 1.30 MT/ha to 2.17 MT/ha during the same period.
37. Fertilizer imports. Use of imported mineral fertilizers rose to 44,000 MT in 2012, compared with the national target of 56,000 MT. The shortfall was principally due to challenges of cost and credit recovery along the whole supply chain from distributor to farmer. Providing direct subsidies for fertilizer used in the production of maize and wheat and subsidizing the international transport of fertilizer from Mombasa or Dar es Salaam for rice and Irish potatoes proved to be expensive and there were difficulties in the printing and distributing of subsidy vouchers and monitoring their use. There was also a lack of profitability in the distribution chain, which resulted in high default rates on fertilizer loans among farmers and agro-dealers.
Livestock, food and export crop performance
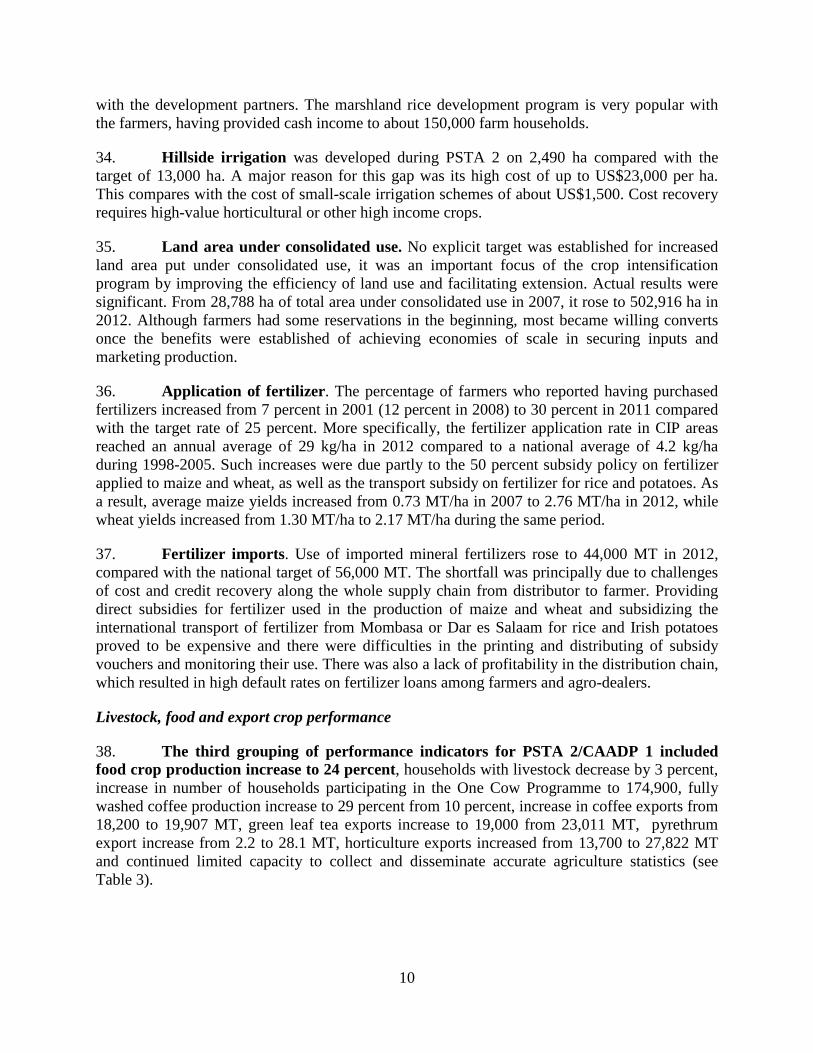
38. The third grouping of performance indicators for PSTA 2/CAADP 1 included food crop production increase to 24 percent, households with livestock decrease by 3 percent, increase in number of households participating in the One Cow Programme to 174,900, fully washed coffee production increase to 29 percent from 10 percent, increase in coffee exports from 18,200 to 19,907 MT, green leaf tea exports increase to 19,000 from 23,011 MT, pyrethrum export increase from 2.2 to 28.1 MT, horticulture exports increased from 13,700 to 27,822 MT and continued limited capacity to collect and disseminate accurate agriculture statistics (see Table 3).
10
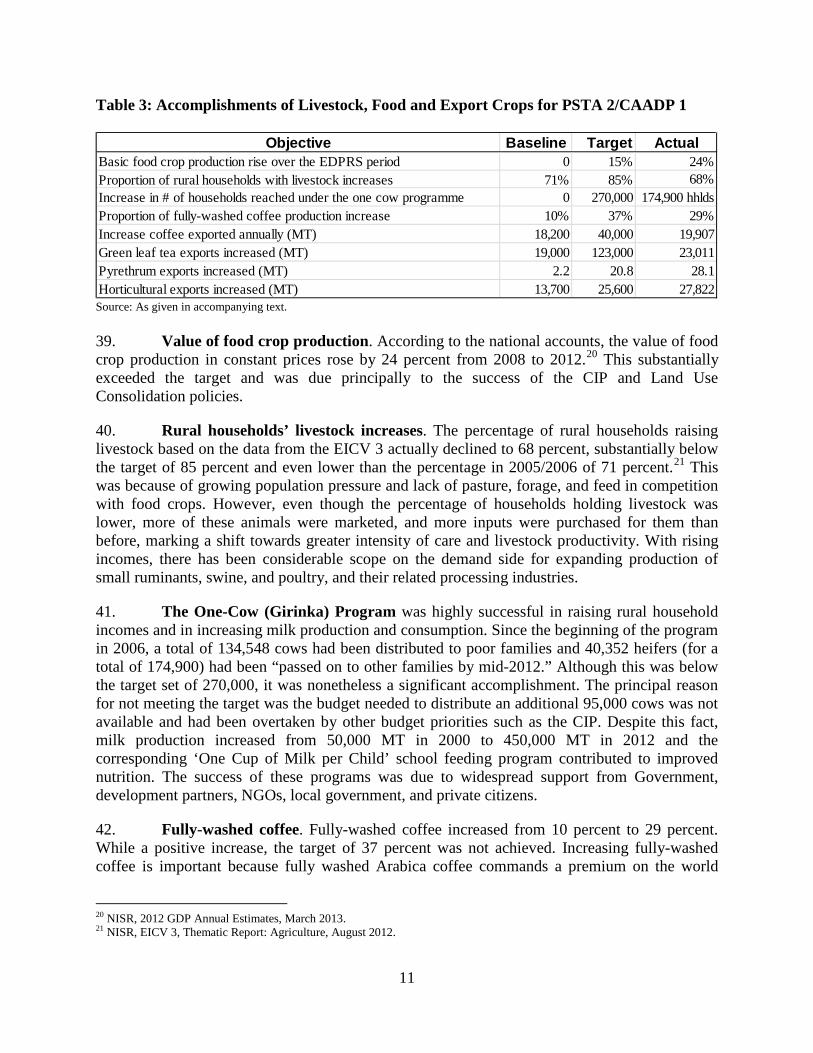
Table 3: Accomplishments of Livestock, Food and Export Crops for PSTA 2/CAADP 1
Source: As given in accompanying text. 39. Value of food crop production. According to the national accounts, the value of food crop production in constant prices rose by 24 percent from 2008 to 2012.20 This substantially exceeded the target and was due principally to the success of the CIP and Land Use Consolidation policies.
40. Rural households’ livestock increases. The percentage of rural households raising livestock based on the data from the EICV 3 actually declined to 68 percent, substantially below the target of 85 percent and even lower than the percentage in 2005/2006 of 71 percent.21 This was because of growing population pressure and lack of pasture, forage, and feed in competition with food crops. However, even though the percentage of households holding livestock was lower, more of these animals were marketed, and more inputs were purchased for them than before, marking a shift towards greater intensity of care and livestock productivity. With rising incomes, there has been considerable scope on the demand side for expanding production of small ruminants, swine, and poultry, and their related processing industries.
41. The One-Cow (Girinka) Program was highly successful in raising rural household incomes and in increasing milk production and consumption. Since the beginning of the program in 2006, a total of 134,548 cows had been distributed to poor families and 40,352 heifers (for a total of 174,900) had been “passed on to other families by mid-2012.” Although this was below the target set of 270,000, it was nonetheless a significant accomplishment. The principal reason for not meeting the target was the budget needed to distribute an additional 95,000 cows was not available and had been overtaken by other budget priorities such as the CIP. Despite this fact, milk production increased from 50,000 MT in 2000 to 450,000 MT in 2012 and the corresponding ‘One Cup of Milk per Child’ school feeding program contributed to improved nutrition. The success of these programs was due to widespread support from Government, development partners, NGOs, local government, and private citizens.
42. Fully-washed coffee. Fully-washed coffee increased from 10 percent to 29 percent. While a positive increase, the target of 37 percent was not achieved. Increasing fully-washed coffee is important because fully washed Arabica coffee commands a premium on the world
20 NISR, 2012 GDP Annual Estimates, March 2013. 21 NISR, EICV 3, Thematic Report: Agriculture, August 2012.
Objective Baseline Target ActualBasic food crop production rise over the EDPRS period 0 15% 24%Proportion of rural households with livestock increases 71% 85% 68%Increase in # of households reached under the one cow programme 0 270,000 174,900 hhldsProportion of fully-washed coffee production increase 10% 37% 29%Increase coffee exported annually (MT) 18,200 40,000 19,907Green leaf tea exports increased (MT) 19,000 123,000 23,011Pyrethrum exports increased (MT) 2.2 20.8 28.1Horticultural exports increased (MT) 13,700 25,600 27,822
11
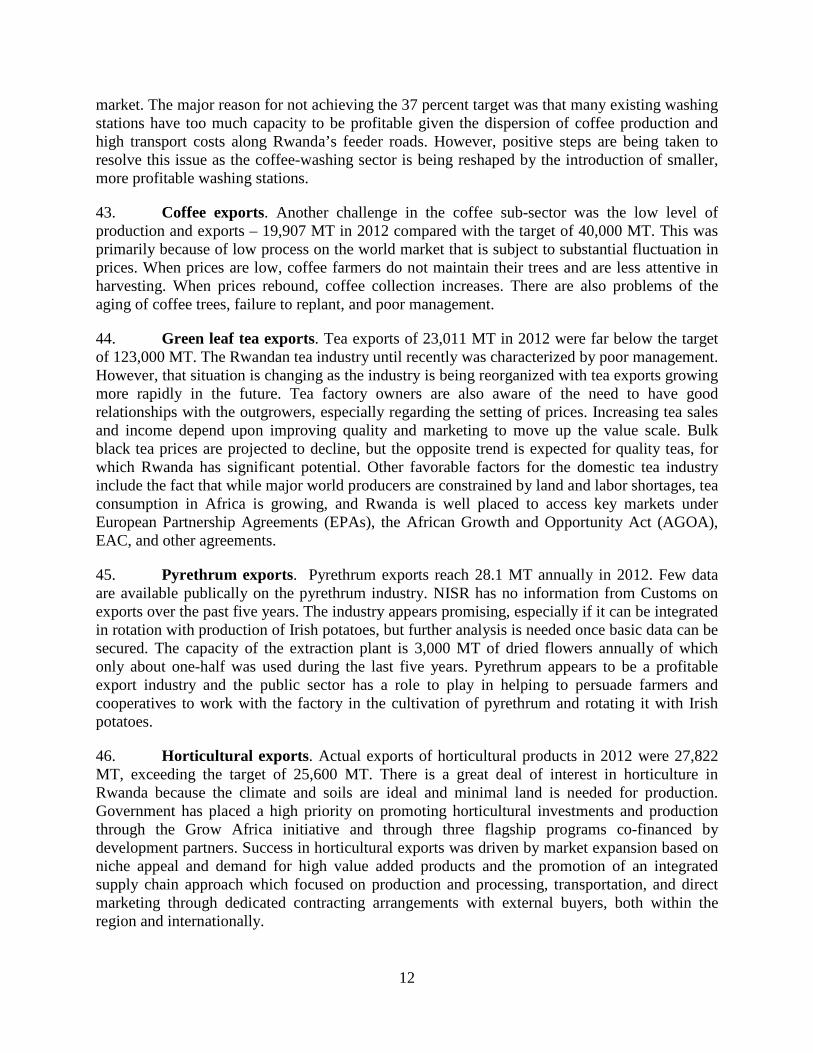
market. The major reason for not achieving the 37 percent target was that many existing washing stations have too much capacity to be profitable given the dispersion of coffee production and high transport costs along Rwanda’s feeder roads. However, positive steps are being taken to resolve this issue as the coffee-washing sector is being reshaped by the introduction of smaller, more profitable washing stations.
43. Coffee exports. Another challenge in the coffee sub-sector was the low level of production and exports – 19,907 MT in 2012 compared with the target of 40,000 MT. This was primarily because of low process on the world market that is subject to substantial fluctuation in prices. When prices are low, coffee farmers do not maintain their trees and are less attentive in harvesting. When prices rebound, coffee collection increases. There are also problems of the aging of coffee trees, failure to replant, and poor management.
44. Green leaf tea exports. Tea exports of 23,011 MT in 2012 were far below the target of 123,000 MT. The Rwandan tea industry until recently was characterized by poor management. However, that situation is changing as the industry is being reorganized with tea exports growing more rapidly in the future. Tea factory owners are also aware of the need to have good relationships with the outgrowers, especially regarding the setting of prices. Increasing tea sales and income depend upon improving quality and marketing to move up the value scale. Bulk black tea prices are projected to decline, but the opposite trend is expected for quality teas, for which Rwanda has significant potential. Other favorable factors for the domestic tea industry include the fact that while major world producers are constrained by land and labor shortages, tea consumption in Africa is growing, and Rwanda is well placed to access key markets under European Partnership Agreements (EPAs), the African Growth and Opportunity Act (AGOA), EAC, and other agreements.
45. Pyrethrum exports. Pyrethrum exports reach 28.1 MT annually in 2012. Few data are available publically on the pyrethrum industry. NISR has no information from Customs on exports over the past five years. The industry appears promising, especially if it can be integrated in rotation with production of Irish potatoes, but further analysis is needed once basic data can be secured. The capacity of the extraction plant is 3,000 MT of dried flowers annually of which only about one-half was used during the last five years. Pyrethrum appears to be a profitable export industry and the public sector has a role to play in helping to persuade farmers and cooperatives to work with the factory in the cultivation of pyrethrum and rotating it with Irish potatoes.
46. Horticultural exports. Actual exports of horticultural products in 2012 were 27,822 MT, exceeding the target of 25,600 MT. There is a great deal of interest in horticulture in Rwanda because the climate and soils are ideal and minimal land is needed for production. Government has placed a high priority on promoting horticultural investments and production through the Grow Africa initiative and through three flagship programs co-financed by development partners. Success in horticultural exports was driven by market expansion based on niche appeal and demand for high value added products and the promotion of an integrated supply chain approach which focused on production and processing, transportation, and direct marketing through dedicated contracting arrangements with external buyers, both within the region and internationally.
12
Other key accomplishments of PSTA 2/ CAADP 1 47. In addition to the achievements made against the 23 specific targets discussed above, there were other key accomplishments which, for various reasons, were not reported on because they were not easily linked to a specific target(s) or there was no data available to measure actual accomplishments. For example, under PSTA 2, there were significant achievements related to improved seeds and plant material, milk production, increase in fish production and beekeeping, decentralization of sector functions, and an increased “business friendly environment” as discussed below.
48. Improved seeds. The legal framework, upon which the basic infrastructure for reinforcing production and quality control and production of plant material and seeds is built, significantly increased during PSTA 2 implementation. However, there were insufficient quantities of improved seeds produced nationally for some crops, which forced the Government to import seeds, particularly for maize, wheat, and Irish potatoes. The quality of internally produced seed was poor, and there was quality deterioration during seed production and storage with prevalence of crop pests and diseases, germination of seeds distributed under the CIP was inadequate, and effective distribution of improved seed was limited.
49. Milk production. Although milk production expanded rapidly under PSTA 2, most of this was raw, unpasteurized milk due, in part, to competition in the processed milk market from regional neighbors with lower costs. The country’s milk processing plants were operating at only 15-20 percent of their capacity, and some milk collection centers (MCC) in the East have closed. Although consumption of raw fresh milk by poor households was a good way to improve their nutritional status, the growing market for dairy products in urban areas is putting pressure on the development of the processing industry.
50. Fisheries sector. In the fisheries sector, demand outpaced production, with consequent depletion of resources. Nevertheless, the sector has great potential and with improved management is capable of growing sustainably and of producing regional exports. Fish are also a nutritious addition to daily diets.
51. Beekeeping, while a small activity on the national scale, has been important for the communities involved, representing a significant source of additional income for poor families with marginal land for agriculture. There was particularly true in forested areas in the Southwest.
52. The implementation of decentralization of functions greatly enhanced the capacity of local governments to implement PSTA 2 despite varying staffing levels in districts and financial capabilities. District administrations are in close contact with cooperatives and farmers and have built up knowledge of the districts’ needs and opportunities for agricultural development. District staff also facilitated in the implementation of national projects and programs; they also acted as an interface, and promoted farmer-oriented extension approaches.
53. Business friendly environment. Rwanda’s focus on creating an enabling business environment for agribusiness investments during PSTA 2 is starting to pay off. Rwanda has the second most business friendly environment when compared to its Africa competitors (Mauritius
13
is first).22 It was recently ranked 32nd in the world. It offers less bureaucratic red-tape, easier access to credit, and lower tax rates compared to its neighbors. The Government is actively seeking private sector investment in the country, particularly in the agriculture sector. The country’s political and macroeconomic stability, compared to other countries in Africa, provides investors with confidence regarding country risk. Furthermore, the Government is committed to investment in infrastructure that will facilitate trade originating from Rwanda, including increased air connectivity, improved road networks, a rail link with coastal ports, and expansion of the electricity supply.
Lessons Learned from PSTA 2/CAADP 1 and Recommendations for PSTA 3/CAADP 2 54. In addition to understanding how and what was achieved in PSTA 2/CAADP 1, it is also important to identify lessons learned and implications for PSTA 3. There were many factors responsible for Rwanda’s rapid rate of economic growth, including the establishment of a good business enabling environment and well directed public investments. It is vitally important that public investment be sustained under PSTA 3 and that it be directed in ways that are most cost-effective in achieving the goals of EDPRS 2 and Vision 2020. Moreover, efficiently directed public investment is critical to inducing private investment along with a more focused approach to increase FDI. Key recommendations for PSTA 3 include the development of a strategy for the extreme poor rural farmer, expand CIP and LUC Programs, non-farm employment, value addition of key commodities, increase soil conservation coverage, selectivity in hillside irrigation schemes, expand livestock intensification, increase awareness of horticulture opportunities, establish feeding limits for The Girinka Program, expand coffee and tea production, and increase reliability of agriculture statistics.
55. Develop strategy for extreme poor. Under PSTA 2, both food production and food marketing were substantially increased, thereby helping to drive poverty rates down. However, there are still a large number of people in the rural areas who continue to live in poverty and there is a need to develop a strategy of crop and livestock intensification and diversification focused on the extreme poor. Relying on secondary benefits in the form of increased demand for the goods and services supplied by small, informal household businesses would be important. At the same time, Rwanda is making good progress in reducing the number of malnourished, but further progress depends on targeting this group more carefully with food crops which they consume.
56. Expand the Crop Intensification Program (CIP) and the Land Use Consolidation (LUC) Programs. The CIP and LUC, along with fertilizer and improved seeds subsidy programs, and land development costs, were important in contributing to the expansion of food crop production. The CIP and LUC Programs need to be further expanded to geographic areas not currently covered to induce greater participation by extremely poor smallholder farmers and include a greater focus on food crops that are consumed particularly by poor households. The current exit strategy for disengaging from the subsidy scheme for fertilizer and improved seeds should be completed as farmers have learned about and experienced the benefits of fertilizer and improved seeds over the last 5 years. Moreover, completing the privatization of import and
22Doing Business 2014, Economy Profile: Rwanda, 2013, World Bank and IFC.
14
distribution of fertilizer should be actively pursued by the Government and carefully monitored to ensure that the change in policy does not endanger the uptake rates of fertilizer and improved seeds. It is also important to recognize that the reduction in poverty that occurred was not because the extreme poor participated fully in both CIP and LUCP. In fact, they participated less than in proportion to their numbers. Yet their participation may have helped them to become more market oriented. Equally important was their income from the sales of non-farm goods and services. There were increased risks, in fact, associated with dramatic changes in cropping patterns towards less familiar cash crops that were exchanged for food in uncertain markets and for which there were significant transactions costs.
57. Grow non-farm employment. Although progress has been made in increasing the number of off-farm jobs over the last five years, the rate of increase is not keeping up with the growth of the labor force. Keeping the growing work force fully employed is going to require additional analysis of how these jobs are created via value chain linkages and growth in overall income and demand. Specific attention must be paid to the policies that can be adopted to encourage the most cost-effective expansion of non-farm employment.
58. Expand market opportunities in key value chains. Rwanda has a dynamic and growing export sector, but the share of processed products in total agricultural and livestock exports is relatively small. Government should identify opportunities and promote actions that need to be taken by both public and the private sectors in key value chains such as coffee, tea, horticulture to expand market oriented growth. A joint public-private strategy should be developed and implemented under PSTA 3, in cooperation with Rwanda’s neighboring countries, to formalize and expand cross-border trade without introducing unnecessary barriers to trade. This strategy should involve improved transportation and storage infrastructure, maintaining grades and standards for the most important products, facilitating customs and other clearances, etc.
59. Improve soil conservation coverage. During PSTA 2, the large increase in the area of land that was protected against soil erosion was accomplished at relatively low cost. Protecting farm land with trenches and progressive terraces (slopes of 40-60 percent) is a traditional practice that can be made more effective with a modest amount of organization and technical assistance. Bench/radical terraces are more costly but necessary where slopes are between 16-40 percent slope. The intensive labor necessary to construct radical terraces becomes an important means of injecting cash into the local economy. However, development of marshlands for rice and high value crops is increasing in cost as the low cost marshlands have either been developed or redeveloped. At some point in the near to medium-term the cost of the expansion of these systems will exceed the benefits.
60. Selective hillside irrigation schemes. Hillside irrigation can be an expensive form of infrastructure. Economic and financial analysis for each scheme should justify the investment and cost per beneficiary as compared to other sectoral investments. It is most likely that only high-value crops will justify the high level of investment.
61. Increase livestock intensification. Higher level of use of crop residues, agricultural byproducts, and feed mixes is vital to intensification and expansion of the livestock sector, given the shortage of land available for pasture or forage.
15
62. Raise awareness of horticulture sub-sector opportunities. Horticulture has the potential to significantly expand as an export industry. Markets and production potential for specific crops need to be identified, their economics studied, and the results made available to potential private investors.
63. Establish feeding limits for The Girinka. The Girinka (One-Cow) program has been a success in terms of the number of dairy cows distributed, but it has not benefitted the poor as much as expected because of their lack of access to pasture and feed. An estimate should be made on the total number of cows that can be supported with available crop residues, by-products, forage, and pasture and a limit of additional heifers to be distributed set accordingly. It will also be important that PSTA 3 contains measures to establish local redistribution systems that ensure that the majority of Girinka milk is consumed by nearby households and in local schools rather than distributed through a high-cost centralized school milk program.
64. Nutrition and Household Vulnerability. A multi-sectoral framework of integrated interventions is required to tackle problems of malnutrition and household vulnerability, including supporting households in nutritious garden practices and diversifying food production, improving nutrition-related knowledge and practices, developing a program of bio-fortified food, expansion of the One-Cup-of-Milk-Per-Child program, maintaining the National Strategic Food Reserve, and strengthening Rwanda’s Food Security Information System.
65. Expand coffee and tea production. Coffee and tea are valuable export crops. More investment is needed to increase smaller washing stations, greater care of plants in the field and other measures to improve coffee quality. Surveys need to be conducted of coffee farmers to establish their cost of production and to devise a cost-effective strategy for increasing production. Participation in the coffee futures market to reduce uncertainty of pricing should be explored. For tea, the transition to private sector ownership and management should be carefully facilitated with policies and models that provide sufficient incentives to farmers to increase yields and expand production and that are monitored to identify and deal with challenges as they arise.
66. Increase reliability of agriculture statistics. An important goal of PSTA 3 is to improve the reliability of agricultural statistics in close coordination with NISR. Capacity building is required to collect and disseminate accurate agricultural statistics that are needed for making effective policy decisions.
4. Achieving Government's Growth and Poverty Reduction Policy Objectives in PSTA 3
67. Rwanda is experiencing its best growth performance since independence accompanied by stellar progress in reducing poverty. However, recent economy wide growth is primarily led by non-tradable services, in particular construction, transport, hotels and restaurants, and expansion of public services (e.g. education). The public sector dominates investment, and the bulk of public investment is financed by foreign loans and grants that
16
supports Rwanda’s development agenda. Foreign financing tends to place an upward pressure on exchange rates, which might in turn affect competitiveness.23 The challenge now facing the country is how to improve competitiveness and more private sector led growth to meet the development challenges facing Rwanda. A strategy to improving competitiveness through innovation and technology – through both domestic generation (research) and transfer from abroad should be explored and adopted.
68. Due to limited growth opportunities in the tradable sector in the near term, the important role of agriculture needs to be considered in the broad development strategy, not only for its role in poverty reduction, but also in economic growth and transformation. As agriculture continues to be one of the most important growth pillars for Rwanda and to achieve double-digit annual GDP growth rate and become a low middle-income country by 2020, an annual growth rate for Rwanda’s agriculture was set at 8.5 percent per year for 2014-2018. To achieve this agriculture growth goal, what will it imply for the different agricultural subsectors and how will these subsectors contribute to total agricultural and overall economic growth and poverty reduction?
Computable General Equilibrium (CGE) Model
69. With the forward looking nature of the above questions, a 54-sector dynamic Computable General Equilibrium (CGE) model was developed for Rwanda to assess the relationship between subsector growth and total agricultural growth, and overall economic growth and poverty reduction (IFPRI, 2014).24 Using data from the agricultural survey (2008), EICV 3, and bi-annual crop assessments at provincial level for major crops, and a set of other statistics for trade, non-agriculture and macroeconomic variables, six scenarios are analyzed: (i) base-run growth; (ii) food crop-led growth; (iii) export crop-led growth; (iv) livestock-led growth; (v) agricultural-led growth; and (vi) agriculture and non-agriculture growth. The total factor productivity (TFP) growth rate for crop production in the base-run growth scenario is crop and provincial specific crop using the information of historical trends in yield growth at crop and provincial level. Additional growth rate is added to the base-run rates in alternative growth scenarios for the relevant crops, livestock production or non-agriculture. The simulation results of annual growth rate for GDP and sector GDP under all growth scenarios are displayed in Figure 1.
70. Like any other economic model, the CGE model has its limitations. For example an important caveat has to do with the structure of consumer demand. Even though the parameters are estimated using income elasticity of demand and by taking into account subsistence consumption in the demand functions, the use of a linear expenditure system to define the demand system and to specify household demand for individual commodities can only partially capture demand dynamics. Rapid demand shifts can be better captured by using an implicit direct
23Tradable goods are those that have export or import potential. Some good are non-tradable goods by their nature or due to high transportation costs per product unit, high tariffs or other restrictions. Examples of internationally non-tradable goods may be found in the sectors of housing, electricity generation, transport, educational services, personal services, etc. 24 International Food Policy Research Institute, “The Role of Agriculture in the Fast Growing Rwandan Economy: Assessing Growth Alternatives”, Rwanda CAADP 2 Background Paper #2, Feb 2014.
17

additive demand system or by applying latent separability, but the highly disaggregated demand structure in the model constrains the choice of methods. Given that the current income level is extremely low for a majority of Rwandan households, rapid demand shifts in household food and nonfood demand will likely not occur over a period of 10 years, and this relatively linear demand system may be less questionable for the study in the context of the Rwandan economy. 71. Second, as with most CGE models, production technologies that are calibrated to the initial economic structure remain constant over time. That is to say, similar to the demand system, production functional forms (including the parameters and elasticity’s of the functions) are given. That does not imply a constant economic structure over time, as the share of each production sector in the overall economy can change as productivity growth and price evolution vary across sectors and over time. However, with given production functions, the model simulations cannot capture the substantial technological changes and innovations that may be embodied in new investments, especially foreign direct investments, which technically involve changes in the functional forms for those production sectors that are more dynamic. 72. Third, the expansion of manufacturing or any sector that is relatively technologically intensive can generate many externalities and spillovers, and the social value of new investments in such sectors can greatly exceed their private value. As such, with its neoclassical theoretical foundation, a typical CGE model is generally unable to capture increasing returns to scale and technological externalities and spillovers. Such models may therefore underestimate the contribution of growth in nontraditional and import-substitutable agriculture and the contribution of new manufacturing activities to structural change if rapid growth occurs over a relatively long period. 73. Finally, the model does not take into account the interaction between agricultural growth and environmental degradation, which has become important in analyzing agricultural growth options, given changing global climate conditions. Rwanda is one of the few African countries in which population pressure and low agricultural productivity have resulted in bringing more and more marginal land into cultivation. Environmental degradation has challenged the long-term development of the Rwandan economy and must be taken into consideration in an agricultural development strategy. Although empirical research has firmly established that productivity growth may help in subsistence agriculture, more intensive land use in commercial agriculture (such as export agriculture) to reduce deforestation may have serious long-term consequences for water quality and soil losses. Different policies provide different incentives for the private sector to develop either land- or labor-intensive tropical agricultural production, which can lead to various environmental outcomes. Because the model has not taken this relationship into consideration, it cannot to be used to analyze the effects of different policy options on poverty reduction and income growth when the environmental factor is taken into account.
18
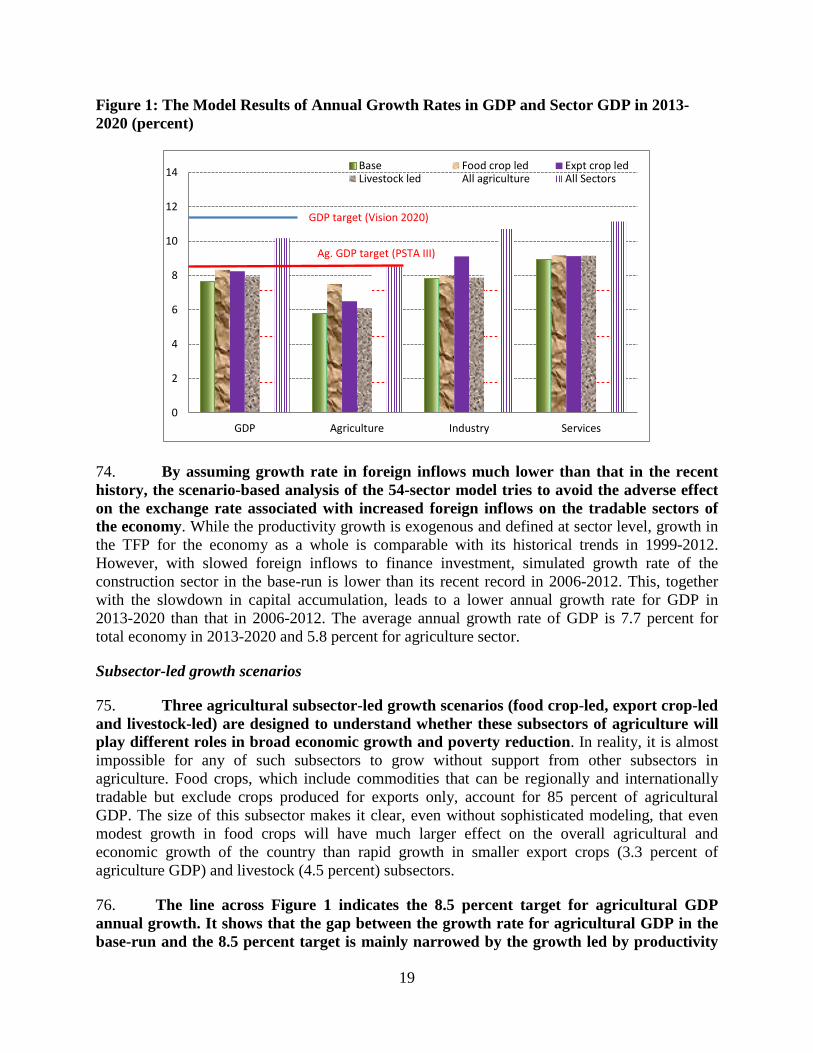
Figure 1: The Model Results of Annual Growth Rates in GDP and Sector GDP in 2013-2020 (percent)
74. By assuming growth rate in foreign inflows much lower than that in the recent history, the scenario-based analysis of the 54-sector model tries to avoid the adverse effect on the exchange rate associated with increased foreign inflows on the tradable sectors of the economy. While the productivity growth is exogenous and defined at sector level, growth in the TFP for the economy as a whole is comparable with its historical trends in 1999-2012. However, with slowed foreign inflows to finance investment, simulated growth rate of the construction sector in the base-run is lower than its recent record in 2006-2012. This, together with the slowdown in capital accumulation, leads to a lower annual growth rate for GDP in 2013-2020 than that in 2006-2012. The average annual growth rate of GDP is 7.7 percent for total economy in 2013-2020 and 5.8 percent for agriculture sector.
Subsector-led growth scenarios
75. Three agricultural subsector-led growth scenarios (food crop-led, export crop-led and livestock-led) are designed to understand whether these subsectors of agriculture will play different roles in broad economic growth and poverty reduction. In reality, it is almost impossible for any of such subsectors to grow without support from other subsectors in agriculture. Food crops, which include commodities that can be regionally and internationally tradable but exclude crops produced for exports only, account for 85 percent of agricultural GDP. The size of this subsector makes it clear, even without sophisticated modeling, that even modest growth in food crops will have much larger effect on the overall agricultural and economic growth of the country than rapid growth in smaller export crops (3.3 percent of agriculture GDP) and livestock (4.5 percent) subsectors.
76. The line across Figure 1 indicates the 8.5 percent target for agricultural GDP annual growth. It shows that the gap between the growth rate for agricultural GDP in the base-run and the 8.5 percent target is mainly narrowed by the growth led by productivity
0
2
4
6
8
10
12
14
GDP Agriculture Industry Services
Base Food crop led Expt crop ledLivestock led All agriculture All Sectors
GDP target (Vision 2020)
Ag. GDP target (PSTA III)
19
improvement and area expansion of the six targeted food crops. Actually, additional productivity growth and area expansion in only six food crops leads to an increase in the annual growth rate of total food crops by 2.1 percentage points above the base-run, which results in additional 1.7 and 0.65 percentage points of growth that occurs annually in agricultural GDP and GDP in 2013-2020, respectively. The growth contribution of food crops to the overall economic growth is not just because of its significant size in agriculture, but also because of strong multiplier effect, i.e., through the consumption linkage effect where 1 percent growth in food crops generates a 0.11 percent of growth in non-agriculture sector annually.
77. Growth in export crops will of course lead to a significant growth in total agricultural exports (Figure 2). Under “export crop-led growth” scenario, agricultural exports will grow at 16.8 percent and total exports grow at 11.3 percent annually. With export crop-led growth, the difference in agricultural exports between 2012 and 2020 will rise to US$600 million. The agricultural sector is a trade surplus sector with its exports of US$170 million more than its imports in 2011. The further expansion of export crops at a more rapid pace will allow the surplus in agricultural trade to increase significantly to US$550 million by 2020, and such surplus will help the country overcome its foreign currency constraint in developing its manufacturing and importing energy products.
Figure 2: Model Result of Annual Growth Rate in Agricultural Trade in 2013-2020 (percent)
78. The results from the simulation of export crop-led growth demonstrate the important role of the subsector on foreign exchange earnings. Rapid growth in traditional export crops can generate foreign income quickly, and is much more efficient than targeting nontraditional exports that have a small initial base. Growth in nontraditional exports can be extremely high while the sector still could not deliver enough total growth for the export sector as a whole. Tripling growth rate of export crops directly leads to tripling of agricultural export earnings. With underemployed labor force, growth in the export sector also creates more employment opportunities. Thus, with 22 percent of annual growth rate in export crops as a
0
2
4
6
8
10
12
14
16
18
Base Food crop-led Expt crop-led Livestock-led All agriculture All sectors
Exports Imports
20

subsector of agricultural GDP, additional annual growth rate in agricultural GDP and total GDP is 0.71 and 0.57 percentage points, respectively (see Table 4). Considering its small share in GDP, growth impacts of the export crops is impressive particularly for overall economic growth.
79. In national accounts, livestock is only about 4.5 percent of agricultural GDP and its growth rate in recent years is reported at 3.3 percent.25 Nevertheless, an extremely optimistic growth scenario for cow/milk and poultry sector in the livestock-led growth simulation results in 12 percent annual growth rate of the subsector as a whole. However, with its small size in the economy, a 12 percent of annual growth rate in the livestock subsector is associated with 0.32 and 0.27 percentage points of additional annual growth rate in agricultural GDP and total GDP respectively. Additionally, livestock growth has the strongest multiplier effects, concentrated in two nonagricultural subsectors, both having livestock products as important intermediate inputs. Thus the linkage effect for livestock growth on the nonagricultural sector is in the downstream production process (not through the consumption effect as observed in the growth led by food crops).
Sector level growth scenario
80. When the three subsectors’ growth is combined and simulated in an agriculture-led growth scenario, total agricultural GDP will grow at 8.4 percent and GDP at 9.1 percent annually. With strong multiplier effects of agricultural growth on nonagricultural growth, an additional 2.6 percent annual growth in agriculture creates 0.9 percentage points of additional annual growth in the nonagricultural sector. When agricultural growth is combined with additional growth in the nonagricultural sector by doubling productivity of all nonagricultural sectors, GDP annual growth rate rises to 10.2 percent and agricultural GDP to 8.5 percent, i.e., agricultural growth also benefits from the multiplier effects of nonagricultural growth: the additional 0.1 percentage points of annual growth in the agricultural GDP is stimulated by additional 1.5 percentage points of annual growth in nonagricultural GDP.
Table 4: Agriculture Sector Growth Led Scenarios Growth Driver Ave. Growth Rate
(percent) Contribution to Ag.
GDP (percent) Contribution to overall
GDP (percent) Crop-led 2.1 1.7 0.65 Export-led 22.0 0.71 0.57 Livestock-led 12.0 0.32 0.27 Ag. combined 8.4 2.6 0.90 Combined with Non ag. sector
8.5 0.1 1.50
81. The overall model simulation, i.e., combining additional growth in both agriculture and non-agriculture, does not result in 11.5 percent of annual growth rate for GDP, a growth target set by the Government for Rwanda to become a low middle-income country in 2020. However, simulated growth structure is much healthier than the current pattern
25 While the One-Cow per poor rural family program is reported to have made significant progress in the recent years, the outcome does not show up in macro data.
21
of growth, as manufacturing growth rate of 12.7 percent is highest among all main economic sectors and construction grows at only 9.7 percent. Together with much lower growth in foreign inflows, if Rwanda can achieve the growth structure described by the model simulation, it can expect that growth will be more sustainable than the current pattern of growth.
82. The model simulates an optimistic agricultural growth scenario, i.e., achieving 8.5 percent of annual growth for the agricultural sector in a period of 7 years. Rwandan agriculture will continue to depend on rainfall for most crop production in the near future, and thus, growth fluctuation due to weather conditions is unavoidable and should be expected for agriculture. While it might be possible for agriculture to grow at even higher rates with favorable weather conditions in a good year, it will be a challenge to maintain the average annual growth rate of 8.5 percent for the proposed 7 year period. Thus, it needs to be kept in mind that achieving such a sustained ambitious growth target will be difficult.
Sufficient market demand
83. The model result shows that with more rapid growth in the nonagricultural sector, rapid growth in agriculture is unlikely to be constrained by the market opportunities at home. Relative prices for some fast growing agricultural commodities may fall, but in most cases, the declines are modest. This result seems to indicate that Rwanda’s domestic market still has enough room for agriculture to grow, when there is strong growth in its nonagricultural economy. Combined with the simulation result for the export crop led growth, it indicates that while promoting export growth is important for foreign exchange earnings, from a growth point of view, Rwanda’s economic growth in the near future will be more domestic market oriented. This suggests the need to pursue a dual pronged approach and parallel track of promoting increased agriculture exports and at the same time promoting a market-led expansion of food crops for domestic markets.
84. Rwanda’s growth will continue to lead poverty reduction, not only in terms of national poverty rate declines, but also the reduction of the absolute number of poor population. With less than 8 percent of GDP growth and 2.6 percent of population growth per year in the base-run, Rwanda will be able to achieve Millennium Development Goals (MDG) 1 (halve the proportion of people whose incomes is less than $1.25 a day) by 2020. More rapid growth is associated with more rapid reduction in the poverty, and at 10 percent GDP growth rate, Rwanda will likely halve its 2000’s poverty rate by 2018. In all scenarios, the absolute number of poor will be smaller than that in 2011 even with rather rapid population growth. The pattern of growth simulated in the analysis also seems to be helpful for avoiding the rise in income inequality that is often accompanied by rapid economic growth. The poorest income group and rural households in all income quintiles seem to consistently benefit more from rapid growth, which is the pattern we have already seen in the recent growth between 2005 and 2011.
85. The simulation analysis emphasizes that economic growth similar to or slightly faster than the last five years is possible for Rwanda and the agriculture sector and that the economic growth will continue to contribute to the broad development goal of poverty reduction. Challenges faced by Rwanda are the underlying structure of its growth and the
22

sustainability of the growth trajectory. Rwanda needs to explore all possibilities to expand its tradable part of the economy in agriculture, manufacturing and services by attracting more private investments.
86. The economy wide modeling analysis shows the need for Rwanda to develop the tradable sectors and bring more sustainable growth to the economy. Without growth in private, particularly foreign private investments, to reach a scale needed to create significant growth for the economy as a whole, the Rwandan economy will continue to depend heavily on domestic and regional markets for the lion share of growth opportunities versus on international markets.
Agriculture sector public investment and policy regime
87. The analysis also assessed the required public investment to support such growth, both for the economy as a whole and for agriculture in particular. This assessment shows that current public investment growth momentum seems to support the ambitious growth targets in agriculture and for the economy as a whole. The challenge is how to finance such rapid growth in public investment. If public investment continues to depend on foreign aid or foreign borrowing, it may be able to support rapid economic growth but may hurt longer-term sustained growth path.
88. In addition, different components of the agricultural growth strategy recommended above require different types of government support, policy interventions and enabling environment actions. Agricultural growth led by productivity improvement in broad food crop sector requires more public investment. To support 8.5 percent agricultural annual growth rate for which the growth in food crops will play a dominant role, agricultural public investment has to grow more rapidly than in recent years. While a higher growth in agricultural public investment is necessary for growth in food crops, the resulting public resource allocation to the agricultural sector in the simulations is not surprisingly high, i.e., the fraction of public resources to invest in agriculture is below 7 percent. The analysis also emphasizes that the main role of the government for sustaining an expansion of export sector is to create an environment more attractive for the private sector, implying policy and institutional factors matter more than direct public investment.
89. Rwanda should continue to improve its institutional and infrastructural environment for ease of doing business and increase its efforts to attract foreign investors to help the country develop its labor-intensive manufacturing and service sectors. However, the recent growth trajectory and possible future growth along this path indicates that it is unrealistic to expect that the pace of manufacturing growth will be fast enough to considerably scale up its role in broad economic growth and job creation in next 5 years. That is to say, while Rwanda is similar to many East Asian countries in terms of being labor abundant and land constrained, it may not be able to attain East Asian style of growth in the near term.
90. Agricultural transformation in Rwanda has started in recent years, and such transformation has occurred in a broad base led by food and livestock production systems, i.e., it occurred not just in a few high value products. Measured by land productivity, more than 60 percent recent growth in food crops is from productivity improvement, an encouraging and positive sign of agricultural transformation. More employment opportunities will be created
23
when agriculture becomes more productive and more market oriented, both directly in agriculture and for agriculture along entire supply and value chains. Agricultural growth-induced foreign investment is also needed, and such investment will help broaden economic transformation.
5. Potential Future Drivers of Growth and Poverty Reduction 91. Given that agriculture sector growth in the next five years will be principally driven by food crops and secondarily by export crops and livestock, what are the key opportunities (and their constraints) in the sector where a comparative and competitive advantage exist, where domestic, regional and international demand are strong and where favorable trade conditions exist? This section reviews the methodological framework used to review the data, describes the data sources and presents the comparative analysis and constraints associated with potential drivers of growth and those commodities which lack a comparative advantage yet which currently receive a significant amount of Government support.
Methodological Framework 92. A detailed analysis of the feasibility of expanding the production, processing, and trade was conducted for a number of specific agricultural and livestock value chains. The analysis provided information on factors constraining production and processing, the underlying determinants of demand, the relationship between supply and demand, and the elements constraining or promoting marketing and trade and paid particular attention to the competitiveness and comparative advantage of each value chain using a quantitative profitability approach.
93. For each crop or other product the basic methodology involved first estimating supply and demand and then constructing a food balance sheet (see Table 4) which links the two. Supply or availability is estimated as production minus seed, feed, and losses, with adjustment for external trade (exports, imports) or changes in stocks (increases, decreases). Demand is related to on-farm consumption plus sales in local markets, regional urban markets, Kigali, the EAC, and international markets. Both production and consumption are incorporated directly into the food balance sheet. The food balance sheet analysis suggests in which markets (domestic or export) competitiveness will be important.
24
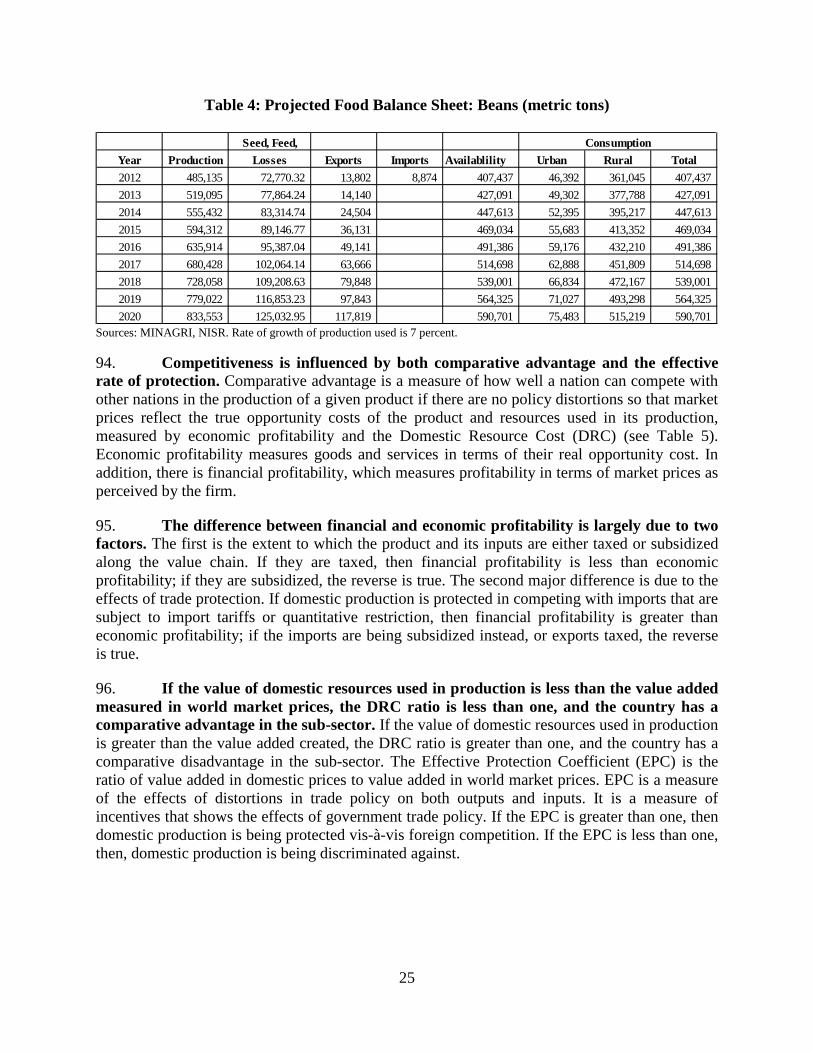
Table 4: Projected Food Balance Sheet: Beans (metric tons)
Sources: MINAGRI, NISR. Rate of growth of production used is 7 percent. 94. Competitiveness is influenced by both comparative advantage and the effective rate of protection. Comparative advantage is a measure of how well a nation can compete with other nations in the production of a given product if there are no policy distortions so that market prices reflect the true opportunity costs of the product and resources used in its production, measured by economic profitability and the Domestic Resource Cost (DRC) (see Table 5). Economic profitability measures goods and services in terms of their real opportunity cost. In addition, there is financial profitability, which measures profitability in terms of market prices as perceived by the firm.
95. The difference between financial and economic profitability is largely due to two factors. The first is the extent to which the product and its inputs are either taxed or subsidized along the value chain. If they are taxed, then financial profitability is less than economic profitability; if they are subsidized, the reverse is true. The second major difference is due to the effects of trade protection. If domestic production is protected in competing with imports that are subject to import tariffs or quantitative restriction, then financial profitability is greater than economic profitability; if the imports are being subsidized instead, or exports taxed, the reverse is true.
96. If the value of domestic resources used in production is less than the value added measured in world market prices, the DRC ratio is less than one, and the country has a comparative advantage in the sub-sector. If the value of domestic resources used in production is greater than the value added created, the DRC ratio is greater than one, and the country has a comparative disadvantage in the sub-sector. The Effective Protection Coefficient (EPC) is the ratio of value added in domestic prices to value added in world market prices. EPC is a measure of the effects of distortions in trade policy on both outputs and inputs. It is a measure of incentives that shows the effects of government trade policy. If the EPC is greater than one, then domestic production is being protected vis-à-vis foreign competition. If the EPC is less than one, then, domestic production is being discriminated against.
Seed, Feed,Year Production Losses Exports Imports Availablility Urban Rural Total2012 485,135 72,770.32 13,802 8,874 407,437 46,392 361,045 407,437 2013 519,095 77,864.24 14,140 427,091 49,302 377,788 427,091 2014 555,432 83,314.74 24,504 447,613 52,395 395,217 447,613 2015 594,312 89,146.77 36,131 469,034 55,683 413,352 469,034 2016 635,914 95,387.04 49,141 491,386 59,176 432,210 491,386 2017 680,428 102,064.14 63,666 514,698 62,888 451,809 514,698 2018 728,058 109,208.63 79,848 539,001 66,834 472,167 539,001 2019 779,022 116,853.23 97,843 564,325 71,027 493,298 564,325 2020 833,553 125,032.95 117,819 590,701 75,483 515,219 590,701
Consumption
25
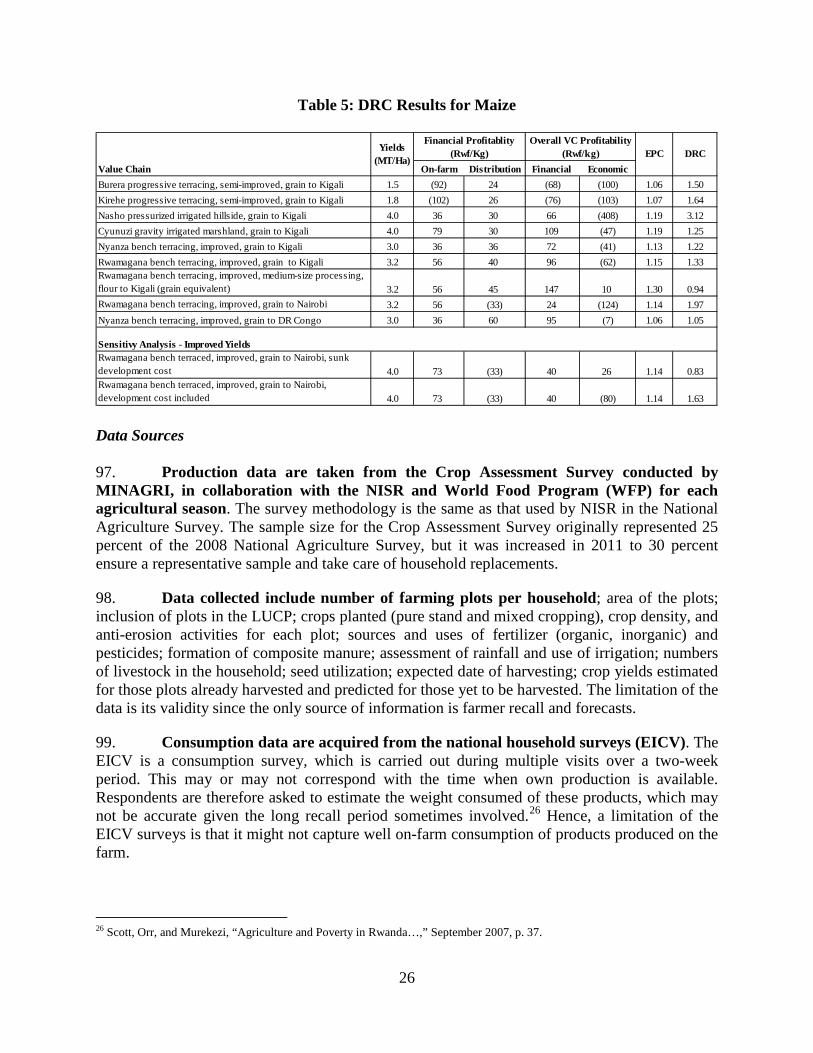
Table 5: DRC Results for Maize
Data Sources 97. Production data are taken from the Crop Assessment Survey conducted by MINAGRI, in collaboration with the NISR and World Food Program (WFP) for each agricultural season. The survey methodology is the same as that used by NISR in the National Agriculture Survey. The sample size for the Crop Assessment Survey originally represented 25 percent of the 2008 National Agriculture Survey, but it was increased in 2011 to 30 percent ensure a representative sample and take care of household replacements.
98. Data collected include number of farming plots per household; area of the plots; inclusion of plots in the LUCP; crops planted (pure stand and mixed cropping), crop density, and anti-erosion activities for each plot; sources and uses of fertilizer (organic, inorganic) and pesticides; formation of composite manure; assessment of rainfall and use of irrigation; numbers of livestock in the household; seed utilization; expected date of harvesting; crop yields estimated for those plots already harvested and predicted for those yet to be harvested. The limitation of the data is its validity since the only source of information is farmer recall and forecasts.
99. Consumption data are acquired from the national household surveys (EICV). The EICV is a consumption survey, which is carried out during multiple visits over a two-week period. This may or may not correspond with the time when own production is available. Respondents are therefore asked to estimate the weight consumed of these products, which may not be accurate given the long recall period sometimes involved.26 Hence, a limitation of the EICV surveys is that it might not capture well on-farm consumption of products produced on the farm.
26 Scott, Orr, and Murekezi, “Agriculture and Poverty in Rwanda…,” September 2007, p. 37.
EPC DRCValue Chain On-farm Distribution Financial EconomicBurera progressive terracing, semi-improved, grain to Kigali 1.5 (92) 24 (68) (100) 1.06 1.50Kirehe progressive terracing, semi-improved, grain to Kigali 1.8 (102) 26 (76) (103) 1.07 1.64Nasho pressurized irrigated hillside, grain to Kigali 4.0 36 30 66 (408) 1.19 3.12Cyunuzi gravity irrigated marshland, grain to Kigali 4.0 79 30 109 (47) 1.19 1.25Nyanza bench terracing, improved, grain to Kigali 3.0 36 36 72 (41) 1.13 1.22Rwamagana bench terracing, improved, grain to Kigali 3.2 56 40 96 (62) 1.15 1.33Rwamagana bench terracing, improved, medium-size processing, flour to Kigali (grain equivalent) 3.2 56 45 147 10 1.30 0.94Rwamagana bench terracing, improved, grain to Nairobi 3.2 56 (33) 24 (124) 1.14 1.97Nyanza bench terracing, improved, grain to DR Congo 3.0 36 60 95 (7) 1.06 1.05
Sensitivy Analysis - Improved YieldsRwamagana bench terraced, improved, grain to Nairobi, sunk development cost 4.0 73 (33) 40 26 1.14 0.83Rwamagana bench terraced, improved, grain to Nairobi, development cost included 4.0 73 (33) 40 (80) 1.14 1.63
Financial Profitablity (Rwf/Kg)Yields
(MT/Ha)
Overall VC Profitability (Rwf/kg)
26
100. In addition, the urban and rural classification of the villages in the EICV 3 data is based on the corresponding geographic designations from the 2002 Rwanda Census of Population and Housing which fails to account for the recent urban/rural expansion of the population. Since a number of the foods analyzed are consumed more on a per capita basis in urban than in rural areas and since the urban population is growing more rapidly, this reduces the increase in consumption due to population shifts. On the other hand, the income elasticity of demand is lower in urban than in rural areas. By weighting the rural population more heavily, this error in classification results in an overestimate of the growth of consumption due to rising income.
101. Most of the price data used in the analysis was taken from the Rwanda e-Soko system of price collection and dissemination. E-Soko is an ICT platform to inform the public of commodity price levels by collecting price information daily for 78 commodities in 62 markets. The data are entered into mobile phones by the market agents and are available by mobile phone to e-Soko subscribers. A databank of past prices is maintained by MINAGRI. These data were aggregated into monthly averages by market and commodity for the years 2007 through 2012. In general the data appear to be reasonably accurate, though occasionally there are significant outliers unrelated to other prices. These outliers were dropped from the analysis. However, their existence suggests that the price data are not always carefully cleaned.
102. There are two sources of trade data. The first is the officially recorded data on quantities and values of exports and imports by partner country, which are collected by Customs and processed by the NISR. The second is a survey of cross-border trade (CBT) passing through major crossing points. This survey is carried out by the National Bank of Rwanda (BNR), MINAGRI, and MINICOM, and is processed and issued in a monthly report by the BNR. Tables for this trade are available only for 2011, 2012, and the first half of 2013. In principal, the CBT survey collects data on all trade passing across the border via the major crossing points - formally recorded trade as well as informal trade that is not recorded by Customs. But in practice the amount of CBT listed in the reports is often substantially less than the trade recorded by Customs. Additionally, it is generally agreed that informal trade is under reported in the CBT surveys.
103. Costs of production, processing, and marketing are estimated from a variety of sources. The best source is the well-designed National Agricultural Survey the last of which was undertaken in 2008.27 One challenge with this source is that the results are at least five years old and have limited information on the recent introduction of new crops and techniques of production into Rwanda. A second challenge is that the survey contains relatively little information on costs. Another source is the EICV surveys, which contain a significant amount of data on agricultural production and other activities in rural areas. The most recent of these surveys applies to 2010/2011. But, again, there are few data on costs.
104. Less comprehensive are surveys sometimes undertaken of a smaller number of households. For example, the former Institut des Sciences Agronomiques du Rwanda (ISAR)
27 A subsequent survey was undertaken in 2012, but the results will not be released until later in 2014.
27
undertook a survey in 2009 of 630 households located in all 12 agro-ecological zones.28 In addition, projects such as the RSSP and LWH gather cost of production data from farmers in their areas of operation, although the methodology used is not necessary very scientific. In addition, considerable data were acquired from different feasibility studies and other documents. Finally, and especially for processing, cost data were obtained directly from managers and other informants. Marketing and transport cost data were obtained primarily from secondary sources, there being a number of studies that have been conducted of these costs in recent years.29 Other data, such as those on customs duties, were taken from official documents.30
Comparative Analysis Results and Constraints 105. The analysis is conducted to examine each of these above elements for a number of different food and export crops, animal products, and processed products. The products which show the strongest comparative advantage are Irish potatoes, cassava, dried beans, bananas, horticultural products, tea, and coffee. Among horticultural products, positive comparative advantage has been verified for avocadoes, pineapples, and passion fruit, but it also likely exists for a wide range of other fruits, vegetables, and flowers because of the good climate and soil conditions that exist in Rwanda for these products. On the other hand, DRCs for maize, wheat and rice are generally above one, indicating lack of comparative advantage of domestic production as substitute for imports.
106. Analysis was also made of the key constraints facing each of these commodities. The most important constraints on agricultural development are on the supply side. These include lack of sufficient improved seed and plant material, inappropriateness of plant varieties for processing and consumer tastes, spread of plant diseases and other pests, lack of modern processing technology, and high rates of post-harvest loss. Some other weaknesses are relatively fragile soils that have been severely depleted and eroded, a hilly or mountainous terrain that contributes to erosion, long distance and high transport costs to and from the sea, small size of the population limiting domestic market demand, and high and growing population density, which limits access by a large part of the rural population to enough land to sustain itself.
Strong Comparative Advantage
28 ISAR, “Estimating the Profitability of Major Food Crops in Rwanda,” December 2009. 29 USAID – EAT Project, “Rwanda Cross-Border Agricultural Trade Analysis,” February 2013; World Bank, “Agribusiness Indicators: Rwanda,” Draft Report for Review, August 2013; MINAGRI, Rural Sector Support Project II, Rwanda Rice Commodity Chain: Strategic Options to Maximize Growth and Poverty Reduction, Final Report, J. Dirck Stryker, Associates for International Resources and Development, August 2010; MINAGRI, Support Project to Strategic Plan for Agricultural Transformation (PAPSTA), “Commodity Value Chain Mapping and Analysis, Market Analysis, and Value Chain Action Plans, in Nyanza, Bugesera, Nyamagabe, Gakenke, and Ngororero Districts", Provisional Report, April 2011, 30 East African Community (EAC), Common External Tariff, 2012 Version: Annex 1 to The Protocol on the Establishment of the East African Community Customs Union Harmonized Commodity Description And Coding System (Version 2012); Rwanda Tariff Code, Sensitive Items; Rwanda Tariff Code, Exemptions Regime; Rwanda Revenue Authority (RRA), Import Procedures; East African Commission, World Customs Organization, and Japan International Cooperation Agency, Harmonized System (HS) Handbook for Customs Administration in the East African Region, 2012 edition; RRA, The Fiscal Regime under the EAC Common Market; RRA, Export Procedures; EAC, The East African Community Customs Management Act, 2004, revised edition 2009; Law N° 75/2008 Of 31/12/2008 Modifying and Complementing Law N° 26/2006 of 27/05/2006 Determining and Establishing Consumption Tax on Some Imported and Locally Manufactured Products; National Bank of Rwanda, “Informal Cross Border Trade Survey,” various issues.
28
107. Irish Potatoes. Rwanda has an unambiguous comparative advantage in the production of Irish Potatoes either as a substitute for imports or for export within the region. The DRCs vary between 0.21 and 0.69, which are all substantially below one. The DRCs are slightly lower for progressive terracing versus bench terracing. But the analysis shows that construction of bench terraces on which to grow potatoes on this land is clearly desirable.
108. The main hurdle to increased export trade in Irish potatoes is identifying, testing, and disseminating varieties of potato with less moisture content that have greater storability and are in demand throughout the region. Unless this is done, Rwanda will not be able to take advantage of favorable market opportunities. Increases in production, with only the domestic market available, will cause prices and farmer income to fall until supply and demand are brought into equilibrium. Expanding potato exports will also require establishing efficient trade networks into Uganda and Tanzania, taking advantage in particular of the substantial back-haul capacity that exists through Kampala and Mwanza.
109. Cassava. Rwanda enjoys a significant comparative advantage in the production and export of cassava flour within the Eastern Africa Region. This is particularly the case with significant margins between retail prices in Kigali and Bujumbura, but it pertains to other markets as well. Although exports have been delivered informally for the most part in the past, further development of these markets will require the elaboration of formal trading and logistics systems. For most of the value chains delivering flour or dried cassava to Kigali in competition with imports, the DRC is well below one. The one exception is flour produced from cassava grown on bench terraces in Kamonyi, for which the DRC of 0.97 is very close to one if terracing infrastructure costs are included in the analysis.
110. Until now, most mills have been relatively small in scale with the potential to increase substantially and serve a much broader market. Compared with current relatively small mills in existence, large scale milling produce not only cassava flour but also starch. The market for cassava starch already exists in East Africa, and the international market could be accessed as well. The major impediment to this is the organization of adequate production and collection to feed this size mill with at least 100 MT of raw cassava per day. Hence, investment in milling capacity is required.
111. Dried beans. The bean sub-sector is important for Rwanda even though it has not received a great deal of attention in the past five years. First, it is the most important food staple. Second, it is an important source of protein currently given the limits posed on livestock by lack of available pasture and forage. Third, Rwanda appears to have a strong comparative advantage in beans both for domestic consumption and for export within the region. The results of the DRC analysis for beans show both financial and economic profitability of bean production for Kigali and for export to Kampala.
112. However, the small-scale nature of bean production constrains formalization by restricting the ability of traders to collect significant volumes. Farmers need to produce consistent surpluses of specific types of beans to meet traders’ requirements. This will require developing linkages between traders and the farmers supplying them, as opposed to opportunistic purchases at weekly markets or sales to itinerant assemblers. Promoting these linkages will
29
require investment in roads and storage facilities, promotion of credit, reducing barriers to trade, and other such measures.
113. Banana. Similarly for bananas, Rwanda has a comparative advantage to produce and export cooking bananas within the Eastern Africa Region. The DRCs are quite low for bananas grown on progressive terraces in Gakenke and Ngororero and sold in the Kigali market or for export to Burundi or Kampala, indicating Rwanda’s comparative advantage vis-à-vis imports from Uganda and for export to neighboring countries. There is no demand constraint given the size of the banana deficit projected for the region in 2020. The most important constraint is the ability to produce the material required to replant with disease-resistant varieties. So far, the DRCs for this activity are well below one, but the volumes produced of these new varieties have been limited to-date.
114. The structure of the market is well organized with imports into Rwanda from Uganda. Sources of supply of these bananas are primarily in the vicinity of the border, where Kigali is a more attractive market compared with Kampala. However, over the longer run, Rwanda should be able to assemble and export bananas to Kampala given the higher prices that exist there than in Kigali. Rwanda also has a comparative advantage in exporting bananas to Burundi. There are indications that dessert bananas could find a good market in Europe, in either fresh or dried form. However, a precondition is that the problem of Fusarium wilt must be solved.
115. Avocado. The DRC results for avocado are less than one for both estate and outgrower production, indicating comparative advantage in producing and exporting avocados. Profitability is somewhat higher for estate-grown avocadoes because of greater intensity of input use, better management, and resulting higher yields. However, outgrower production is profitable as well.
116. Pineapples. The results of the DRC analysis for pineapple show high levels of profitability of both fresh and dried pineapple for the domestic market, and the potential that Rwanda could compete within the region and especially in the international market for organic dried pineapple and also organic pineapple concentrate. These results apply to production and sale in the Kigali market of fresh and dried pineapple as a substitute for imports, primarily from Uganda.
117. Passion fruit. Passion fruit is a highly profitable import substitution activity if the disease problems can be controlled for Rwanda. The DRC is very low as well – sufficiently low that Rwanda also has a comparative advantage in exports of passion fruit if it could satisfy the domestic demand of processors.
118. The major challenges with horticultural crops are two-fold. First is to develop improved transportation and logistics. Transport and logistics constraints are related to the poor state of feeder roads, lack of sufficient carrying capacity for air transport, disorganization and informal nature of cross-border trade, and lack of sufficient volumes of marketed produce to encourage investment in storage and transport. The second problem is plant diseases, for example, in the passion fruit sub-sector. This problem can be tackled by strengthening research on disease-resistant varieties and through improved crop husbandry, including crop rotations to break disease cycles.
30
119. Coffee. The DRC result for fully washed coffee exported via Mombasa is 0.83, which indicates considerable comparative advantage. If the FOB price is changed to correspond more with World Bank forecasts, the price would be about US$4.40/kg instead of US$5.04/kg, Overall profitability would decline to about RWF 100/kg and the DRC would rise to 0.96 – still profitable. At the price that prevailed in 2013, profitability is negative and the DRC rises to 1.13, indicating lack of comparative advantage. This analysis shows the sensitivity of profitability in the coffee sub-sector to movement in world market prices.
120. There are three major constraints involved in coffee production. The first is lack of financial viability of many washing stations. Proper washing of coffee is critical to obtaining a good price. But many of the washing stations are too big and have to draw upon too large a region in order to operate at reasonably full capacity. Given the dispersion of coffee producers and the poor state of feeder roads, the cost of collecting the coffee is too high, and the farmers do not bother to take it to the washing stations. The solution is to replace the existing stations with smaller washing equipment, a process that is underway, but the availability of transport, water, and power may be a further constraint. The second major problem is substantial price fluctuations on the international market, which result in low prices to producers and reduce their motivation to care for their trees and harvest them thoroughly. In the worst case, they might even uproot them. One partial solution might be to follow the practice of coffee cooperatives in other countries such as Tanzania and hedge coffee sales in the futures market. The third constraint is whether there are supporting institutions in Rwanda sufficient to nurture self‐sustainability in the Fully Washed Coffee (FWC) value chain, such as the research and input distribution required to overcome low yields. The key sustainability issue is the lack of agricultural chemical supply, including fertilizers and pesticides, and a lack of both credit to purchase these inputs and smallholder repayment of credit when it available.
121. Tea. Tea has a very strong comparative advantage in Rwanda. The DRC results for tea with and without establishment cost are far below one. Currently yields are relatively low without the application of chemical fertilizer, which shows how profitable tea is even at low yield levels.31 Secondly, there is a high level of financial and economic profitability overall and for the processing and distribution segment of the value chain. Even though on-farm profitability is positive, it is much lower than profitability downstream. Furthermore, the addition of establishment costs means that profitability to the farmer is quite low. This suggests that there is sufficient room to provide better pricing to the farmers for tea leaves, without significantly affecting the profitability of the factories or exporters.
122. Expansion of the tea subsector could take place through both an increase in yields and growth in the area planted. Constraints include lack of knowledge concerning the need for soil nutrients, the poor state of rural road networks, the high cost of energy, insufficient processing capacity, lack of marketing expertise and a seal of national quality, absence of strong regulatory capacity for the privatized tea industry as well as lack of continued support to tea farmers and strategic guidance to the industry, and insufficient research and development for the tea industry. Additionally, Rwandan tea has suffered from poor management of the tea factories and estates,
31 Yield estimates apply to the period before fertilizer was made more available to farmers, starting in 2007, which resulted in an increase in yields to the current level of about 1.6 MT/ha. Although no specific cost data are available for the use of fertilizer, the effect would have been to increase profitability and to lower the DRC. Thus the estimates are on the conservative side.
31
which have not always maintained good relations with tea outgrowers. With improved management under private sector ownership, the tea sub-sector should be able to take advantage of its very high quality potential.
123. Pyrethrum: Although precise data have not been made available, it appears from qualitative evidence that is available that Rwanda is competitive and has a strong comparative advantage in pyrethrum production and exports. This includes not only cultivation but also extraction and refining. Downstream production, such as insecticides, might also be possible. The major problem is adequate supply by farmers due to competition with Irish potatoes.
124. Livestock and fisheries. Livestock and fisheries development is vital to Rwanda for at least two important reasons. First, it improves nutrition levels through increased consumption of animal protein. Second, animal and fishery resource development has the potential to increase rural incomes through production, processing, and sales. This is especially important for targeting the poor, who have little access to land but are able to earn some cash income by raising a few animals and fish. Due to the lack of data, detailed comparative analyses were not conducted for livestock and fisheries. It is important, nevertheless, to develop a dynamic livestock strategy that takes into the account the remaining pasture and who has access to it, growth in the availability of feed grains and other livestock inputs, the rate and income structure of demand for livestock products, and the particular needs of the poor as the sector develops. There are a number of actions that need to be taken including encouraging intensification of livestock production by corralling and greater use of crop by-products and improved feeds, assisting in establishment of feed mills, and investigating why exports of live animals have grown in importance over the past five years and what implications this has for the domestic livestock industry.
125. Current constraints confronting the livestock sector include lack of a viable feed industry, insufficient modern slaughterhouses, inadequate management of tanneries and how to expand it without impinging too much on the cultivation of food crops. The most technically efficient way to maximize the production of calories is by moving to dairy production and raising pigs, poultry, and fish on grain-based feeds. None of these livestock activities is technically more efficient than delivering calories via the direct consumption of maize. However, as long as there is available pasture, forage, and crop residues without good alternative uses, it is economically profitable to convert these low cost resources to calories and proteins in the milk and meat of animal ruminants. The threat appears when these resources are nearing exhaustion, as they are in Rwanda, because of the high population density. Then choices have to be made regarding production of food crops versus investing in more intensive forms of livestock production.
Lacking Comparative Advantage
126. Maize. The food balance sheet for maize reveals a large and growing negative gap from 2008 to 2012 between demand and supply, suggesting significant under reporting of consumption (a large quantity of maize is consumed as snacks and not “eaten” with meals). Also, there is a significant amount of informal maize CBT that is not captured in the surveys.
32
Additionally, imports have not declined despite the growth of production. The capacity of the marketing system for storage is also very limited.32 It is important for MINAGRI to analysis with NISR why there is significant under reporting of both maize consumption and exports to confirm that production is matching both demand and exports. The DRCs for maize are far above one except in two scenarios. First, if the maize is processed, both financial and economic profitability increase considerably, and the DRC declines to slightly below one, suggesting a marginal comparative advantage in this value chain. Second, Rwanda would be more competitive if maize were to be exported to the Democratic Republic of Congo because prices there are considerably higher than in Nairobi. However, even in this case the DRC is greater than one, and the market is also much less developed in Congo than in Nairobi so that the quantities exported would be lower.
127. Constraints facing maize production are less than 20 percent of the maize meal produced in Rwanda is of the high quality increasingly demanded by consumers. Instead, most maize in Rwanda is processed by hammer mills, which extract 90 percent or more of the grain as flour that is of much lower quality than that processed in roller mills, which are increasingly the norm in the East African market.
128. Wheat. Wheat has been promoted over the past five years, along with maize, in the CIP areas of land use consolidation, bench terracing, and subsidized inputs of improved seed varieties and fertilizers, with the same subsidies on these inputs for wheat as for maize. The area of wheat sown increased substantially in 2008 (following the introduction of the CIP), and has fluctuated around 40,000-50,000 ha thereafter. Yields have more than doubled from their levels prior to the initiation of the CIP. Overall, production has essentially tripled over the last five years but has essentially leveled off now. Moreover, the very large differences are shown between financial and economic profitability, especially for those techniques involving bench terraces. This reflects the large subsidies supplied by the Government on seed and fertilizer imports and the construction of the terraces. The differences are especially great for the overall value chain because of the high level of protection provided by the customs duty of 35 percent, which applies to wheat imports from outside the EAC, and the value added tax of 18 percent, which is applied to these imports but not to local production. Furthermore, the results of the DRC and EPC analysis suggest lack of comparative advantage of domestic production in competition with imports and high degree of protection.
129. Rwanda’s latitude is not conducive to cultivating wheat with high enough gluten content for bread-making. If Rwanda is going to continue to promote cultivation of wheat, a major research effort needs to be devoted to identifying and testing varieties of wheat that can be grown productively in Rwanda and would be suitable for use in the bread flour milling industry.
130. Rice. There was a sharp increase in rice production in 2008 relative to 2007, but subsequent production leveled off and growth in availability was due to rapidly rising imports.
32The best source refers to 46,480 MT of storage capacity in 2009 (CIP Evaluation Report - 2008/09). In addition, 20,000 MT of capacity was created for the Rwanda Strategic Grain Reserve in the Kigali Free Trade Zone and 25,000 MT of additional capacity was to be created in Nyagatare and Kirehe. This adds up to a little over 90,000 MT in total, compared with the estimated excess of availability over consumption of over 300,000 in 2012 and a cumulative excess during 2009 to 2012 of over 1,000,000 MT. USAID COMPETE project, "Survey and Mapping of Grain Storage Facilities in Rwanda," September 2009, p. 8.
33
Although consumption of rice is often thought of as an urban phenomenon, it is actually growing more rapidly in rural than in urban areas because of its greater income elasticity of demand.33 This is illustrated by the fact that consumption of rice was greater in urban areas in 2006 (31,711 MT urban versus 27,515 MT rural) and greater in rural areas in 2011 (37,405 MT urban versus 42,883 MT rural). Overall, consumption grew somewhat less rapidly than availability for rice.
131. The DRCs of rice production are considerably greater than one even if the land development cost is excluded, suggesting comparative disadvantage of domestic production in competition with imports. For some colder areas like Nyanza, where rice production is costly, the DRC is as high as 1.7 even excluding land development costs. The only exception is that rice grown in Bugarama for export to Burundi has a very low DRC of 0.85 at average yields and land development costs included in the analysis. This illustrates the opportunities that exist for exploiting niche markets, especially in Burundi and the DRC, which are not very well linked into the broader Eastern Africa food market so that profitable opportunities exist.
132. One policy constraint related to rice is the VAT that is charged on rice milling because of the inclusion of paddy purchases in the tax base. Since the millers cannot pass this tax on to the consumer because of competition with imports, much of the VAT is passed back to paddy producers in the form of lower producer prices. Since the cost of milling is high because of the VAT, millers cannot afford to pay farmers their cost of production. Aside from the VAT, there is also the problem that the Government requires collection and assembly of paddy by the cooperatives, which then try to sell at their perceived cost of production regardless of milling costs and market conditions for milled rice. It is recommended to revise the VAT policy on purchased paddy and allow the market to determine paddy prices.
6. Key Actions to Sustainable Agriculture Growth and Poverty Reduction 133. Past accomplishments and experience prove that Rwanda has a considerable potential for growth and development of the agricultural and livestock sector, but there is much that remains to be done if this potential is to be realized. Below are key general and commodity specific recommendations to continue to promote inclusive growth and poverty reduction.
General recommendations
134. The analysis suggests that agriculture continues to be the leading engine for growth and poverty reduction in Rwanda. While, some agricultural sub-sectors will grow more rapidly than others, the contribution of each sub-sector to GDP growth will depend not only on the rate of growth achieved in that sub-sector, but on the absolute size of the sub-sector. Taking into account the large absolute size of the food staples sub-sectors, most of the growth in agriculture will come from growth in food staples. Export crops will make a significant contribution to growth, but the importance of this contribution will be limited so long as the export crop sub-sector remains small relative to the food crops and livestock sectors, and without
33 The income elasticity of demand for rice and other cereals, which is derived from the data in EICV3, is the percentage change in consumption of a given product for a percentage change in income. This value for rice and other cereals is 0.52 in urban areas and 1.34 in the countryside.
34
growth in private investments, particularly to reach the scale needed to create significant growth, the Rwandan economy will continue to depend on domestic (possible regional) markets more than on international markets for growth opportunities.
135. For the agriculture sector, the future approach moving forward is not an issue of either/or but one of maintaining appropriate level of emphasis on each sub-sector. Based on the analysis of future economic growth prospects, a three-fold strategy is recommended for agriculture to play an active role in Rwanda’s future economic growth and development.
136. Continue to promote domestic market demand to lead agricultural growth. If the roughly 8 percent trend in overall economic growth continues in the next 5-10 years, and especially when such growth continues to be supported by similar foreign financed investment, then meeting domestic market demand will be the dominant force to lead agricultural growth. As a result, a further increase in production of food crops and livestock, particularly those commodities with DRC ratings below one, will need to take place. This type of agricultural growth will benefit farmers both from income generation and improving food and nutrition security, and also benefit consumers particular urban consumers by adequate food supply at reasonable and stable domestic prices.
137. Promote regional markets for food crops and livestock growth. Exploring regional market demand is important for identifying where agriculture sector growth led by food crops and livestock should be focused. Regional markets for Rwanda’s agricultural commodities differ significantly from international market but are very similar in nature to the domestic market as most agricultural commodities traded in the region are similar goods produced for local demand, such as maize, Irish potato, dry beans, livestock and livestock products.
138. Broaden Rwanda’s international trade basket and explore nontraditional export niche markets while promoting increased value-addition of traditional export commodities. With improved competitiveness and private sector investment, export agriculture will grow more rapidly and will increase its role in leading total agricultural growth. While broadening international trade and exploring nontraditional export niche markets are important, Rwanda’s international trade will continue to be dominated by its two traditional export commodities, coffee and tea. Thus, increasing value-addition and price premium by improving quality of these two commodities in their production and processing is important.
139. Different components of this agricultural growth strategy require different types of government support, policy interventions and enabling environment actions. Agricultural growth led by productivity improvement in broad food crop sector depends critically on public investment. Without accelerated growth in agricultural public investment, the 8.5 percent target for agricultural annual growth, in which growth in food crops has a dominant role, is difficult to achieve. Acceleration in export crops would depend on the facilitative role of the government in promoting private investments to lead such growth. Growth in agriculture public investment along with significant promotion of private investment and market led growth in the sector is recommended.
140. Additional general recommendations to overcome the some of the threats and weakness that exist in the agricultural and livestock sector and to more fully exploit
35
opportunities including: establishing a strategy that responds more explicitly to the extreme poor; allocating more resources to research, extension, cooperative strengthening, institutional development, including knowledge acquisition and management; selectively choosing high return hillside and marshland irrigation schemes; utilizing labor schemes which are most appropriate to the intended results of the investment; reducing barriers to trade; expansion of the CIP and LUC Programs; increase value addition of key commodity chains; expansion of soil conservation coverage; and improving the quality of agricultural statistic collection and management as discussed below.
141. Strategy Targeted on the Extreme Poor. There is a need to develop an explicit strategy to protect the extreme poor from adverse consequences of interventions such as the CIP and LUCP. Given high population density in relation to arable land, the small size of land holdings for most farmers, and lack of wealth held in other forms, the poor are heavily dependent on production and consumption of crops that are not too sensitive to declining soil fertility and to the vagaries of climate and pest infestation. These are not always the products that are being promoted with these programs. The strategy must reinforce any manner in which the income levels of the poor can be improved, such as increased marketing of agricultural products and sales of non-agricultural goods and services.
142. Examine Resource Allocation for Programs 2 and 4 of PSTA 3. Program 1 (Agriculture and Animal Resource Intensification) is currently budgeted at US$640 million out of a total PSTA 3 budget of US$1.0 billion. Program 2 (Research, Extension, and Cooperative Strengthening) is allocated US$86 million and Program 4 (Institutional Development, including Knowledge Acquisition and Management) is allocated only US$56 million. The analysis in this report has shown the vital importance of research and extension in identifying, testing, multiplying, and distributing new varieties with resistance to disease, better storability, adaptation to consumer tastes, and suitability for local climate conditions. This needs to be broadened to include a greater range of crops and to ensure that the results of research are made available to farmers in the form of ready access to improved seeds and plant material, as well as extension advice. Additionally, improving competitiveness through innovation and technology – through research and transfer from abroad should be incorporated into Program 2 with sufficient resource allocation.
143. Review Investments Planned for Hillside Irrigation. Over US$300 million is allocated to hillside infrastructure to irrigate 20,000 ha at an average cost of US$15,504 per ha. It would be valuable to reserve hillside irrigation for high value export crops and where investment is justified by a solid economic and financial analysis. Analysis has shown that using hillside irrigation for maize and other food crops tends to be highly unprofitable. It is recommended to review this program and explore lower cost and more efficient irrigation techniques for both food and higher value export crops.
144. Assess Investment Planned for Marshland Irrigation. The development of marshland irrigation has had many advantages. It has provided cash income for farmers and has taken away some of the pressure of growing food crops on the hillsides. However, based on the technical analysis carried out, marshlands where irrigation can be done at reasonable cost are declining. As less suitable marshlands are developed, the cost is rising. For example, the average cost of marshland irrigation development in PSTA 3 is budgeted at US$9,302/ha which is much
36
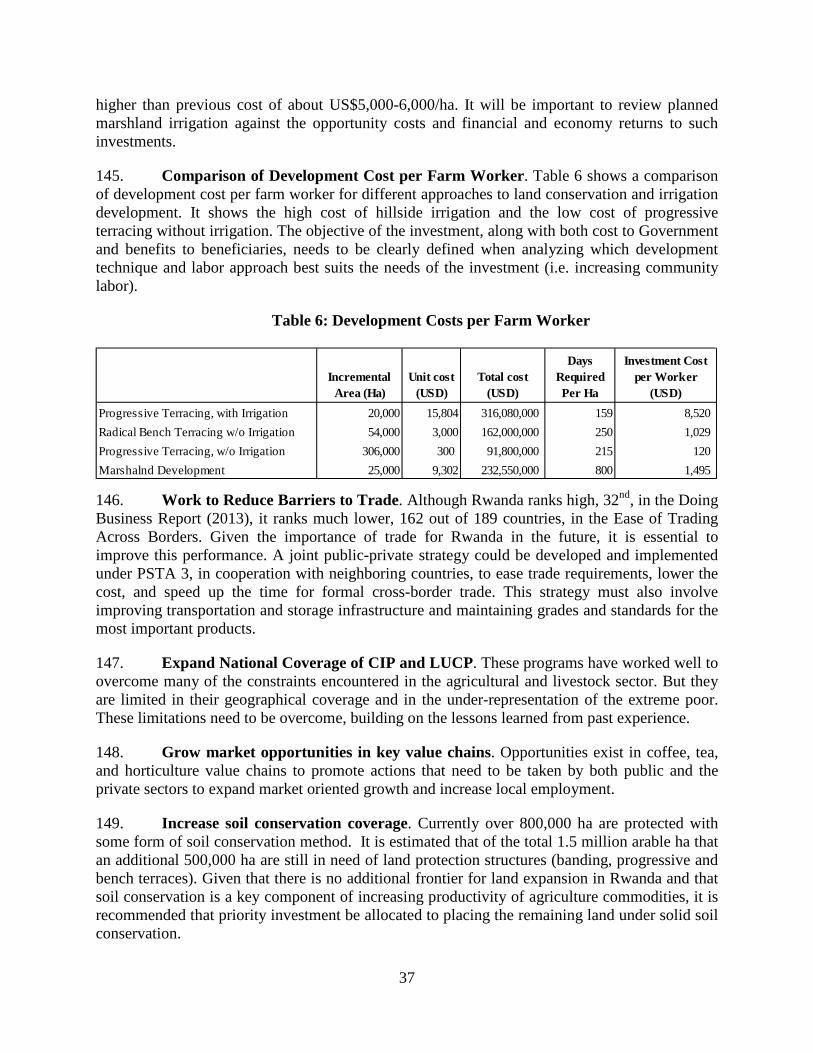
higher than previous cost of about US$5,000-6,000/ha. It will be important to review planned marshland irrigation against the opportunity costs and financial and economy returns to such investments.
145. Comparison of Development Cost per Farm Worker. Table 6 shows a comparison of development cost per farm worker for different approaches to land conservation and irrigation development. It shows the high cost of hillside irrigation and the low cost of progressive terracing without irrigation. The objective of the investment, along with both cost to Government and benefits to beneficiaries, needs to be clearly defined when analyzing which development technique and labor approach best suits the needs of the investment (i.e. increasing community labor).
Table 6: Development Costs per Farm Worker
146. Work to Reduce Barriers to Trade. Although Rwanda ranks high, 32nd, in the Doing Business Report (2013), it ranks much lower, 162 out of 189 countries, in the Ease of Trading Across Borders. Given the importance of trade for Rwanda in the future, it is essential to improve this performance. A joint public-private strategy could be developed and implemented under PSTA 3, in cooperation with neighboring countries, to ease trade requirements, lower the cost, and speed up the time for formal cross-border trade. This strategy must also involve improving transportation and storage infrastructure and maintaining grades and standards for the most important products.
147. Expand National Coverage of CIP and LUCP. These programs have worked well to overcome many of the constraints encountered in the agricultural and livestock sector. But they are limited in their geographical coverage and in the under-representation of the extreme poor. These limitations need to be overcome, building on the lessons learned from past experience.
148. Grow market opportunities in key value chains. Opportunities exist in coffee, tea, and horticulture value chains to promote actions that need to be taken by both public and the private sectors to expand market oriented growth and increase local employment.
149. Increase soil conservation coverage. Currently over 800,000 ha are protected with some form of soil conservation method. It is estimated that of the total 1.5 million arable ha that an additional 500,000 ha are still in need of land protection structures (banding, progressive and bench terraces). Given that there is no additional frontier for land expansion in Rwanda and that soil conservation is a key component of increasing productivity of agriculture commodities, it is recommended that priority investment be allocated to placing the remaining land under solid soil conservation.
Incremental Area (Ha)
Unit cost (USD)
Total cost (USD)
Days Required Per Ha
Investment Cost per Worker
(USD)Progressive Terracing, with Irrigation 20,000 15,804 316,080,000 159 8,520 Radical Bench Terracing w/o Irrigation 54,000 3,000 162,000,000 250 1,029 Progressive Terracing, w/o Irrigation 306,000 300 91,800,000 215 120 Marshalnd Development 25,000 9,302 232,550,000 800 1,495
37
150. Improve the Quality of Agricultural Production Statistics. Investigate the accuracy of current MINAGRI agricultural production data by comparing them with the results of the forthcoming 2012 Agricultural Survey. Collaboration between MINAGRI and NISR would be important to improve the collection and processing of annual agricultural statistics and assure that a sound methodology is used for this purpose, and that the resources are available to implement the methodology.
Commodity specific recommendations
151. Besides the general across-the-board recommendations, the crop-specific comparative analysis also provides evidence and suggestions that are specific to particular crops or other activities.
152. Strong comparative advantage for Irish potatoes, cassava, dried beans, bananas, horticultural products, tea, and coffee. The analysis suggests that Rwanda has substantial opportunities for cost-effective increases in production for domestic markets and also exports to Eastern African regional and international markets. The products which show the strongest comparative advantage are Irish potatoes, cassava, dried beans, bananas, horticultural products, tea, and coffee. Among horticultural products, positive comparative advantage has been verified for avocadoes, pineapples, and passion fruit, but it also likely exists for a wide range of other fruits, vegetables, and flowers because of the good climate and soil conditions that exist in Rwanda for these products.
153. Limited demand constraints. Analysis of market opportunities and the relation between product supply and demand developed by the food balance sheets shows limited constraints on the side of demand for these crops. To the extent that production more than satisfies domestic demand, the EAC market plus that of some non-EAC countries in the broader region is entirely adequate to absorb any volume of these exports that Rwanda can supply. Indeed, given Rwanda’s small market size, it is essential that exports be developed in order to achieve economies of scale and agglomeration. The principal constraints are on the side of supply.
154. Trends in external trade indicate that differentiated primary and processed products are assuming increasing relative importance in Rwanda’s range of exports. Examples are tea and coffee, where substantial premiums can be earned through improvements in quality, brand packaging, and establishing direct links with buyers. Good opportunities exist for the production of refined pyrethrum and its products. Excellent opportunities are present for exporting organic products such as pineapple concentrate. These are all areas in which Rwanda has a strong comparative advantage.
155. Opportunities for cost-effective import substitution (maize, wheat and rice). There may be opportunities for cost-effective import substitution, but here the range of choices is narrower. The DRC for maize production as a substitute for imports, for example, is generally greater than one, indicating lack of comparative advantage of domestic production in competition with imports.
38
156. The other two most important import substitution products are wheat and rice. If suitable varieties of bread wheat are found that could be grown successfully in Rwanda, and the agronomic problems could be solved, then increases in production could begin to substitute for imported bread wheat, especially if yields of 3.5 MT/ha or more are achieved on expanded bench terraces. Short of this, the DRC is considerably greater than one and economic profitability is negative, suggesting that this would be a costly avenue to pursue if productivity cannot be substantially increased. In any case, a research program to identify suitable varieties would be needed before supporting a scaling up in production. However, Rwanda appears to have a comparative advantage in milling wheat because companies are importing wheat, milling it, and selling it to the domestic, regional and international markets.
157. Rwanda is able to produce rice in the marshlands, but, except for Bugarama, the DRCs tend to be greater that one. This suggests that rice production is not generally in Rwanda’s comparative advantage. This does not mean that rice should not be grown outside Bugarama but rather that its cultivation could be justified on the basis of other gains that it brings, such as increased cash income for poor farmers. Unless Rwanda is willing to incur high costs of rice development, local production will not be able to replace imports. Consumption of rice is growing too rapidly and there are too may agro-ecological constraints on expanding local production.
158. Any strategies to support production of import substitute crops should depend on the use of trade barriers (tariffs or non-tariff measures), as these raise prices for poor consumers.
159. Promote Establishment of Maize Roller Mills. Maize Roller Mills are a potentially important investment opportunity that also meets a need in the sector's development. There is projected to be a surplus of maize, over the next few years at least, which will be much easier and more profitable to export if it is milled to the growing requirements of the East African market.
160. Reinforce Identification of Wheat Varieties That Can Be Grown in Rwanda and Are Suitable for Baking Bread. This is vital if wheat will continue to be a priority food crop. Although a small market may remain for porridge made from wheat, the greatest demand will increasingly be for bread. Without suitable wheat varieties that can be grown in Rwanda, the price incentive for wheat production is likely to decline over time.
161. Policy Reforms in Rice Marketing and Milling. The VAT tax base could be altered so that only value added in the rice milling industry is taxed versus total value. VAT in Rwanda is not usually paid on the value of primary products.34 In addition, the requirement that cooperatives must have the sole right to collect and deliver paddy to the mills could be eliminated in order to provide more competition in rice marketing.
34 Rice milling financial profitability is negative. This is because the VAT is charged on the total value of milled rice inclusive of the purchase price paid for paddy by the mills. VAT in Rwanda is not usually paid on the value of primary products. But assessing the VAT on milling inclusive of the purchase price of paddy results in very high taxation even though milling costs are only a small part of the total cost of the value chain. One result is that the millers are unable to pay as high a price to producers as they could pay if the VAT were only assessed on value added in milling.
39
162. Develop More Marketable Irish Potato. It is important for RAB to expand and develop capacity for identification, testing, multiplication, and dissemination of varieties of Irish potato that have less moisture content and therefore improved storability, as well as the taste characteristics to meet demand throughout the region.
163. Upgrade Cassava Collection and Processing, Explore ways to assist cassava mills to organize their supply of cassava from rural smallholders. Identify and relieve bottlenecks to a steady supply. Help smaller millers to upgrade their milling capacity to RBS standards. Encourage the installation of greater and more modern milling capacity.
164. Improve Marketing of Beans. Facilitate identification and dissemination of information regarding different bean varieties, including consumer preferences in potential export markets. Support the capacity of warehouses to grade, sort, and store different varieties. Link this with warehouse receipts programs and assist in financing investment in warehouses with this capacity. Assist farmers to improve the grades and adhere to quality standards needed by traders.
165. Assist in Banana Replanting and Marketing. Expand capacity of RAB and promote private sector involvement to produce material required to replant banana plantations with disease-resistant varieties. Assure proper certification and control to eliminate replanting with diseased plants. Explore opportunities for Rwanda to export cooking bananas and beer bananas with in the region and dessert bananas overseas. Increase research and resources devoted to reducing dessert banana pests.
166. Expand Horticulture Processing, Marketing, and Trade. Construct and upgrade rural feeder roads; bring together exporters to increase volume of air shipments and link with carrier contracts; work with informal traders and customs agents to promote use of streamlined official trade channels; identify constraints and opportunities in collection, packing, marketing of horticultural products; facilitate investment by the private sector in extension, assembly, and quality control. Strengthen research on disease-resistant varieties to fight horticulture plant disease and make available to producers. Provide extension advice on improved crop husbandry, including crop rotations to break disease cycles.
167. Increase coffee production and improve processing. Continue to strengthen current program of coffee washing stations until smaller stations are available to all coffee producers. Also, there is little information on the conditions and costs under which coffee is grown. This makes it difficult to predict how coffee farmers will respond to changes in prices, investment in washing stations, and other variables. It is recommended to undertake a survey of the conditions and costs of coffee production. Additionally, the potential for coffee cooperatives to participate in coffee futures market in order to reduce producer price fluctuations must be explored. Lessons learnt from the experience of Tanzania and other countries with the coffee futures market could be applied to Rwanda.
168. Facilitate Relationship Between Tea Factories and Estates with Outgrowers. Monitor the relations between tea factories and estates with their outgrowers to examine the existing challenges and, in particular, to assure the outgrowers are being paid a producer price in
40
line with world market conditions. Assist in upgrading quality of production and marketing in order to obtain the best price on the world market.
169. Promote Increased Production of Pyrethrum. Assist interaction between SOPYRWA and potential and actual pyrethrum farmers to encourage crop rotations between pyrethrum and Irish potatoes to ensure that they are mutually beneficial.
170. Livestock Intensification. Encourage intensification of livestock production by corralling and promoting greater use of crop by-products and improved feeds; assist in establishment of feed mills; and investigate the reasons why live animal exports have grown in importance over the past five years and the implications for the domestic livestock industry. Develop a dynamic livestock strategy that takes into the account the remaining pasture and who has access to it, growth in the availability of feed grains and other livestock inputs, the rate and income structure of demand for livestock products, and the particular needs of the poor as the sector develops.
Conclusions
171. Rwanda is experiencing its best growth performance since independence and agriculture, as a key driver of economic growth, is making a significant contribution. Over the past decade, but particularly in the last 5 years, agriculture has contributed to poverty reduction and improved food and nutrition security. Yet, the challenges that Rwanda faces as it moves closer to attaining the objectives articulated in Vision 2020 and EDPRS 2 are linked to issues of utilization of scarce investment resources (efficiency, effectiveness) and sustainability of growth, if Rwanda intends to provide greater outreach to the extreme poor, to better crowd-in the private sector investments, and facilitate trade to meet growing food demands at domestic, regional and international level.
172. The opportunities for greater agricultural transformation are well within reach. Increases in land productivity have already contributed to more than 60 percent of the recent growth in food crops and together with growth in the livestock productions systems, there are encouraging and positive signs of agricultural transformation underway. Thus, it can be expected that the role of agriculture in Rwanda’s future growth over the next 5 years will be further enhanced during the continuous transformation process of the sector with more employment opportunities created, and when agriculture becomes more productive and more market oriented along key value chains.
41
7. References ACDI/VOCA-ADAR Project,” Coûts de Production de Maracuja - Cas du Rwanda”, Décembre 2005. Adekunle, Julius, “Culture and Customs of Rwanda”, Westport, Conn.: Greenwood Press, 2007, p. 1. Ann Verdoodt& Eric Van Ranst, “The Soil Information System of Rwanda: a Useful Tool to Identify
Guidelines Towards Sustainable Land Management,” Afrika Focus, Vol. 19, Nr. 1-2, 2006, pp. 69-92.
Arnault Emini, C. (2007). The 2006 social accounting matrix for Rwanda: Methodology note. November.Yaounde, Cameroon, University of Yaounde II.Unpublished memo.
Binswanger, H.P. and Quizon, J.B. (1986). What Can Agriculture Do for the Poorest Rural Groups? (Report No. 57). Washington, DC: Agricultural and Rural Development Department, World Bank.
Cabinet Paper for Revised Vision 2020 Indicators and Targets, June 2012. Crop Intensification Program (2008–2009), Evaluation Report, IFDC, March 2010. Datt, G., &Ravallion, M. (1998) Farm productivity and rural poverty in India. Journal of Development
Studies 34(4), 62-85. doi: 10.1080/00220389808422529. Diao, X., Fan, S., Kanyarykiga, S., and Yu, B. (2010).Agricultural Growth and Investment Options for
Poverty Reduction in Rwanda. Washington, DC: International Food Policy Research Institute. European Commission, “Review of Horticultural Investment Opportunities to Leverage Pro-Poor Non-
Traditional High Commodities under PSTA-3. A project implemented by Landell Mills and VetEffecT.
Fan, Shenggen. (2008). Public Expenditure, Growth, and Poverty Reduction: Lessons from Developing Countries. Baltimore: Johns Hopkins University Press.
Government of Rwanda.Vision 2020. Ministry of Economics and Finance (MINECOFIN). Kigali: Government of Rwanda.
Government of Rwanda, Economic Development and Poverty Reduction Strategy, 2008-2012. Government of Rwanda.2013a. “Economic Development and Poverty Reduction Strategy 2013-2018”,
Government of Rwanda, Kigali. (Available at http://www.edprs.rw/content/edprs-2 - last accessed December 2013).
Government of Rwanda.2013b. “Rwanda Vision 2020”, Government of Rwanda, Kigali. (Available at http://www.minecofin.gov.rw/index.php?id=81- last accessed December 2013).
Haggblade, S., Hammer, J., and Hazell, P. (1991).Modeling Agricultural Growth Multipliers. American Journal of Agricultural Economics 73 (2): 361-374.
International Food Policy Research Institute, “The Role of Agriculture in the Fast Growing Rwandan Economy: Assessing Growth Alternatives”, Rwanda CAADP 2 Background Paper #2, Feb 2014.
ISAR, “Estimating the Profitability of Major Food Crops in Rwanda,” December 2009. Irz, Xavier, Lin, Lin, Thirtle, Colin, & Wiggins, Steve. (2001). Agricultural Productivity Growth and
Poverty Alleviation. Development Policy Review 19(4): 449-466. doi: 10.1111/1467-7679.00144.
J.E. Austin Associates, “Study on Marketing, Post-Harvest, and Trade Opportunities for Fruit and Vegetables in Rwanda, Final Report,” July 22, 2009.
James F. Oehmke, “The Impact of USAID Investment on Sustainable Poverty Reduction among Rwandan Smallholder Coffee Producers: A Synthesis of Findings”, May 19, 2011.
Martinez, Marcelo, and Montfort Mlachila. (2013). “The Quality of the Recent High-Growth Episode in Sub-Saharan Africa,” IMF Working Paper 13/53, February 26, 2013.
42
MINAGRI and OCIIR-Thé, “A Revised Tea Strategy for Rwanda 2009-2012 - Transforming Rwanda’s Tea Industry”, December 2008.
MINAGRI and PADEBL, “Updating the Master Plan of the Milk Chain in Rwanda”, April 23, 2009. MINAGRI and USAID, “The Business Case for Investing in the Export of Avocados in Rwanda,”
Monitor Group, April 10, 2012. MINAGRI, “Strategic Plan for the Transformation of Agriculture in Rwanda, Phase III”, July 2013. MINAGRI, Costing Exercise - The Strategic Plan for the Transformation of Agriculture (PSTA-III) -
2013 to 2018 MINAGRI, Master Plan for Fisheries and Fish Farming in Rwanda (2011) http://www.rab.gov.rw/IMG/pdf/Master_Plan_Fish_Farm.pdf MINAGRI, National Dairy Strategy, April 2013 MINAGRI, NISR, and World Food Program (WFP), “Comprehensive Food Security and Vulnerability
Analysis and Nutrition Survey 2012,” December 2012. MINAGRI, Rural Sector Support Project II, Rwanda Rice Commodity Chain: Strategic Options to
Maximize Growth and Poverty Reduction, Final Report, J. Dirck Stryker, Associates for International Resources and Development, August 2010;
MINAGRI, Strategic Plan for Agriculture Transformation: Financing, Coordination, and Monitoring and Evaluation
MINAGRI, Strategic Plan for the Transformation of Agriculture in Rwanda, Phase III, July 2013, Chapter VI.
MINAGRI, Strategy and Investment Plan to Strengthen the Poultry Industry in Rwanda, Final Report, July 2012.
MINAGRI, Strategy and Investment Plan for Small Animal Industry in Rwanda, Final Report, June 2012. MINAGRI, Strategy and Investment Plan to Strengthen Meat Industry in Rwanda, Final Report, July
2012. MINAGRI, Support Project to Strategic Plan for Agricultural Transformation (PAPSTA), “Commodity
Value Chain Mapping and Analysis, Market Analysis, and Value Chain Action Plans, in Nyanza, Bugesera, Nyamagabe, Gakenke, and Ngororero Districts", Provisional Report, April 2011.
MINAGRI, Technical Assistance for Institutional Component of Support Project to the Strategic Plan for the Transformation of Agriculture in Rwanda (PAPSTA), Strategic Plan for Animal Nutrition Improvement Programme for Rwanda, Final Report, April 14, 2009.
MINAGRI, Strategic Plan for the Transformation of Agricultural in Rwanda – Phase II (PSTA 2), 2009, Kigali: Government of Rwanda.
Ministry of East Africa Community Web site. Ministry of Trade and Industry, Instructions of the Minister of Trade and Industry N°19 of 3rd November
2012 N. Monkam, 2004, Projet Pilote Fruits Seches au Rwanda, ADAR Project/Chemonics International Inc. NAEB, Rwanda Tea Sector Presentation, 2012. NAEB, Statistics Report 2012 of Coffee, Tea, and Horticulture, 2013. National Agricultural Policy, October 20, 2004. National Bank of Rwanda, “Informal Cross Border Trade Survey,” various issues. National Institute of Statistics of Rwanda (NISR), 2013. National Institute of Statistics of Rwanda, “The Evolution of Poverty in Rwanda from 2000 T0 2011:
Results from the Household Surveys (EICV),” February 2012.
43
National Institute of Statistics of Rwanda, 2012 Population and Housing Census, Provisional Results, November 2012.
National Institute of Statistics of Rwanda, EICV3 Thematic Report: Agriculture, August 2012. Ndabikunze, Martin Shem, “The Feasibility Study for the Development of a Project for Fattening Beef
Cattle in Rwanda, Final Report,” September 2007. NISR, 2012 GDP Annual Estimates, March 2013. NISR, 2012 GDP Annual Estimates, March 2013. NISR, EICV 3, Thematic Report: Agriculture, August 2012. NISR, EICV3 Thematic Report: Patterns of Consumption. OTF, Dried Fruit Survey Analysis, February 1 2006. Otsuka, Keijiro. (2000). ‘Role of Agricultural Research in Poverty Reduction: Lessons from the Asian
Experience’, Food Policy 25: 447-62. Oxfam, “Fresh and Processed Pineapples for Local and Export Markets: Subsector and Value Chain
Analysis Rwanda, Final Report,” July 2009. Prasad, E.S., Rajan, R.G., and Subramanian, A. (2007).Foreign capital and economic growth. NBER
Working Paper 13619, http://www.nber.org/papers/w13619. Rapport Provisoire, BTC, March 2008. Republic of Rwanda, Economic Development and Poverty Reduction Strategy, 2008-2012. Republic of Rwanda, Economic Development and Poverty Reduction Strategy, 2013 – 2018: Shaping Our
Development. Rodrik, Dani. (2008). “The Real Exchange Rate and Economic Growth,” Brookings Papers on Economic
Activity, 2008:2 Rodrik, Dani. (2013). “The Past, Present, and Future of Economic Growth,” a paper prepared for the
Global Citizen Foundation, revised November 2013. Rwanda Agricultural Policy Note, Background Study #2, March 2006. Rwanda CAADP Compact to Support the Successful Implementation of the Strategic Plan for the
Transformation of Agriculture under the Economic Development and Poverty reduction Strategy, March 31, 2007.
Rwanda Horticulture Development Agency (RHODA), “A Survey Report on the Status of Horticulture in Rwanda,” October 2008.
Scott Loveridge, Alastair Orr, and Abdoul Murekezi, “Agriculture and Poverty in Rwanda; A Comparative Analysis of the EICV1, EICV2, and LRSS Surveys”, Michigan State University and Oxford Policy Management, September 2007.
Subramanian, A. and Rajan, R. (2011) Aid, Duth disease, and manufacturing growth,” Journal of Development Economics 94(1): 106-118
USAID – EAT Project, “Rwanda Cross-Border Agricultural Trade Analysis, February 2013, pp. 17-18. USAID – EAT Project, “Rwanda Cross-Border Agricultural Trade Analysis,” February 2013. USAID COMPETE project, “Survey and Mapping of Grain Storage Facilities in Rwanda,” September
2009. USAID/Carana, “Postharvest Baseline Survey of Rwandan Maize and Rice Farming Households,”
February 2012. USAID/COMPETE, Rwanda Coffee Industry Value Chain Analysis, May 28, 2010. USAID/TCBOOST, “A Food Commodity Trend Projection Model with Application to East African
Countries”, Bryan Roberts, Nathan Associates, December 2011,
44
World Bank and IFC, Doing Business 2014, Economy Profile: Rwanda, 2013 World Bank, “Agribusiness Indicators: Rwanda,” Draft Report for Review, August 2013. World Bank, “Prospects for Achieving Sustainable Agricultural Growth in Rwanda”, Rwanda
Agricultural Policy Note, Background Study #1, Ministry of Finance & Economic Planning, March 2006.
World Bank, “Rwanda Agricultural Markets Overview”, Rwanda Agricultural Policy Note, Background Study #2, March 2006.
World Bank, Rwanda Economic Update: Maintaining Momentum, with a special focus on Rwanda’s Pathway out of poverty, May 2013, Edition No. 4.
World Bank, Rwanda Economic Update: Maintaining Momentum, with a special focus on Rwanda’s Pathway out of poverty, May 2013, Edition No. 4.
World Bank, “Rwanda Agricultural Markets, Private Sector Development, Supply and Competitiveness Study”, Rwanda CAADP 2 Background Paper #1, Feb 2014.
World Bank, Rwanda – Promoting Pro-Poor Agricultural Growth in Rwanda: Challenges and Opportunities, 2007.
World Food Programme, Comprehensive Food Security and Vulnerability Analysis and Nutrition Survey, 2012.
Yves G. Aureille and Serge Rwamasirabo, Patterns of Competitiveness and Comparative Advantage.
45

Appendix 1: PSTA 3 Programs and Sub-Programs
Programme 1: Agriculture and Animal Resource Intensification
SP 1.1 Soil Conservation and Land Husbandry SP 1.2 Irrigation and Water Management SP 1.3 Agricultural Mechanization SP 1.4 Agrochemical use and Markets SP 1.5 Seed Development SP 1.6 Livestock Development SP 1.7 Nutrition and Household Vulnerability Programme 2: Research and Technology Transfer, Advisory Services and Professionalisation of Farmers
SP 2.1 Research and Technology Transfer SP 2.2 Extension and Proximity Services for Producers SP 2.3 Farmer Cooperatives and Organisations Programme 3: Value Chain Development and Private Sector Investment
SP3.1 Creating an Environment to Attract Private Investment, Encourage Entrepreneurs hip and Facilitate Market Access
SP 3.2 Development of Priority Value Chains: Food Crops SP 3.3 Development of Priority Value Chains: Export crops SP 3.4 Development of Priority Value Chains: Dairy and Meat SP 3.5 Development of Priority Value Chains: Fisheries SP 3.6 Development of Priority Value Chains: Apiculture SP 3.7 Agricultural Finance SP 3.8 Market- oriented Infrastructure for Post- Harvest Programme 4: Institutional Development and Agricultural Cross-Cutting Issues
SP 4.1 Institutional Capacity Building SP 4.2 Decentralisation in Agriculture SP 4.3 Legal and Regulatory Framework SP 4.4 Agricultural Communication Statistical Systems, M&E and Knowledge Management SP 4.5 Gender and Youth in Agriculture SP 4.6 Environmental Mainstreaming in Agriculture
46
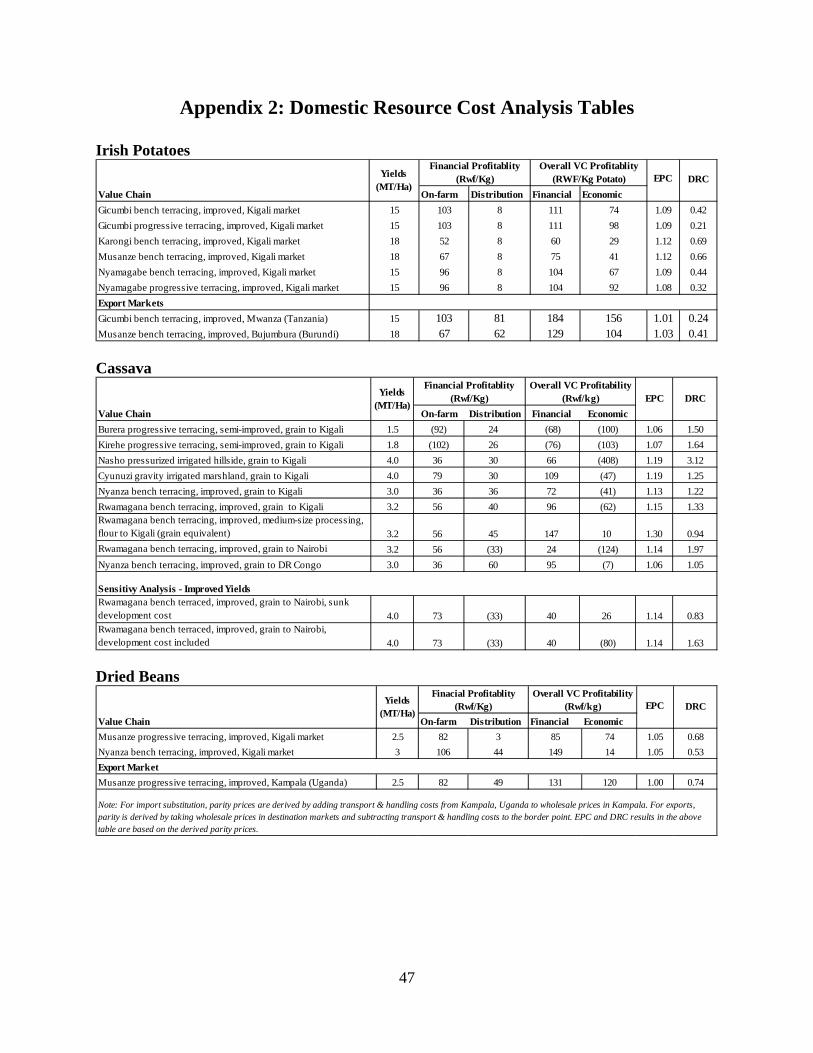
Appendix 2: Domestic Resource Cost Analysis Tables Irish Potatoes
Cassava
Dried Beans
EPC DRCValue Chain On-farm Distribution Financial EconomicGicumbi bench terracing, improved, Kigali market 15 103 8 111 74 1.09 0.42Gicumbi progressive terracing, improved, Kigali market 15 103 8 111 98 1.09 0.21Karongi bench terracing, improved, Kigali market 18 52 8 60 29 1.12 0.69Musanze bench terracing, improved, Kigali market 18 67 8 75 41 1.12 0.66Nyamagabe bench terracing, improved, Kigali market 15 96 8 104 67 1.09 0.44Nyamagabe progressive terracing, improved, Kigali market 15 96 8 104 92 1.08 0.32Export MarketsGicumbi bench terracing, improved, Mwanza (Tanzania) 15 103 81 184 156 1.01 0.24Musanze bench terracing, improved, Bujumbura (Burundi) 18 67 62 129 104 1.03 0.41
Yields (MT/Ha)
Financial Profitablity (Rwf/Kg)
Overall VC Profitablity (RWF/Kg Potato)
EPC DRCValue Chain On-farm Distribution Financial EconomicBurera progressive terracing, semi-improved, grain to Kigali 1.5 (92) 24 (68) (100) 1.06 1.50Kirehe progressive terracing, semi-improved, grain to Kigali 1.8 (102) 26 (76) (103) 1.07 1.64Nasho pressurized irrigated hillside, grain to Kigali 4.0 36 30 66 (408) 1.19 3.12Cyunuzi gravity irrigated marshland, grain to Kigali 4.0 79 30 109 (47) 1.19 1.25Nyanza bench terracing, improved, grain to Kigali 3.0 36 36 72 (41) 1.13 1.22Rwamagana bench terracing, improved, grain to Kigali 3.2 56 40 96 (62) 1.15 1.33Rwamagana bench terracing, improved, medium-size processing, flour to Kigali (grain equivalent) 3.2 56 45 147 10 1.30 0.94Rwamagana bench terracing, improved, grain to Nairobi 3.2 56 (33) 24 (124) 1.14 1.97Nyanza bench terracing, improved, grain to DR Congo 3.0 36 60 95 (7) 1.06 1.05
Sensitivy Analysis - Improved YieldsRwamagana bench terraced, improved, grain to Nairobi, sunk development cost 4.0 73 (33) 40 26 1.14 0.83Rwamagana bench terraced, improved, grain to Nairobi, development cost included 4.0 73 (33) 40 (80) 1.14 1.63
Financial Profitablity (Rwf/Kg)Yields
(MT/Ha)
Overall VC Profitability (Rwf/kg)
EPC DRCValue Chain On-farm Distribution Financial EconomicMusanze progressive terracing, improved, Kigali market 2.5 82 3 85 74 1.05 0.68Nyanza bench terracing, improved, Kigali market 3 106 44 149 14 1.05 0.53Export MarketMusanze progressive terracing, improved, Kampala (Uganda) 2.5 82 49 131 120 1.00 0.74
Finacial Profitablity (Rwf/Kg)Yields
(MT/Ha)
Overall VC Profitability (Rwf/kg)
Note: For import substitution, parity prices are derived by adding transport & handling costs from Kampala, Uganda to wholesale prices in Kampala. For exports, parity is derived by taking wholesale prices in destination markets and subtracting transport & handling costs to the border point. EPC and DRC results in the above table are based on the derived parity prices.
47

Bananas
Horticultural Products Avocado
Pineapple
Passion fruit
Tea
Coffee
EPC DRCValue Chain On-farm DistributionFinancial EconomicImport SubstitutionCooking banana, Gakenke progressive terracing, semi-improved, Kigali market 11 73 14 87 76 1.05 0.36Cooking banana, Ngororero progressive terracing, semi-improved, Kigali market 11 69 14 82 72 1.05 0.32Dessert banana, Gakenke progressive terracing, semi-improved, Kigali market 6 64 18 82 67 1.05 0.63Export MarketsCooking banana, Gakenke progressive terracing, semi-improved, Gitega (Burundi) 11 73 33 106 102 1.00 0.36Cooking banana, Gakenke progressive terracing, semi-improved, Kampala (Uganda 6 73 -41 32 67 1.00 0.67
Financial Profitablity (Rwf/Kg)
Yields (MT/H
a)
Overall VC Profitability (Rwf/kg)
Note: For import substitution, parity prices are derived by adding transport & handling costs from Kampala, Uganda to wholesale prices in Kampala. For exports, parity is derived by taking wholesale prices in destination markets and subtracting transport & handling costs to the border point. EPC and DRC results in the above table are based on the derived parity prices.
EPC DRCValue Chain Financial EconomicFresh export-grade avocado, estate production, export to EU 16 345 345 1.00 0.54Fresh export-grade avocado, outgrower production, export to EU 14 141 141 1.00 0.80
Yields (MT/H
a)
Overall VC Profitability (Rwf/kg)
Value Chain On-farm CollectionProcessor/
Distribution Financial Economic
Import SubstitutionFresh pineapples, Nyagatare non-intensive cultivation, Kigali market 4 90 - 39 130 130 1.00 0.25Fresh pineapples, Nyagatare intensive cultivation, Kigali market 15 104 - 39 143 143 1.00 0.20Dried pineapples, Nyagatare intensive cultivation, Kigali market 15 220 29 50 179 179 1.00 0.50
Financial Profitablity (Rwf/Kg)Yields (MT/H
a)
Overall VC Profitability (Rwf/kg)
Note: For import substitution, parity prices are derived by adding transport & handling costs from Kampala, Uganda to wholesale prices in
EPC DRC
EPC DRC
Value Chain On-farm Distribution Financial EconomicFresh passion fruits, improved production technique, Kigali 23 350 156 470 470 1.00 0.38
Yields (MT/H
a)
Overall VC Profitability (Rwf/kg)
Financial Profitability (Rwf/kg)
EPC DRC
Value Chain On-farm Distribution Financial EconomicFully-washed, exported via Mombasa 18,750 72 549 621 621 1.00 0.56
Yields (MT/H
a)
Overall VC Profitability (Rwf/kg)
Financial Profitability (Rwf/kg)
EPC DRCValue Chain On-farm Distribution Financial EconomicFully-washed, exported via Mombasa 4.17 198 295 493 493 1.00 0.83
Fully Washed Coffee Exported via Mombasa (kg green coffee)
Yields (MT/Ha)
Overall VC Profitability (Rwf/kg)
Financial Profitability (Rwf/kg)
48
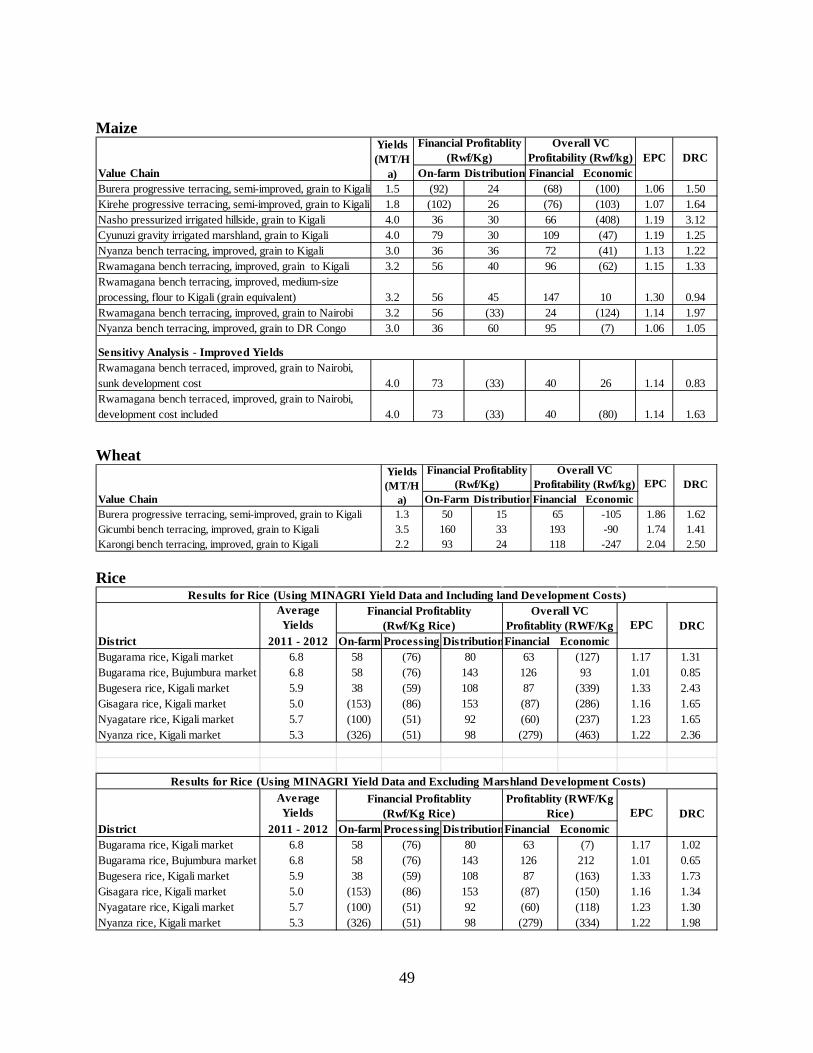
Maize
Wheat
Rice
EPC DRCValue Chain On-farm Distribution Financial EconomicBurera progressive terracing, semi-improved, grain to Kigali 1.5 (92) 24 (68) (100) 1.06 1.50Kirehe progressive terracing, semi-improved, grain to Kigali 1.8 (102) 26 (76) (103) 1.07 1.64Nasho pressurized irrigated hillside, grain to Kigali 4.0 36 30 66 (408) 1.19 3.12Cyunuzi gravity irrigated marshland, grain to Kigali 4.0 79 30 109 (47) 1.19 1.25Nyanza bench terracing, improved, grain to Kigali 3.0 36 36 72 (41) 1.13 1.22Rwamagana bench terracing, improved, grain to Kigali 3.2 56 40 96 (62) 1.15 1.33Rwamagana bench terracing, improved, medium-size processing, flour to Kigali (grain equivalent) 3.2 56 45 147 10 1.30 0.94Rwamagana bench terracing, improved, grain to Nairobi 3.2 56 (33) 24 (124) 1.14 1.97Nyanza bench terracing, improved, grain to DR Congo 3.0 36 60 95 (7) 1.06 1.05
Sensitivy Analysis - Improved YieldsRwamagana bench terraced, improved, grain to Nairobi, sunk development cost 4.0 73 (33) 40 26 1.14 0.83Rwamagana bench terraced, improved, grain to Nairobi, development cost included 4.0 73 (33) 40 (80) 1.14 1.63
Financial Profitablity (Rwf/Kg)
Yields (MT/H
a)
Overall VC Profitability (Rwf/kg)
EPC DRCValue Chain On-Farm DistributionFinancial EconomicBurera progressive terracing, semi-improved, grain to Kigali 1.3 50 15 65 -105 1.86 1.62Gicumbi bench terracing, improved, grain to Kigali 3.5 160 33 193 -90 1.74 1.41Karongi bench terracing, improved, grain to Kigali 2.2 93 24 118 -247 2.04 2.50
Financial Profitablity (Rwf/Kg)
Yields (MT/H
a)
Overall VC Profitability (Rwf/kg)
Average Yields EPC DRC
District 2011 - 2012 On-farm Processing DistributionFinancial EconomicBugarama rice, Kigali market 6.8 58 (76) 80 63 (127) 1.17 1.31Bugarama rice, Bujumbura market 6.8 58 (76) 143 126 93 1.01 0.85Bugesera rice, Kigali market 5.9 38 (59) 108 87 (339) 1.33 2.43Gisagara rice, Kigali market 5.0 (153) (86) 153 (87) (286) 1.16 1.65Nyagatare rice, Kigali market 5.7 (100) (51) 92 (60) (237) 1.23 1.65Nyanza rice, Kigali market 5.3 (326) (51) 98 (279) (463) 1.22 2.36
Average Yields EPC DRC
District 2011 - 2012 On-farm Processing DistributionFinancial EconomicBugarama rice, Kigali market 6.8 58 (76) 80 63 (7) 1.17 1.02Bugarama rice, Bujumbura market 6.8 58 (76) 143 126 212 1.01 0.65Bugesera rice, Kigali market 5.9 38 (59) 108 87 (163) 1.33 1.73Gisagara rice, Kigali market 5.0 (153) (86) 153 (87) (150) 1.16 1.34Nyagatare rice, Kigali market 5.7 (100) (51) 92 (60) (118) 1.23 1.30Nyanza rice, Kigali market 5.3 (326) (51) 98 (279) (334) 1.22 1.98
Results for Rice (Using MINAGRI Yield Data and Including land Development Costs)Financial Profitablity
(Rwf/Kg Rice)Overall VC
Profitablity (RWF/Kg
Results for Rice (Using MINAGRI Yield Data and Excluding Marshland Development Costs)Financial Profitablity
(Rwf/Kg Rice)
Profitablity (RWF/Kg
Rice)
49