university of malaya living labs - umexpert.um.edu.my · content foreword i 1 zero carbon building...
TRANSCRIPT
UNIVERSITY OF MALAYA
LIVING LABS
Transforming Research into Action (VOL. 1)


UNIVERSITY OF MALAYA
LIVING LABS
Transforming Research into Action (VOL. 1)
Editor
Sumiani Yusoff
Sustainability Science Research Cluster University of Malaya
Kuala Lumpur ● 2017

Published by
Sustainability Science Research Cluster
Level 7, Research Management and Innovation Complex
University of Malaya,
50603, Kuala Lumpur, MALAYSIA
Copyright © 2017 Sustainability Science Research Cluster
All rights reserved.
No part of this publication may be reproduced, stored in retrieval system, or
transmitted, in any form or by any means – for example, electronic, mechanical,
photocopying, recording or otherwise without the prior permission from
Sustainability Science Research Cluster.
Perpustakaan Negara Malaysia Cataloguing-in-Publication
Data
University of Malaya Living Labs / Editor Sumiani Yusoff
ISBN 978-967-488-003-3
Printed and bound in Kuala Lumpur by
DISCLAIMER: The views and opinions expressed in this book are solely those of
the authors and do not represent the views of the University of Malaya or the
Sustainability Science Research Cluster.

Content
Foreword i
1 Zero Carbon Building Assessment for UM
Chancellery Building and Other UM Office Buildings
Ali Mohammed Alashwal, Muhammad Azzam Bin Ismail,
Karam M. Al-Obaidi, Sharifah Noor Nazim Syed Yahya,
and Mohammed Hatim Al-Sabahi
1
2 Carbon Abatement Module for University of Malaya
Eco-Campus: Addressing Urban Heat Island and
Climatic Change Impact
Suzaini Mohamed Zaid, Nurshuhada Zainon, Nik Elyna
Myeda, Hazreena Hussein, and Eeswari Perisamy
26
3 Issues and Challenges in Organizing an Effective
Campus Energy Saving Culture
Zul Ilham, Adi Ainurzaman Jamaludin, Nurul Emy Idayu
Zulkifli, Muhammad Faizal Kamar, Fathiah Mohamed
Zuki and Rohana Jani
39
4 Smart Modular Electrical Energy Monitoring and
Management System
Mohd Yazed Ahmad
48
5 Safe Disposal of Unused Medications - Working
towards A Green Pharmacy in University of Malaya
Medical Centre
Sim Si Mui, Lai Siew Mei Pauline, Tan Kit Mun, Lee Hong
Gee, Che Zuraini Sulaiman and Wong Yin Yen
58
6 University of Malaya Zero Waste Campaign: Integrated and Sustainable Waste Management
System Development in University of Malaya
Sumaini Yusoff, Keng Zi Xiang, and Nur Syuhada
71
7 University of Malaya Zero Food Waste Campaign - A
Head Start
Norbani Che-Ha and Saad Md Said
86

8 Construction Recycling Waste Centre for
Sustainable Drainage Construction
Hussein Adebayo Ibrahim, Soon Poh Yap, Johnson
Alengaram, and Kim Hung Mo
100
9 Real-time and Automated Traffic Data Inventory and
Monitoring System Campus
Ahmad Saifizul Abdullah, Rahizar Ramli and Farah
Fazlinda Mohamad
113
10 Sustainable Transport System in University of Malaya
Campus: Study on Improving the Campus Shuttle Bus
Service and Promote Non-Motorised Transport
Mode
Yuen Choon Wah, Mohamed Rehan Karim, Aminah Wati
Abdullah, Yong Adilah Shamsul Harumain, and Mastura
Adam
125
11 Working towards A Sustainable Means of Campus
Transportation
Onn Chiu Chuen, Mohamed Rehan Karim, Sumiani
Yusoff, Ong Zhi Chao, Wan Asma Diana Wan Roselan,
and Lim Zhen Jie
141
Notes on Contributors 156
Index 163

i
Foreword
In the Name of Allah Most Beneficent Most Merciful.
As Salam and Greetings,
University of Malaya Living Lab Grant Programme, or simply known as UM Living
Lab is a strategic partnership between the Deputy Vice Chancellor (Research &
Innovation) and DVC (Development). The philosophy behind the Living Lab idea
is to convert university campuses to Living Labs which involves using the
university’s research capabilities to solve sustainability issues relating to its
infrastructure and practices. Living Lab, in UM’s context, fosters applied research
and education by using the campus to test real-time sustainability solutions,
offering opportunities to UM stakeholder to translate research into action and
enabling the university’s fabric to achieve greater engagement through practical,
hands-on, and a more well-rounded educational experiences.
Practically, UM Living Lab serves as a knowledge/action research-platform for
UM as the process owner to gradually improve the sustainability of their
operations. In this more focused, systematic collaborative, and trans-disciplinary
in nature approach, UM researchers will join hands with relevant stakeholders in
UM to systematically improve UM’s performance in these areas, according to
specific targets or Key Performance Indicators. UM Living Lab researches have
produced numerous tangible sustainability outputs in the form of actual campus
environmental, economic, and social improvements, thus supporting and
complementing UM eco-campus agenda and realising the University Malaya Eco-
Campus Blueprint (UMECB) goals for sustainable development.
This publication is one out of the two volumes written jointly by UM Living Lab
researchers from a diverse range of disciplines including science, engineering, arts
and social sciences, medicine and rehabilitation, and built environment. It serves
as an intermediary for the researchers to impart their knowledge to the readers,
not only within University of Malaya, but also beyond our campus’ territory.
The first volume consists of 11 articles written focusing on the topic of energy
management, waste management, and transportation management while the
second volume consists of 10 articles focusing on water management,
biodiversity, and community engagement issues. All research works are
coordinated under the Sustainability Science Research Cluster as the
Administrator of UM Living Lab.

ii
It is my hope that this publication will go some way towards garnering further
interest in the trans-disciplinary Living Lab approach. The Living Lab mode,
although relatively new compared to traditional research approach, is quickly
gaining attention worldwide where innovative solutions are needed. Thus, we
need to seriously pursue not only scientific and technological advancement, but
also translational and transformative research to deal with the significant global
challenges we face in the 21st century.
Lastly, it is acknowledged that the major part of this work was conducted under
the framework of UM Living Lab which was primarily funded by the University
of Malaya’s Deputy Vice Chancellor (Research and Innovation) office. It has also
received support and partial funding from the Deputy Vice Chancellor
(Development) and the Department of Development and Estate Maintenance,
University Malaya.
Associate Professor Dr. Sumiani Yusoff
Dean
Sustainability Science Research Cluster
University of Malaya

1
1
Zero Carbon Building Assessment for UM
Chancellery Building and Other UM Office
Buildings Ali Mohammed Alashwal1, *, Muhammad Azzam Bin Ismail1, Karam M. Al-
Obaidi1, Sharifah Noor Nazim Syed Yahya2, Mohammed Hatim Al-Sabahi1
1Center for Building, Construction and Tropical Architecture, Faculty of Built
Environment, University of Malaya, Kuala Lumpur, Malaysia 2 Department of Development and Estate Maintenance (JPPHB), University of
Malaya.
*Corresponding author: [email protected]
Abstract
The purpose of this study is to evaluate University of Malaya (UM) Chancellery
building in terms of energy usage and indoor environmental quality (IEQ). A
triangulation research method was used to achieve this objective. The data was
collected using physical measurements of thermal comfort and electricity
consumption in the building. In addition, a questionnaire survey licensed by the
Building Use Studies (BUS) was distributed to all staff in the building to obtain
their perception of the building conditions including comfort, productivity, and
health. The last method included a validation of the results using the Integrated
Environmental Solutions-Virtual Environment (IES-VE) simulation. The results of
a typical floor of the building indicated variability of indoor air temperatures and
high levels of relative humidity (between 55% to 85%). Besides, the results of the
BUS survey identified the critical conditions that need attention including
temperature range (colder), temperature stability (unstable), artificial light (too
much), air humidity (humid), air freshness (stuffy), glare from lights (too much),
and glare from sun and sky (too much). These conditions have an influence on
staff health and productivity as shown by further analysis of the data. Based on
these findings, it is recommended to change the operation time of the a/c,
increase temperature, enhance ventilation and restrict humid air in AHUs to
reduce humidity, install internal sun-shading screen with light shelves to bring

2
more daylight, and coat the internal side of curtain wall glazing with low U-value
material to reduce infrared and internal cooling load. The recommendations,
although are restricted by the building conditions, can contribute to energy
reduction and achieving better internal comfort for occupants in the Chancellery
building.
Keywords: BUS survey; Eco-campus; IES-VE simulation; Indoor thermal
comfort; Living Lab; University of Malaya
Introduction
The concept of zero energy or zero carbon building is generally defined as a
decreased vitality needs through productivity (Torcellini et al., 2006). This idea
exists since the mid-twentieth century after the development of sunlight based
house as one of the endeavours towards zero fossil energy goals (Butti and Perlin,
1980). However, it is challenging to reduce energy without compromising the
indoor environmental quality (IEQ) in the building especially in hot and humid
areas such as Malaysia. In such environment, the issue of warmth stress is
significantly a serious issue (Kjellstrom et al., 2009; Kjellstrom et al., 2013). Hot
and humid conditions at working places may prompt a scope of warmth-related
side effects or sicknesses like overwhelming sweating, lack of hydration, low
circulatory strain, and salt lopsidedness prompting sharp muscle agony (Bates
and Schneider, 2008; Forsthoff et al., 2001; Hayashi and Tokura, 2001; Mitchell
et al., 1976). As employees spend most of their day in office buildings, IEQ of a
space directly affects the comfort and personal satisfaction. The comfort
conditions have a direct influence on employees’ performance (Lan and Lian,
2009; Seppänen and Fisk, 2006; Wyon, 1997). Subsequently, in office buildings,
there is an immediate connection between IEQ of encased spaces and
productivity of the office inhabitants (Mofidi and Akbari, 2017).
Previous studies have demonstrated the effects of workplace conditions on the
working environment (Arngrïmsson et al., 2004; Bates and Schneider, 2008;
Bridger, 2008; Dutta and Chorsiya, 2013; González‐Alonso et al., 2008;
Wesseling et al., 2014). The thermal comfort in the workplace is influenced by
different components, such as thermo-physical properties of the building
materials, ventilation, and space usage. In fact, individuals or occupants play a
critical rule of a building's vitality utilisation. Occupants use different cooling or
warming mechanisms to accomplish comfort. Kofoworola and Gheewala
(2009) indicated that the vitality utilisation rates are higher amid the
operation hour contrasted with the non-operational hour. Fisk et al.
(2011) assessed that every year 17 to 26 billion dollars monetary benefits
are achievable by enhancing the IEQ of offices over the United States.

3
Due to the increase of the environmental issues, a research on reducing carbon
emission and energy is essential in different aspects. The main goal of this
research is to develop a Zero Carbon Building assessment guideline for office
buildings in Malaysia. The research considers reducing carbon footprints without
compromising IEQ of the building. Apart from this main goal is to evaluate the
thermal comfort and energy consumption of office buildings in Malaysia. The
Chancellery building in UM was chosen due to its green area location with low
building density and perfect north and south orientation. The Building Energy
Index (BEI) of this building is approximately 120 kWh/m2/year, which can be
reduced further to achieve the title of zero energy building. The methods used
in this study include physical measurements of thermal comfort and energy
consumption and questionnaire survey to assess building conditions and thermal
comfort. Based on the results and simulation modelling, a set of
recommendations has been proposed in this study. The following section
provides an overview of some studies about zero energy building and thermal
comfort.
Literature Review
Elements influencing the utilisation of building vitality can be divided into two
types, which are, non-configuration elements and inactive plan components
(Chan, 2004). The non-configuration elements are the variables influenced by
inhabitance and administration, ecological guidelines, and atmosphere (Huat and
Akasah, 2011). In the first element, occupancy and administration, occupants play
important role to keep running of a building's imperativeness usage. Inhabitants
use different method of cooling or warming to attain comfort. There are four
wide points to consider, which are compel of building inhabitance, sort of
development, customer perspective, and organisation and affiliation. In addition,
environmental standards incorporating the air temperature in the building are
kept up by circulating air through and cooling load. Some office structures and
lodgings keep up indoor temperatures as low as 18 °C to 20 °C when the
comfort temperature is around 24 °C. Thus, it is common to see occupants
wearing sweaters in some offices in Malaysia. The climate influences the vitality
utilisation in a building mainly by affecting the space cooling and warming
necessities (Huat and Akasah, 2011).
Besides, passive design factors that impact the building's usage rate are size and
shape; presentation; masterminding and outline; thermo-physical properties; and
window systems (Bridger, 2008). For size and shape, Wilkinson and Reed (2006)
found that little office building has a low essentialness usage rate appeared
differently in relation to inconceivable office structures. A higher imperativeness
use rate is brought on by the greater space ought to have been cooled or
warmed. Generally, presentation and building layout affect cooling and warming
of the building as well as ventilation. Aziz and Adnan (2008) demonstrated that
organisation and configuration of a building are important factors in reducing the

4
building energy usages. This is because a broad space requires greater
imperativeness for its cooling or warming proposes. The statures of a rooftop
and space volume are among the segments impacting the essentialness use.
Moreover, thermo-physical properties, warm resistance, and warm limit are
impacted by the properties of materials. A study conducted by Zhang et al. (2006)
exhibits that the room worked with high warm resistance dividers expends bring
down vitality contrasted with low warm resistance divider. Warmth and cold can
enter the working space through translucent materials, such as, windows.
The indoor conditions are influenced by the thermo-physical properties of the
materials. In addition, comfort of occupants is related to the properties of the
building materials used (Hyde, 2013). For example, materials having lower warm
conductivity, warm diffusivity and absorptivity, have less temperature swing
inside surface of the dividers contrasted and materials with high warm
conductivity (Ozel, 2011). Some building materials that have low warm
conductivity, such as, nylon, polystyrene foam, polyurethane foam, do not
provide the perfect warm comfort especially when used for flooring in hot and
damp conditions. The envelope of a building is a separator from the outside
condition and also a protection from external conditions affecting the building
(Givoni, 1969).
Ventilation is a crucial quality in overhauling warm comfort. Ordinary ventilation
can be transformed into an important bit of the building envelope by displaying
any of the going with ventilation segments viz., wind scoop, wind tower, chimney,
twofold façade, chamber, ventilation chamber, embedded channel or possibly
ventilation opening in the outside (Hamza et al., 2011; Moosavi et al., 2014). New
advancements that improve air circulation include standoffish or low-
imperativeness systems like Earth-to-Air Heat Exchanger (EAHE) and the
daylight based smokestacks (SC), by ventilating air to the indoor spaces, using
the ground's potential warm cut-off (Bansal et al., 2009; Musa, 2009; Tittelein et
al., 2009; Zhang and Haghighat, 2005). Daylight based chimneys are represented
to be astoundingly suitable in hot airs with their high cooling limits and in
conjunction with trademark ventilation they can help create control (Hirunlabh
et al., 1999; Khedari et al., 2000).
Research Methodology
The Chancellery Building is a central administration building for the University of
Malaya (UM), in which different administrative divisions are centralised in one
building. The building was completed in the early 2011 and came into full
operation by mid-2011. The building was originally designed as open plan concept
with middle and side cores. Eventually, the open plan office layout evolved into
semi open plan due to the specific needs of the administrative divisions. The
eleven-story building houses administrative offices, meeting and seminar rooms,
an art gallery, and sub-basement carpark. The building, which total built-up area

5
is approximately 18,993m2, is occupied by a variety of administration divisions
with the total occupancy of about 400 people. Due to its administrative purpose,
the usage of the building is quite predictable in which, it is expected that activities
will generally commence at 8 am and subsides at 6pm from Monday to Friday.
Minimum activity is expected during Saturday, Sunday and public holidays. One
hundred percent of energy consumed by the study building is in the form of
electricity supplied by the national electricity provider.
To assess the conditions of UM Chancellery building in terms of energy usage
and thermal comfort, a triangulation methodology was used to collect the data
using physical measurements and questionnaire survey. Figure 1 shows the
research methodology flowchart of this study. The following sections discuss the
methods used in this study.
Physical Measurement
Questionnaire Survey
Data Analysis IES Simulation
Modeling
Final Recommendations
Evaluation of UM Chancellory
Internal Conditions
IES Simulation Modeling
Descriptive and Benchmarking
Hierarchical Multiple Regression Analysis
BUS Method
Electricity Consumption
Data Loggers (HOBOs)
Recommendations to reduce energy and achieve OIEQ
Figure 1: Research flowchart
Physical Measurements
The measurement of internal conditions was conducted using Data Loggers
(HOBOs) to mainly measure air temperature, relative humidity, and illuminance.
The indoor environmental conditions of six levels of the Chancellery building,
namely, 2nd, 3rd, 6th,7th, 8th and 9th were evaluated through a period of one week
for each floor. The researchers installed eight HOBOs in each floor at the height
of 900mm above the floor with a careful consideration of their locations in the
office spaces. Each floor of the building can be divided into two sections based
on the air conditioning (a/c) distribution. Note that each floor has two Air
Handling Units (AHUs) located in the eastern and western sides of the floor as
shown in Figure 2. Therefore, four HOBOs were located in each section and

6
distributed in selected locations in each section. The investigation was conducted
from December 2016 to the end of January 2017. Based on initial data analysis,
level 6 was deemed to have some issues related to comfort such as glare,
temperature comfort and air freshness compared with other floors of the
building. Therefore, and for the sake of brevity, the results of level 6 were
presented in this chapter.
Figure 2: Typical floor (level 6) of UM Chancellery Building.
In addition, the researchers measured the actual electricity consumption of the
central a/c plant as well as a selected Air Handling Unit (AHU) at Level 7 of the
building using PEL103 power loggers for one month. Although the period of
energy monitoring was much longer than the indoor environmental monitoring,
the monitored period was long enough to establish a pattern of electricity
consumption by the central a/c system. In order to contextualize the electricity
recordings, the researcher referred to the published electricity use report for
this building.
BUS Methodology
Besides the physical measurements, it is important to measure occupants’
opinion regarding their comfort level. The sense of comfort and satisfaction can
differ from one culture to another (Humphreys, 2005). For this purpose, the BUS
methodology (Building Use Studies, 2011) was used to measure the occupants’
perception of the building conditions. The BUS methodology is one of the most
widely used survey to study buildings performance (Gou et al., 2013). This
method uses questionnaire survey and provides benchmark dataset for the study
to compare the building performance with a globally recognized benchmarking
and threshold. The BUS survey consists of background of respondents, building
overall (design, needs, space, image, safety, etc.), working requirements of staff,
comfort (temperature, air, noise, lighting, overall comfort), productivity at work,
health, personal control of building conditions, response to problems regarding
comfort conditions, effect of building conditions on behaviour, and staff travel to

7
work. The questions in the BUS survey include multiple-choice questions as well
as open-ended questions to provide comprehensive response. For this study, the
survey was prepared in English with a separated translation set in Bahasa Melayu.
In total, 387 questionnaire forms were distributed by hand to all the staff of the
building.
Figure 3: Benchmark test indicator for slider graphic
(source: BUS Methodology, 2017)
The data was analysed using descriptive analysis approach using mean values. A
tri-coloured ‘milestone’ represents the benchmark test result, where a red
diamond signifies that the studied building is significantly worse than the
benchmark, an amber circle indicates that there is no difference with benchmark
and a green square denotes that the studied building performs significantly better
than the benchmark (Figure 3). The milestones were determined depending on
the position of the studied building score on the slider. On the slider, a critical
region is defined by the region within the upper limit of the scale mid-point or
benchmark and the lower limit of scale mid-point or benchmark. A score that
sits within the critical region will return an amber circle milestone. Scores that
sit to the outside right of the critical region will return a green square while the
opposite score position will return a red diamond.
To determine the influence of building conditions and comfort on productivity
and health, the data was analysed using the hierarchical multiple regression
analysis (Gelman and Hill, 2006). In this method, the influence of some variables
can be controlled to provide more accurate prediction of building conditions and
comfort on the studied variables such as health (Petrocelli, 2003).
IES-VE Simulation Modelling
The last method involved simulation modelling of the building using the
Integrated Environmental Solutions-Virtual Environment (IES-VE). This method
is used to compare the simulation output with the real measurement of thermal
comfort of the Chancellery building. IES-VE represents one of most reliable
simulation tools in the field of energy efficient design, particularly for building
Significantly worse
Significantly better
No difference

8
systems. IES-VE meets the requirements of ASHRAE Standard 140 and CIBSE
AM11 (Al-Obaidi, 2015). The simulation program is recommended for the
Malaysian conditions by the Green Building Index (GBI, 2013) and the Building
Energy Efficiency Technical Guideline for Passive Design (BSEEP, 2013). Several
studies validated the accuracy of the selected software, a procedure commonly
referred to as calibration was performed on the simulation model. The findings
of the simulation by Al-Tamimi and Syed Fadzil (2011), Lim and Ahmad (2015)
and Lim and Heng (2016) investigated the accuracy of IES-VE with field
measurements. The results obtained from IES-VE, including solar radiation
(irradiance and irradiation), air temperature and air velocity that showed a high
level of reliability in the tropics.
Results
Physical Measurement and IES-VE Results
The behaviour of indoor air temperature is significantly various in each location
of the 6th floor even though the cooling loads were fixed at 24°C. As shown in
Figure 4, the differences in temperature are noticeable and ranged from 21°C to
27°C during weekdays (with occupants + cooling load) while it ranged from 24°C
to 30°C during the weekend and public holiday (without occupants + without
cooling load).
Figure 4: Readings of indoor air temperature for 7 days in level 6
(HOBOs results)
18
20
22
24
26
28
30
32
D0
D1
D2
D3
D4
D5
D6
D7
Tem
p (
ºC)
h1 h2 h3 h5 h8
Holiday Weekend

9
Furthermore, the readings showed that the difference of maximum air
temperature between weekdays and weekend ranged between 2°C to 3°C. In
addition, the HOBOs located 1m from the windows were higher 2°C compared
to HOBOs located in deep locations during weekdays and increased to around
3°C during weekend. The differences of temperature during working hours could
reach to 2°C and sometimes to 3°C in comparison between different HOBOs
locations. This observation indicated that the variances between with and
without cooling loads is ranged and sometimes slightly exceeded the Malaysian
comfort temperature between 24°C to 28°C. The results of IES-VE simulation
(Figure 5) indicated that physical measurements and IES-VE results are similar,
which indicate the validity of simulation results. In general, the results indicated
that the indoor environmental condition was unstable during the weekdays and
even weekends, which concluded that Chancellery building envelope is easily
affected by the outdoor environmental condition.
Figure 5: Readings of indoor air temperature for 7 days in level 6 (IES-VE
simulation results)
The study also investigated the condition of relative humidity in different
locations of the 6th floor (Figure 6). The results clearly presented that each
location suffered from an unstable indoor condition during 7 days. The readings
showed that the levels of humidity were almost similar between weekdays (with
occupants + cooling load) and weekends (without occupants + without cooling
load). The optimum level of humidity should be ranged between 40 to 55% to
provide comfort level for occupants (Fanger, 1970). However, the readings
indicated that the range was between 55 to 85% during weekdays and weekends,
which represent non-comfort condition. The simulation results indicated similar
pattern in relative humidity readings. These results clearly pointed a problem
with cooling systems that deliver high level of humidity and added more loads on
21
22
23
24
25
26
27
28
29
0:3
0
7:3
0
14:
30
21:
30
4:3
0
11:
30
18:
30
1:3
0
8:3
0
15:
30
22:
30
5:3
0
12:
30
19:
30
2:3
0
9:3
0
16:
30
23:
30
6:3
0
13:
30
20:
30
3:3
0
10:
30
17:
30
0:3
0
7:3
0
14:
30
21:
30
Wed,08/Dec
Thu,09/Dec
Fri, 10/Dec Sat,11/Dec
Sun,12/Dec
Mon,13/Dec
Tue,14/Dec
Wed,15/Dec
Tem
p (
ºC)
Holiday Weekend

10
the indoor environmental condition. In fact, this issue contributes to creating
many health problems to the occupants and represents waste in terms of energy
and carbon emission.
Figure 6: The readings of relative humidity levels for 7 days in level 6
(HOBOs results)
Figure 7: The readings of relative humidity levels for 7 days in level 6 (IES-VE
simulation results)
40
50
60
70
80
90
100
D0
D1
D2
D3
D4
D5
D6
D7
RH
(%
)
h1 h2 h3 h5 h8
Weekend Holiday
40
50
60
70
80
90
100
0:3
0
7:3
0
14:
30
21:
30
4:3
0
11:
30
18:
30
1:3
0
8:3
0
15:
30
22:
30
5:3
0
12:
30
19:
30
2:3
0
9:3
0
16:
30
23:
30
6:3
0
13:
30
20:
30
3:3
0
10:
30
17:
30
0:3
0
7:3
0
14:
30
21:
30
Wed,08/Dec
Thu,09/Dec
Fri, 10/Dec Sat,11/Dec
Sun,12/Dec
Mon,13/Dec
Tue,14/Dec
Wed,15/Dec
RH
(%
)
Weekend Holiday

11
Furthermore, the readings of illuminance in this floor showed significant
differences between HOBOs locations (Figure 8). The results indicated that
HOBOs near to the windows with a distance of 1m recorded very high readings
that exceeded 2000 lux during the weekdays as well as weekend. However, the
readings of HOBOs located within 10m from windows were between 180 to
200 lux, which is considered low for office activities. The simulation results show
the measurement of illuminance during three times of the day; 09:00am,
12:00pm, and 03:00pm. The uneven distribution of illuminance inside office
spaces can contribute to several issues such as glare, reflection, and stress. These
issues are related to visual comfort and may affect the productivity of users.
Figure 8: The readings of illuminance levels for 7 days in level 6
(HOBOs results)
0
500
1000
1500
2000
2500
3000
D0
D1
D2
D3
D4
D5
D6
D7
Ligh
t (l
ux)
h1 h2 h3 h5 h8
Weekend Holiday

12
Figure 9: The readings of illuminance levels for 7 days in level 6 during 9am,
12pm, and 3pm (IES-VE simulation results)
12 pm / 8 Dec. 2016
3 pm / 8 Dec.
2016
9 am / 8 Dec. 2016

13
Electricity Measurement Results
Figure 10 shows pattern of electricity consumptions for both locations namely
the main central a/c and the AHU in Level 7. It is apparent that the electricity
consumption pattern is consistent throughout the one-month monitoring period.
There were slight variations in the timing of operational hours due to manual
switching of the controls. In addition, there were slight variations in electricity
use when the outdoor weather condition changed between dry and high
precipitations. Overall, the power logger at the main a/c switchboard recorded
a total of 117,251 kWh of electricity used for a/c for the whole building for the
month of January 2017 or 65.19% of the 179849 kWh total Chancellery
electricity use as reported by the Deputy Vice Chancellor (Development).
Figure 10: Electricity consumption of central air-conditioning system
for 1/8/17 to 1/14/17
BUS Survey Results
The total number of returned and completed questionnaire forms is 208, making
a 54% response rate. The participants of the survey represent all the departments
of the building, which provided a good chance to evaluate the overall building
conditions. Most of the participants are working 5 days a week (90.1%) and the
rest are working between one day (0.5%) to one full week (3%). Most of the
participants are spending 8 hours in the building on a normal working day (45.6%)
and the rest are spending 7 hours or less (14.2%), 9 hours (25.5%), 10 hours
(13.2%), and 12 hours (1.5%). In addition, most of the participants (32%) are
spending 8 hours per day working with a computer screen. Those who spend 5
hours or less are 20.2%, 6 hours 17.7%, 7 hours 15.3%, 9 hours 13.3%, and 10
hours 1.5%. The other demographic information of the respondents is shown in
Table 1.
020000400006000080000
100000120000140000160000180000
12
:00
:00
AM
2:0
0:0
0 A
M
4:0
0:0
0 A
M
6:0
0:0
0 A
M
8:0
0:0
0 A
M
10
:00
:00
AM
12
:00
:00
PM
2:0
0:0
0 P
M
4:0
0:0
0 P
M
6:0
0:0
0 P
M
8:0
0:0
0 P
M
10
:00
:00
PM
kWh
1/8/2017
1/9/2017
1/10/2017
1/11/2017
1/12/2017
1/13/2017
1/14/2017

14
Table 1: Demographic information of the respondents
Age
Change behaviour
because of building
conditions
This building is the
normal base
Gender of
respondents
Setting near a window
Period of working in
the building
Work area/group
occupancy
As stated before, the 6th floor of the Chancellery building was chosen to present
some of the finding of this study. In this floor, the total number of respondents
was 41. The results of thermal comfort of the floor are shown in Table 2. The
benchmarking results indicate how good or bad the conditions in the Chancellery
building are compared with other buildings benchmarked by the BUS
methodology. For instance, temperature range is not good as it is colder than
the benchmark (red colour). While other colour represents no difference from
the benchmark (amber colour) or green (better than the benchmark). Other
results that are not shown here include the overall conditions of the building,
cleaning, control over cooling and heating, control over noise, control over
ventilation, building design and others. However, the full results of the building
conditions with the benchmarking assessment based on BUS methodology can
be found in the Appendix.

15
Table 2: Thermal comfort results with benchmarking of the BUS methodology
Variables Mean
Std.
Error of
Mean
Std.
Dev.
Vari-
ance
Benchmarking
Results
Temperature
overall 4.58 1.154 0.187 1.331
Green (above the
benchmark -
comfortable)
Temperature
range (hot-
cold)
4.92 0.166 1.010 1.021 Red (above the
benchmark - cold)
Temperature
stability 4.69 0.188 1.173 1.377
Red (above the
benchmark - unstable)
Air
movement 4.19 0.139 0.845 0.713
Green (above the
benchmark - draughty)
Air humidity 4.21 0.126 0.777 0.603 Red (above the
benchmark - humid)
Air freshness 4.24 0.157 0.955 0.911 Red (above the
benchmark - stuffy)
Air smell 3.89 0.184 1.134 1.286 Amber (no difference
with the benchmark)
Air overall 4.63 0.174 1.102 1.215
Green (above the
benchmark –
satisfactory)
Comfort:
overall 4.83 0.133 0.844 0.712
Amber (no difference
with the benchmark)
Perceived
health 4.54 0.172 1.072 1.150
Green (above the
benchmark - more
healthy)
Perceived
productivity
6.72
(17.2%
)
0.270 1.685 2.839 Green (above the
benchmark - increased)
Artificial light 4.25 0.163 1.032 1.064 Amber (no difference
with the benchmark)
Glare from
lights 4.08 0.184 1.163 1.353
Red (above the
benchmark - too much)
Natural light 4.10 0.185 1.172 1.374 Amber (no difference
with the benchmark)
Glare from
sun and sky 4.18 0.208 1.318 1.738
Red (above the
benchmark - too much)
Overall
lighting 4.53 0.193 1.219 1.487
Amber (no difference
with the benchmark)

16
Influence of Building Conditions on Productivity and Health
To provide more thorough results of the building conditions, the researchers
studied the influence of thermal comfort on productivity and health. As shown
in Table 3, the influence of overall comfort of the building on productivity is
about 60%. However, the significant F change of the model was not supported
at significant level (7.8% probability level). On the other hand, the influence of
thermal comfort on health was more significant compared with productivity. The
combination of air movement and overall lighting contribute to 75% of health
variance in the 6th floor. Based on the results of the benchmarking in Table 2,
both air movement and lighting overall have green and amber benchmarking
results, which shows the positive impact of good conditions on the health of the
staff.
Table 3: Results of hierarchical multiple regression analysis of the 6th floor
Depen-
dent
Variabl
es
Indepen-
dent
Variables
Beta Sig. VIF Adj.
R2
R2
Cha
nge
F
Cha
nge
Sig.
F
Cha
nge
Dur
bin-
Wa
tson
Produc
tivity
Sitting
next to a window (control)
0.560 0.007 1.747 0.379 0.598 2.121 0.078 2.394
Health
Air move-ment
0.497 0.040 1.68
0.685 0.751 5.239 0.001 1.771 Lighting
overall 0.709 0.003 1.64
Reducing Energy and Enhancing Indoor Environmental Quality
As observed through indoor environmental monitoring of this building, it is found
that the conditioned air within the building is damp. The BUS survey findings
revealed dissatisfaction among the staff about the indoor temperature and
humidity level. The recorded relative humidity range of 60%-80% has to be
rectified to ensure good levels of health and productivity of the occupants.
Aggravating this situation further, both central a/c and VRV systems which serve
the entire building are fed with moist external air and equally humid returned air
from the central a/c ducts limiting the ability of the a/c systems in reducing the
high RH levels. This inefficiency is also contributed by the consistently low indoor
temperatures as recorded during the monitoring period especially in the
mornings before the office operational hours except for Level 9. Although not
entirely sealed, the building envelope retained the cool indoor air for significant
time.

17
Despite this positive situation, the central a/c system is set at the regulated 24°C
driving the internal temperature down and creating thermal discomfort among
the occupants. This running temperature is set by the building technicians and
the occupants do not have any control on the central a/c setting. Compounding
this situation is the intricate distribution of conditioned air by central a/c and by
the VRV system to partitioned rooms. Normally, only a single system is utilized
and conditioned air is allowed to disperse throughout each floor. However, this
building has two a/c systems with the ducted VRV system installed for rooms for
afterhours office work. Although the central a/c is similarly sized throughout the
building, the internal cooling load differs from floor to floor due to difference in
number of occupants and varying presence of partitioning and varying coverage
of conditioned air by the VRV system. Yet, the temperature setting is still the
same.
Due to restrictions posed onto the research to not make any intervention on
the façade of the building, the researchers devised a less invasive plan to reduce
the internal cooling load, reduce the electricity consumption to achieve a lower
carbon emission plus improve the thermal comfort of the occupants. Firstly, the
researcher identified level 7 of the Chancellery as a suitable location for interior
architectural interventions. Specifically, part of the Registrar’s Office, the UM
Legal Unit, and the QMEC Meeting Room are zoned together for an intervention
due to negative responses in the BUS survey and poor indoor environmental
recording. These offices also have smaller open plan areas and are physically
segregated from the rest of the floor, clearly demarcating the central a/c AHU
distribution zone.
Secondly, the internal side of curtain wall glazing at the selected area will be
coated with Kristalbond to cut up to 90% of the infrared ray from daylighting
that will reduce the internal cooling load. In addition, an internal sunshading
screen with light shelves is designed and tested on IES-VE will be installed behind
the same curtain wall glazing to bring as much daylight as possible to back of the
selected area as possible while allowing the end-users to adjust the level of
daylight at desk level using installed blinds. The occupants can then switch on or
off the existing T5 artificial lights (which are energy-efficient) as required for
ample illumination.
The researchers are also not permitted to alter the distribution of a/c diffusers
and existing artificial lighting points. Nevertheless, the temperature setting of the
AHU at this selected location will be increased according to ongoing IES-VE
simulation (with lowered internal cooling load). Furthermore, the fresh air supply
from the outside to the identified AHU will be restricted with a set of louvers
controlled by timer to only be opened between 1100 and 1500. This is when the
18
external relative humidity levels are low due to high external temperatures. The
louvers will shut at other times and the AHU will only chill the returned air from
the return duct. This will reduce the energy needed to chill the air with existing
low temperatures and to dehumidify the returned air. In essence, the conditioned
air will be dryer than but not as cold as previously recorded and this will hopefully
yield less health problems among the occupants and higher productivity.
As for electricity consumption, the researchers at this juncture decided to only
implement a reduction in the central a/c operating hours to only between 0900
and 1600. The existing operational hours are between 0730 and 1730 but the
monitored indoor temperatures were still below 24°C up to 1000 in the
mornings. In the evenings, recorded indoor temperatures remained below 24°C
until 1900. Therefore, a timer will be installed at the main a/c switchboard to
control the operating hours accordingly as opposed to current practice of
control by building technicians. Regular operating hours will yield consistent
electricity consumptions.
It is estimated that the reduction of 3 hours in the operating hours will result in
15,829 kWh of electricity consumption reduction due to a weekly savings of
approximately 13.5% (Table 4). When calculated against the whole building
electricity consumption, a total of 18,712 kgCO2 Eq of carbon emissions can be
saved. It is estimated that the January 2017 electricity use is 155,569 kWh with
the new central a/c operating hours. According to the monthly electricity use
reports, the average total use of electricity for the Chancellery from January
2017 to March 2017 was 190,945 kWh, thus the projected yearly consumption
is approximately 2,291,340 kWh/year and the gross floor area is 19,257.7 m2.
The resulting BEI for this building is estimated at 118.98 kWh/m2/year. As a
result, the 3 hour operating time reduction reduces the BEI to 96.94
kWh/m2/year. This BEI estimation is relatively low as compared to the Diamond
Building in Putrajaya, which is 56 kWh/m2/year, as observed on Tuesday 18 April
2017 and against typical office buildings estimated at 210 kWh/m2/year. As a start,
this measure will not improve the thermal comfort of occupants who complained
that the indoor temperatures were too cold but it will definitely reduce
electricity consumption and reduce the humidity in the conditioned air. Further
electricity use can be reduced by increasing the operating temperature of the
central a/c to 26°C. This is plausible but will be determined with detailed
estimations and simulation of indoor temperatures.

19
Table 4: Monitored central air-conditioning system electricity use at main
switchboard 1/8/17 – 1/14/17 and suggested change to operating hours
Electricity use for
operating hours (kWh) Electricity
savings
(kWh)
Savings
percent
age (%)
Carbon
reduction
(kgCO2
Eq)
0730-
1730
0900-
1600
Mon 1/8/2017 52,609 42,490 10,119 19.2 7799
Tue 1/9/2017 58,674 47,409 11,265 19.2 8682
Wed 1/10/2017 57,897 47,026 10,871 18.8 8378
Thu 1/11/2017 55,222 44,459 10,763 19.5 8295
Fri 1/12/2017 49,925 40,977 8,948 17.9 6896
Sat 1/13/2017 334 334 0 0 0
Sun 1/14/2017 380 380 0 0 0
Weekly average 39,292 31,868 7,424 13.5 5721
Monthly average
(monitored) 117,251 101,422
Note: 1 kWH = 0.7707 kgCO2 Eq
Conclusion
Based on findings from this research, the researchers are confident that less
invasive measures at relatively low cost can be used to reduce the carbon
emission of existing office buildings such as the UM Chancellery. However, there
is a need to simulate the suggested recommendations using IES-VE to ensure the
thermal comfort will not be affected. Through this research as well, the
researchers are able to establish a methodology to analyse an existing building in
terms of its electricity use for cooling, indoor environmental condition, and
occupant perception in order to improve the thermal comfort while achieving
high electricity use savings. This methodology can be refined further and can be
replicated onto other case studies. Overall for this particular case study, the
proposed interventions will help to improve the thermal comfort while
improving the internal daylighting levels and occupants’ interaction with the
building to enhance health and spur productivity.
Acknowledgement
This research was supported by UM Living Lab Grant Programme - Sustainability
Science (project no. LL017-16SUS). The authors thank top management and staff
of UM Chancellery and JPPHB for their collaboration during data collection. In

20
addition, the authors thank Prof. Adrian Leaman for providing the license to use
the BUS survey.
References
Al-Obaidi, K. M. (2015). Innovative roofing system for solar heat reduction under
Malaysian sky conditions. Universiti Sains Malaysia.
Al-Tamimi, N. A. M. and Syed Fadzil, S. F. (2011), "Thermal performance analysis
for ventilated and unventilated glazed rooms in Malaysia (comparing
simulated and field data)", Indoor and Built Environment, Vol. 20 No. 5, pp.
534-542.
Arngrïmsson, S. Á., Petitt, D. S., Stueck, M. G., Jorgensen, D. K. and Cureton, K.
J. (2004), "Cooling vest worn during active warm-up improves 5-km run
performance in the heat", Journal of Applied Physiology, Vol. 96 No. 5, pp.
1867-1874.
Aziz, A. A. A. and Adnan, Y. M. (2008). Incorporation of innovative passive
architectural features in office building design towards achieving operational cost
saving-the move to enhance sustainable development. Paper presented at the
Pacific Rim Real Estate Society (PRRES) Conference, Kuala Lumpur,
Malaysia.
Bansal, V., Misra, R., Agrawal, G. D. and Mathur, J. (2009), "Performance analysis
of earth–pipe–air heat exchanger for winter heating", Energy and Buildings,
Vol. 41 No. 11, pp. 1151-1154.
Bates, G. P. and Schneider, J. (2008), "Hydration status and physiological
workload of UAE construction workers: A prospective longitudinal
observational study", Journal of occupational medicine and toxicology, Vol. 3
No. 1, pp. 21.
Bridger, R. (2008), Introduction to ergonomics, Crc Press.
BSEEP. (2013). Building energy efficiency technical guideline for passive design.
Malaysia.
Building Use Studies. (2011). The Building Use Studies (BUS) occupant survey:
Origins and approach Q&A. In Building Use Studies (Ed.). United
Kingdom.
BUS Methodology. (2017). Occupant Satisfaction Evaluation. Retrieved 13 April
2017, from http://www.busmethodology.org.uk/
Butti, K. and Perlin, J. (1980), A golden thread: 2500 years of solar architecture and
technology, Cheshire books.
Chan, A. S. (2004), "Energy efficiency: designing low energy buildings using energy
10". Paper presented at the CPD Seminar.
Dutta, P. and Chorsiya, V. (2013), "Scenario of climate change and human health
in India", International Journal of Innovative Research and Development, Vol.
2 No. 8, pp.
Fanger, P. O. (1970), Thermal comfort. Analysis and applications in environmental
engineering, Copenhagen, Denmark, DANISH TECHNICAL PRESS.

21
Fisk, W. J., Black, D. and Brunner, G. (2011), "Benefits and costs of improved
IEQ in US offices", Indoor Air, Vol. 21 No. 5, pp. 357-367.
Forsthoff, A., Mehnert, P. and Neffgen, H. (2001), "Comparison of laboratory
studies with predictions of the required sweat rate index (ISO 7933) for
climates with moderate to high thermal radiation", Applied ergonomics, Vol.
32 No. 3, pp. 299-303.
GBI. (2013). Green Building Index. Retrieved 10th January 2017, from
http://new.greenbuildingindex.org/
Gelman, A. and Hill, J. (2006), Data analysis using regression and
multilevel/hierarchical models, Cambridge University Press.
Givoni, B. (1969), "Man, climate and architecture", Elsevier, No., pp.
González‐Alonso, J., Crandall, C. G. and Johnson, J. M. (2008), "The
cardiovascular challenge of exercising in the heat", The Journal of physiology,
Vol. 586 No. 1, pp. 45-53.
Gou, Z., Prasad, D. and Siu-Yu Lau, S. (2013), "Are green buildings more
satisfactory and comfortable?", Habitat International, Vol. 39 No. 0, pp.
156-161. doi: 10.1016/j.habitatint.2012.12.007
Hamza, N., Cook, M. and Cropper, P. (2011), "Comparative Analysis of Natural
Ventilation Performance in Non-Unifrom Double Skin Facades in
Temperate Climates". Paper presented at the Proceedings of Building
Simulation.
Hayashi, C. and Tokura, H. (2001), "Effects of head cooling on sweat rate in
exercising subjects wearing protective clothing and mask for pesticide",
Applied Human Science, Vol. 15 No. 4, pp. 149-154.
Hirunlabh, J., Kongduang, W., Namprakai, P. and Khedari, J. (1999), "Study of
natural ventilation of houses by a metallic solar wall under tropical
climate", Renewable Energy, Vol. 18 No. 1, pp. 109-119.
Huat, N. B. and Akasah, Z. A. (2011), "An overview of Malaysia green technology
corporation office building: A showcase energy-efficient building project
in Malaysia", Journal of sustainable development, Vol. 4 No. 5, pp. 212.
Humphreys, M. A. (2005), "Quantifying occupant comfort: Are combined indices
of the indoor environment practicable?", Building Research & Information,
Vol. 33 No. 4, pp. 317-325.
Hyde, R. (2013), Climate responsive design: A study of buildings in moderate and hot
humid climates, Taylor & Francis.
Khedari, J., Boonsri, B. and Hirunlabh, J. (2000), "Ventilation impact of a solar
chimney on indoor temperature fluctuation and air change in a school
building", Energy and Buildings, Vol. 32 No. 1, pp. 89-93.
Kjellstrom, T., Holmer, I. and Lemke, B. (2009), "Workplace heat stress, health
and productivity–an increasing challenge for low and middle-income
countries during climate change", Global Health Action, Vol. 2 No. 1, pp.
2047.
Kjellstrom, T., Lemke, B. and Matthias, O. (2013), "Mapping occupational heat
exposure and effects in South-East Asia: ongoing time trends 1980–2011
and future estimates to 2050", Industrial health, Vol. 51 No. 1, pp. 56-67.

22
Kofoworola, O. F. and Gheewala, S. H. (2009), "Life cycle energy assessment of
a typical office building in Thailand", Energy and Buildings, Vol. 41 No. 10,
pp. 1076-1083.
Lan, L. and Lian, Z. (2009), "Use of neurobehavioral tests to evaluate the effects
of indoor environment quality on productivity", Building and Environment,
Vol. 44 No. 11, pp. 2208-2217.
Lim, Y.-W. and Ahmad, M. H. (2015), "The effects of direct sunlight on light shelf
performance under tropical sky", Indoor and Built Environment, Vol. 24 No.
6, pp. 788-802.
Lim, Y.-W. and Heng, C. (2016), "Dynamic internal light shelf for tropical
daylighting in high-rise office buildings", Building and Environment, Vol. 106
No., pp. 155-166.
Mitchell, D., Senay, L., Wyndham, C., Van Rensburg, A., Rogers, G. and Strydom,
N. (1976), "Acclimatization in a hot, humid environment: energy
exchange, body temperature, and sweating", Journal of Applied Physiology,
Vol. 40 No. 5, pp. 768-778.
Mofidi, F. and Akbari, H. (2017), "Personalized Energy Costs and Productivity
Optimization in Offices", Energy and Buildings, Vol. 143 No., pp. 173–190.
Moosavi, L., Mahyuddin, N., Ab Ghafar, N. and Ismail, M. A. (2014), "Thermal
performance of atria: An overview of natural ventilation effective designs",
Renewable and Sustainable Energy Reviews, Vol. 34 No., pp. 654-670.
Musa, M. a. (2009). Novel evaporative cooling systems for building applications.
University of Nottingham.
Ozel, M. (2011), "Thermal performance and optimum insulation thickness of
building walls with different structure materials", Applied Thermal
Engineering, Vol. 31 No. 17, pp. 3854-3863.
Petrocelli, J. V. (2003), "Hierarchical multiple regression in counseling research:
Common problems and possible remedies", Measurement and evaluation
in counseling and development, Vol. 36 No. 1, pp. 9-22.
Seppänen, O. A. and Fisk, W. (2006), "Some quantitative relations between
indoor environmental quality and work performance or health", Hvac&R
Research, Vol. 12 No. 4, pp. 957-973.
Tittelein, P., Achard, G. and Wurtz, E. (2009), "Modelling earth-to-air heat
exchanger behaviour with the convolutive response factors method",
Applied Energy, Vol. 86 No. 9, pp. 1683-1691.
Torcellini, P., Pless, S., Deru, M. and Crawley, D. (2006, August 14−18, 2006 ),
"Zero energy buildings: A critical look at the definition". Paper presented
at the ACEEE Summer Study on Energy Efficiency in Buildings, Pacific
Grove, California
Wesseling, C., Crowe, J., Hogstedt, C., Jakobsson, K., Lucas, R. and Wegman, D.
H. (2014), "Resolving the enigma of the mesoamerican nephropathy: a
research workshop summary", American Journal of Kidney Diseases, Vol. 63
No. 3, pp. 396-404.
Wilkinson, S. J. and Reed, R. G. (2006), "Office building characteristics and the
links with carbon emissions", Structural survey, Vol. 24 No. 3, pp. 240-251.

23
Wyon, D. (1997). Indoor environmental effects on productivity (pp. 1–15).
ASHRAE J.1.
Zhang, J. and Haghighat, F. (2005), "Simulation of earth-to-air heat exchangers in
hybrid ventilation systems". Paper presented at the Ninth International
IBPSA Conference, Building Simulation 2005, Montreal, Canada.
Zhang, Y., Lin, K., Zhang, Q. and Di, H. (2006), "Ideal thermophysical properties
for free-cooling (or heating) buildings with constant thermal physical
property material", Energy and Buildings, Vol. 38 No. 10, pp. 1164-1170.

24
Appendix: Basic data for benchmarked variables of the whole Chancellery
building
Variables Score Result1 Result
(cautious)2
Air : Dry / Humid 4.13 Amber Red
Air : Fresh / Stuffy 4.11 Amber Amber
Air : Odourless / Smelly 3.90 Amber Amber
Air : Overall 4.75 Green Green
Air : Still / Draughty 4.06 Green Green
Cleaning 5.13 Amber Amber
Control Over Cooling 3.76 Amber Amber
Control Over Heating 3.71 Amber Amber
Control Over Lighting 4.40 Green Green
Control Over Noise 3.91 Amber Amber
Control Over Ventilation 3.71 Amber Amber
Comfort: Overall 4.86 Amber Amber
Design 4.74 Amber Amber
Effectiveness Of Response To
Requests For Changes 4.56 Green Green
Furniture 4.88 Amber Amber
Health (Perceived) 4.68 Green Green
Image To Visitors 4.98 Amber Amber
Lighting: Artificial Light 4.36 Red Red
Lighting: Glare From Lights 4.21 Red Red
Lighting: Natural Light 4.37 Red Red
Lighting: Glare From Sun And Sky 3.99 Amber Amber
Lighting: Overall 4.78 Amber Amber
Meeting Rooms: Overall 5.06 Amber Amber
Needs 4.87 Amber Amber
Noise: Noise From Colleagues 4.70 Red Red
Noise: Other Noise From Inside 3.90 Green Green
Noise: Unwanted Interruptions 3.71 Amber Amber
Noise: Noise From Outside 3.72 Amber Amber
Noise: Overall 4.70 Green Green
Noise: Noise From Other People 3.98 Green Green
Productivity (Perceived) 15.54 Green Green
Personal Safety In Building And Its
Vicinity 4.75 Amber Amber
Space In The Building 4.81 Amber Amber
Space At Desk 4.75 Red Red
Speed Of Response To Requests For
Changes 4.55 Green Green
Storage Space: Overall 4.55 Green Green
25
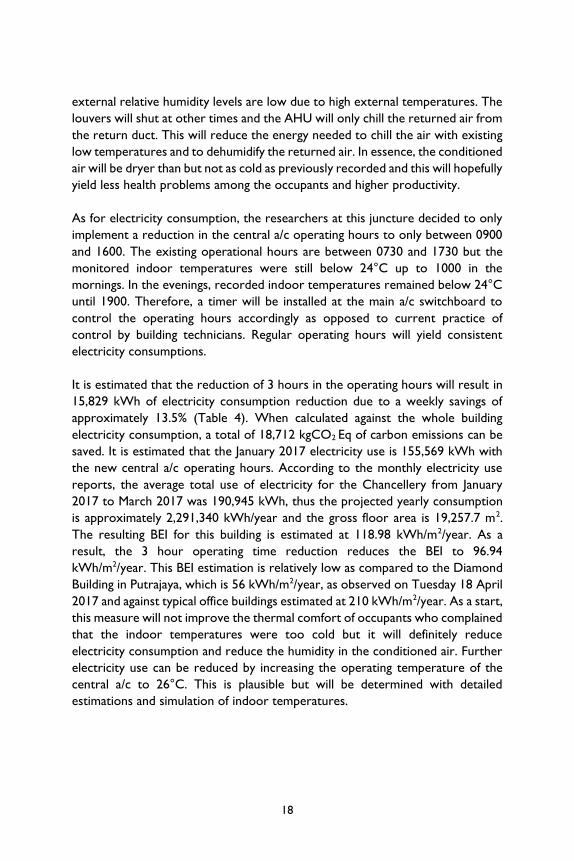
Temperature: Hot / Cold 4.83 Red Red
Temperature: Overall 4.75 Green Green
Temperature: Stable / Varies 4.50 Red Red
Do Facilities Meet Needs? 4.96 Amber Amber 1 Standard test uses standard error of benchmark for scale midpoint critical
region. 2 More cautious test uses standard error of study building mean for scale
midpoint critical region. Use with small samples.

26
2
Carbon Abatement Module for University of Malaya Eco-
Campus: Addressing Urban Heat Island and Climatic
Change Impact Suzaini Mohamed Zaid1, 2,*, Nurshuhada Zainon1, Nik Elyna Myeda1, Hazreena
Hussein1,2, Eeswari Perisamy1,
1Faculty of Built Environment, University of Malaya, 50603 Kuala Lumpur,
Malaysia 2Centre for Building, Construction & Tropical (BuCTA), Faculty of Built
Environment, University of Malaya, 50603 Kuala Lumpur, Malaysia
*Corresponding author: [email protected]
Abstract
This research proposed a module to reduce University of Malaya’s climate
change and urban heat island (UHI) impact by integration of solar photovoltaic
(PV) systems and Vertical Greenery System (VGS). In recent years, the PV system
and VGS are separately recognised as a tool for sustainable development in urban
areas. It is expected yearly average of renewable energy produced by two units
of PV panels is 360 kWh respectively, with an average of 325.22 kgCO2e of
carbon dioxide emission that can be avoided each year by integrating PV panels
and VGS. This could also save the building potentially RM 691.06 yearly on the
electricity bills, with the clean renewable energy generated by the PV panels.
Thus the concept is to simultaneously generate clean renewable energy by
converting untapped solar energy into electricity and reduce micro-climatic
temperature of the campus with carbon sequestration potential of VGS.
Keywords: Carbon sequestration, carbon abatement, vertical greenery systems,
energy saving, temperature, solar photovoltaic, eco-campus, living lab.
27
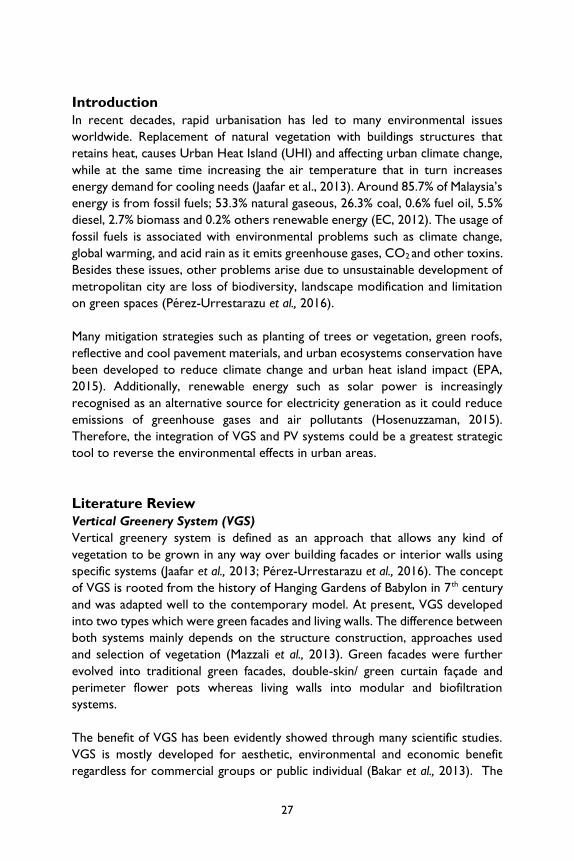
Introduction
In recent decades, rapid urbanisation has led to many environmental issues
worldwide. Replacement of natural vegetation with buildings structures that
retains heat, causes Urban Heat Island (UHI) and affecting urban climate change,
while at the same time increasing the air temperature that in turn increases
energy demand for cooling needs (Jaafar et al., 2013). Around 85.7% of Malaysia’s
energy is from fossil fuels; 53.3% natural gaseous, 26.3% coal, 0.6% fuel oil, 5.5%
diesel, 2.7% biomass and 0.2% others renewable energy (EC, 2012). The usage of
fossil fuels is associated with environmental problems such as climate change,
global warming, and acid rain as it emits greenhouse gases, CO2 and other toxins.
Besides these issues, other problems arise due to unsustainable development of
metropolitan city are loss of biodiversity, landscape modification and limitation
on green spaces (Pérez-Urrestarazu et al., 2016).
Many mitigation strategies such as planting of trees or vegetation, green roofs,
reflective and cool pavement materials, and urban ecosystems conservation have
been developed to reduce climate change and urban heat island impact (EPA,
2015). Additionally, renewable energy such as solar power is increasingly
recognised as an alternative source for electricity generation as it could reduce
emissions of greenhouse gases and air pollutants (Hosenuzzaman, 2015).
Therefore, the integration of VGS and PV systems could be a greatest strategic
tool to reverse the environmental effects in urban areas.
Literature Review
Vertical Greenery System (VGS)
Vertical greenery system is defined as an approach that allows any kind of
vegetation to be grown in any way over building facades or interior walls using
specific systems (Jaafar et al., 2013; Pérez-Urrestarazu et al., 2016). The concept
of VGS is rooted from the history of Hanging Gardens of Babylon in 7th century
and was adapted well to the contemporary model. At present, VGS developed
into two types which were green facades and living walls. The difference between
both systems mainly depends on the structure construction, approaches used
and selection of vegetation (Mazzali et al., 2013). Green facades were further
evolved into traditional green facades, double-skin/ green curtain façade and
perimeter flower pots whereas living walls into modular and biofiltration
systems.
The benefit of VGS has been evidently showed through many scientific studies.
VGS is mostly developed for aesthetic, environmental and economic benefit
regardless for commercial groups or public individual (Bakar et al., 2013). The

28
foremost benefit of VGS based on last five years studies are thermal reduction,
shading and cooling effects, energy efficiency and saving electricity cost (Coma et
al., 2017; Cuce, 2016; Schettini et al., 2016; Pan et al., 2016; Pérez et al., 2016;
Victorero et al., 2015; Haggag et al., 2014; Liang et al., 2014; Cameron et al., 2015;
Jaafar et al., 2013; Mazzali et al., 2013). Apart of that, VGS acts as acoustic
insulation, air filtration, carbon sequestration, biodiversity preservation and
increasing property values (Azkorra et al., 2016; Ottelé et al., 2010; Cameron et
al., 2014; Madre et al., 2015; Perini and Rosasco, 2016).
Solar Photovoltaic (PV) System
PV system is a rapidly developing and demanding technology which used to
convert renewable solar energy into power electricity. It works when the
sunlight strike and ionize the semiconductor material on the grid of PV cells,
breaks the atomic bonds of outer electrons and creating a flow of electrical
current. The PV cells has been introduced in the late 1950s and developed into
a system in 1970s. In 1980s PV started to use in small electronic devices such as
watches, calculators, radios and now growing in large commercial industries
mainly in homes and buildings (Florida Solar Energy Center, 2017).
PV systems play vital role in energy efficiency of buildings by reducing their grid
dependence and consequently to achieve net zero-energy buildings. Many studies
have showed that PV module reduced energy performance and energy demand
which further resulting in the reduction of air pollutant and greenhouse gaseous
(GHG) mainly CO2 (Sadineni et al., 2012; Sherwani et al., 2010). Study shows that
PV systems could reduce GHG emissions from the conventional energy sources
of fossil fuels at a minimum of 1423 tons and up to 10732 tons annually (Mondal
& Islam, 2017; Harder & Gibson, 2011). This in turn, holistically, helps to reduce
the climate changes contributed by GHG emissions.
Methodology
Experimental Design
This study was conducted in a public educational institute in a hot tropical climate
metropolitan area located in Kuala Lumpur, Malaysia. As shown in Figure 1, a
maximum solar irradiation exposure parking area in Faculty of Built Environment
(FBE), University of Malaya was chosen for the experimental study. The car park
prototype which consists of four parking lots was developed and integrated with
living green walls in collaboration with other living lab project LL019-16SUS: The
design and investigation of a novel ecological air cleaning and cooling system using
the concept of a living green wall. The designs of the prototype are as shown in
Figure 2, which indicates the cross section, perspective and elevation drawings
(not to scale). Epipremnum aureum (Money plant) was used for living walls as it is

29
easy to be grown on the water. The prototype was further provided with
electrical cable and associated devices such as power outlet, light control sensor
and LED tube lights.
Figure 1: Study site at Faculty of Built Environment, University of Malaya, Kuala
Lumpur, Malaysia.
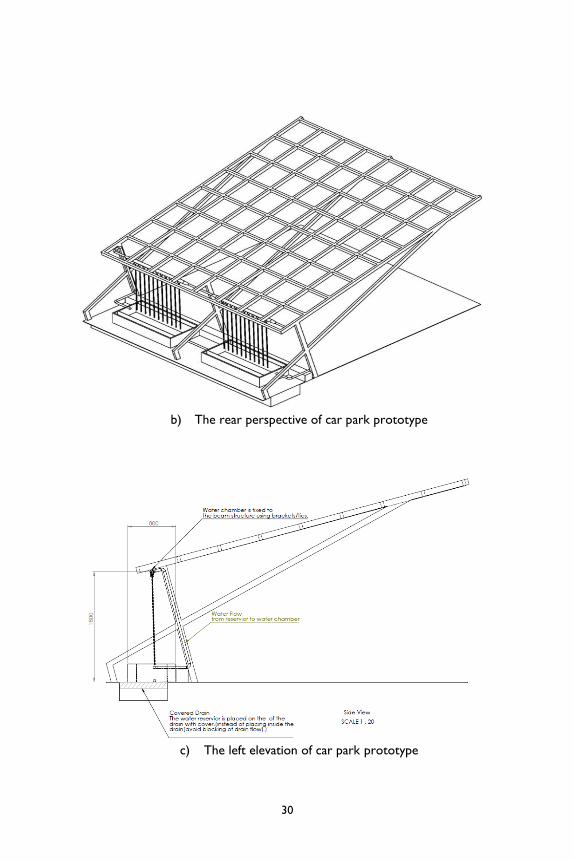
a) Cross Section A-A of the Car Park Prototype
30
b) The rear perspective of car park prototype
c) The left elevation of car park prototype

31
d) The front elevation of car park prototype
e) The rear and right elevation of the green wall
Figure 2a-e: The Design of living green wall with car park prototype
PV Module Installation
Two units of PV panels with dimension of 1.57m x 9.4m were installed onto car
park roof. The PV module consists of polycrystalline silicon PV panels, PV
inverter, solar charger and 24-volt battery. The installation was contracted to
Global Insignia Sdn Bhd, the private wing of UMPEDAC. The PV module is
expected to produce 250 Watts of electricity per hour with average daily solar
irradiation of 4 hours and 1 kWh electricity capacity per daily.
Vertical Plants Installation
Two different types of climbers which are Passiflora Edulis (Passionfruit) and
Thunbergia laurifolia (Laurel clock vine) were used as vertical plants. Both were
cultivated and acquired from Free Tree Society and RIMBA Ilmu respectively.
These evergreen vines are hardy, fast growing and suitable to be planted in full

32
sun area (National Parks, 2013). The climbing plants were planted in a depth of
1.5 feet of concrete planter boxes, mixed with peat soil and irrigated regularly.
Wire mesh and independent wires were mounted on the car park frame as
shown in Figure 3 to act as a support for the climber plants.
Left: The front
view of vertical
plants
Right: The side
view of vertical
plants
Figure 3: The vertical plants with supporting system
Measurement of Carbon sequestration, Temperature and Humidity
The carbon dioxide, temperature and relative humidity were measured using
wireless HD35 loggers’ sensors from Delta OHM. The baseline data was
collected within 1 week before VGS installation and it was continuously
measured in real time series with 15 minutes of interval per data. The data will
be continuously collected after VGS installation for the comparison.
Evaluation of Carbon Abatement and Electricity Bill
The carbon abatement will be evaluated through the average monthly energy
produced per panel by using formulae as below:
Abatement of Carbon Emissions (kgCO2e) =Energy (kWh) 𝑥 0.326047 kgCO2e/kWh,
*0.326047 is the co-factor for carbon emission for Malaysia (UNEP-SBCI, 2010).
The electricity bill saving will be calculated as follows:
𝐸𝑙𝑒𝑐𝑡𝑟𝑖𝑐𝑖𝑡𝑦 𝑏𝑖𝑙𝑙 𝑠𝑎𝑣𝑖𝑛𝑔 (𝑅𝑀) = Energy (kWh) 𝑥 𝑅𝑀 0.9598/𝑘𝑊ℎ,
As Energy is the average monthly energy produced by PV panels, 0.9598 is the
Feed-in Tariff (FiT) rate for basic rate and bonus installation in building or
structure (Sustainable Energy Development Authority (SEDA).
33
Conversion of Parts Per Million (ppm) to mass unit (mg/kg)
The CO2 measurement in parts per million-ppm is the mass ratio between
component and the solution, in this case CO2 in the Atmosphere.
ppm = 1000000 mc/ms
= 106 mc/ms
where
mc = mass of component (kg, lbm)
ms = mass of solution (kg, lbm)
In the metric system, ppm can be express in milligram/gram or in mass per unit
volume, where:
1 ppm = 1 mg/kg
1 ppm = 1.233 kg/acre-foot
1 ppm = 0.001 kg/m3
1 kg/m3 = 1000 ppm
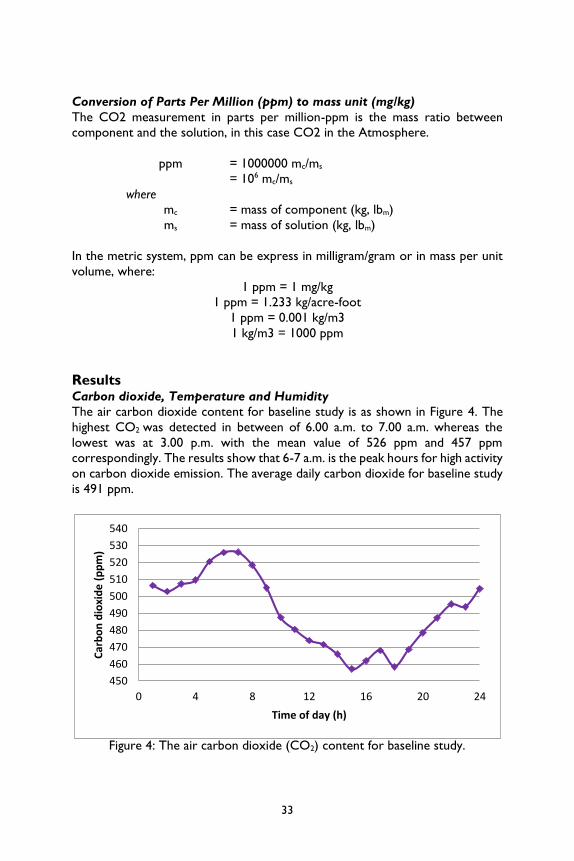
Results Carbon dioxide, Temperature and Humidity
The air carbon dioxide content for baseline study is as shown in Figure 4. The
highest CO2 was detected in between of 6.00 a.m. to 7.00 a.m. whereas the
lowest was at 3.00 p.m. with the mean value of 526 ppm and 457 ppm
correspondingly. The results show that 6-7 a.m. is the peak hours for high activity
on carbon dioxide emission. The average daily carbon dioxide for baseline study
is 491 ppm.
Figure 4: The air carbon dioxide (CO2) content for baseline study.
450
460
470
480
490
500
510
520
530
540
0 4 8 12 16 20 24
Car
bo
n d
ioxi
de
(p
pm
)
Time of day (h)

34
As shown in Figure 5, a maximum of 33.3 °C of air temperature was observed
at 2.00 p.m. while a minimum of 25.7°C was observed in between 5 a.m. to 7.00
a.m. On the other hand, the highest dew point was in between 11 p.m. to 12.00
a.m. whereas the lowest was at around 1 p.m. to 4.00 p.m. with the average value
of 25.4°C and 23.3°C respectively. The finding shows that the daily average for
air temperature and dew point are 28.2°C and 24.5°C.
Figure 5: The air temperature and dew point for baseline study.
Highest air relative humidity before VGS installation was observed between 5
a.m. to 6.00 a.m. whereas the lowest was around 1 p.m. with the mean value of
97.7% and 57.8% correspondingly. The maximum and minimum absolute
humidity per area (m3) for the baseline study were 23.2g and 20.4g as shown in
Figure 6. The daily average for relative humidity is 82.5% and absolute humidity
is 22.2g/m3.
Figure 6: The air humidity for baseline study.
0.0
5.0
10.0
15.0
20.0
25.0
30.0
35.0
0 4 8 12 16 20 24
Tem
pe
ratu
re (
°C)
Time of day (h)
Air Temperature
Dew Point
0.0
20.0
40.0
60.0
80.0
100.0
120.0
0 4 8 12 16 20 24
Hu
mid
ity
Time of day (h)
Relative humidity (%)
Absolute humidity(g/m³)

35
Abatement of Carbon Emission and Electricity Bill
As shown in Table 1, the expected carbon emission abatement by using two units
of PV panels is 234.72 kgCO2e while through VGS is 90.5 kgCO2e which abates
a total of 325.22 kg of carbon emission yearly. Apart of that, the PV panels could
provide approximately 360 kWh and is expected to save electricity bill around
RM 691.06.
Table 1: The expected carbon emission abatement.
Measurement Baseline Expected Reduction/ Abatement
Carbon dioxide
(CO2)
Average daily
CO2
= 491 ppm
= 491 x 0.001
kg/m3
= 0.491 kg/m3 x
12 months
= 5.89 kg/ kg/m3
per year
Through VGS
= 1.81 kgCO2em2 per year x 50
m2
= 90.5 kgCO2e per year
Through PV system
= 30 kWh x
0.326047kgCO2e/kWh
= 9.78 kgCO2e per panel per
month
= 9.78 kgCO2e per panel per
month x 2 panels
= 19.56 kgCO2e per month x
12 months
= 234.72 kgCO2e per year
Table 2: The expected energy and electricity bill saving
Measurement Baseline Expected Reduction/ Abatement
Electricity
NA Potential Energy Produced:
250 Watts x 4 hours = 1kWh
daily
= 30 kWh average monthly
= 30 kWh x 12 months
= 360 kWh
Potential savings
= RM 0.9598/kWh x 30 kWh per
month x 2 panels
= RM 57.59 per month x 12
months
= RM 691.06 per year

36
Discussion The finding from baseline study showed that the peak hour of CO2 content in
the car parking site is in between 6 to 7 a.m. This shows that carbon emission is
high at morning compared than evening. From the high peak at early morning,
the CO2 contents rapidly reduced until 3 p.m. After 3 p.m., it’s slightly increased
until 5 p.m. After 6 p.m., CO2 gradually increased until midnight. The high CO2
contents before 7 a.m. and after 6 p.m. could not be possibly due to human’s
respiration as most of the building occupant’s working hours are from 8.00am to
5.00pm. This indicates that, there are other potential anthropogenic or
environmental factors that could contribute to high level of CO2 in that site.
Thus, further scientific investigation is required to identify the possible causes of
high CO2 reading during this particular time. The mechanism on identification
can be developed through putting CCTV or more sensors in the study site.
The daily average temperature for baseline is range from 25.7 °C to 33.3 °C
while the dew point is ranged from 23.3 °C to 25.4 °C. On the other hand, it
was found that the relative humidity varies between a minimum of 57.8% and a
maximum of 97.7%, with approximately 20.4 -23.2g of absolute humidity per area.
In order to fulfil the effectiveness of this study, the VGS required time to allow
fully grown. Based on literature review, it is expected that the temperature and
relative humidity will reduce with high coverage of VGS (Coma et al., 2017;
Schettini et al., 2016; Pérez et al., 2014).
Despite that, the expected yearly average of renewable energy produced by two
units of PV panels is 360 kWh respectively. It was expected that on an average
of 325.22 kgCO2e of carbon dioxide emission can be avoided each year by
integrating PV panels and VGS. Besides, an approximately of RM 691.06 could be
saved yearly for the electricity bills. The results are in consistent with the
environmental and economic benefits showed in previous studies (Sadineni et al.,
2012; Mondal & Islam, 2017).
Conclusion The study has showed that VGS and PV system could act simultaneously to
mitigate the climate change and UHI effects in urban areas. These two different
mechanisms of systems could serve as an effective single tool for sustainable
development particularly in developing country such as Malaysia.
Acknowledgement The authors would like to acknowledge Sustainability Science (SuSci) Research
Cluster, University of Malaya, Kuala Lumpur under Living Lab Grant (LL021-
16SUS) for financial support.

37
References Bakar, A., Izzah, N., Mansor, M., & Harun, N. Z. (2013). Approaching vertical
greenery as public art: a review on potentials in urban Malaysia. Journal of
Architecture and Environment, 12(1), 1-26.
Cameron, R. W., Taylor, J. E., & Emmett, M. R. (2014). What's ‘cool’ in the world
of green façades? How plant choice influences the cooling properties of
green walls. Building and Environment, 73, 198-207.
Cameron, R. W., Taylor, J., & Emmett, M. (2015). A Hedera green façade–energy
performance and saving under different maritime-temperate, winter
weather conditions. Building and Environment, 92, 111-121.
Coma, J., Pérez, G., de Gracia, A., Burés, S., Urrestarazu, M., & Cabeza, L. F.
(2017). Vertical greenery systems for energy savings in buildings: A
comparative study between green walls and green facades. Building and
Environment, 111, 228-237.
Cuce, E. (2016). Thermal regulation impact of green walls: An experimental and
numerical investigation. Applied Energy.
http://dx.doi.org/10.1016/j.apenergy.2016.09.079
EPA. (2015). Heat Island Effect. from United States Environmental Protection
Agency (EPA) http://www.epa.gov/heat-islands
Florida Solar Energy Center. (2017). History of photovoltaics. Retrieved 21
March, 2017, from
http://www.fsec.ucf.edu/en/consumer/solar_electricity/basics/history_of_
pv.htm
Haggag, M., Hassan, A., & Elmasry, S. (2014). Experimental study on reduced heat
gain through green facades in a high heat load climate. Energy and
Buildings, 82, 668-674.
Harder, E., & Gibson, J. M. (2011). The costs and benefits of large-scale solar
photovoltaic power production in Abu Dhabi, United Arab
Emirates. Renewable Energy, 36(2), 789-796.
Jaafar, B., Said, I., Reba, M. N. M., & Rasidi, M. H. (2013). Impact of vertical
greenery system on internal building corridors in the tropic. Procedia-
Social and Behavioral Sciences, 105, 558-568.
Liang, T. C., Hien, W. N., & Jusuf, S. K. (2014). Effects of vertical greenery on
mean radiant temperature in the tropical urban environment. Landscape
and Urban Planning, 127, 52-64.
Mazzali, U., Peron, F., Romagnoni, P., Pulselli, R. M., & Bastianoni, S. (2013).
Experimental investigation on the energy performance of living walls in a
temperate climate. Building and Environment, 64, 57-66.
Mondal, M. A. H., & Islam, A. S. (2011). Potential and viability of grid-connected
solar PV system in Bangladesh. Renewable energy, 36(6), 1869-1874.
National Parks. (2013). NParks Flora & Fauna Web Retrieved 13th March 2017,
from https://florafaunaweb.nparks.gov.sg/Home.aspx.
Pan, L., & Chu, L. M. (2016). Energy saving potential and life cycle environmental
impacts of a vertical greenery system in Hong Kong: A case study. Building
and Environment, 96, 293-300.
38
Pérez, G., Coma, J., Martorell, I., & Cabeza, L. F. (2014). Vertical Greenery
Systems (VGS) for energy saving in buildings: A review. Renewable and
Sustainable Energy Reviews, 39, 139-165.
Pérez-Urrestarazu, L., Fernández-Cañero, R., Franco-Salas, A., & Egea, G. (2016).
Vertical greening systems and sustainable cities. Journal of Urban
Technology, 22(4), 65-85.
Sadineni, S. B., Atallah, F., & Boehm, R. F. (2012). Impact of roof integrated PV
orientation on the residential electricity peak demand. Applied Energy, 92,
204-210.
Schettini, E., Blanco, I., Campiotti, C. A., Bibbiani, C., Fantozzi, F., & Vox, G.
(2016). Green control of microclimate in buildings. Agriculture and
Agricultural Science Procedia, 8, 576-582.
Sherwani, A. F., & Usmani, J. A. (2010). Life cycle assessment of solar PV based
electricity generation systems: A review. Renewable and Sustainable Energy
Reviews, 14(1), 540-544.
UNEP-SBCI. (2010). Common Carbon Metric: Protocol for Measuring Energy
Use and Reporting Greenhouse Gas Emissions from Building Operations
Draft for Pilot Testing (Phase II): United Nations Environment Programme-
Sustainable Buildings & Climate Initiative (UNEPSBCI); World Resource
Institute (WRI).
Victorero, F., Vera, S., Bustamante, W., Tori, F., Bonilla, C., Gironás, J., & Rojas,
V. (2015). Experimental study of the thermal performance of living walls
under semiarid climatic conditions. Energy Procedia, 78, 3416-3421.

39
3
Issues and Challenges in Organizing an Effective
Campus Energy Saving Culture Zul Ilham1,*, Adi Ainurzaman Jamaludin1, Nurul Emy Idayu Zulkifli1, Muhammad
Faizal Kamar2, Fathiah Mohamed Zuki3 and Rohana Jani4
1 Environmental Science and Management Program, Institute of Biological
Sciences, Faculty of Science, University of Malaya 50603 Kuala Lumpur, Malaysia 2Za’ba Residential College, University of Malaya 50603 Kuala Lumpur
3 Department of Chemical Engineering, Faculty of Engineering, University of
Malaya 50603 Kuala Lumpur 4Department of Applied Statistics, Faculty of Economics and Administration,
University of Malaya 50603 Kuala Lumpur
* Corresponding author: [email protected]
Abstract The impact of energy consumption and carbon emission in Malaysia poses a grave
challenge. This challenge is particularly high amongst students of University of
Malaya’s (UM) residential colleges, where usage of electricity and carbon
emission remain invisible. In student residential colleges, personal choices and
social influences affect electricity consumption and ultimately resulting to
increase in carbon emissions. Therefore, innovative solutions are required to
change students’ energy consumption behaviour and one promising part of the
solution is to inculcate energy saving culture via informative and also interactive
platform, while, at the same time, appointing an energy saving team (utilising
existing UMCares Clubs) in each college to induce motivation among the
students. It is expected that this will motivate students living in the residential
colleges to reduce their electricity wastage and, therefore, control the energy
cost and also reduce the carbon emissions released into the environment. In the
present paper, we focus on the issues and challenges in organising an effective
campus energy saving culture at University of Malaya residential colleges to study
energy conservation and carbon emission reduction strategies. AC
CESS

40
Keywords: Energy saving culture, living lab, eco-campus, energy conservation,
environment
Introduction The first step a campus should take to become green is to reinforce, reinvigorate,
and to expand its energy conservation program. Energy consumption produces
the most significant environmental impacts associated with campus operations.
Thus, there is a need to operate campus buildings and equipment in an energy
efficient manner and to employ conservation measures wherever possible
(Fischer, 2008).
While many reasons may be given for energy wastage on campus, there really is
no excuse for it. Conservation and efficiency methods are well-established and
they pay for themselves. As reported at Universiti Teknologi Malaysia (UTM),
conservation can reduce total campus energy consumption by 30 percent or
more (Zakaria et al., 2012).
To stop global warming, we need significant reductions in CO2 emissions, which
can only be achieved by switching to clean, renewable sources of power that are
carbon-free or carbon-neutral. These include solar heating, daylighting,
photovoltaics, sustainable biomass, and wind power. However, efforts towards
campus environmental sustainability are deceptive if it does not acknowledge the
huge energy challenge of transforming the business as usual mind-set to an energy
saving culture. The full dimensions of the campus sustainable energy challenge
are just beginning to be appreciated as more and more campuses commit to
achieving climate neutrality (Petersen, Shunturov, Janda, Platt, & Weinberger,
2007). In this study, the building blocks of an effective energy saving culture
program is discussed.
Winning the Top Management Commitment To reach a full potential, an energy saving culture program needs a clear
commitment from the university top management. Top management including
deans, residential college masters, and registrar can inspire and insist that their
campus communities support energy conservation efforts. Top level leadership
is essential for achieving excellence in energy sustainability as well as campus
greening. Campus leadership support plays out in a variety of ways (Vicente-
Molina, Fernández-Sáinz, & Izagirre-Olaizola, 2013). As an example, when there
is a complain on why some offices and seminar rooms are not air conditioned
on a Sunday afternoon, it is important that the leadership stay in support of the
campus conservation program or else operational conservation measures will be
viewed as futile and abandoned. Of course, there is a need to accommodate the
research mission of universities but that does not mean all campus buildings
should operate seven days a week. When the support is wavering or in need of

41
reinforcement, one strategy is to speak the language of administrators by
demonstrating how your energy program reinforces academic excellence, public
service, and a good campus image and saves money which can be used on
academic and research programs. Another approach is to give campus top
management a piece of the action by inviting them to participate in press events
and bask in the spotlight whenever your program generates good news.
Empowerment of Department of Development and Estate
Management (JPPHB) As the operator of the campus physical facilities management and maintenance,
JPPHB has the greatest opportunity and ability to save energy. For this reason, it
is essential that top management mandate and empower JPPHB to perform this
job to the best of its ability. The vehicle for achieving steady progress on energy
conservation is the formation of an energy committee. This committee should
be chaired by a high-level administrator with enough rank and resources to get
things done. At some universities, this job is held by the Deputy Vice Chancellor
for development who makes it clear to facilities staff that energy conservation is
a top priority. Planning and implementation of conservation measures between
committee meetings is accomplished by a three-person team; the director for
utilities operations, the utilities manager, and the energy manager.
An energy committee should also be comprised of facilities supervisors who are
responsible for energy management systems, temperature control, cooling and
distribution systems, electrical, mechanical, and boiler maintenance, as well as
planning and design. The energy committee should meet frequently, e.g. every
other week when starting up and monthly or every other month when
established. This in-house energy committee is facilities operations oriented and
distinct from a campus-wide environmental task force or sustainability council.
All mid- to large-size campuses should have full-time energy officers in addition
to energy managers who supervise utilities operations and energy purchasing.
The energy officer should be a free agent who develops large and small energy
conservation projects, spearheads awareness efforts, and provides overall
leadership to the energy program. Needless to say, it is essential that the energy
officer report to the top of the organizational ladder and have the full
cooperation of facilities directors and staff. The energy officer should be
technically trained and competent and also be an able community organizer,
educator, and advocate who are authorized to cross organizational boundaries,
rock the boat every now and then, and get things done. Otherwise the inertia
and energy waste associated with business-as-usual will prevail (Moganadas,
Corral-Verdugo, & Ramanathan, 2013).
Of course, saving energy is not just up to the energy officer. It is a team effort.
All facilities staff members that are in a position to spot energy waste or
implement energy conservation should be doing so. This expectation can be

42
formalized by supervisors who understand the mission and carry the torch and
by rewriting job descriptions so facilities staff or technicians are evaluated on the
basis of their energy performance. Highly motivated facilities staff members or
technicians that are enthusiastic about saving energy should be encouraged and
given the green light and resources to pursue energy conservation measures.
Conservation sometimes means taking reasonable chances and risking
complaints. Campus leaders and facilities directors need to recognise this reality
and give facilities operations staff enough support and room to do their jobs.
Executing Energy Awareness Program Raising energy awareness is an essential component of an effective campus
sustainable energy program. An energy awareness campaign can change the
campus culture and create a climate for conservation. On a busy campus, raising
energy awareness may be difficult because it is hard to get people's attention.
Thus, a variety of methods and media is required (Carrico & Riemer, 2011). The
basics include an attractive, well-liked, and well-used website, e-mail notices,
campus mailings, articles in on and off campus newspapers, posters, stickers,
lecture presentations and guest speakers. But these are just a start. Creativity
and persistence are key to an effective awareness program which not only
increases support for campus energy conservation efforts but also contributes
to the eco-literacy of graduates.
One idea is by using an LCD installed in the main entrance or office counter of
all campus buildings that provides each building's annual energy costs. The high
electricity consumption figures usually shock people and spur conversations
about the need to conserve.
In addition, launching periodical outreach programs with catchy slogans, logos,
and coordinated resource materials can increase awareness effectiveness. One
of UM’s most recent campaigns was pioneered by the Living Lab Energy Saving
Culture in UM Campus Project (LL015-16SUS), led by Dr. Adi Ainurzaman
Jamaludin and other authors of this paper as team members. This project used
poster (Fig. 1a), informative brochure (Fig. 1b), and stickers (Fig. 1f) to empower
students, faculty, and staff and convey the simple message that everyone at UM
has “the power to turn things off.” The “Colour your energy” book deliberately
tried to be edgy and experimental in order to reach young students which are
the new generation young adults. It is a hip colouring book, exclusively designed
with energy savings messages printed on every page (Fig. 1c, 1d, 1e). There were
also energy savings logo and poster competition where participating students
could win gifts for their winning design. Incorporating energy conservation within
a larger campus environmental program is also helpful. The more students,
faculty, and staff think about the environment and practice environmentally
friendly behaviours like recycling, the more likely they are to want to save energy
too. Each green program reinforces the others (Sharp, 2002). Creating an energy
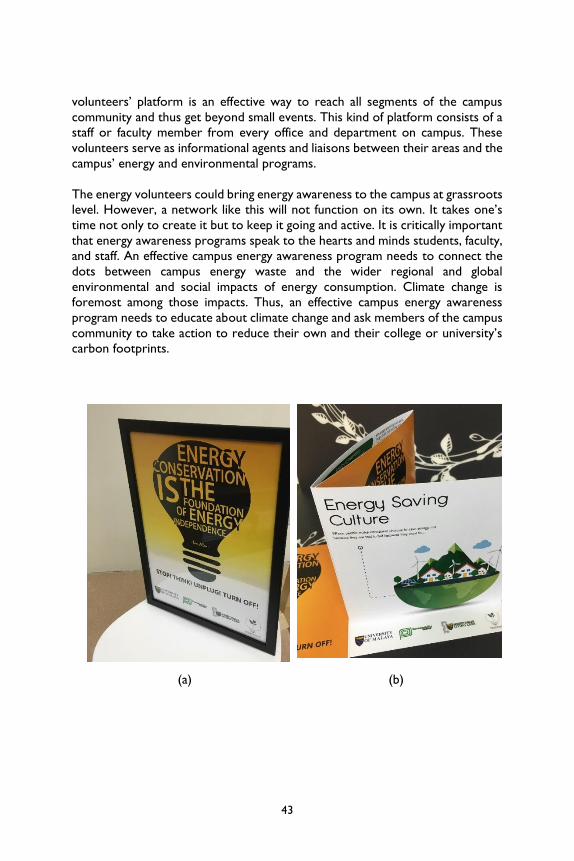
43
volunteers’ platform is an effective way to reach all segments of the campus
community and thus get beyond small events. This kind of platform consists of a
staff or faculty member from every office and department on campus. These
volunteers serve as informational agents and liaisons between their areas and the
campus’ energy and environmental programs.
The energy volunteers could bring energy awareness to the campus at grassroots
level. However, a network like this will not function on its own. It takes one’s
time not only to create it but to keep it going and active. It is critically important
that energy awareness programs speak to the hearts and minds students, faculty,
and staff. An effective campus energy awareness program needs to connect the
dots between campus energy waste and the wider regional and global
environmental and social impacts of energy consumption. Climate change is
foremost among those impacts. Thus, an effective campus energy awareness
program needs to educate about climate change and ask members of the campus
community to take action to reduce their own and their college or university’s
carbon footprints.
(a) (b)

44
(c) (d)
(e) (f)
Figure 1(a) Poster, (b) Brochure, (c)(d)(e) ‘Colour Your Energy colouring
book, (f) ‘Unplug’ reminder sticker

45
Creating Energy Policy Campus energy policies play a critical role. They establish and institutionalise
energy goals and they authorize action and programs to achieve compliance
(Mcmillin & Dyball, 2009). Energy policies should be drafted by a committee with
representation from the academic, maintenance, and business sides of the
institution. Needless to say, the best time to develop conservation-minded
campus energy policies is when your campus energy costs are high and the
budget is tight. Also, a genuine institutional commitment to address climate
change by reducing greenhouse gas emissions should drive energy policies in a
conserving, sustainable direction.
Here are some of the issues which can be addressed by one or more campus
energy policies:
• Air conditioner temperature settings
• Computer operations and "green computing"
• Restrictions on portable appliances per staff
• Energy efficiency purchasing standards for various types of equipment
• Green design and energy efficiency standards for new construction
• Energy practices in residential colleges and staff accommodations
• Campus transportation
• Alternative fuels and efficiency for campus bus
• Campus renewable energy development
• Greenhouse gas emissions reductions
Energy policies need not always stand-alone (Moore, 2005). They can also be
embedded in other types of campus policies. One likely place is a comprehensive
campus environmental policy. But it is important that sustainable energy policies
and commitments find their way into campus strategic and master plans as well.
Green Design An inefficiently designed new building is either a great retrofit candidate or an
energy vampire for the next 50 or 100 years. While retrofitting buildings to
improve efficiency makes sense, the retrofit exercise is costly and time-
consuming. Many buildings undergo retrofitting and start recording great energy
savings numbers. But one of the lessons learned from retrofitting is that new
buildings should be designed right and energy efficient in the first place, thereby
minimising the need for retrofitting. Progressive campus architects, engineers,
facilities directors, and sustainability advocates are now championing sustainable
or green building design for all new construction (Van Weenen, 2000). Green
design prioritizes energy efficiency and the use of bioclimatic design for
daylighting and air conditioning. These green design considerations, as well as
others pertaining to siting, building materials, and indoor environment, are
incorporated in the Green Building Index (GBI). GBI certified buildings may
achieve a platinum, gold, silver, bronze or certified rating depending on how many

46
points they achieve. While it is tempting to pursue a GBI rating by identifying the
easiest and cheapest points achievable by your project, this "checklist" approach
violates the spirit of green design, which is holistic and integrative in pursuing
design solutions that genuinely seek to minimize environmental impact. The truth
is that the greenest building is the one not built. Trimming new construction
plans and making better use of existing buildings makes the most sense
environmentally. This green design principle may be hard to accept if your
campus is intent on expansion and in the midst of buildout. In that case, the green
design movement reminds us that there are better and worse ways to put up
those new buildings (Velazquez, Munguia, Platt, & Taddei, 2006).
The premium costs of green buildings should be put in perspective. First, the
investment amount may be exaggerated. Smart design can make it possible to
design super-efficient new buildings at no additional cost. Where there are
additional first costs, they need to be balanced against savings in life-cycle
operating costs. The rise for green design is just beginning. It is a significant
frontier for campus energy and environmental sustainability and another
opportunity for campuses to lead or follow (Wright, 2002).
Conclusion The institutionalisation of campus energy savings culture should involve
educational and awareness campaigns, dialogue, series of meetings in identifying
the targets, establishing the system, mechanism and Key Performance Indicators
(KPIs). Those must be coupled with the living lab approach which allows
contribution from all campus community; academician, students and professional
as well as supporting groups. Teamwork and top management commitment are
identified as critical success factors in building the people and the culture,
towards the sustainability of the energy program.
Acknowledgement The authors would like to thank University of Malaya for the continuous support
and the UM Living Lab research funding LL015-16SUS granted by Sustainability
Science Research Cluster. Special appreciation goes to the community of Za’ba
Residential College for spearheading the energy saving culture efforts. This article
is partially adopted from the author’s report for Energy Manager Certification
submitted to Green Tech Malaysia.
References Carrico, A. R., & Riemer, M. (2011). Motivating energy conservation in the
workplace: An evaluation of the use of group-level feedback and peer
education. Journal of environmental psychology, 31(1), 1-13.
47
Fischer, C. (2008). Feedback on household electricity consumption: a tool for
saving energy? Energy efficiency, 1(1), 79-104.
Mcmillin, J., & Dyball, R. (2009). Developing a whole-of-university approach to
educating for sustainability linking curriculum, research and sustainable
campus operations. Journal of Education for Sustainable Development, 3(1),
55-64.
Moganadas, S. R., Corral-Verdugo, V., & Ramanathan, S. (2013). Toward systemic
campus sustainability: gauging dimensions of sustainable development via
a motivational and perception-based approach. Environment, development
and sustainability, 15(6), 1443-1464.
Moore, J. (2005). Barriers and pathways to creating sustainability education
programs: policy, rhetoric and reality. Environmental Education Research,
11(5), 537-555.
Petersen, J. E., Shunturov, V., Janda, K., Platt, G., & Weinberger, K. (2007).
Dormitory residents reduce electricity consumption when exposed to
real-time visual feedback and incentives. International Journal of
Sustainability in Higher Education, 8(1), 16-33.
Sharp, L. (2002). Green campuses: the road from little victories to systemic
transformation. International Journal of Sustainability in Higher Education,
3(2), 128-145.
Van Weenen, H. (2000). Towards a vision of a sustainable university. International
Journal of Sustainability in Higher Education, 1(1), 20-34.
Velazquez, L., Munguia, N., Platt, A., & Taddei, J. (2006). Sustainable university:
what can be the matter? Journal of Cleaner Production, 14(9), 810-819.
Vicente-Molina, M. A., Fernández-Sáinz, A., & Izagirre-Olaizola, J. (2013).
Environmental knowledge and other variables affecting pro-environmental
behaviour: comparison of university students from emerging and
advanced countries. Journal of Cleaner Production, 61, 130-138.
Wright, T. S. (2002). Definitions and frameworks for environmental sustainability
in higher education. International Journal of Sustainability in Higher Education,
3(3), 203-220.
Zakaria, R., Mohamed, K. A., Zin, R. M., Zolfagharian, S., Nourbakhsh, M.,
Nekooie, M. A., & Taherkhani, R. (2012). Sustainable Development
Factors for Land Development in Universiti Teknologi Malaysia’s Campus.

48
4
Smart Modular Electrical Energy Monitoring and
Management System Mohd Yazed Ahmad*
Faculty of Engineering, University of Malaya, 50603 Kuala Lumpur, Malaysia
*Corresponding author: [email protected]
Abstract Proper management of electrical power has become crucial nowadays due to its
significant impact in reducing the consumption of energy, reducing electricity bills,
and at the same time lowering CO2 emissions. Collected data and findings from
literatures indicated that there are significant percentage of users (approximately
more than 30%) who do not really care to turn off switches. In addition,
implementation of smart space or smart office over existing building often incur
high starting investment and as a result such solution has not been fully adopted.
This project proposed a quick and simple approach to reduce unnecessary
energy usage by using novel modular electrical energy monitoring and power
management system featuring easy installation without the need of major
renovation and rewiring. This system is developed in-house by UM researchers;
therefore, we have full control over the sub-components to be used which then
allows us, at some extend, control the overall cost of the system. Results from
our first phase study indicated that under well controlled environment it is
possible to achieve approximately 34% reduction of electrical energy usage for
lightings and approximately 47.8% for air-conditioning. In addition, the proposed
system has made it convenient to the space occupants since all the switching and
temperature regulations are automatically taken care of. The next step is to
further improve and expand the use of the proposed system at more locations
so that full benefits of energy savings and CO2 reductions can be optimized, thus
benefits the Institution and promotes sustainability.
Keywords: Living Lab, Eco-campus, Energy Monitoring, IOT smart switch,
Smart Saving, automation, energy saving.
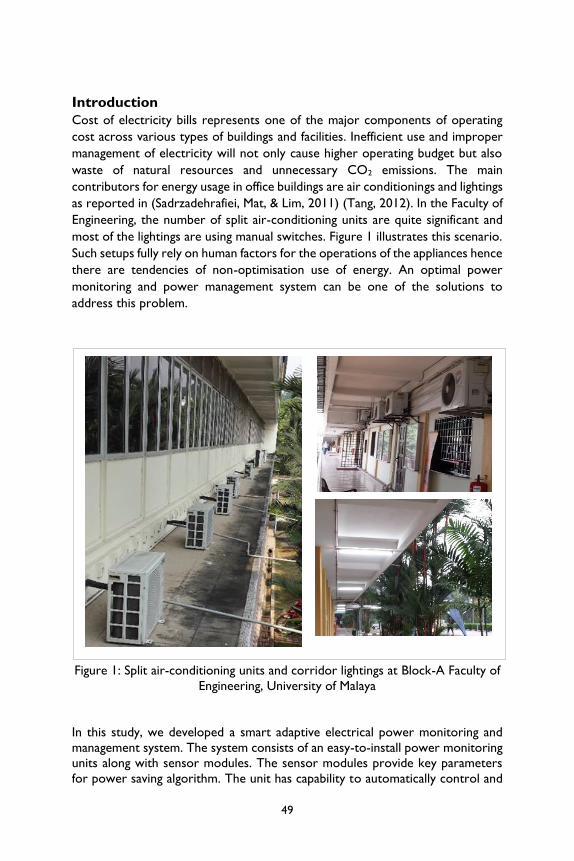
49
Introduction
Cost of electricity bills represents one of the major components of operating
cost across various types of buildings and facilities. Inefficient use and improper
management of electricity will not only cause higher operating budget but also
waste of natural resources and unnecessary CO2 emissions. The main
contributors for energy usage in office buildings are air conditionings and lightings
as reported in (Sadrzadehrafiei, Mat, & Lim, 2011) (Tang, 2012). In the Faculty of
Engineering, the number of split air-conditioning units are quite significant and
most of the lightings are using manual switches. Figure 1 illustrates this scenario.
Such setups fully rely on human factors for the operations of the appliances hence
there are tendencies of non-optimisation use of energy. An optimal power
monitoring and power management system can be one of the solutions to
address this problem.
Figure 1: Split air-conditioning units and corridor lightings at Block-A Faculty of
Engineering, University of Malaya
In this study, we developed a smart adaptive electrical power monitoring and
management system. The system consists of an easy-to-install power monitoring
units along with sensor modules. The sensor modules provide key parameters
for power saving algorithm. The unit has capability to automatically control and

50
set an optimum temperature for the air conditioning units and turns it off when
it is not needed especially when the is no recipient within the room or space. In
addition, other appliances such as fluorescent lamp can be also conveniently
switched on or off. Although this technique sounds simple, till now such system
has not been fully investigated and implemented especially in University of Malaya.
The component cost for such system is very minimal as compared to the benefit
and savings it can offer. The proposed system is illustrated as in Figure 2.
Figure 2: Block diagram of an improved energy saving system
The first phase study indicated that a systematic saving by at least 4 % is possible.
Considering Faculty of Engineering alone, when translated in monetary terms, it
is around RM120,000 worth of saving. Such amount of money could be utilised
for other important areas such as to promote further research in green
technology, improving facilities for engaging students and staff to increase
productivities, and for maintenance.
In this study, the following objectives have been considered; 1) To develop
modular power monitoring system which consists of system controller, sensor,
and switch modules that have capability to control electrical appliances based on
input parameters such as temperature light intensity, physiological state and
comfort level of human/recipient inside a building; 2) To develop a novel adaptive
power saving algorithm, featuring friendly and convenient interaction between
human and electrical appliances in the given room or space; and 3) To conduct a
Devices (e.g. air
conditioners, lamps,
etc.)
Central Module with
Power saving algorithm
(Equipped with:
Temperature sensor /
Infrared/ Motion
sensor)
Wireless
Power
Monitoring
Module
Smart Switch
Module

51
case study so that the practicality and the efficacy of the proposed system can be
evaluated and compared with the existing systems.
Literature Review Smart management of electrical power has become crucial nowadays due to its
significant impact in reducing the consumption of electric energy, reducing
electricity bills and at the same time help to reduce CO2 emissions (Jim, 2009)
(Fathabadi, 2014). For example, when light intensity in a certain location increases
due to the sunlight, the supplied voltage can be decreased to reduce light
intensity. Basically, the system works when the light intensity is captured by a
photocell sensor which will then compare it to a reference data and the system
can automatically regulate and manages the light intensity by varying the firing
angle of the solid-state regulator. This system can be implemented in most of the
buildings including those in the university.
Other than that, the power consumption can be reduced by simply changing the
type of lamp used e.g. from the fluorescent lamps to LED lamps (light emitting
diodes). However, this approach demands quite high initial investment (Vahl,
Campos, & Casarotto Filho, 2013). Another approach of controlling energy
consumption is by automatically switching ‘on’ or ‘off’ the appliances. Which
means, when there is no person in a room, then the device such as lamp and air-
conditioner can be turned off.
Heating and cooling are the main sources of power consumption that contribute
to the high electricity bills. Recently, Universiti Teknologi Petronas (UTP) has
come out with a method of energy saving which is accessed via a simulation of
energy for a centralized HVAC (system for heating, ventilating, and air
conditioning) in academic building. They utilised adaptive cooling technique for
continuous cooling load (Bhaskoro, Gilani, & Aris, 2013).
Since academic buildings are not always occupied, the presence of occupants in
a building has an important impact on the required cooling of a building (Kwok
& Lee, 2011) (Sadrzadehrafiei et al., 2011). This implies that cooling load in a
building is mostly driven by the number of recipient. In addition, occupancy
pattern in an academic building especially laboratory, workshop, and classroom
is likely to change every semester or academic year. Therefore, it needs
appropriate design and analysis tool to optimise the performance of the system
(Trčka & Hensen, 2010).
It has been reported in (Gul & Patidar, 2015) that there are quite a significant
percentage (about 30%) representing number of users who do not really care to
turn off switches. Therefore, a solution such as autonomous switching is needed
to address this 30% category.

52
Although there are plenty of efforts in improving efficiency and reducing the
unnecessary electrical usage, most of the existing techniques are not convenient
and costly due to the need of high initial investment which involve major
renovations such as walls hacking for installation of the system. In this project,
we aim to overcome most of these challenges.
Methodology Appropriate monitoring and active intelligent intervention can help to promote
energy saving or in other words, they can optimise the usage of electrical energy
in powering most of the common electrical appliances such as air conditioners,
indoor lightings, and other appliances. As a result, the unnecessary electrical
energy consumptions, and CO2 emissions all together can be systematically
reduced. In addition, this system will also help to extend the lifetime of the
appliances.
The proposed system consists of four modules namely: a) Smart switch module;
b) Central module with sensors; c) Cloud linking module and d) Power
monitoring module. The modules and their integration are illustrated in Figure
3.
Figure 3: Modules of Smart Modular Electrical Energy Monitoring and
Management System and the integration of modules to control a lecturer
room.

53
To ensure fast development, most of the sub-components in each modules were
fabricated using off-the-shelf components.
Smart switch module
This module features are easy to install, to replace, or to work with existing
switch attached to an appliance. Since it has the capability to harvest electric field
and magnetic field energy, the system does not require additional power supply
and therefore eliminates any major rewiring. This module can communicate with
central module or alternatively can be combined with Cloud linking module to
enable remote monitoring and remote switching of the appliance. This module
uses programmable system on chip (PSOC) technology which embedded within
it a Bluetooth Low Energy (BLE) module, serial interface, analog to digital
converter, power management unit, and low power microcontroller. Part of our
energy saving algorithms run on this PSOC.
Central module with sensors
This module consists of a microprocessor, Wi-Fi module, Bluetooth module,
temperature sensor, human motion sensor and infrared LED. The role of this
unit is to monitor physical parameters and to perform the necessary actions to
conserve the use of electrical energy. The physical parameters that this unit
measures include the presence of human in the space, current temperature and
humidity of the space. This unit is also able to communicate with power
monitoring module. This unit controls the appliances within the given area
through Bluetooth and infrared signals.
Cloud linking module
This module is the simplest module. It consists of a Wi-Fi module and Bluetooth
module. It’s role simply relays data between Wi-Fi module and Bluetooth
module.
Power monitoring module
The low-cost power monitoring module was modified from Texas instrument
which was subsequently turned into a wireless compatible and configurable
device configurable through manipulation of the internal circuit. This module
communicates with the data logger programme runs on any PC with internet
connection mainly to collect energy data. Data such as real power, reactive
power, apparent power, power factor, voltage, and currents are accessible and
recordable. This module may also communicate with the central unit to provide
the necessary information for power saving algorithm.

54
Integration and case study
The overall system was tested to monitor and to control lights and air-
conditioning unit in a lecturer room. The central unit was let to continuously
monitor the presence of human in the room and the room temperature for over
one week. Matlab platform was used to sort and analyse the collected data. The
sorted version of the collected data and the overall results are presented in the
subsequent sections.
Results Results on Energy savings from lightings
The collected data for switching activities are shown in Figure 4. The high states
correspond to ‘switch on’ and the low states correspond to ‘switch off’. The
state changes from low to high when there is human detected, and the state
changes from high to low when there is no human movement detected over the
period of a time-out-time (10 minutes). Additionally, accumulation of lights ‘ON’
and lights ‘OFF’ over five working days is presented in Figure 5.
Figure 4: The collected light switching data sorted by hours and days

55
Figure 5: Percentage of lights 'ON' and lights 'OFF' during working hours over
six working days
Results on Energy savings from air-conditioning temperature settings
Figure 6 indicates instantaneous power due to air conditioning states under
different temperature settings.
Figure 6: Instantaneous power from power meter corresponding to air
conditioning states under different temperature settings
Discussion Plots in Figure 4 clearly indicate that the system is capable of switching ‘ON’ and
‘OFF’ the lights depending on whether the user was available in the room or not.
The results also indicate that after office hours all the lights were consistently
switched off.
0
20
40
60
80
100
1 2 3 4 5 6
Percentage of Light 'ON' and Light 'OFF' during working
Hours Over Six Working Days
Percentage ON Percentage OFFSaving accomplished
(34%)

56
As for the air-conditioning unit, three temperature settings were observed, i.e.
when it set to 23oC, 25oC, and 26oC. Relative comparison indicates saving of
48.5% when the temperature was set at 25oC as compared to 23oC. By setting
temperature at higher value, it allows higher percentage of saving which is around
73.1%.
Saving accomplished from lightings was approximately 34%, and from air-
conditioning was around 48.5%. All these achievements were taken under well
controlled room environment.
Table 1: Comparison of power savings at different temperature settings.
Consumption over one hour
Temperature
Setting Below
23oC
Temperature Setting
25oC Temperature 26oC
0.886KWh 0.456KWh
Saving: 48.5% w.r.t
23oC
0.238KWh
Saving: 73.1% w.r.t 23oC
: 47.8% w.r.t 25oC
Conclusion A smart modular electrical energy monitoring and management system has been
developed and tested. Results indicate that this system can save energy around
34% for lightings and 48.5% for air conditioning unit under controlled
environment. The proposed concept of modular system makes the proposed
system simple to be implemented especially in the existing buildings. This feature
will help adoption of smart energy monitoring and management system in a bigger
scale resulting bigger savings, eco-friendly and sustainable use of energy.
Acknowledgement The authors would like to acknowledge Sustainability Science (SuSci) Research
Cluster, University of Malaya, Kuala Lumpur under Living Lab Grant (LL014-
16SUS) for financial support.

57
References
Bhaskoro, P. T., Gilani, S. I. U. H., & Aris, M. S. (2013). Simulation of energy saving
potential of a centralized HVAC system in an academic building using
adaptive cooling technique. Energy Conversion and Management,
75(Supplement C), 617-628.
doi:https://doi.org/10.1016/j.enconman.2013.06.054
Fathabadi, H. (2014). Ultra high benefits system for electric energy saving and
management of lighting energy in buildings. Energy Conversion and
Management, 80(Supplement C), 543-549.
doi:https://doi.org/10.1016/j.enconman.2014.01.002
Gul, M. S., & Patidar, S. (2015). Understanding the energy consumption and
occupancy of a multi-purpose academic building. Energy and Buildings,
87(Supplement C), 155-165.
doi:https://doi.org/10.1016/j.enbuild.2014.11.027
Jim, T., & Ed, S. . (2009). Power monitoring 101: Supervisory, connectivity and
protection options that add an umbrella of protection over your entire
IT infrastructure [White paper]. Retrieved from
http://lit.powerware.com/ll_download.asp?file=PowerMonitoring101-
V13.pdf
Kwok, S. S. K., & Lee, E. W. M. (2011). A study of the importance of occupancy
to building cooling load in prediction by intelligent approach. Energy
Conversion and Management, 52(7), 2555-2564.
doi:https://doi.org/10.1016/j.enconman.2011.02.002
Sadrzadehrafiei, S., Mat, K. S. S., & Lim, C. (2011). Energy consumption and energy
saving in Malaysian office buildings. Paper presented at the Models and
Methods in Applied Sciences.
https://www.researchgate.net/profile/Chin_Haw_Lim/publication/267381
799_Energy_consumption_and_energy_saving_in_Malaysian_office_buil
dings/links/545b1c0f0cf2c16efbbbd186.pdf
Tang, F. E. (2012). An energy consumption study for a Malaysian university. World
Academy of Science, Engineering and Technology, 68, 1757-1763.
Trčka, M., & Hensen, J. L. M. (2010). Overview of HVAC system simulation.
Automation in Construction, 19(2), 93-99.
doi:https://doi.org/10.1016/j.autcon.2009.11.019
Vahl, F. P., Campos, L. M., & Casarotto Filho, N. (2013). Sustainability constraints
in techno-economic analysis of general lighting retrofits. Energy and
Buildings, 67, 500-507.

58
5
Safe Disposal of Unused Medications – Working
toward a Green Pharmacy in the University of
Malaya Medical Centre Sim Si Mui 1, *, Lai Siew Mei Pauline 2, Tan Kit Mun3, Lee Hong Gee4, Che
Zuraini Sulaiman5 and Wong Yin Yen5
1 Department of Pharmacology, Faculty of Medicine
2 Department of Primary Care Medicine, Faculty of Medicine 3 Division of Geriatric Medicine, Department of Medicine, Faculty of Medicine
4 Department of Pharmacy, Faculty of Medicine 5 Department of Pharmacy, University of Malaya Medical Centre
*Corresponding author: [email protected]
Abstract The aim of this study was to find sustainable ways to reduce medication wastage
and minimise environmental and public health hazards caused by improper
disposal of unused medications at the University of Malaya Medical Centre
(UMMC). The study was conducted in three phases: 1) developing and validating
an instrument (ReDiUM) to measure the knowledge, attitude and practice (KAP)
concerning the return and disposal of unused medications; 2) conducting a KAP
survey on UMMC patients and auditing the return of unused medications to the
UMMC Pharmacy; 3) evaluating the impact of public awareness campaigns on
patients’ KAP and their return of unused medications. The study showed that
ReDiUM was a valid and reliable instrument. Our survey showed that most
UMMC patients knew that improper drug disposal was harmful on the
environment; acknowledged that it was their responsibility to protect the
environment and household from unintended harmful exposure to unused
medications; and were willing to donate their non-expired unused medications
to reduce wastage. A substantial amount of unused medications returned to the
UMMC were in good condition and was donated to the UMMC pharmacy,
specialists and health-related NGOs for reuse. This reduced medication wastage
and the risk unused medications posed on environment and public health.

59
Keywords Unused medications, safe disposal, eco-campus, living lab, public health hazards
Introduction The University of Malaya Medical Centre (UMMC) is a 1600-bed, tertiary public
hospital that situates in between two large metropolises, serving a population of
over one and a half million. In 2016, an approximate sum of RM 62 million was
set aside for medications in the UMMC, which constituted to about 15% of the
hospital budget. Thus, unused or unwanted medications represent a significant
waste of healthcare resources, which is also costly to the healthcare institution,
as there are costs involved in the purchasing and proper disposal of unused
medications. This inevitably results in economic wastage (Abou-Auda, 2003;
Garey, Johle, Behrman, & Neuhauser, 2004). Improper disposal of unused
medicinal products also has adverse consequences on the environment and
public health (Bound, Kitsou, & Voulvoulis, 2006; Bound & Voulvoulis, 2005).
Hence, the overall aim of this proposed study was to find sustainable ways to
reduce medication wastage and minimise environmental and public health
hazards caused by improper disposal of unused medications, thus greening the
pharmacy of the UMMC.
Literature Review There are multiple reasons for households to possess unused medications, which
include expired medications, contaminated medications, non-adherence to
treatment, change in patient’s condition, discontinued medical treatment, death
of patients, or hoarding of medications. There are also several routes for unused
medications to gain entry to the environment. They include disposal as household
garbage (that will be taken to landfill) or flushing down the toilet or pouring
down the sink (that ends up in the sewerage system), resulting in possible
contamination of surface water (Bound & Voulvoulis, 2005). Management of
these active pharmaceutical ingredients in the environment is both challenging
and potentially costly (Sorell, 2016). It is thus highly desirable to reduce the risk
of releasing these unwanted medicinal products into the environment, which may
pose harm to not only the environment but also to public health.
While there are some international and national guidelines on the safe
management of healthcare wastes, these tend to be at the organisational level
(World Health Organization, 1999, 2014). Information concerning the proper
disposal of unused or unwanted medications in the house is still scarce (Food
Drug Administration, 2013) and the recommendations equivocal (Daughton,
2003). Some agencies advocate throwing of unused medications in household
garbage (mixed with kitty litter or coffee grounds to make them unpalatable),
flushing them down the toilet, or pouring them down the drain to avoid misuse
or abuse of unused medications by other household members and pets. In

60
developed countries like the United States of America, United Kingdom and
Australia, there are community-based medicine “take-back” programmes, which
some experts believe to be the safest and most environmentally protective way
to dispose unused or unwanted medications, but this is not the most convenient
or readily available option to the majority of patients (Take Back Your Meds,
2016). Thus, it is important for us to find a solution that is both environmentally
friendly as well as user friendly for our community-dwelling patients.
To date, there is a gap in published literature that documents the knowledge,
attitude and practice (KAP) of Malaysians regarding the safe disposal of unused
medications, by using a validated instrument; nor have there been national
guidelines on the safe disposal of unused medications in Malaysian households.
Thus, the overall aim of this study was to find sustainable ways to reduce
medication wastage in our community-dwelling patients (also known as
ambulatory patients) and to minimise environmental and public health hazards
caused by improper disposal of unused medications, thus greening the pharmacy
of the UMMC. This study may be extended to include the neighbourhood
communities in the future.
Methodology The study was conducted in three phases (Figure 1) and aimed to (1) document
the knowledge, attitude and practice (KAP) of Malaysians regarding the safe
disposal of unused medications, by using a validated instrument, (2) to document
the amount and types of unused medications that are commonly returned to
UMMC outpatient pharmacy, and (3) to explore ways to reduce medication
wastage and to protect the environment and public from hazards arising from
improper disposal of unused medications.
Phase 1 – Developing and validating ReDiUM for measuring KAP of
patients
The first phase of this study was to develop and validate an instrument (ReDiUM)
to measure the knowledge, attitude and practice (KAP) of our UMMC patients
concerning the safe disposal of unused prescribed medications. The ReDiUM
questionnaire was developed by an expert panel and literature review. It
contained 30 items – 10 items each on knowledge, attitude and practice. The
items in the knowledge domain have “True”, “False” and “Do not know” options,
whereas those in the attitude and practice domains have responses selected
based on a 5-point Likert-scale, where 1 represented “Strongly disagree” and 5
represented “Strongly agree”.
Anyone who was ≥21 years of age, currently taking prescribed medications, and
was able to answer the questionnaire in English, was recruited as a participant.
The sample size was calculated on an item to participant ratio of 1:10, in order

61
to perform factor analysis. Since there were 30 items in the questionnaire, we
thus aimed to recruit at least 300 participants for the ReDiUM validation study.
These participants were asked to fill in the demographic form and to answer the
ReDiUM twice: at baseline and two weeks later (to assess for reliability). Ethics
approval for this study was granted by the Medical Research Ethics Committee
of the University of Malaya Medical Centre.
Phase-2 – KAP survey and audit of unused medications returned to UMMC
Pharmacy
After validating the instrument, ReDiUM was used to measure the KAP of those
patients waiting to collect their medications at the UMMC outpatient pharmacy.
The survey items included patient age, gender, level of education, monthly
income bracket, and whether they are currently working as a healthcare
professional, but not their names or identification numbers.
In a separate parallel study, an audit of the return of unused medications to
UMMC outpatient Pharmacy was carried out. The returned medications were
collected weekly and sorted according to a work process shown in Figure 2.
Qualified healthcare staff examined these returned medications carefully and
analysed them according to drug class, name, cost, physical condition, expiry
date, and whether or not they were part of UMMC’s standard formulary.
Phase-3 – Intervention to promote public awareness on the safe disposal
of unused medications (still ongoing)
Campaigns to raise public awareness and to promote the return of unused
medications to the UMMC outpatient Pharmacy for safe disposal have been
planned but not all have been carried out at the time of writing this article. Based
on the findings of the first two phases of this study on KAP survey and unused
medicines audit, various forms of intervention (e.g., poster exhibition, bunting
advertisement, short video clips, promotional materials, and educational talks)
have been discussed. A small-scale two-day public awareness campaign, mainly
in the form of poster exhibition, video clip, brochure and mini quiz, was held at
both the UMMC main concourse and at the RMIC (Research Management and
Innovation Complex) foyer in conjunction with the Sustainable Development
Symposium 2017 event on 20-21 April 2017. However, a more extensive public
awareness campaign is being planned for 19-23 June 2017 to be held at the
UMMC. A post-intervention survey on the KAP of patients and an audit of the
return of unused medications have also been planned for the purpose of
estimating the possible impact that the campaigns may have on the reduction of
medication wastage, environmental pollution and public health hazards.

62
Results Phase 1 – Developing and validating ReDiUM for measuring KAP of patients
A total of 338 participants (who were not our UMMC patients) agreed to take
part in the validation study and 314 (92.9%) completed the retest. The majority
of our participants were female (72.5%), with a median age of 35 years
[interquartile range (IQR) = 28.8-51.0]. The overall Cronbach’s α was 0.703. At
test-retest, kappa values ranged from 0.244 to 0.523. The median total
knowledge score was 60% (IQR: 40-70). The majority of participants (94%) knew
that improper drug disposal has harmful effects on the environment. However,
their knowledge was low regarding the disposal of pressurized aerosol metered
dose inhalers in the garbage, where only 11% of participants answered this item
correctly. The majority of participants (>50%) acknowledged that it was their
responsibility to protect the environment and to protect their household
members from unintended harmful exposure to unused medications.
Phase-2 – KAP survey and audit of unused medications returned to UMMC
Pharmacy
(i) KAP survey
When ReDiUM was used to measure the KAP of 400 UMMC outpatients, the
results showed almost identical pattern of responses with that of the participants
in the validation study, even though the actual scores for each response item
might be different.
In the knowledge domain, the majority (86%) of our UMMC outpatients knew
that improper drug disposal has harmful effects on the environment and
ecosystem. They generally knew the acceptable ways to dispose different forms
(solid or liquid) of medicines (50-60%), except for pressurised aerosol metered-
dosed inhalers (20%). Only 25% of the participants knew about the inadequacy
of wastewater treatment in removing medicines from the environment and
ecosystem. Similarly, low proportion of them knew that creams and ointments
may be disposed in the garbage (37%) and incineration is the environmentally
sound way of disposing unwanted medicines (36%).
In the attitude domain, most (>90%) also acknowledged that it was their
responsibility to protect the environment and their household members from
unintended harmful exposure to unused medications. Many of them (70-80%)
believed “discarding unused medicines that are still in good condition is a waste
of resources” and were “willing to donate their non-expired unused medications
to reduce wastage”.
In the practice domain, the two most likely reasons for our participants to have
unused medications were “just in case I need it” (58%) and “feeling better” (57%),
whereas the least likely reason was due to non-compliance (38%). About half of
them had unused medicines and disposed them because of experiencing
unwanted side effects. The majority of the participants disposed their medicines

63
because the medicines “have expired” (83%). The other likely reasons for them
to dispose their medicines were either the medicines appeared bad (65%), or
have turned bad due to inappropriate storage (65%).
(ii) Audit study
The result reported here included all the unused medications returned to the
UMMC Outpatient Pharmacy during the period mid-May 2016 to January 2017.
Approximately 1,034 kg of unused medications (worth about RM 151,492) were
returned to UMMC Pharmacy over the study period, of which 882 kg (85%) were
found to be still within the expiry dates and in their original untampered
packaging (Table 1). The rest of the medications (15%) that were expired or
damaged in some way were discarded into the yellow bin to be incinerated by
licensed vendor. Those that were not expired and not damaged or spoilt, but
still in their original packaging, were returned to UMMC Pharmacy, or donated
to certain specialists as well as Non-Government Organisations (NGOs) which
operate free clinics, as needed.
A total count of 353,783 dose units (whether in the form of tablets, capsules or
bottles) of unused medications were donated back to the UMMC Pharmacy
during the study period (Table 2), of which 41% of these were drugs classified
under the cardiovascular system, followed by drug classes under the endocrine
system (18%) and nutrition and blood system (17%). However, when we analysed
the unused medications as individual drugs, metformin (an antidiabetic drug
under endocrine system) was the most commonly returned drug (11%), followed
by simvastatin (a cholesterol-lowering drug under cardiovascular system, 8%) and
calcium carbonate (a calcium supplement for osteoporosis under nutrition and
blood system, 7%).
Phase-3 – Intervention to promote public awareness on the safe disposal
of unused medicines (“Safe DUMP”)
A total of 374 adults (69.3% female; median age = 49 years, IQR = 34.2-62.0)
participated in a mini quiz while visiting the exhibition booth during our two-day
Safe DUMP campaign held at the University of Malaya Medical Centre (UMMC)
concourse (Figure 3) and the Research Management and Innovation Complex
(RMIC) foyer in conjunction with the Symposium on Sustainable Development,
on 20-21 April 2017. Preliminary findings on the knowledge of our public on safe
disposal of unused medicines were obtained based on the responses of these 374
visitors to the five-question mini quiz. The results of this mini quiz showed that
most of them (≥94%) were aware of the potentially harmful effects of unused
medicines to household and environment, and that returning these unused
medicines to the pharmacy is the proper way of disposing these medicines. While
a substantial number of them (89%) might have known that incineration is the
environmentally friendly way of disposing unused medicines, less than 75% knew
64
that wastewater treatment is not able to remove all medicines from the
environment.
Discussion The aim of this study was to find sustainable ways to reduce medication wastage
and minimise environmental and public health hazards caused by improper
disposal of unused medications at the UMMC. In order to plan effective
campaigns to modify the behaviour of public members with regard to the return
and safe disposal of unused medicines, we needed an instrument to reliably
measure the knowledge, attitude and practice (KAP) of our UMMC patients on
such matter. Our results showed that the ReDiUM was a valid and reliable
instrument to assess the KAP of our UMMC patients concerning the return and
disposal of unused prescribed medications. To the best of our knowledge, there
are no other such validated instrument that measures simultaneously the
knowledge, attitude and practice (KAP) of patients on the disposal of unused
medications. The instrument used by Aditya and Rattan (2014) to explore the
KAP of pharmacists about medication disposal and their awareness about the
potential environmental effects on inappropriate drug disposal was only pre-
tested on five pharmacists for clarity of the questions (both open- and closed-
ended types) posed to their respondents (Aditya & Rattan, 2014). Our ReDiUM
(which extracted a number of knowledge questions from theirs) should be more
robust an instrument compared to theirs for assessing the KAP of respondents
regarding medication disposal and its impact on environment.
Our KAP survey showed that the majority of our UMMC patients knew that
improper drug disposal has harmful effects on the environment. In fact, when we
compared six similar items in the knowledge domain of our study with another
one conducted in India, it would appear that the knowledge of our community
dwelling patients on these issues (accurate response scores of 52.4 ± 20.9%,
mean ± SD, n = 400) are comparable with that of the pharmacists (54.5 ± 11.7%
accurate responses; n = 84) surveyed in an urban town in North India (Aditya
and Rattan, 2014). This might seem surprising since we would expect the
pharmacists to be better informed with the proper ways of disposing unused
medications and to be better aware of the impact of improper disposal of such
items on the environment and ecosystem. This may reflect the education level
of those UMMC patients who participated in our KAP survey; more than 65% of
them had at least diploma or above education. Most of our UMMC patients
acknowledged that it was their responsibility to protect the environment and
household from unintended harmful exposure to unused medications, and were
willing to donate their non-expired unused medications to reduce wastage. This
suggests that campaigns that encourage patients to return their unused
medications before the medications become expired or spoilt as a means to
reduce medication wastage, are likely to produce favourable responses among
our UMMC patients. Indeed, our audit findings also showed that a substantial

65
amount of unused medications returned to UMMC were still in good condition,
which could be donated to UMMC pharmacy, the specialists and health-related
NGOs for reuse. This would reduce medication wastage and the risk these
unused medications posed on environment and public health, should they be
discarded through household garbage, toilet or sinks.
As mentioned above, there are many reasons why medications prescribed to
patients become unused: these include a change of medication by the prescriber,
outdated or expired medication, adverse drug reaction experienced by the
patient resulting in non-compliance, and others (Langley, Marriott, Mackridge, &
Daniszewski, 2005). In 2015, the Malaysian government has started to implement
separation of recyclable waste from general household waste. However, among
all the items to be sorted, medication is not included in the list. In view of a great
increase in medical expenditure, the Ministry of Health announced to the general
public through daily news to encourage them to return their unused medications
to the hospitals or pharmacies (Utusan Melayu (M) Berhad, 2015). Even though
the public responded by returning their unused medications to the healthcare
professionals, some of them were returned in poor condition, such as expired,
used halfway of the recommended treatment regimen, poor appearance of
medication, unusable and have to be disposed by hospital; this will increase the
cost of the healthcare system due to cost involved in disposing these expired or
damaged medications and additional cost in acquiring new medications to comply
with the needs of medications in the hospitals.
In our audit arm of the study, we found that 85% of the unused medications
returned to UMMC Pharmacy were still within the expiry dates and in their
original untampered packaging. If all these “good” unused medications could be
reused it would have saved approximately RM 130,000 worth of medication
expenditure over a period of 8.5 months in just one hospital outpatient
pharmacy. The cost saving does not restrict just to medication expenses but
would also include the cost of cleaning up the polluted environment, should these
medications be thrown into garbage or flushed down the toilet, and the cost of
incineration, should they be returned to the hospital pharmacy for proper
disposal. Among the unused medications returned to UMMC outpatient
pharmacy, medications for cardiovascular and endocrine diseases topped the list,
followed by nutrition/blood, central nervous system and gastrointestinal system.
Such findings are not too different from that observed in other countries. For
example, in the UK, cardiovascular drugs were the most commonly returned
(28.5%; compared to 41.2% in our study) of the total drugs returned during the
study, followed by central nervous system (18.8%), respiratory (14.7%) and
gastrointestinal (10.6%) drugs (Langley, et al., 2005); but endocrine drugs
contributed to only about 5.6% in their study (compared to 17.7% in our study).
A study in Taiwan (Chien et al., 2013) showed that gastrointestinal (25.93%) and
cardiovascular (22.49%) drugs were the two most often discarded medications,
followed by anti-inflammatory drugs (12.15%), antidiabetic drugs (9.49%) and

66
colds medicines (6.83%). Bergen and co-workers (2015) reported the 20 most
commonly discarded drugs in Australia, which included salbutamol (respiratory
drug), insulin (endocrine drug) and frusemide (renal drug), the top three of the
list (Bergen, Hussainy, George, Kong, & Kirkpatrick, 2015). A major difference in
the type of medications discarded seems to be in the respiratory drugs, which
only accounted for 0.9% of the total unused medications returned to our hospital
pharmacy and 2.16% in the Taiwan study (Chien, et al., 2013). However, studies
conducted in the UK (14.7%) and Australia (salbutamol was the most commonly
discarded drug) showed that respiratory drugs were among the top two most
commonly discarded drugs. Perhaps this reflects the difference in the prevalence
of respiratory diseases in these countries.
During the two-day small scale public awareness campaign held in conjunction
with the Symposium on Sustainability Development 2017, a fair number of public
(>370) were attracted to read the posters and many of them attempted the 5-
question mini quiz on the safe disposal of unused medicines. Through these quiz
questions, besides reading the posters and brochure, we hope that the public are
now more aware of the importance of returning the unused medications for safe
disposal at UMMC Pharmacy. Although most of them appeared to be aware of
the danger such unused medicines may pose to the environment and ecosystem,
about a quarter of them were not aware that wastewater treatment is not
effective in removing all the medicines from the environment. More than 10% of
those who came to the exhibition booth did not know that incineration is the
most environmentally friendly way of disposing unused medicines. So in our
future campaigns, we will need to improve the public’s knowledge in these
aspects.
In summary, our project is making good progress and has given us some valuable
information on the knowledge, attitude and practice (KAP) of our UMMC
outpatients regarding the safe disposal of unused medicines. With such
information we can begin to formulate strategies to modify behaviour and deal
with the problem of medication wastage, thereby reducing its negative impacts
on the environement, public health and taxpayers’ money. To start with, we
would like to hold more intensive public awareness campaigns and educational
seminars/materials to get the public to avoid having unused medicines at home
and to return these unused medicines to UMMC pharmacy for safe disposal. At
the same time we would like to also target at the prescribers (i.e. medical
doctors) and the dispensers (i.e. pharmacists) to help reduce the likelihood of
patients possessing unused medicines at home, hence further reduce medication
wastage. We hypothesise that paying patients are less likely to collect more
medicines than they need, and therefore less likely to have unused medicines at
home. To test this hypothesis, we propose to study the KAP of the paying
outpatients at our private wing University of malaya Specialist Centre (UMSC).
All these are aiming at finding the best feasible ways to reduce medication

67
wastage and the associated negative impacts of unused medications on the
environement, public health and taxpayers’ money.
Conclusion The ReDiUM was found to be a valid and reliable instrument for assessing
patients’ KAP on the return and disposal of unused medications. The majority of
UMMC outpatients knew that improper drug disposal has harmful effects on the
environment. Most acknowledged that it was their responsibility to protect the
environment and household from unintended harmful exposure to unused
medications, and were willing to donate their non-expired unused medications
to reduce wastage. A substantial amount of unused medications returned to
UMMC were still in good condition and could be donated to UMMC pharmacy,
the specialists and health-related NGOs for reuse. This would reduce medication
wastage and the risk these unused medications posed on environment and public
health.
Acknowledgement We would like to thank Woon Soo Chin, Goon Bee Cheng, Nor Syafiqah binti
Azmi and Mohamad Azali bin Mohd Alwai for their assistance in collecting and
analysing some of the data. We would also like to thank all the participants who
participated in this study. Funding for this study was obtained from University
of Malaya Living Lab Grant Programme (LL030-16SUS).
References Abou-Auda, H. S. (2003). An economic assessment of the extent of medication
use and wastage among families in Saudi Arabia and Arabian Gulf
countries. Clin Ther, 25(4), 1276-1292.
Aditya, S., & Rattan, A. (2014). Minimizing Pharmaceutical Waste: The Role of
the Pharmacist. Journal of Young Pharmacists, 6(3), 14-19.
Bergen, P. J., Hussainy, S. Y., George, J., Kong, D. C., & Kirkpatrick, C. M. (2015).
Safe disposal of prescribed medicines. Aust Prescr, 38(3), 90-92.
Bound, J. P., Kitsou, K., & Voulvoulis, N. (2006). Household disposal of
pharmaceuticals and perception of risk to the environment. Environ
Toxicol Pharmacol, 21(3), 301-307. doi: 10.1016/j.etap.2005.09.006
Bound, J. P., & Voulvoulis, N. (2005). Household disposal of pharmaceuticals as a
pathway for aquatic contamination in the United kingdom. Environ Health
Perspect, 113(12), 1705-1711.
Chien, H.-Y., Ko, J.-J., Chen, Y.-C., Weng, S.-H., Yang, W.-C., Chang, Y.-C., &
Liu, H.-P. (2013). Study of medication waste in Taiwan. J Exp Clin Med,
5. doi: 10.1016/j.jecm.2013.02.003
Daughton, C. G. (2003). Cradle-to-cradle stewardship of drugs for minimizing
their environmental disposition while promoting human health. II. Drug

68
disposal, waste reduction, and future directions. Environ Health Perspect,
111(5), 775-785.
Food Drug Administration. (2013). How to Dispose of Unused Medicines
Retrieved 22 Feb, 2017, from
https://www.fda.gov/downloads/Drugs/ResourcesForYou/Consumers/B
uyingUsingMedicineSafely/UnderstandingOver-the-
CounterMedicines/ucm107163.pdf
Garey, K. W., Johle, M. L., Behrman, K., & Neuhauser, M. M. (2004). Economic
Consequences of Unused Medications in Houston, Texas. Annals of
Pharmacotherapy, 38(7-8), 1165-1168. doi: doi:10.1345/aph.1D619
Langley, C., Marriott, J., Mackridge, A., & Daniszewski, R. (2005). An analysis of
returned medicines in primary care. Pharm World Sci, 27(4), 296-299.
doi: 10.1007/s11096-005-0354-8
Sorell, T. L. (2016). Approaches to the Development of Human Health Toxicity
Values for Active Pharmaceutical Ingredients in the Environment. AAPS
J, 18(1), 92-101. doi: 10.1208/s12248-015-9818-5
Take Back Your Meds. (2016). Medicinal Disposal Myths and Facts Retrieved
Mar 9, 2016, from http://www.takebackyourmeds.org/what-can-you-
do/medicine-disposal-myths-and-facts.
Utusan Melayu (M) Berhad. (2015). Pulangkan Ubat Belum Diguna ke Hospital
Retrieved May 25, 2017, from
http://www.utusan.com.my/berita/nasional/pulangkan-ubat-kepada-
klinik-hospital-kerajaan-jika-tidak-digunakan-hilmi-1.472519
World Health Organization. (1999). Guidelines for safe disposal of unwanted
pharmaceuticals in and after emergencies. Geneva.
World Health Organization. (2014). Safe management of wastes from health-care
activities Second edition. Retrieved 22 Feb, 2017, from
http://www.searo.who.int/srilanka/documents/safe_management_of_w
astes_from_healthcare_activities.pdf?ua=1

69
Table 1: Estimated amount of unused medications returned to UMMC
Pharmacy, amount donated or discarded during the study period
(May 2016 – Jan 2017)
Period Amount
Returned
(kg)
Amount
Donated *
(kg)
Amount
Discarded #
(kg)
May 16 –
Jan 17
1,034 882 152
* Amount of unused medications that were returned in good condition (within
expiry date and still in the original packaging) and donated in part back to UMMC,
and others to Individual specialists and selected Non-governmental organisations
that operate free clinics. # Amount of unused medications that were returned in poor (expired or
damaged) condition and were discarded for incineration.
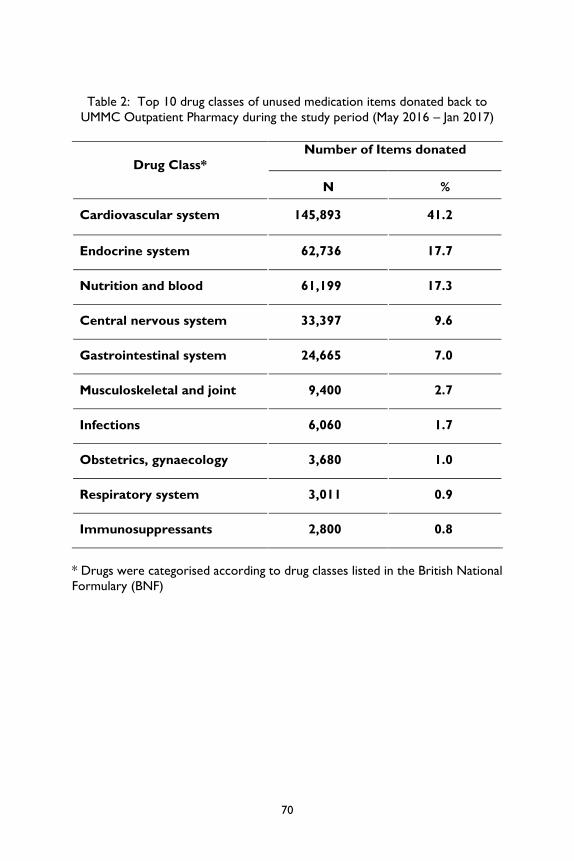
70
Table 2: Top 10 drug classes of unused medication items donated back to
UMMC Outpatient Pharmacy during the study period (May 2016 – Jan 2017)
Drug Class*
Number of Items donated
N %
Cardiovascular system 145,893 41.2
Endocrine system 62,736 17.7
Nutrition and blood 61,199 17.3
Central nervous system 33,397 9.6
Gastrointestinal system 24,665 7.0
Musculoskeletal and joint 9,400 2.7
Infections 6,060 1.7
Obstetrics, gynaecology 3,680 1.0
Respiratory system 3,011 0.9
Immunosuppressants 2,800 0.8
* Drugs were categorised according to drug classes listed in the British National
Formulary (BNF)

71
6
UM Zero Waste Campaign: Integrated and
Sustainable Waste Management System
Development in University of Malaya
Sumiani Yusoff1,*, Z. X. Keng1, Nur Syuhada1
1Department of Civil Engineering, Faculty of Engineering, University of Malaya
*corresponding author: [email protected]
Abstract Municipal solid waste (MSW) generation in Malaysia reaches a shocking 33,000
ton/day in 2013. Nationwide, there are 176 landfills but only 8 are sanitary landfill
with the rest are open dumpsites. In the campus of UM, UM Zero Waste
Campaign (UM ZWC) was introduced in 2011 to start a long term campaign to
achieve an integrated and sustainable waste management model and ultimately a
zero waste campus. Since year 2015, UM ZWC is fully funded by Sustainability
Science Research Cluster of UM (Susci) as one of the living labs of UM as well as
by JPPHB under the RMK-11 budget. UM ZWC operating projects including in
house composting center, food waste segregation scheme, research composting
emission and waste characterization, anaerobic digestion (AD), used clothes
collection program, wood waste separate collection, e-waste collection and
drop-off recycling collection were initiated under the campaign. Since the
inception of the project in 2011 until December 2016, a total of 474.54 ton of
solid waste has been diverted from disposal in landfill with composting, AD,
recycling, re-use and energy recovery. A roadmap of UM ZWC was drawn up in
2013, with a goal to achieve 60% landfill diversion by year 2040. In the next 5-10
years, UM ZWC plays a vital role to formalize the recycling collection in UM and
further increase the organic waste recycling with green waste shredding and
composting. Besides environmental benefits (pollution prevention and carbon
emission reduction), UM ZWC brings various benefits such as academic research
opportunities for UM, contribute in UM LCCF (Low carbon city framework)
target and serve as platform to improve students’ soft skills and entrepreneur
skill. Multi stakeholders participation, support form top management and

72
industrial collaboration are the key factors that are able to drive the development
of a sustainable waste management model in UM campus.
Keywords Food waste, Composting, Recycling, Waste Recovery, Sustainability
Introduction Solid waste can be referred as unwanted waste is that derived from the animal
and human activities. It is also can be generated from industrial, institution,
residential, commercial, construction and demolition activities. Solid waste can
be classified based on its contents including materials such as paper, plastics, glass,
metal and organic waste. Moreover, it also can be categorized based on hazard
potential incorporated with radioactive, flammable, toxic or non-toxic. While
solid waste management is defined as discipline associated with control of
generation, storage, collection, transportation, processing and disposal of solid
waste materials in the best way to deal with the range of public health,
conservation, economic and other environmental considerations. The main goal
of solid waste management is to minimize and eliminate adverse effects on human
health and environment to aid economic development and quality of life.
Generally, solid waste composition in Malaysia largely constitute of municipal
solid waste (MSW) 64% with the remaining consisting of industrial waste,
commercial waste, and construction waste (EA-SWMC, 2009). In 2007, with a
population more than 25 million, Malaysian households produce approximately
18,000 tons of household waste every day. Rapidly growing population, improved
quality of life and rising economic growth are the factors that contribute
challenges to the management of solid waste (Shekdar, 2009). With significant
improvement of living standards, it is expected that solid waste generation
increases over the years without any transformation in the attitudes and behavior
of Malaysians in managing their waste. With the utilization of plastic and paper
materials especially in packaging where those materials become easily dispensable
to the consumers, solid waste generation increases at uncontrollable rate (Abdul
Jalil, 2010 and Malahkahmad et al., 2010). The least favored disposal method is
landfilling, as waste should be separated and treated (physical, chemical, or
biological treatment), but unfortunately these options are costly and time-
consuming (Grodzinska-Jurczak, 2001).
Landfill is the most economical and hence most common MSW disposal method
in Malaysia. Nationwide, there are 176 operating landfills but only 11 of them are
sanitary landfills with seven in Peninsula Malaysia, one in Sabah and three in
Sarawak. Besides the operating landfills, there are 114 closed landfills in the
country which required post closure treatment and management for at least 30
years. The total capacity of MSW disposed in the current 176 operating landfills
is more than 30,000 ton/day and the total size of operating landfills is 2,528.2 ha.

73
In total, the size of operating and closed landfills is 3,446.2 ha, which is 0.01% of
Malaysia total land area. In Malaysia, approximately 93.5% of municipal solid waste
(MSW) is sent without sorting to the landfill or open dumpsites that have no gas
recovery, and only 5.5% of MSW is being recycled and 1.0% composted
(Agamuthu, Fauziah, & Khalil, 2009). Table 1 shows the present number of
operating and non-operating solid waste disposal sites in Malaysia.
Table 1: Number of operating and non-operating solid waste disposal sites in
Malaysia.
State Operating
non-sanitary
landfill sites
Operating
sanitary
landfill sites
Non-
operating
landfill sites
Total
Johor 12 2 23 37
Kedah 8 1 6 15
Kelantan 13 0 6 19
Melaka 2 0 5 7
Negeri
Sembilan
7 0 11 18
Pahang 16 0 16 32
Perak 17 0 12 29
Perlis 1 0 1 2
Pulau Pinang 2 0 1 3
Sabah 19 0 2 21
Sarawak 46 6 14 66
Selangor 5 4 14 23
Terengganu 8 0 12 20
Federal
Territory of
Kuala Lumpur
0 0 7 7
Federal
Territory of
Labuan
1 0 0 1
TOTAL 157 13 130 300
Source: JPSPN (2015a).
Solid waste has constantly been an issue particularly in the amount of solid waste
generated (Gellynck et al., 2011). The increasing affluence leads to uncontrollably
high amount of solid waste production despite the potential of source separation

74
and recycling in Malaysia. Lack of public conscientious in today’s modern lifestyle
has resulted to increasing amount of waste generated and disposed at landfills
especially when it comes to packaging, as these materials are dispensable to them
(Asmawati et al., 2011). Education and individual upbringing contribute
considerably towards environmental awareness, how society perceives the issue,
as well as how they decide on their daily behavior, particularly in managing solid
waste. Besides the influence of socio-economic factors, perception of infinite
resources with no observable environmental consequences to the public led to
over-consumption, which produces unnecessary waste ultimately. Without the
support and commitment from households, local authorities, private
concessionaires, and other stakeholders in organizing solid waste, source
separation and recycling practice would be a major challenge.
It was reported that in 2003, the amount of solid waste generation per capita
per day ranged between 0.5 up to 0.8 kg but recently it had increase to between
0.5 to 2.5 kg, especially in the major city such as Kuala Lumpur and Petaling Jaya
(Khathirvale et al., 2003). Table 2 shows that food waste and organic material
are found to have highest portion in solid waste generated in Malaysia which
ranges between 32% to 68.4%.
Table 2: The Material Composition of Municipal Solid Waste Obtained from
Various Studies and Site (Chua et al, 2001)
Food waste composting can be considered as one of the most appropriate
approaches for treating biodegradables waste components, also one of the
potential waste management elements to divert waste generated to landfill, while
simultaneously recycling organic materials by converting them into a beneficial
product. The potential of practicing composting is huge as 70% of Malaysian
Component 2001 2001 2002 2003 2004 2005 2005 2007 2010
Food waste
& Organics
68.4 32 56.3 37.4 49.3 45 47.5 42 43.5
Mix plastic 11.8 16 13.1 18.9 17.1 24 NA 24.7 25.2
Mix paper 6.3 29.5 8.2 16.4 9.7 7 18.5 12.9 22.7
Textiles 1.5 3.4 1.3 3.4 NA NA 2.13 2.5 0.9
Rubber &
Leather
0.5 2 0.4 1.3 NA NA NA 2.5 NA
Wood 0.7 7 1.8 3.7 NA NA 4.41 5.7 NA
Yard waste 4.6 NA 6.9 3.2 NA NA 2.72 NA NA
Ferrous 2.7 3.7 2.1 2.7 2 6 NA 5.3 2.1
Glass 1.4 5.5 1.5 2.6 3.7 3 NA 1.8 2.6
Pampers NA NA NA 5.1 NA NA NA 3.81 NA
Other 2.1 1.9 8.4 5.3 18.2 15 21.93 2.6 1.8
Total 100 100 100 100 100 100 100 100 100

75
wastes are wet waste, which are not easily recycled as the dry waste. In Malaysia,
the average components of MSW are quite similar with the largest categories
consisting of food waste (45%), plastic (24%) followed by paper (7%), iron (6%)
and lastly 3% for glass and others (Government of Malaysia, 2006). Food waste
is a main component of MSW which can lead to the emission of odorous
compounds and can affect the quality of leachate from landfill and others (Wang
et al., 1999).
Food wastes produce greenhouse gases (GHG) emissions and have an influence
on climate change. Generally, these emissions have been identified as an critical
environmental concern in the waste sector (Liamsanguan and Gheewala., 2008).
In Asian countries, it is estimated that the largest increase of food waste
generation could be ranged from 278 to 416 million tones that can contribute to
global anthropogenic emissions ranging from 8 to 10% (Antonis, 2013). Apart
from the waste treatment, GHG emissions from waste handling, transportation
and operation of machinery are also significant especially due to the utilization of
fossil-based energy. Indirect GHG saving potential via materials and energy
recovery from waste management must be recognized (Gentil et al., 2009).
Literature review University of Malaya is a public university located in Kuala Lumpur. It is a
multidisciplinary Research University that has more than 20,000 students and
2000 academic staff with 14 faculties/academy, 3 academic centres, 11 research
institutes and clusters which covers the whole spectrum of learning from the
Arts, Sciences and Humanities. In University of Malaya, the Sustainability Science
Research Cluster (SuSci) is one of the entity that play a catalytic role to promote
research and initiatives in a holistic and comprehensive perspective to resolve
the problem that is relevant to global sustainability, social and human life system.
SuSci also have its origin in the concept of development as recommended by the
World Commission on Environment and Development (WCED) in 1987 and
aims to achieve status society and sustainable and balanced life between physical
development and maintenance environment. Amongst the many research
programs under Susci, the Living Lab projects, promotes translational and
problem solving especially in promoting UM eco campus initiatives and
environmental conservation and reducing campus environmental impact.
The University of Malaya Zero Waste Campaign (UM ZWC) is one of the
university’s longest and most consistent endeavors. It is also unique due to the
bottom-up and top-down synergy that characterizes its development. It has the
following objectives such as to develop policy and innovation systems to divert
organic waste (from disposal in landfill) for nutrient (composting) and energy
recovery (anaerobic digestion), to streamline recycling activities and strategize
efforts to increase recycling rates, to create awareness and inculcate best
practices of waste separation at source among campus communities, serve as a

76
long term campaign to achieve an integrated waste management model and
ultimately a zero waste campus, initiate projects, research projects and schemes
such as the Green Bag Scheme, an in-house composting centre, an anaerobic
digestion project, recycling collection system for e-waste, used textiles and wood
waste, composting emission study and others.
The project was incepted by final year students in the Environmental Engineering
program in 2009 led by Associate Prof. Dr. Sumiani Yusoff who advocated the
needs to address the challenges, posed by the inevitable environmental liabilities
in waste management and carefully identified the major drawbacks concerning
the low environmental performance of MSW management in the country. They
initiated a chain of activities to development of recycling management system in
the faculty with minimal cost. In July 2009, VeeCYCLE, a student group was
formed to run an integrated recycling project in Faculty of Engineering. The
project established a recycling management model which has resulted in the
development of an organized and effective waste and recyclables collection
system in the faculty. 45 sets of an integrated waste and recyclables collection
facility called PRO Bin were introduced to replace the existing rubbish
receptacles in the faculty. It facilitates the good practice of separation at source.
It was set-up to spearhead the development of a more sustainable waste
management model in the UM campus and ultimately achieve the status of a zero
waste campus. This campaign is a daily operation which is seven days a week
without interruption that requires observation and a strong commitment to
ensuring that all the waste on campus is managed in an orderly manner and in
accordance with the establishment of the procedures. This field also requires
cooperation from the café operators in UM due to estimated average of 40% of
food waste from the overall composition of waste in UM. Hence, organic and
inorganic waste are managed by UM ZWC and the university’s assets and service
department, JPPHB, reducing monthly almost 15-20 tons of waste to landfill,
while reducing cost and reducing environmental impacts through reduction in
carbon emissions and footprint and leachate contamination avoidance. Hence
UM ZWC has promoted the concept of sustainable consumption and production
by converting food and green waste into valuable resources such as compost and
biogas. Other endeavour includes educational campaign and workshops about
waste management, segregation at source and recycling. On a longer term level,
UM ZWC has drawn up a roadmap for the UM Development Unit to achieve
15% landfill diversion by year 2020 (phase 1), 30% by year 2030 (phase 2) and
60% by year 2040 (phase 3) while phase 1 have been achieved by UM ZWC
which is 15% landfill diversion by year 2020. The integrated solid waste
management system set up through the UM ZWC Living Lab projects has
strengthen the green growth agenda toward sustainable development and
environmental conservation in UM campus by empowering the campus
community through a systematic, concerted, and action oriented problem solving
translational research initiative.

77
Methodology Solid waste generated in UM campus is collected by fixed collection systems. UM
communities are supposed to deposit the waste at the locations specified by the
Department of Development & Estate Management (JPPHB) every day of the
week and will be collected by a specific time. These generated solid wastes are
transported by vehicles which can be categorized as collection and haulage
vehicles. Collection vehicles collect the waste in where it is generated and then
transfer and dispose to the disposal facility which is UM ZWC located near the
Damansara Gate. The waste will be segregated by the workers to reduce the
volume and pollution potential for landfill sites. Moreover, UM ZWC used a
Takakura composting method as a meaningful processing technology for the bulk
of the degradable organic fractions. The composting method was eventually
evolved into aerated static piles with capacity of 4-5 ton/month (90% food waste
and 10% green waste, by weight). In 2013, Cowtec ® anaerobic digestion (AD)
100kg/day unit was installed after research collaboration with CH Green Sdn
Bhd. With the AD facility, about 1 ton of food waste is converted to biogas and
bio-fertilizer every month. Until end of year 2014, about 120 ton of organic waste
had been composted or treated anaerobically by UM ZWC.
2014 is an improvement year for UM ZWC with more collaboration with
industries to establish separate collection of various waste streams, collaboration
with academic institutions for research, more appearance in environmental
conferences, expo and media, and strengthening rapport from UMCARES and
JPPHB. The public private partnership (PPP) between UM ZWC and several
private entities had resulted in successful separate collection of waste streams
for recycling/landfill diversion. At the beginning of 2014, UM ZWC collaborated
with Life Line Clothing (LLC) Sdn Bhd to introduce a used clothes collection
program which had expanded rapidly in year 2014 that saw the collection of
more than 20 ton of used clothes and waste textile. At the end of the year, ZWC
formed partnership with TSP Waste Management to kick off a wood waste
separate collection system for energy recovery which is implemented
successfully with about 5-6 ton/month capacity in the first month.
The support from UM top management, especially DVC (Development) to UM
ZWC, is very important to ensure the success of the PPP. For instance, the sites
approval to LLC to place the used clothes collection bins and cooperation to
collect wood waste separately in a dedicated open top Ro-Ro bin for wood waste
recycling. The DVC (Development), Prof. Faisal Rafiq had allocated budget for
the upgrading of ZWC facilities in year 2015 such as new ZWC building, green
waste shredder, a weighbridge station and composting center. The UM ZWC
cabin serve as resource center, site treatment facility and meeting room for
visitors to UM ZWC site. Under DVC (Development), JPPHB assists UM ZWC
in the provision of several manual workers, waste and recycling data as well as
collection receptacles for food waste such as bins and bags. Moreover, this data

78
collection practice is also contributing to UM LCCF (Low Carbon City
Framework) project.
On the other hand, various programs were carried out to enable the
implementation of the projects, including awareness publicity program for
students and staffs, capacity building program for the kitchen staffs and cleaners,
discussion and meeting with strategic partners both UM and external bodies as
well as several site visits to enhance the students’ knowledge in waste
management. The programs promote the development of communication,
information, negotiation and consultation skills among the students. The projects
are poised to further strengthen their roles in realizing IWM model by enabling
on site, in-house organic waste treatment operation and expanding the coverage
of recycling collection points (PRO Bin).
In 2017, UM ZWC develops an Intelligent Recycle Center (IRC) with Coindex
Sdn Bhd to promote behavior and inculcate best practice of recyclables drop-off
with this innovative automated recycle center located at lecture hall A&B
PASUM. With the new recycling system, UM communities are able to send their
source segregated recyclables to the center for conversion into green points
which can be used to claim goodies such as compost, USB pendrive, t-shirt and
redeemable discounted price in participating cafeteria in UM. This kind of
reward-based interactive recycling innovation can bring multiple benefits and
contribution to positive social behavioral change (recycling habit) and resource
conservation with increase of recycling rate. Furthermore, in near future the IRC
can serve as thematic environmental center in UM campus with a galleria of
environmental related information to the corridor of lecture hall building. The
IRC is anticipated as the cornerstone to develop a formal recycling separate
collection in the campus of UM, which is one of the primary concepts of
integrated waste management.
Result and Discussion Data collection and analysis is very important in development of integrated waste
management plan. With the weighbridge station installation in July 2015, UM
ZWC is able to capture the waste disposal data. The complete /comprehensive
data that UM ZWC fully possesses are food waste collected for composting or
anaerobic digestion, green waste collected for composting, wood waste collected
for energy recovery, waste textiles collected for reuse/recycle, E-waste collected
at UM ZWC site for recycling/recovery, recyclable materials sorted at UM ZWC
site and UM transfer station and residual waste disposal data.
UM ZWC coordinated and gathered all the data from different parties. With the
data, tonnage per year was calculated as below (Table 3). From the data, it shows
the increasing of total waste was diverted for treatment and recycling by UM
ZWC from 2012 until 2016. The increasing factor is due to the improvement of
the project by collaborating with textile industry to introduced used clothes

79
collection program which had expanded rapidly in year 2014 that saw the
collection of more than 20 ton of used clothes and waste textile. At the end of
the year, UM ZWC formed partnership with TSP Waste Management to kick off
a wood waste separate collection system for energy recovery which is diverted
with about 5-6 ton/month from landfill. Used clothes and waste textiles are
collected separately with ten (10) units of “drop-off” collection bins while wood
waste is collected by JPPHB in separate open top bin for energy recovery in a
paper mill.
Figure 1: Total of waste diversion for treatment and recycling by UM ZWC
(2012-2016)
23.5
55.24
95.72
175.22179.5
0
20
40
60
80
100
120
140
160
180
200
2012 2013 2014 2015 2016
Ton
es
Year
Total of waste diversion for treatment and recycling by UM ZWC (2012-2016)
Total waste treated
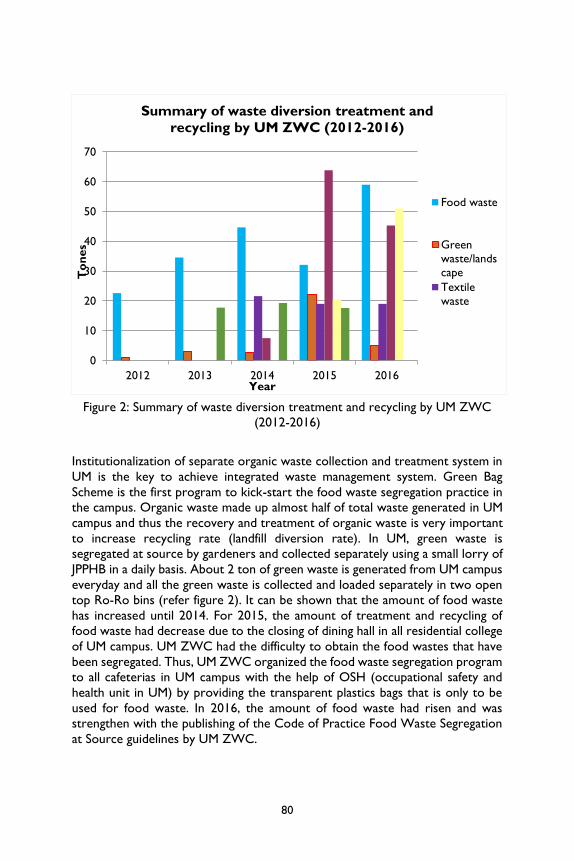
80
Figure 2: Summary of waste diversion treatment and recycling by UM ZWC
(2012-2016)
Institutionalization of separate organic waste collection and treatment system in
UM is the key to achieve integrated waste management system. Green Bag
Scheme is the first program to kick-start the food waste segregation practice in
the campus. Organic waste made up almost half of total waste generated in UM
campus and thus the recovery and treatment of organic waste is very important
to increase recycling rate (landfill diversion rate). In UM, green waste is
segregated at source by gardeners and collected separately using a small lorry of
JPPHB in a daily basis. About 2 ton of green waste is generated from UM campus
everyday and all the green waste is collected and loaded separately in two open
top Ro-Ro bins (refer figure 2). It can be shown that the amount of food waste
has increased until 2014. For 2015, the amount of treatment and recycling of
food waste had decrease due to the closing of dining hall in all residential college
of UM campus. UM ZWC had the difficulty to obtain the food wastes that have
been segregated. Thus, UM ZWC organized the food waste segregation program
to all cafeterias in UM campus with the help of OSH (occupational safety and
health unit in UM) by providing the transparent plastics bags that is only to be
used for food waste. In 2016, the amount of food waste had risen and was
strengthen with the publishing of the Code of Practice Food Waste Segregation
at Source guidelines by UM ZWC.
0
10
20
30
40
50
60
70
2012 2013 2014 2015 2016
To
nes
Year
Summary of waste diversion treatment and
recycling by UM ZWC (2012-2016)
Food waste
Green
waste/lands
cape
Textile
waste

81
For the recyclables material separation for recycling, it was and is still an up hilling
challenge for UM ZWC as the current practice of recycling collection by informal
players poses significant hindrance. However, with the persistent efforts by UM
ZWC and JPPHB, collection of recycling data is improving from time to time and
the introduction of the Intelligent Recycling Center (IRC) this year will hopefully
further boost the development of recycling in UM campus. In term of economic,
UM ZWC has been saved more than RM 97, 758 from January 2012 until
December 2016 (refer Table 3). The monetary saving included the collection fee
and landfill gate fee. While for the environmental saving, UM ZWC has been
saved almost 726.46 ton CO₂-eq. The reduction in economic and environmental
aspects due to the waste recovery and composting process that is diverted
biodegradable are wastes and composted.
Table 3: Economic and environmental cost saving of UM ZWC as of January
2012– December 2016
According to the sustainable and income generation, the project will become
sustainable and profitable from the sale of compost. However, the sale of
compost poses a challenge and the sale of all the compost still presents a major
challenge. The UM ZWC compost is sold RM 5/kg way below market price of
around RM10-15/kg. The compost was officially being sold at September 2015 to
all UM citizens and public. UM ZWC also has been set up an account for selling
Baja Organik UM ZWC with Bursar UM. The total amount for selling the compost
until April 2017 was RM 6,345.
Typ
e o
f
waste
To
nn
age
No
. of trip
s
red
uced
Co
llectio
n
fee sa
ved
(RM
)
Lan
dfill g
ate
fee sa
ved
(RM
)
To
tal
mo
neta
ry
savin
g (R
M)
Carb
on
savin
g (to
n
CO
2 -eq
)
Food
waste
192.88 96 24,110 10,608 34,718 455.00
Green waste 33.77 23 5,628 1,857 7,486 52.78
Wood waste 116.69 58 14,586 6,418 21,0004 181.10
Textile waste 59.64 50 12,425 3,280 15,705 36.74
Recyclables 17.56 60 14,908 3,936 18,844 0.84
Total 474.54 287 71,658 26,100 97,758 726.46

82
Table 4: Waste reduction by UM ZWC as of January 2012 until December
2016
Total Organic Waste Treated 399,967.00KG
Food Waste Composted 172,780.00KG
Food Waste Digested 20,100.00KG
Green Waste Composted 33,757.00 KG
Textile Waste 59,640.00KG
Wood Waste 116,690.00 KG
Organic Compost Produced 6,887.00 KG
Potential Income Generation RM 34,435
Conclusions The UM ZWC project, comprising of waste segregation and composting
biodegradable waste, is a good example of a highly integrated approach
accounting for the different elements of solid waste project sustainability. The
project also has been made a clear distinction between how to enable improved
environment influences performance and outcome of the project, and how the
project impacts positively on UM social, economic and ecological environment.
Ultimately, by making efforts in implementing food waste management systems,
the future perspective of food waste could create opportunities in handling
energy demands and moving toward sustainable development. The sustainability
of UM ZWC is important for UM’s reputation locally and internationally as an
example of eco campus which emphasizes on academic excellence and whilst
promoting sustainable development. UM ZWC has successfully developed
several key projects that serve as milestone to boost recycling rate in the
campus. In the next 5-10 years, UM ZWC plays a vital role to formalize the
recycling collection in UM and further increase the organic waste recycling with
green waste shredding and composting. Besides environmental benefits
(pollution prevention and carbon emission reduction), UM ZWC brings various
benefits such as academic research opportunities for UM, contribute in UM
LCCF (Low carbon city framework) target and serve as platform to improve
students’ soft skills and entrepreneur skill. Multi stakeholder’s participation,
support form top management and industrial collaboration are the key factors
that are able to drive the development of a sustainable waste management model
in UM campus.

83
Acknowledgement The authors would like to acknowledge Sustainability Science (SuSci) Research
Cluster, University of Malaya, Kuala Lumpur under Living Lab Grant (LL004-
15SUS) for financial support.
Appendix
Figure 1: UM ZWC organic fertilizer (left) and UM Intelligent Recycle
Center (IRC) located at Lecture Hall A&B PASUM
Figure 2: UM ZWC Cabin located at Damansara gate UM

84
References
Agamuthu P, Fauziah SH, Kahlil K. (2009). Evolution of solid waste management
in Malaysia: impacts and implications of the solid waste bill. J Mater Cycles.
11:96–103.
Brian, L., Craig, H., James, L., Lisa, K., Richard, W., Tim, S., (2013). Reducing Food
Loss and Waste – Installment 2 of ‘Creating A Sustainable Food Future’.
World Resource Institute, Washington, DC.
Gentil, E., Christenen, T.H., Aoutin, E., (2009). Greenhouse Gas Accounting and
Waste Management. Waste Management & Research. 27, 696-706.
IPCC, (2007). In: Metz, B., Davidson, O.R., Bosch, P.R., Dave, R., Meyer, L. A.,
(Eds), Contribution Of Working Group ІІІ To The Forth Assessment Report
Figure 3: UM Cowtec Anaerobic
Digestor(AD)
Figure 5: UM Composting piles
Figure 4: UM ZWC wood
waste collection program
Figure 6: UM ZWC textile
waste collection program

85
Of The Intergovernmental Panel On Climate Change. Cambridge University
Press, Cambridge, United Kingdom and New York, USA.
Kathirvale, S., Muhd Yunus, M. N., Sopian, K., Samsuddin, A. H., (2003). Energy
potential from Municipal Solid Waste in Malaysia. Renewable Energy 29, 559–
567.
Liamsanguan, C., Cheewalas.H., (2008). The Holistic Impact of Integrated Solid
Waste Management on Greenhouse Gases Emissions in Phuket. Journal of
Cleaner Production. 16, 865-1871.
McDougall, F., White, P., Franke, M., Hindle, P. (2001). Integrated Solid Waste
Management: A Life Cycle Inventory. (2nd Eds). Blackwell Publishing.
Shekdar, A.V., (2009). Sustainable Solid Waste Management: An Integrated
Approach for Asian Countries. Waste Management 29 (4), 1438-1448.
Sustainable Waste Management Cycle (EA-SWMC). (2009). EU-Perak Solid
Waste Management Plan (EU-PSWMP). Perak, Malaysia.
M. Abdul Jalil. (2010). Sustainable development in Malaysia: a case study on
household waste management. J. Sustain. Dev., 3 (3) (2010), pp. 91–102
A. Malahkahmad, M.Z.Z. Che Mohd Nasir, S.R. Mohammed Kutty, M. Hasnain
Isa. (2010). Solid waste characterization and recycling potential for University
Technology PETRONAS academic buildings. Am. J. Environ. Sci., 6 (5) (2010),
pp. 422–427.
M.S. Grodzinska-Jurczak (2001). Management of industrial and municipal solid
wastes in Poland. Resour. Conserv. Recycl., 32 (2) (2001), pp. 85–103
X. Gellynck, R. Jacobsen, P. Verhelst (2011). Identifying the key factors in
increasing recycling and reducing residual household waste: a case study of
the Flemish region of Belgium. J. Environ. Manag., 92 (10), pp. 2583–2590.
D. Asmawati, A.K. Nor Ba’yah, Y. Fatimah. (2011). A study on the knowledge,
attitudes, awareness status and behaviour concerning solid waste
management. Procedia Soc. Behav. Sci., 18, pp. 643–648.
Saer, A., Lansing, S., Davitt, N.H., Graves, R.E., (2013). Life cycle assessment of a
food waste composting system: environmental impact hotspots. J. Cleaner
Prod. 52, 234–244.

86
7 University of Malaya Zero Food Waste Campaign
– A Head Start Norbani Che-Ha1.* and Saad Md Said2
1 Faculty of Business and Accountancy, University of Malaya 2 Faculty of Economics and Administration, University of Malaya
*Corresponding author: [email protected]
Abstract This paper is part of the bigger project on UM Zero Food Waste Campaign
2016/2017. This project is made possible by a grant from Sustainability Science
Cluster-UM Living Labs. The objectives of the paper are to understand and
collect data on drivers of food waste, train canteen operators on food waste
management and disseminate knowledge and awareness on food waste. Results
indicate that most participants have a very limited knowledge on the impact of
food waste on environment, economy and society. Many of them do not
understand the benefits of food waste separation. Data collected from the
project show details of resources used at three stages of food preparation – daily
product purchase, food preparation and food selling. The data will assist in
reviewing the CO2 emission and areas that can be improved in the near future.
Several promotional tools such as bunting, book marks, pamphlets and stickers
are distributed to UM communities to create an awareness on food waste.
Recommendations on future actions are outlined at the end of the paper.
Keywords Food Waste, Food Separation and Reduction, Consumption Patterns, Living Lab,
Eco Campus.
Introduction Food and Agriculture Organization of the United Nation (FAO) reported that
around the world there are about 1.3 billion tonnes of food that is lost or wasted
every day. That is equivalent to 33 percent of the world food produced. In
Malaysia, out of 38,000 tonnes of daily waste, 45 percent are food waste; and 20
percent or 3,000 tonnes of the food waste are edible or leftover food (The Star,
2016).

87
The alarming statistics stated above cause a concern to societies in general. This
can be seen on several communications such as, in print publications, programs
and campaigns on food waste across countries. In Malaysia, the government has
started many programs, in fact The Solid Waste Management and Public
Cleansing Corporation (SWCorp Malaysia) was established to create awareness
and provide a platform for waste reduction and recycling in the country. It is
also to oversee and implement The National Solid Waste Management Policy
that is aimed to create a sustainable society.
In line with such efforts, University of Malaya (UM) started to focus on food
waste reduction in creating a zero food waste community. This effort is in
tandem with University of Malaya Eco-Campus Blueprint that has given emphasis
on 8 core pillars – landscape management and biodiversity, waste management,
water governance, energy management, transportation system management,
green procurement, educational management – environment and climate change
and change management, participation and communication. Food waste is an
important sub element of waste management.
As such, this paper is to share some of the objectives set for UM Zero Food
Waste Campaign. There are a number of activities that are carried out for the
project but as stated, the objectives of this paper are specifically to:
1. understand and build food waste data for UM. In doing so, the project
will examine drivers of food waste i.e. sources of food waste,
consumption patterns and behaviors;
2. train canteen operators on waste management; and
3. disseminate knowledge and awareness on food waste.
Understanding Food Waste
It is understood that food waste occurs at every phase of the food system starting
from harvesting, processing to transportation, consumption and disposal.
Consumption that links to consumer sector is reported to be the biggest
contributor of food waste (Griffith et al., 2009). As such many relate food waste
to food that is discarded at retail or final consumption. Parfitt et al., (2010:3065)
defines food waste as the “wholesome edible materials intended for human
consumption, arising at any point of the food supply chain that is discarded, lost,
degraded or consumed by pests.”
Many literatures differentiate between food waste and food loss. Food loss is a
loss of the nutritional quality of the food (Slowfood, 2015). It is elaborated as
“food that spills, spoils, incurs an abnormal reduction in quality such as bruising
or wilting, or otherwise gets lost before it reaches the consumer” (Lipinski et al.,
2013:1). In this study, no differentiation is made between the two terms. Mainly
due to the argument that regardless food is wasted or lost, all of them incur large
amount of resources such as time, money and energy.

88
Type of food waste
Similar to definition of food waste, types of food waste also differ in their
classification. For this study, food waste is categorized as edible and inedible.
Edible or avoidable food waste, food that can be eaten before being thrown away,
can be further classified based on its origins such as kitchen waste, service waste
and customer leftovers (Silvennoinen, Heikkilä, Katajajuuri and Reinikainen, 2015;
Thyberg and Tonjes, 2016).
Kitchen waste is mostly from food preparation stages. This waste comes from
overproduction, peeling, cutting, expiration, spoilage and overcooking. Service
waste, on other hand, contributes from over production/large portion, lack of
food preparation skills, spoilage/food not used in time and sensitivity to food
safety (Thyberg and Tonjes, 2016). Buffet leftover, excess food that has been
prepared but not consumed and later discarded, is also part of the service waste.
The third classification of edible food waste is customer leftover. This is food
that is discarded after it has been sold or served to customer.
On the contrary, inedible or unavoidable food waste refers to food that is not
usually eaten such as, banana skins, vegetable peelings, apple cores, egg shells,
bones, coffee grounds and tea bags. In the United Kingdom, it is reported that
25% of inedible food waste is from vegetable and fruits peelings (Wrap, 2008).
Impacts of food waste
i) Economy
Sustainability of the economy, environment and society is the major issues for
food waste. For instance, the world throws away 1.6 billion tonnes of produce
per year value at USD1 trillion (Goldenberg, 2016). Waste & Resources Action
Programme (WRAP) also indicates that in the United Kingdom,
“…avoidable household food we throw away each
year:
Fresh fruit and vegetables: £2.6billion/1,200,000
tonnes.
Bakery: £860 million/450,000 tonnes.
Home-made and pre-prepared meals: £2.1
billion/440,000 tonnes.
Dairy and eggs. Includes milk thrown away from
the fridge and leftovers from serving too much
(e.g. breakfast cereals): £780 million/420,000
tonnes. £290million worth of milk is thrown away
and over 90% of this is in amounts of 50g or more
= about quarter of a glass each time” (Wrap, 2008:
10)
Whereas, United States Environmental Protection Agency (2014) states that the
economic value of food waste in the USA is at USD161 billion per year. Thirty
89
six (36) million tonnes are generated by restaurants, stores and household. Only
5% ended up at composting facilities.
In Malaysia, even there is no estimated figure available on the amount of food
waste, it is reported that MYR225 value of food is wasted by a family of five per
month. That is about MYR2700 per year per family. The amount is more than
the mean income of MYR2400 per month for city dwellers (Bakri, 2016).
The discussions on economic impact above do not include obligation spent for
waste management i.e. management and maintenance of landfills, transportation
and others. In the UK it is estimated that USD450 million per year is spent on
collecting and treating food waste whereas it costs USD1.5 billion in the USA
(Wrap, 2008). The amount spent on managing waste is so substantial mainly due
to poor planning and attitude of the populations.
With all of those food wasted and large amount of spending on waste
management, there are still a large number of populations that are struggling to
put food on their table, hungry and malnourished. Almost a billion of world
population is undernourished. In the USA, 5-10% of their populations do not
even have enough food to eat (Goldenberg, 2016).
ii) Environment
Food waste is associated with large emissions of greenhouse gases and wasteful
use of resources such as water, agriculture land, fertilisers and fuels (Kummu et
al., 2012). Greenhouse gases such as methane and nitrous oxide are a result
from food waste. Food waste is biodegradable and degrades faster than other
landfilled organic materials (Levis and Barlaz, 2011). In landfills, food waste
converts to these gases particularly the highly toxic methane gas. This gas
contributes more powerful global warming impact than carbon dioxide.
In addition, the carbon footprint from food waste is enormous. WRAP indicates
that for every one tonne of food waste it is accountable for 4.5 tonnes of CO2.
Venkat (2011) specifies that 112.92 million tonnes of CO2 were generated from
the food system in the USA.
Food waste also uses 1.4 billion hectares of land, that is equal to 30% of world’s
agriculture land area (Slowfood, 2015), and yet forests everywhere are destroyed
mainly to create more agriculture land for crops that will be ended up as food
waste. Gustavsson et al (2011) assert that by wasting food all resources that
were used in the food system not only are wasted but also contribute negatively
to our ecological system.

90
iii) Society
Food waste is a big threat to global food security. It is estimated that by 2050
the world population will grow to 9 billion (Searchinger et al., 2013). With that
number the world requires another 60% or 2 billion tonnes of food to feed the
growing population. With the current amount of food send to landfill and if there
is no behaviour change on food waste, the world will definitely experience food
shortage.
In fact, healthy diet is a major issue in many part of world nowadays. This is due
to many of world populations that do not have access to proper food. Even
worse, a number of people who die because of hunger is reported to be
increasing every day. Searchinger et al (2013) state that unless measures are
taken to reduce the food waste by 50% only then the food gap will be able to
reduce by 20%.
All the above discussions clearly outline the negative impact of food waste. In
that, it is imperative to get public to be aware about the benefits of reducing food
waste. Reducing food waste for instance, is a promising means to gear for better
benefits to the economy, environment and society. It will also lead to a higher
availability of food elsewhere and will improve future food availability for the
growing global population. It is a guarantee of food security for the future
generation. With less money spent on food waste the population will have a
considerable amount of disposable income available for other important uses.
As previously stated the objectives of this paper are to 1) understand and build
food waste data for UM. In doing so, the project will examine drivers of food
waste i.e. sources of food waste, consumption patterns and behaviors, 2) train
canteen operators on waste management; and 3) disseminate knowledge and
awareness on food waste.
Methodology & Results Discussion To meet the objectives of the paper, several approaches are used. For the first
objective, a mix method data collection is applied, and the second objective is
carried out via series of lecture and discussion sessions. For the third objective
several promotional materials are distributed to UM communities mainly to
educate and create awareness on food waste. Results will be discussed based on
these objectives.
Objective One
For the objective 1, qualitative and quantitative data were collected. Qualitative
data was carried out via four focus groups and 28 personal interview sessions
with UM communities. Whereas, quantitative data was carried out via survey
questionnaire. However, for this paper, only results from qualitative data are
reported.
91
Respondents for focus group discussion were grouped based on three categories
i.e. support staff, academic and management staff and students. Thirty
participants (30) were present for the focus group discussions. Standard
questions were used to all different groups of participants. Questions asked
were mainly on their observations on food waste management in UM, awareness
about food waste, pattern of buying food, attitude, challenges, and suggestions
on management of food waste.
Twenty eight (28) personal interviews were carried out with canteen (the term
canteen will be used to represent all food venues in UM) operators to collect
data on stages of food preparation. The data was collected based on three stages
– 1) Daily purchase 2) Daily food preparation (e.g. products used, stored and
discarded (food waste) during the process) 3) Daily food selling (e.g. food
prepared for sale, food sold and not sold).
Results From the discussion with the focus groups, results show that:
1. Majority of participants visit canteens twice a day. Many go to canteens
for their breakfast and lunch. They spent between MYR5-MYR9 per
day at the canteens.
2. More than 80% of the participants acknowledge that they do have
leftovers when they have meals at the canteen. This is due to large food
portion or food taste. They use plastic container provided by the
canteen for takeaway. Many are not willing to bring their own food
containers for their takeaway.
3. More than 85% of the participants do not realise the negative impact of
food waste to the environment and almost 95% of the participants are
not aware of any programs on waste reduction in UM. They also do
not know the reason why food waste and nonfood waste need to be
separated. In fact, many do not know the benefits of composting food
waste.
4. Many notice that some canteens have a sticker on their tables or a
poster asking them to place their plates/spoons/mugs/cups in the
kitchen bins/containers provided but do not know that is meant for food
separation. They though that will make job easier for the canteen
operator to clear or clean the table. They have no knowledge on
instruction to separate food waste and non-food waste. In fact, they do
not know their roles on food waste separation.
5. There are mixed responses received from participants when asked
whether they are willing to put their plates/mug/cups in the kitchen

92
bins/containers provided after their meals. More than 60% indicate they
are not willing to do that, to them the amount they pay is for both food
and services. There are some who are willing to do so provided there
are plenty of kitchen bins/containers provided at several spots in the
canteens. According to them, the containers are always full with
plates/spoons/mugs/cups especially during peak lunch hour.
Those are among responses captured during the four focus group discussions
among support staff, academic and management staff and students in UM. Below
is results on the personal interview.
Tables 1 and 2 show results of data collected via personal interview with 28
canteen operators. Table 1 indicates the first and second stages of daily
purchased and daily product used respectively in food preparation. Whereas,
Table 2 displays the third stage of daily food selling at canteens in UM.
Tables 1 shows that majority of product purchased are meat and poultry (1647
kg). These are the main ingredients used for fried food and curries/gravies/soups
sold in the canteens. They also contribute significantly to food preparation, food
waste and stored with 1390kg, 152kg and 128 kg respectively. Table 1 also
displays food waste (edible and inedible) that is amounted to 528.4 kg a day.
Table 1: Daily Purchase and Food Preparation
Stage 1:
Daily Purchase
Stage 2:
Daily Food Preparation
Products
Products
Purchased
(kg)
Products used
in food
preparation
(kg)
Food waste
during food
preparation
(kg)
Product
stored
(kg)
All kinds of
vegetables 826.5 718.3 135.3 86.5
Dried Cooking
Ingredients 565 437.7 86.5 100
Meat and
Poultry 1647 1390.5 152.5 128
Seafood and
seafood based 470 403 80 54.5
Eggs and Dairy 194 177.7 28.3 22
Fruits 207.5 189 46.1 50.7
Total 3910 3316.2 528.4 441.7

93
Table 2: Food Selling
Table 2 shows the amount of daily food prepared, sold and not sold at UM
canteens. They are at 4382kg, 3968kg and 217.3kg respectively. Rice represents
the biggest number in all three categories of food prepared, sold and not sold
followed by fried food and curries/gravies/soups.
When asked on food that is not sold in a day, many state that most of those food
is recycled or given away to their staff and family members. Many also indicate
that they throw the food away. Out of that, 126kg is recycled or given away and
73.5kg is thrown away per day. Out of the food waste, 538kg is a result of kitchen
waste and 379 kg is waste from consumers’ leftovers.
The data is important for the project not only this is the first time such data are
collected but also will help the calculation of CO2 emission among these
canteens. The data is anticipated to contribute to overall UI GreenMetric and
be able to help identify areas for improvement in the near future.
Objective 2
For the objective two, four series of lecture and discussions on food waste were
conducted. They were held in August, November and December 2016, and Mac
2017. Out of four meetings, 33 canteen operators were present. Six other
canteens never showed up. The meetings with the canteen operators are to
create awareness about the impact of food waste and guide them on the food
Stage 3: Daily Food Selling
Food
Prepared
(kg)
Food
Sold
(kg)
Food Not
Sold
(kg)
Rice 1903 1770.5 72.5
Noodle 358 361 7.5
Fried Food
(Fish/Poultry/Vegetable &
‘Sambal’)
935 874.7 52.8
Curries, Gravies and Soups 592 519 53.5
Local Desert 161.5 132.5 5.5
Drinks: Coffee/Tea and
Juices 324 232 17.5
Fruits 109 78.5 8
Total 4382.5 3968.2 217.3

94
waste separation. During the meetings relevant information from focus groups
were also shared with them.
Results Results of the discussion state that:
1. Majority of them have no knowledge on the impact of food waste on
our environment. They do not know the role that they can play in
dealing with food waste. All wastes are thrown together in a black
plastic bag. Many do not separate food waste and nonfood waste. Many
do not know the benefits of composting food waste.
2. Many of them agree that majority of their customers leave the
plates/spoons/mugs/cups on the table after the meal even though there
is an instruction on the table asking them to put those in the kitchen
bins/container provided. Many regard the instruction as a way to assist
them during peak lunch hour and not so much about food waste
separation. Some of them mention that it is time consuming to separate
food waste and nonfood waste especially at peak lunch hour. They do
not have enough manpower to do so and there is no proper waste
disposal at the canteens.
3. Majority of them acknowledge that they (the operators) are not at their
canteens all the time. The food waste separation will depend on their
staff. Also many of the staff are illiterate foreigners who need to be
taught on the impact of food waste and food waste separation.
4. Many request for a special bin for food waste. The policy now is to get
them to put food waste in any colored plastic bag except black.
In order to get them to start the food waste separation, the project has provided
them with a poster that state clearly the dos and don’ts of food waste as
displayed in Figure 1. It is anticipated that the poster will remind and educate
them on food separation.

95
Figure 1: Instructional Poster on Food Waste Separation
Objective 3
This objective is to disseminate knowledge and awareness on food waste at UM.
After each session with the focus groups and canteen operators the researchers
take time to explain to the participants the impact of food waste, food
separations and many other issues related to food waste. Besides poster as in
Figure 1 that is targeted for canteen operators and their staff, the projects also
come up with several promotional tools such as bunting, pamphlets, book marks
and sticker on food waste to be distributed to UM communities.
Food containers are given to all focus group participants, canteen operators and
to several other people at random. Certificate of appreciation also is provided

96
to canteen operators who attended the meeting. It is a gesture of appreciation
for their cooperation. Figure 2 shows the promotional tools used to meet the
objective 3.
Figure 2: Promotional Tools

97
Discussion and Conclusion
The objectives of the paper are to: 1) understand and build food waste data for
UM. In doing so, the project will examine drivers of food waste i.e. sources of
food waste, consumption patterns and behaviors, 2) train canteen operators on
waste management; and 3) disseminate knowledge and awareness on food waste.
Several points can be concluded from the focus group discussions and personal
interviews with support staff, management and academic staff, students and
canteen operators for the project. First, almost all of them lack knowledge on
the impact of food waste on the environment, economy or society. Most of
them do not know the importance of food waste separation and benefits of
composting. Second, many are reluctant to separate food waste and nonfood
waste at canteens. Customers think that it is not their responsibilities whereas,
canteen operators are not motivated enough to do the separation at their
premises. Third, high turnover rate of canteen operators is a big barrier to
sustainability of zero food waste campaign. This is due to the short contract
lifecycle for most of the canteens. As such, training and information sharing on
food waste management is short lived.
In order for the zero food waste campaign to be a success, an integrated
promotion across campus has to be done continuously. Other initiatives that
can be implemented are informing new students on the important of food waste
reduction and food waste separation during their orientation week. Whereas,
existing students should receive updates on food reduction efforts by UM
regularly via Spectrum or lectures or bulletins. Zero Food Waste Club will be a
good idea for both staff and students. Many activities could be carried out via the
club.
Plastic food container and spoon should be banned from UM. Staff and students
should be encouraged to bring their own food container. As a start we have
given away some food containers to a number of people.
A proper monitoring system also has to be in place especially in ensuring food
waste is separated from nonfood waste. Monitoring could be done with
inspection at canteen premises and merit points should be given to canteen
premises that implement food waste reduction and separation. A stern warning
(demerit points) on the other hand, should be given to those premises that do
not abide by the rule. Renewal of the canteens lease/contract should be based
on these merit points. Support and cooperation from an entity in charge of UM
infrastructure is much needed.
The data collected from the canteens could be used to review the emission of
CO2 since details of the food spending and usage at all stages are available. For

98
canteen operators, the data could assist them to plan their activities at every
stage better. At the last session of the meeting with canteen operators, a similar
table to Tables 1 and 2 were shown to them. Majority of them were surprised
with the amount of resources used and spent at every stage. That is an eye
opener to many of them.
Training and information sharing sessions on food waste reduction and
separation have to be carried out periodically for all canteen operators especially
to the new comers. The training session should include educating them on
waste reduction at every stage of the food preparation.
Acknowledgement This research is made possible by a grant from Sustainability Science Cluster-UM
Living Labs: LL028-16SUS.
References
Bakri, D. (2016, April 9). Research Shows Malaysians Waste Enough to Feed
Millions Daily. The Star Online. Retrieved from
http://www.thestar.com.my/news/nation/2016/05/31/food-and-money-
down-the-drain-research-shows-malaysians-waste-enough-to-feed-millions-
daily/
FAO (1981, April 6). Food Loss Prevention in Perishable Crops. Agricultural
Service Bulletin 43, Rome, Italy. Retrieved from http://www.fao.org/3/a-
ap661e.pdf
Griffith, M., Sobal, J. and Lyson, T.A. (2009). An Analysis of a Community Food
Waste Stream. Agriculture and Human Values, 26(1-2), 67-81.
Gustavsson, J., Cederberg, C., Sonesson, U., Otterdijk, R. van and Meybeck, A.
(2011). Global Food Losses and Food Waste, FAO Report, 38–39.
Goldenberg, S. (2016, April 9). Half of all US Food Produce is Thrown Away,
New Research Suggest. The Guardian. Retrieved from
https://www.theguardian.com/environment/2016/jul/13/us-food-waste-ugly-
fruit-vegetables-perfect
Kummu, M., de Moel, H., Porkka,M., Siebert, S., Varis, O and Ward, P.J. (2012).
Lost food, wasted resources: Global food supply chain losses and their
impacts on freshwater, cropland, and fertiliser use. Science of the Total
Environment, 438, 477–489.
Levis J.W., and Barlaz,M.A (2011). What Is the Most Environmentally Beneficial
Way to Treat Commercial Food Waste? Environment Science Technology,
45 (17), 7438–7444.
Lipinski, B., Hanson, C., Lomax, J., Kitnoja, L., Waite, Ri. and Searchinger, T.
(2013). Reducing Food Loss and Waste. World Resources Institute,
Working Paper.1-39.

99
Parfitt, J., Barthel, M., Macnaughton, S. (2010). Food waste within food supply chains:
quantification and potential for change to 2050, Philosophical Transactions of Royal
Society. B., 365, 3065–3081.
Slow Food (2015, April 6). Position Paper on Food Losses and Waste. Retrieved
from http://www.slowfood.com/sloweurope/wp-content/uploads/ING-
position-paper-foodwaste.pdf
Silvennoinen, K., Heikkilä, L., Katajajuuri, J-M. and Reinikainen, A. (2015) Food
waste volume and origin: Case studies in the Finnish food service sector.
Waste Management,46, 140–145.
The Solid Waste Management and Public Cleansing Corporation (2017, April 6).
Retrieved from www.swcorp.gov.my
The Star (2016, April 7). Malaysians waste 15,000 tonnes of food daily. Retrieved
from http://www.thestar.com.my/news/nation/2016/05/24/malaysians-waste-
15000-tonnes-of-food-daily/
Thyberg, Krista L. and Tonjes, David J. (2016). Drivers of food waste and their
implications for sustainable policy development. Resources, Conservation and
Recycling, 106, 110–123.
United States Environmental Protection Agency (2014, April 7). Food Recovery
Challenge. Retrieved from www.epa.gov/smm/foodrecovery/
Venkat,K. ( 2011). The Climate Change and Economic Impacts of Food Waste
in The United States. International Journal Food System Dynamics, 2(4), 431–
446.
Waste & Resources Action Programme (WRAP) (2008, April 6). Estimates of
Food Surplus and Waste Arisings in the UK. Retrieved from
http://www.wrap.org.uk/sites/files/wrap/Estimates_%20in_the_UK_Jan17.pdf
100
8
Construction Waste Recycling Center for
Sustainable Drainage Construction Hussein Adebayo Ibrahim1 , Soon Poh Yap1.*, Johnson Alengaram1, Kim Hung Mo1
1 Department of Civil Engineering, Faculty of Engineering, University of Malaya,
50603 Kuala Lumpur, Malaysia
*Corresponding author: [email protected]
Abstract In this study, the feasibility of using recycled concrete aggregate (RCA) waste in
the production of pervious concrete for a sustainable construction was
investigated. Materials used include Ordinary Portland Cement, granite and RCA
coarse aggregates. The concrete mixtures were proportioned with a fixed water-
cement ratio (w/c) of 0.3 at a target void ratio of 20%. Tests results indicated
that when natural aggregate (NA); granite was fully replaced with RCA (RCA100)
in the concrete mix, the compressive strength of the concrete reduced by 53%.
However, the obtained strength can be acceptable for applications where the
concrete will not be subjected to vehicular loads. Permeability coefficient of the
concrete with RCA100 showed encouraging results. Also, surface properties of
the concrete showed positive results where the skid resistance for RCA100
exceeded the minimum value for British pendulum test. Meanwhile, the concrete
resistance to abrasion increased by 29% with the RCA100 replacement.
Furthermore, greenhouse gas and cost evaluation of RCA100 concrete indicated
that RCA is a sustainable concrete material. Cost savings of 31% was recorded
with the use of RCA100 and carbon emission reduced by 16% with respect to
NA concrete mix. Consequently, RCA serves as a sustainable alternative
concreting material for NA in pervious concrete production.
Keywords
Eco-campus, Living Lab, Recycled concrete waste, Cost savings, CO2 reduction,
sustainable construction

101
Introduction In recent time, sustainability has become a central point in the life cycle of most
practice worldwide. In line with this, research on construction industry and its
impact on the environment is increasing and gaining global attention. Currently,
it has become a trend that the construction industry is now focusing on recovery
of usable waste materials from construction (Ibrahim & Abdul Razak 2016;
Rodriguez 2016) which is due to the amount of construction and demolition
waste material contributing to environment pollution and the rate at which
natural aggregates are depleting because of the urban development (Rodriguez
2016; Zhang 2017). The construction industry generates over 900 million tonnes
of waste per year in Europe (Malia 2013; Bravo 2015; Sadati 2016). This is around
25% to 30% of all waste produced. Construction and demolition waste (CDW)
has the potential to serve as aggregate replacement in concrete production
(Lokuge 2013, Tam 2016). Utilizing CDW as recycled aggregate will not only
provide solution for reducing landfill volume and environmental pollution but
also increase the ‘points’ for the green building index. Meanwhile, the inert nature
of CDW means that its importance is downplayed despite the large volumes of
CDW available. Utilizing non-degradable wastes as recycled aggregates is an
economical and environmental friendly measure towards a sustainable
construction (Su 2015). Most studies on the environmental impact indicators,
including life cycle assessment, has indicated that concrete containing CDW in
the form of recycled concrete aggregate (RCA) has better environmental
behaviour compared with the traditional concrete containing natural aggregates
(Sorres 2016; Gayerre 2016; Salesa 2017). Also, Poon and Chan (2006) study on
concrete pavement blocks using blended aggregates from RCA and crushed clay
brick indicated that the concrete is suitable for pedestrian paths and trafficked
areas. Despite the available research indicating the successful use of RCA in
concrete, its use in pervious concrete is limited.
Pervious concrete has attracted global attention in concrete industry due to the
increased awareness of environmental protection (Shu 2011). This concrete is a
special category of sustainable concrete whose components are mainly graded
coarse aggregates with or without minimum amount of fine aggregates, and
designed with cement content sufficient enough to provide an optimal coating
around the aggregates (Chandrappa 2016). It is being widely used in various
number of civil engineering and architectural applications such as in park areas,
areas with light traffic, pedestrian walkways and tennis courts. The desired
application of the concrete determines its design compressive strength. A design
compressive strength in the range of 10MPa to 13MPa is preferred for parking
lots, stone protection, drainage pavement, as well as precast porous concrete
products and lower strength can be accepted in situations where the concrete
will not be subjected to vehicular loads (Ibrahim & Abdul Razak 2016). Due to
the very thin cement paste binder layer of pervious concrete, the strength of the
concrete majorly depends on the strength of aggregate type used (J. Yang, G.
Jiang 2003, Ibrahim & Abdul Razak 2016, Yuwadee Zaetang et al 2016). RCA has

102
similar properties to natural aggregate which justifies why its application in
pervious concrete production is feasible.
Most of the past studies on pervious concrete are economical unviable due to
high cement content, use of expensive admixtures and necessity of special
compaction method. However, this study focuses on the use of RCA in pervious
concrete production towards a sustainable environment with a main priority of
minimizing cost. A target void ratio of 20% with different level of RCA has been
selected for the purpose of the study. The engineering properties of the concrete
investigated include permeability coefficient, compressive strength, skid
resistance and abrasion resistance. This study will further evaluate the cost and
green performance of the concrete.
The key properties of the end product in this study, is that the developed RCA-
based pervious concrete was prepared with minimized costs (cement and virgin
aggregate content, aggregate treatment, and compaction method) and maximised
environmental advantages. In pervious concrete, the main component is coarse
aggregate while the amount of cement paste is kept minimal (360 kg/m3 cement
and w/c ratio 0.35). Hence, in this research, the coarse aggregates were replaced
by up to 100% RCA in order to maximize the waste recycling in the mixture
proportions of pervious concrete. Furthermore, no admixture or any treatment
was used in this study to reduce the cost because plasticizer is costly compared
to other materials and treatment processes result in additional energy
consumption. Thus, no RCA treatment was utilized in this work in order to
further reduce the negative environmental impact from materials. Finally, a
standard concrete compaction method with a shorter compaction time is
adopted, while other studies on pervious concrete utilized roller compaction
which consumed more energy. Therefore, the developed pervious concrete
paves way for the environmental friendly pavement materials for potential
applications including footpath and vehicle-trafficked roads.
Experimental program i) Materials used:
The main materials used in the production of RCA pervious concrete (RCAPC)
for this study is cement, water, natural aggregate and recycled concrete
aggregate. Table 1 presents the physical properties of both coarse aggregates
used. Ordinary Portland cement (OPC) with 3.13 and 3450 cm2/g specific gravity
and specific surface area respectively was adopted. The RCA was obtained by
crushing the concrete wastes with a jaw crusher machine as shown in Fig. 1a. On
the other hand, granite with same size as the RCA (Fig. 1b) was used as natural
aggregate. Meanwhile, in order to minimize the production cost of the RCAPC,
no prior treatment was done to remove the adhered mortar on the RCA.

103
Table 1: Physical properties of aggregates used
Figure 1: (a) Recycled coarse aggregates, (b) natural granite aggregates
ii) Mixture proportions:
Two mix mixture proportions were prepared: pervious concrete containing
natural aggregate represents the control mix (labelled as NA mix) while the other
mix contains 100% RCA (labelled as RCA100 mix). A design void ratio of 20%
was adopted at a constant amount of cement (360kg/m3). The pervious concrete
was produced in a rotary drum mixer in the following sequence: first, coarse
aggregates were dry-mixed for 3 minutes and it was further mixed for 5 minutes
with the addition of cement. Once the mixture was homogenous, water was
gradually added while mixing continued for 3 minutes and then the mixture was
allowed to rest for 3 minutes. During the rest, the consistency ball-in-hand test
(ASTM C860-15) was done. Once the consistency requirement was achieved,
the concrete mixture was then allowed to mix for 2 minutes. Finally, fresh
concrete was poured into the specimen moulds and vibrated in 2 layers. A trowel
was used for a finer surface finishing and the concrete was covered with plastic
Properties Recycled Coarse
Aggregate (RCA)
Natural
Aggregate (NA)
Bulk density (kg/m3) 1243.1 1433.1
24h water absorption (%) 8.05 3.50
Specific gravity 2.32 2.65
Aggregate Impact Value, AIV
(%) 5.28 1.67
Aggregate Crushing Value,
ACV (%) 24.5 15.4

104
bags to prevent water evaporation. After 24 hours, the concrete specimens were
demoulded and cured in water until the testing age.
Results and discussion A) Mechanical properties
Mechanical properties are an important aspect of concrete which must satisfy
existing standards. The compressive strengths were tested at the age of 1, 7, and
28 days, while others were tested at the age of 28 days. The concrete properties
were taken as the average values of three specimens. Meanwhile there is no
standard method for testing permeability coefficient in the laboratory. Thus, the
falling head permeability test which was modified by Neithalath et al. (2010) and
Ibrahim and Abdul Razak (2016) was adopted. The setup can be seen in Figure 2.
Figure 2: Falling head apparatus for permeability test
i) Compressive strength
Compressive strength of the concrete is one of its most important parameters.
As such, 100mm cubes were prepared for the purpose of this test which was in
accordance with (BS EN 12390:2009). Fig. 3 shows the compressive strength
evolution obtained for the concrete. At 28 days, compressive strength obtained
for the control pervious concrete and RCA100 were 11.24MPa and 5.5MPa
respectively. Incorporation of RCA reduced the compressive strength of the
concrete by about 53%. This is expected based on past studies which has

105
indicated strength loss due to RCA presence in the concrete mix. For instance,
a similar outcome was reported by Rizvi 2010 whereby full incorporation of RCA
recorded a 49% loss in strength. Additionally, comparison between the cement
aggregate bond of NA and RCA100 as seen in Fig. 4 reveals that there is more
cement paste between the bond for the NA compared to the RCA100 concrete
samples. This suggests that the RCA100 concrete will fail faster under
compression load compared to the NA concrete. The strength of paste and
aggregate as well as void ratio influences the compressive strength of a pervious
(P Chindaprasirt et al., 2008). However, since void is kept constant in this study,
the strength of paste and aggregate contributed to the strength loss. Table 1
shows that AIV and ACV of normal aggregate is better than that of RCA. This is
because RCA is a weaker aggregate due to cracks induced during the process of
crushing (Zhang 2017). Although RCA100 may appear to be weaker than NA
concrete, the reduced strength may be acceptable for applications such as
pedestrian walkways since the concrete will not be subjected to vehicular loads
(Ibrahim & Abdul Razak 2016).
Figure 3: Compressive strength development for NA and RCA100 mixes
0
2
4
6
8
10
12
0 5 10 15 20 25 30
Co
mp
ress
ive
stre
ngth
(M
Pa)
Age
NA RCA100

106
(C)(B)
Figure 4: Comparison between the physical appearances and aggregate-cement
paste bonding for cubes specimens from NA and RCA100 mixes
ii) Permeability
Due to the ability of pervious concrete to allow water pass through its
microstructure, the concrete stands out among other concrete types. Thus,
water permeability is seen as a major index for evaluating the performances of
pervious concrete. Table 2 shows the permeability coefficient for the NA and
RCA100 mixes obtained from falling head permeability test. Permeability
coefficient for the NA and RCA mix recorded are 16 mm/s and 23.78 mm/s
respectively. It can be seen that water penetration increased about twice as much
when RCA100 was used. Permeability is dependent on the porous network and
the pore size of the concrete (Ibrahim & Abdul Razak 2016). Some studies have
defined active voids that allow water through the concrete matrix as effective
porosity (Montes et al, 2005, Kevern et al 2010, Ibrahim 2014). Meanwhile, voids
which do not allow fluid flow are identified as inactive voids. Such voids are
isolated from other voids and have no effect of permeability, rather they influence
other properties such as compressive strength of the concrete. Based on visual
inspection, Fig. 4 revealed that effective porosity of the RCA100 is higher than
the NA concrete which suggests that RCA100 concrete permeability would be
higher than the NA concrete. Thus, the RCA100 concrete allowed water to
infiltrate faster than NA concrete at the same target void as seen from visual
inspection in Fig. 5. Although the strength value was reduced as a result,
nevertheless, the RCA100 concrete strength is acceptable for its proposed
application.

107
Table 2: Permeability and surfaces properties of all mixes
Mix
Permeability property Surface properties
Permeability
coefficient,
k (mm/s)
Increment /
decrement
relative to
NA mix
Skid
Resi
stan
ce
(BPN
)
Incr
em
ent/
decr
em
ent
rela
tive
to N
A
mix
Abra
sion
resi
stan
ce (
%)
Incr
em
ent/
decr
em
ent
rela
tive
to N
A
mix
NA 16.00 - 86 - 40.42 -
RCA100 23.78 +49% 93 +8% 52.33 +29%
Figure 5: Water infiltration for RCA (left) and NA (right) concrete mixes
B) Surface properties:
Beside fulfilling its mechanical properties, it is important that the concrete meets
up with the long-term durability requirements. Two tests were conducted to
evaluate the surface properties for both mixes: skid and abrasion resistance
complying with (ASTM E303-93) and (ASTM C1747/C1747M-13). Both tests are
important to evaluate the safety and durability aspects of pervious concrete for
pavement purposes.
i) Skid resistance
Table 2 presents the skid resistance result for NA and RCA100 concrete
samples. Both concrete mixes achieved above the minimum requirements for
RCA100 NA

108
the British pendulum skid test of 65 for difficult sites. This is expected due to the
rough nature of a pervious concrete surface when compared to a conventional
dense concrete with a smooth surface. However, RCA100 concrete showed
higher resistance than the NA concrete sample. This could be as a result of the
shape and texture of RCA. Fig 1 reveals that a huge amount of cement mortar
was adhered to the RCA outer layer which makes it rough since no treatment
was done to the RCA in order to save cost. The results obtained with the
RCA100 concrete sample are encouraging in terms of the potential when it
comes to skid resistance.
ii) Abrasion resistance
Abrasion resistance of concrete generally depends upon its compressive
strength, surface finishing, hardness at surface zone of the concrete, paste-
aggregate bond and curing method (Prinya Chindaprasirt et al., 2015). Due to
the reduced compressive strength, presence of voids which makes paste-
aggregate bond vulnerable, it is expected that mass loss under abrasion impacts
abrasion would be high compared to conventional dense concrete. The NA and
RCA100 concrete mix had around 40% and 50% mass loss respectively. Adhered
mortar contributes to the bad properties of recycled aggregates (De Juan 2009),
which could have worsened the RCA100 concrete resistance to abrasion
compared to the NA concrete. Also,
C) Economic and sustainability efficiency
i) Cost evaluation
The approximate prices of some concrete materials and total production cost
for NA as well as RCA100 concrete is presented in Table 3 and 4 respectively.
It should be noted that the RCA used was obtained as a final by-product and it
was used directly for all the concrete mixes without additional processing in
order to save cost. Thus, the acquisition cost for the RCA was considered to be
at the minimum level of zero.
Table 3: Cost of concrete materials by weight (RM/kg) (Kanadasan, J., & Razak,
H. A.,2015)
Materials Cost (RM/kg)
Cement 0.440
Granite 0.055
RCA -
Sand 0.080

109
Table 4: Cost comparison for Normal concrete, NA and RCA pervious
concrete mixture proportions
Materials
(kg/m3)
Normal concrete NA RCA100
Cement 405 359 359
Granite 1690 1300 -
Sand 1250 - -
RCA - - 1484
Total cost
(RM/m3) 1271.15 229.46 157.96
It can be seen from Table 4 that there is a notable reduction in cost with the
RCA100 mix compared to the NA concrete mix. Utilization of RCA significantly
reduced the cost of the concrete by 31%. This reduction provides a positive
economic contribution in terms of cost. Additionally, comparing the cost
reduction of RCA100 to normal concrete (Grade 30) shows an even larger
positive cost savings of about 87%. This notable cost savings is due to the reduced
amount of cement content and no fine aggregate of a pervious concrete. Based
on this, there is no doubt that RCA pervious concrete is more economical in
long term than using normal concrete. Due to the zero-cost inquisition of RCA,
the concrete maintenance cost would be lesser than the normal grade concrete
whereby RCA pervious concrete can be easily replaced at reduced cost. This
ensures longer life span at reduced cost. Fig. 7 shows a typical concrete pavement
and a RCA pervious concrete. Additionally, the net benefit of reusing and
recycling of waste materials is estimated at 2.5% of the total project budget
(Begum, R.A., et al 2006). Thus, the construction industry can save money
through the implementation of using RCA in concrete production especially for
pervious concrete.
Figure 7: Typical concrete samples for (a) Normal grade and (b) RCA100
concrete pavement

110
ii) Greenhouse gas (GHG) evaluation
CO2-e emission factors used in the study is based on the Australian National
Pollutant Inventory Emission Estimation Technique Manual for Mining Version
2.3 (Commonwealth of Australia 2001). Carbon emission factors for concrete
making material is presented in Table 5. Meanwhile, the demolition and recycling
carbon emission factor for RCA is presented in Table 6. Fig. 8 shows carbon
emission for the NA and RCA100 concrete mixes. As seen from Fig. 8, there is
an incentive to use RCA as NA replacement in pervious concrete production.
Significant carbon emission reduction of 16% was achieved when RCA fully
replaced NA in the concrete mixture. Table 6 shows that carbon emission factor
for granite is higher than that of obtaining RCA. This is because RCA will be
manufactured on-site using portable equipment and re-used in the construction,
thereby minimizing CO2 emissions resulting from transportation to/from a
recycling plant. Whereas, manufacturing and transportation process of NA to
the construction site is subjected to a more energy consuming process which
generates more carbon emission (F. Collins, 2010)
Figure 8: Carbon emission for NA and RCA100 concrete mix
Table 5: CO2 emission factors evolved from manufacturing of concrete making
materials and construction activities (F. Collins, 2010)
Concrete making material Emission factor (t CO2 e/tonne)
Ordinary Portland cement (OPC) 0.82
Coarse aggregate (granite) 0.0459
0.3
0.32
0.34
0.36
0.38
0.4
0 100
Car
bon e
mis
sion (
tCO
2e/m
3)
RCA content (%)
Carbon emission

111
Table 6: CO2 emission factors due to demolition and recycling (F. Collins, 2010)
Activity Emission factor (t CO2 e/tonne)
Demolition (mobile rock breaker) 0.00054
Primary jaw crushing 0.00020
Secondary crushing (granite only) 0.00060
Screening 0.00008
Loading stockpiles 0.00006
Conclusions This study investigates feasibility of using RCA in producing a sustainable pervious
concrete. The following conclusion can be drawn from the experimental
investigation:
1. Incorporating RCA to fully replace NA in the concrete mix affected
the mechanical properties of the concrete. Compressive strength
obtained was 5.5MPa and 11.4MPa for the RCA100 and NA
concrete mixture respectively. As such, a loss in strength of 53%
was recorded as NA was fully replaced with RCA. Although the
RCA100 compressive strength is reduced, it can be however
accepted for applications where the concrete pavement will not be
subjected to vehicular loads. Meanwhile, permeability coefficient of
the RCA100 was higher than the NA concrete pavement by 49%
because of the better effective porosity of the RCA100.
2. Surface properties of the RCA100 concrete showed encouraging
results. The skid resistance obtained for NA and RCA100 concrete
were 86 and 93 which exceed the minimum requirement for British
pendulum test. However, RCA100 mass loss under abrasion impact
increased by 29% with respect to NA concrete.
3. RCA100 showed promising results in terms of economic and
sustainability efficiency of the concrete. The cost of production of
RCA100 is 31% lesser than that of NA concrete because of the
zero value of RCA. Meanwhile, GHG emission reduced by 16% with
the use of the RCA in the concrete mixture.
4. RCA can serve as alternative sustainable concreting material in
construction without compromising the engineering properties of
the concrete.

112
Acknowledgments This research work was funded by the University of Malaya Living Lab Grant
Programme under the project LL027-16SUS (Construction Waste Recycling
Center for Sustainable Drainage Construction).
References Begum, R. A., Siwar, C., Pereira, J. J., & Jaafar, A. H. (2006). A benefit–cost analysis
on the economic feasibility of construction waste minimisation: The case
of Malaysia. Resources, Conservation and Recycling, 48(1), 86-98.
doi:10.1016/j.resconrec.2006.01.004
Chindaprasirt, P., Nuaklong, P., Zaetang, Y., Sujumnongtokul, P., & Sata, V. (2015).
Mechanical and Thermal Properties of Recycling Lightweight Pervious
Concrete. Arabian Journal for Science and Engineering, 40(2), 443-450.
doi:10.1007/s13369-014-1563-z
Collins, F. (2010). Inclusion of carbonation during the life cycle of built and
recycled concrete: influence on their carbon footprint. The International
Journal of Life Cycle Assessment, 15(6), 549-556.
Commonwealth of Australia (2001) Emission Estimation Technique Manual for
Mining—National Pollutant Inventory Version 2.3. Department of Climate
Change, Canberra.
Dean, S. W., Kevern, J. T., Wang, K., & Schaefer, V. R. (2009). Test Methods for
Characterizing Air Void Systems in Portland Cement Pervious Concrete.
Journal of ASTM International, 6(9), 1024-1051. doi:10.1520/jai102451.
Ibrahim, A., Mahmoud, E., Yamin, M., & Patibandla, V. C. (2014). Experimental
study on Portland cement pervious concrete mechanical and hydrological
properties. Construction and Building Materials, 50, 524-529.
Kanadasan, J., & Razak, H. A. (2015). Engineering and sustainability performance
of self-compacting palm oil mill incinerated waste concrete. Journal of
Cleaner Production, 89, 78-86
Lokuge, W., & Aravinthan, T. (2012). Mechanical properties of polymer concrete
with different types of resin. From Materials to Structures: Advancement
through Innovation, 1147-1152. doi:10.1201/b15320-204
Montes, F., Valavala, S., & Haselbach, L. M. (2005). A new test method for
porosity measurements of Portland cement pervious concrete. Journal of
ASTM international, 2(1), 1-13.
Yang, J., & Jiang, G. (2003). Experimental study on properties of pervious
concrete pavement materials. Cement and Concrete Research, 33(3), 381-
386. doi:10.1016/s0008-8846(02)00966-3
Zaetang, Y., Sata, V., Wongsa, A., & Chindaprasirt, P. (2016). Properties of
pervious concrete containing recycled concrete block aggregate and
recycled concrete aggregate. Construction and Building Materials, 111, 15-
21. doi: 10.1016/j.conbuildmat.2016.02.060

113
9
Real-time and Automated Traffic Data Inventory
and Monitoring System (TDIM) Ahmad Saifizul Abdullah*, Rahizar Ramli and Farah Fazlinda Mohamad
Department of Mechanical Engineering, Faculty of Engineering, University of
Malaya, Malaysia
*Corresponding author: [email protected]
Abstract Intelligent Transportation System (ITS) are advanced applications which aim to
provide innovative services relating to different modes of transport and traffic
management and enable various users to be better informed and make safer,
more coordinated, and smarter use of transport networks. This project
demonstrates the implementation of a pilot real-time and automated Traffic Data
Inventory and Monitoring (TDIM) system as part of building ITS capacity at
University of Malaya campus. The main advantages of this system are that it
incorporates the concept of Internet of Thing (IoT) and Big Data Analytic (BDA)
to quantitatively measure the traffic congestion and its contribution to CO2
emissions. Based on data collected by TDIM system, the study revealed that:
1. The average travel time during congestion is six-fold than during smooth
traffic
2. Consistent congestion pattern during week day
3. A lot of cars take the shortcut (bypass) through the campus to avoid
the agglomeration from the main street
4. Monthly accumulated CO2 emission from transport activities on
selected main corridor is estimated to be more than 230 tonne/km
In conclusion, this pilot system provides meaningful data which can be used for
analysing and monitoring present transport activity and its CO2 emissions in the
campus. In addition, the pilot system can also provide useful information such as
congestion status within the campus to authority in-charge and public at-large.
The data can also be used by authority in-charge to design appropriate mitigation
strategies in alleviating the problems of traffic congestion and carbon emission to
help make this campus a world class institution.

114
Keywords Carbon emission, congestion measure, traffic congestion, travel time, traffic
monitoring system, intelligent transportation system, Living Lab, Eco-campus
Introduction Population growth, economic development and changes in land use have
combined to produce steadily increasing levels of traffic congestion. The trend is
expected to continue and worsen, resulting in increased hours of congestion
delays on the roadway system, increased costs to taxpayers and motorists, and
increased air pollution. Intelligent Transportation Systems (lTS) are a set of
solutions to improve transportation efficiency and safety. Previous studies have
proved that the implementation of ITS technologies can alleviates traffic
congestion, enhances energy saving and reduces the emissions of vehicles. A
prerequisite for ITS implementation is the collection of timely and accurate data
about traffic and road conditions. This project presents the development and
implementation of a real-time and automated wireless Traffic Data Inventory and
Monitoring System (TDIM) as part of building ITS capacity at University of Malaya
campus.
When the university campus was built the road infrastructure was designed for
a very small numbers of cars. Over time technology has advanced and the
number of vehicle has risen. In Malaysia, the numbers of passenger car population
per 1000 people increased from 268 in year 2005 to 409 in year 2014. A
significant increase of 40 to 50%. It is expected in year 2020, there will be about
548 passenger car population per 1000 people (Frost & Sullivan 2016, ASEAN
Transport Situation and Solutions Outlook, 2020). Figure 1 shows the increasing
registered vehicles year-to-year in Klang Valley as well as in Malaysia expected
to continue and worsen the congestion situation in the future.
Traffic congestion is a supply management problem where it occurs when there
is high demand (i.e. drivers) with limited supplies (i.e. in terms of road capacity).
Traffic volume has increased faster than road capacity, congestion has gotten
progressively worse despite the push toward alternative modes of
transportation, new technologies, innovative land-use patterns, and demand-
management technique. Failure to take significant steps now to relieve current
congestion and to prevent worsening congestion is a real threat to many
stakeholders. Hours lost in traffic results not only in decreased productivity but
also impacts the quality of life of UM’s families as it shown in Figure 2.

115
Figure 1: Total Motor Vehicles (Source: Road Transport Department)
Figure 2: Congestion inside UM’s Campus

116
Monitoring congestion is just one of several aspects of transportation system
performance that leads to more effective investment decisions for transportation
improvements.
Thus, understanding who is using the road, where they are going and whether
they just get there on time is essential for policymakers, traffic manager and
drivers alike.
By introducing a monitoring system for travel time, the public should be able to
plan ahead their journey and work out the best time to travel, and thus,
distributing traffic on the mainline. The proposed concept starts by automatically
measuring the traffic conditions in real-time and provide specific and accurate
statistical information on the use of the road network, enabling traffic engineers
to understand various traffic-related matters such as congestion patterns and
historical information. Using the information collected, the authority in charge
will be able to efficiently distribute traffic and prevents vehicles from converging
at the same locations and time which contribute to traffic congestion on the
mainline.
In addition, monitoring congestion can also lead to lower CO2 emission that is
caused by acceleration and deceleration that is associated with the stop-and-go
traffic that exists during congested conditions.
The current project aims to accomplish the following objectives:
1. To implement a pilot Traffic Data Inventory System (TDIM) system in
UM’s campus which can provide a real-time, accurate, and reliable travel
time data continuously 24 hours 7 days throughout the year.
2. To refine and finalize the system based on the key functionality required
by internal stakeholders to support the identified needs.
3. To provide meaningful traffic data and information in UM campus from
the proposed TDIM system so the traffic characterization such as traffic
pattern, congestion measure and estimated CO2 emission from
transport sector can be quantified.
Methodology This project introduces a real-time and automated Traffic Data Inventory and
Monitoring System (TDIM) that focuses on acquire travel time data between
specific locations within the campus. The system is equipped with sensors to
detect, track and locate smartphones anonymously using wireless signatures that
smartphones periodically transmit via Bluetooth and Wi-Fi. These sensors have
been installed at four locations which they are Kuala Lumpur’s gate (KL Gate),
Petaling Jaya’s gate (PJ Gate), in front of Dewan Tunku Canselor (DTC) and, near
Damansara’s gate as shown in Figure 3.
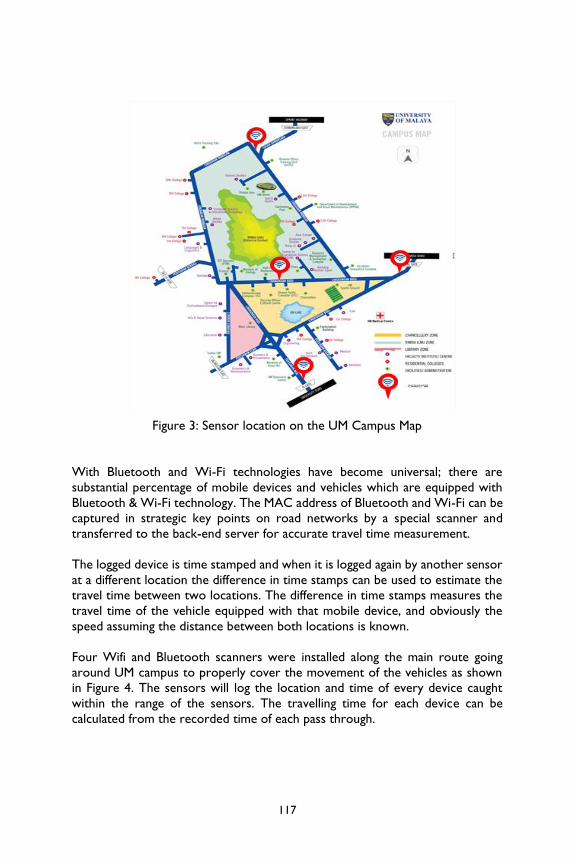
117
Figure 3: Sensor location on the UM Campus Map
With Bluetooth and Wi-Fi technologies have become universal; there are
substantial percentage of mobile devices and vehicles which are equipped with
Bluetooth & Wi-Fi technology. The MAC address of Bluetooth and Wi-Fi can be
captured in strategic key points on road networks by a special scanner and
transferred to the back-end server for accurate travel time measurement.
The logged device is time stamped and when it is logged again by another sensor
at a different location the difference in time stamps can be used to estimate the
travel time between two locations. The difference in time stamps measures the
travel time of the vehicle equipped with that mobile device, and obviously the
speed assuming the distance between both locations is known.
Four Wifi and Bluetooth scanners were installed along the main route going
around UM campus to properly cover the movement of the vehicles as shown
in Figure 4. The sensors will log the location and time of every device caught
within the range of the sensors. The travelling time for each device can be
calculated from the recorded time of each pass through.

118
Figure 4: Installation of sensor at road side
Many tests have been conducted for evaluating the performance of the system,
which covers various road conditions, vehicle speeds, and traffic situations. The
aim of the performance test is to show the effectiveness and robustness of the
fully developed system, together with the reliability and accuracy of the data.
Results The combined and analysed data is presented in a web-based, intuitive user
interface, with graphs and dashboard views, including interactive map views. The
web user interface includes all the necessary information to help traveller plan
their route and timing for their journey. Figure 5 shows the dashboard to show
the updates of the traffic within the observed area. The travel time from each
location to the other can be seen clearly while the traffic condition will also be
shown to easily inform the user in real time.
Figure 5: Web user interface of TDIM system

119
On the other hand, the result obtained can also show other information that
could be of use to the administrative user such as understanding the flow and
redirecting traffic based on historical data. Figure 6 shows the distribution of
travel time, delay and travel time index (TTI) based on the traffic flow condition
for each day of the month. The data shows a variation in travel time for congested
flow in a one-month period.
Figure 6: Congestion measures for the Month of March 2017 from DTC to KL
Gate Route
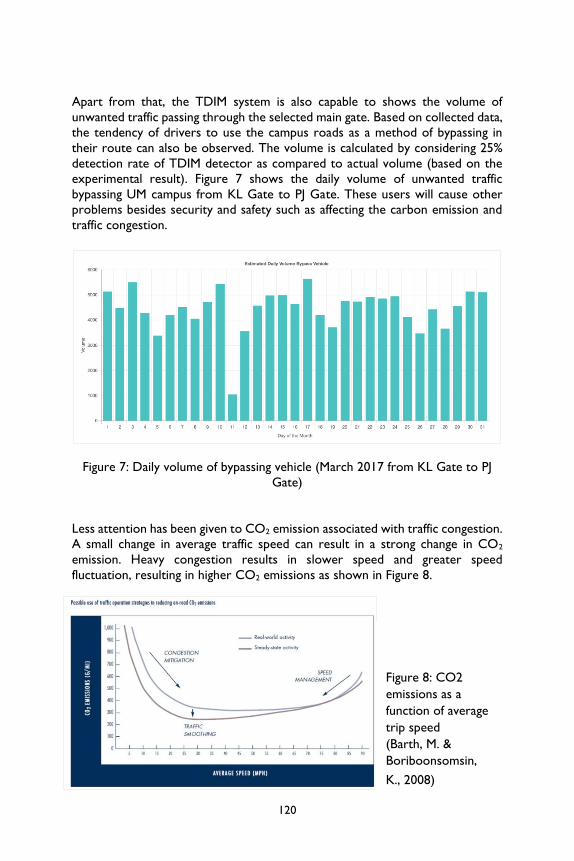
120
Apart from that, the TDIM system is also capable to shows the volume of
unwanted traffic passing through the selected main gate. Based on collected data,
the tendency of drivers to use the campus roads as a method of bypassing in
their route can also be observed. The volume is calculated by considering 25%
detection rate of TDIM detector as compared to actual volume (based on the
experimental result). Figure 7 shows the daily volume of unwanted traffic
bypassing UM campus from KL Gate to PJ Gate. These users will cause other
problems besides security and safety such as affecting the carbon emission and
traffic congestion.
Figure 7: Daily volume of bypassing vehicle (March 2017 from KL Gate to PJ
Gate)
Less attention has been given to CO2 emission associated with traffic congestion.
A small change in average traffic speed can result in a strong change in CO2
emission. Heavy congestion results in slower speed and greater speed
fluctuation, resulting in higher CO2 emissions as shown in Figure 8.
Figure 8: CO2
emissions as a
function of average
trip speed
(Barth, M. &
Boriboonsomsin,
K., 2008)

121
The daily carbon emission was calculated and plotted daily to show the change
in emission within the campus as shown in Figure 9. The total carbon emissions
were estimated based on the volume and speed of the road users captured by
the sensors.
Figure 9: Daily and monthly CO2 Emission in March 2017 for DTC to KL Gate
Route
Table 1 shows the total estimated cumulative of CO2 emission for all four main
corridors in March 2017. As depicted in Table 3, the total estimated CO2
emission in UM campus in March 2017 is 268.98 tonne from transport activities.
Table 1: Total CO2 emission inside UM Campus (KL to PJ gate) in March,2017
Route CO2 Emissions
(tonne/km)
Distance
(km)
Total
(tonne)
PJ - DTC 36.7 0.9 33.03
DTC - KL 106.5 0.9 95.85
KL - DTC 55.4 1.3 72.02
KL - PJ 48.5 1.4 67.90
Total CO2 Emission 268.98

122
Discussion The result obtained show that the objectives of this project, while have been
thoroughly substantiated, the issues should be a cause for concern. Mitigation
strategies should be devised to reduce and improve any of the issues that arise.
The foremost approach of mitigating the main problem of traffic congestion using
this monitoring system is to publicize the use of this system so that users could
make better judgement when planning to move within the campus. The users
could plan their movement with a better control such as using only when the
road is clear or finding an alternative route when the traffic is congested.
Data collected from the TDIM system shows that there are estimated 137,672
vehicles bypassing UM campus via KL Gate to PJ Gate in March 2017 only. Based
on one-month data collected in March 2017, it has been found that CO2
emissions can be reduced by up to almost 80% through two different strategies;
improve access control at all main entrances to UM campus to reduce vehicle
bypassing UM campus and introduce congestion mitigation strategies that reduce
severe congestion during peak hour.
Certain measures can be put by the administration to combat the congestion at
peak hour such as introducing flexible hours for employees working inside the
campus. By introducing flexible working hours for employees can ensure better
distribution of traffic during peak hours. Besides that, the university could also
build better walkways or path for users to move to other location without the
use of motorized vehicles inside the campus.
Other than that, there should be in-campus bus availability for employees to
move around the campus. The decrease of use of vehicles inside the campus
would significantly reduce the congestion and the carbon emission to make the
UM campus a better place.
Apart from that, campus entrance could be equipped with smart access control
function to reduce vehicle bypassing inside the campus. This can be implemented
to all campus entrances with access only given to active staff and students. This
solution will not only help to reduce vehicle bypassing inside the campus, it can
also reduce congestion and CO2 emissions inside the campus. The summary of
mitigation strategies is outlined in Table 2.

123
Table 2: Mitigation strategies to reduce congestion and unwanted traffic
Identified
Problem Mitigation Strategies
Congestion
Deploy TDIM system and publicize the use of this system
so that users could make better judgement when planning
to move within the campus.
Unwanted
traffic
(bypass
Vehicle)
a) Improve access control at all main entrances to UM
campus.
b) Introduce flexible hours for employees working inside
the campus.
c) Encourage the use of non-motorized vehicles inside the
campus.
Conclusion The TDIM system that can provide congestion and emission measure within the
campus has been implemented. The system is able to show the traffic congestion
status, carbon emission, and the vehicle bypass within the UM Campus. The
monitoring process shows that some of the issues that arise need to be
controlled and mitigated before anything can escalate. In conclusion, the TDIM
system is a good start to understand and quantitatively measure the problem
while also showing if any measure taken to moderate the issue would be
substantial.
Further to the monitoring system, the information regarding traffic congestion
status and monthly carbon emissions need to be circulated and disseminated
among University Malaya employees, students and publics that are using
University Malaya roads so they become aware of the current congestion status
inside the campus. The proposed mitigation strategies to reduce congestion
during peak hours, as well as CO2 emissions should also be taken into
consideration by the administration to ensure sustainable living inside UM
campus.
Acknowledgement The author would like to acknowledge the Living Lab grant, grant no. (LL025-
16SUS) for financial supports upon the completion of project

124
References Barth, M., & Boriboonsomsin, K. (2008). Real-world CO2 Impacts of Traffic
Congestion. Paper for the 87th Annual Meeting of Transportation
Research Board Washington D.C. Retrieved from Transport Research
Board website: trrjournalonline.trb.org/doi/citedby/ /10.3141/2058-
20
Frost & Sullivan (January 11, 2016). ASEAN Transport Situation and Situations
Outlook, 2002- Multi-pronged Approach to Help ASEAN Tackle
Mobility Challenges of its Densely Populated Cities. Retrieved from:
http://www.frost.com/sublib/display-report.do?id.

125
10
Sustainable Transport System in the University of Malaya
Campus: Study On Improving the Campus Shuttle Bus
Service and Promote Non-Motorised Transport Mode Yuen Choon Wah 1, Mohamed Rehan Karim 1, Aminah Wati Abdullah 1, Yong
Adilah Shamsul Harumain 2 and Mastura Adam 3
1 Centre for Transportation Research, Faculty of Engineering, University Malaya,
Kuala Lumpur, Malaysia 2Department of Urban and Regional Planning, Faculty of Built Environment,
University Malaya, Kuala Lumpur, Malaysia 3Architecture Department, Faculty of Built Environment, University of Malaya,
Kuala Lumpur, Malaysia
*Corresponding author: [email protected]
Abstract High dependency on private vehicle has contributed to heavy congestion in urban
area. Enhancing the campus public transport system focusing on campus shuttle
bus service can be a model to be applied to the real world because of the
similarity of campus elements to an urban setup. Qualitative and quantities survey
were applied to stakeholders including students and bus operator to investigate
the insight into bus transport system in the university. Passengers counting were
carried out to examine the level of supply and demand of shuttle bus service.
The study revealed that more supply was needed during peak hour. It is
suggested that during the peak hour, more bus or more supply should be
provided and not just following the normal bus schedule but by following the
demand trends. Bus tracking apps is a good tool for students to plan for the
journey but it is important to make sure that good, accurate and reliable bus
tracking information is provided to the user beforehand. It can be concluded that
a holistic approach to reduce the number of private vehicle in campus need to
take into account the inclusion of other non-vehicle mode.
Keywords Sustainable transport, campus shuttle bus service, non-motorised, Living Lab,
Eco-campus

126
Introduction The trends of motorization in universities are matching those in society and in
some ways are worsened by changes in higher education itself as the admission
of greater numbers of mature students probably raises the proportion of car-
owning students. As a result of it, University of Malaya community needs to
embark on more sustainable campus planning. The aim of this study is to develop
an innovative sustainable transport system to solve the traffic problem within the
campus. A smart shuttle bus schedule shall be introduced to serve the campus
community. The deployment of number of shuttle bus trip will be fully based on
the passengers’ demand and thus can reduce the number of daily bus trip.
Objectives This study serves three objectives, which are:
1. To develop an innovative sustainable transportation system in order
to reduce the number of motorised vehicle within the campus
2. To propose a new transportation policy to solve the lack of parking
space problem in campus.
3. To create awareness and promote community to choose shuttle bus
and non-motorized transport mode as their main travel mode in
campus and reduce transportation carbon footprint.
Literature Review With the advance improvement in technology and urbanisation process, this
causes the increasing number of vehicle ownership, population and mobility
priority as in the 21st century. Throughout the process, the transport issue will
become the alarming issue in the advanced metropolitan especially in Kuala
Lumpur. However, traffic congestion is one of major concerns in the country
which limit the mobility and accessibility of the people in the area. It is because
the private car is the primary mode of transport in Kuala Lumpur which over
burden the traffic condition. Nevertheless, it creates an opportunity to solve this
congestion issue by promoting the use of public transport (PT) and non-
motorised transport mode (NMT).
A mode shift from private car to PT and NMT can be done by understanding the
current situation of the PT and NMT thus enhancing the services, facilities as well
as implement the supportive policies. The difficulty in solving congestion issue in
Kuala Lumpur area is due to the high population and government policies on
transportation. Therefore, the study will target on promoting the modal shift
from private car to shuttle bus and NMT in university campus. The study is mainly
on promoting the use of campus bus and NMT, by restructuring the current

127
shuttle bus system and improve the infrastructure for NMT, to solve the issues
related to traffic condition in the university.
Recently, environmental issues in public transport have become an important
aspect to be studied due to the climate change and global warming. Greening the
campus for sustainability and environmentally friendly is one of the concerns
among all public universities in Malaysia (Avineri 2012). The awareness towards
preserving a sustainable environment stimulates the need of study on promoting
the alternative modes of transport which is the shuttle bus service system in
universities.
The performance of the bus service can be evaluated from different aspects such
as passengers, community, operator and driver (Transportation Research Board,
2002). Factors such as safety and security and maintenance of the bus could affect
the expectation of the customers towards the service which will indirectly create
dissatisfaction to the customers. Normally, transit service reliability assessment
includes route based and stop based but passengers will more prefer stop based
as regularity is more important than schedule adherence if the buses run
frequently (Chen, et al., 2009). It is stated that transit reliability, from the user’s
perspective, involves departing from the origin station on time, having reasonable
on board travel time and arriving at the destination station within a time frame
that allows them to be at their destination without being late (Casello, et al.) To
promote the public transport bus system, reliable services that serve a short
waiting time and punctual should be provided.
Previous research reports showed that when study at the universities’ guidelines
for promoting bicycling and walking in campus, researchers found that they have
failed to study the transportation modes on campus and the opinions of
university citizens towards bicycle use and pedestrians need. The ineffective
guidelines lead to university citizens continuing to use private cars or major
vehicles while the number of bicyclist and pedestrians remain limited. In order
to solve the above mentioned problems, promoting the use of bicycles in campus
and walking to all university citizens is essential. In addition, studying the modes
of transport in campus and university citizens’ attitudes towards cycling and
walking will help to analyse problems and difficulties related to bicycle use and
walking in campus. The final results of this research can be practical guidelines to
promote cycling and walking in campus to meet the needs of university
community.
In this research, the possibility of implementation of various policies in UM
campus, such as “Park and Ride”, “Park and Cycle/Walk” and “Car free
Zone/Hour” shall be focused. Besides, relocation of bus stops in the campus
based on demand and alternative and environmentally friendly vehicles to replace
the current diesel engine bus such as electric buses, tram and others should also
be considered. For the infrastructure aspects, the research also shall look into

128
the provision of a sustainable infrastructure design for bus stops, bicycle lanes,
pedestrian walkways and others.
Methodology The research focuses on internal campus shuttle bus service which are Route A
and Route B which are the busiest routes inside the university (Figure 1).
Figure 1: Study route
Literature review and secondary data collection was conducted at the early stage
of the study. For the second phase, the study employed interview with stake
holders, survey questionnaires, passengers counting and focus group discussion.
Finally, the data were analysed and UM bus application were improved based on
the findings and outcomes (Figure 2).
Focus routes: A and B

129
Figure 2: Methodology
Preliminary study
The preliminary study involves literature review and secondary data collection
on shuttle bus service serve in the university.
Data collection
Interview
Interviews were conducted amongst stakeholders to gain insight into
the current shuttle bus service system in the university which are
The Student Affairs Division, Department of Development and Estate
Maintenance and Information Technology Centre.
Survey Questionnaires
This chapter outlines the travel survey results for University Malaya and
the summaries of the key results. The survey was design as an entirely
online questionnaire via Google Form. The survey was conducted from
21st November 2016.to 15th December 2016. It was made available to
all students across University of Malaya. 215 students participated in the
survey with response rate of 1.22%.
Passengers Counting
Pilot test was conducted on 19th November 2016 followed by the
actual counting on 20th September 2016 until 27th September 2016.
The total passengers for Route A and Route B counted 7,545 and 8,542
passengers respectively.
• Literature review
• Secondary data collection
Phase 1: Preliminary study
• Interview
• Survey questionnaires
• Passengers counting
• Focus group dicussion
Phase 2 : Data collection
• Data analysis
• Improving UM bus application
Phase 3: Analysis and application

130
Focus Group Discussion
The total of four personnel from bus operator, Nadiputra had attended
the Focus Group Discussion (FGD). A moderator had guide the session
based on open-ended interview outline to guide the FGD. Interview
questions were developed with direction and input from current
understanding and were designed to cover a range of university shuttle
bus issues and address specific questions raised based on previous initial
students survey results.
Before the session started, the moderator had explained to the participants
together with a hand-out note regarding research project brief description and
participants were required to fill up FGD attendance slip. The FGD were tape-
recorded and anonymity of the participants is protected in this report.
Analysis and application
The survey questionnaires with closed ended questions was computed into SPSS
statistical tools while open ended questions, interview and focus group discussion
where analysed using thematic method.
The FGD session was recorded and transcribed. A preliminary analysis was
conducted to understand and connect the insight derived from FGD with the
current data. The FGD output that reflected specific thoughts and experiences
in delivering shuttle bus service inside UM campus was analysed based on
thematic statement and labelled based on the main topics. Then these topics
were analysed to determine the interrelations of the statement and issues and
divided based on categories. Finally, the analysis, the categories were merged
into categories that were labelled as key findings.
Results Travel survey related to campus shuttle bus service
The overall university mode share is illustrated in Figure 3. This highlights that
the main mode of travel for journeys to the campus is by bus (60.50%). The
following results are related to campus shuttle bus service. Overall 66% of
respondents have taken the service within past 30 days during survey period.
From Figure 4, respondents mostly took shuttle bus service during evening peak
hour which at 4pm to 6pm (67.60%) followed by morning peak hour at 8am to
10 am (52.10%). This result is consistence with preliminary results from
“passengers counting”.

131
Figure 3: Overall University mode share
Figure 4: The typical time respondents took the university shuttle bus service
0.5%
2.3%
4.2%
4.7%
6.5%
7.9%
13.5%
16.7%
54.4%
60.5%
0.0% 10.0%20.0%30.0%40.0%50.0%60.0%70.0%
By bicycle
Other
As motorcyclist
As a pollion passenger
As a car driver (with passengers)
By taxo
As car passenger
As a car driver (alone)
Walking
By bus
38%
52.10%
35.90%
34.50%
26.10%
67.60%
36.60%
17.60%
9.20%
0% 10% 20% 30% 40% 50% 60% 70% 80%
Before 8 am
8 am to 10 am
10 am to 12 pm
12 pm to 2 pm
2 pm to 4 pm
4 pm to 6 pm
6 pm to 8 pm
8 pm to 10 pm
After 10 pm

132
From the following graph (Figure 5), respondents stated that they need to wait
between 10 to 20 minutes for campus shuttle bus service. The ideal waiting time
is within 10 to 15 minutes (Mishalani, 2006).
Figure 5: Average waiting time for respondents
Figure 6a and 6b are the rating for user experience based on timetable,
punctuality, and hours of operation, routes and bus service frequency during peak
hours. The graphs show that students given average rating experience on shuttle
bus service timetable, punctuality, hours of operation, routes and bus service
frequency during peak hours. Compared to campus shuttle bus timetable,
punctuality, hours of operation and routes, the graph reflected that campus
shuttle bus service frequency during peak hours is the important element that
needs to focus as it reflected the lowest percentage on “average” experience
(32.4%) and the highest percentage on “poor” and “very poor” experience
(31.7% and 18.3%).
6.3%
69.0%
20.4%
4.2%
0.0%
10.0%
20.0%
30.0%
40.0%
50.0%
60.0%
70.0%
80.0%
Less than 10
minutes
10 to 20 minutes 20 to 30 minutes More than 30
minutes
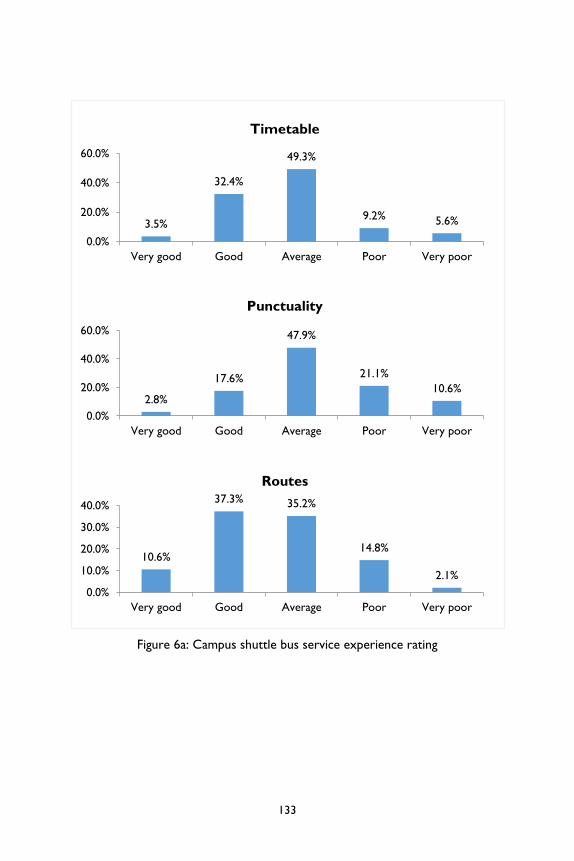
133
Figure 6a: Campus shuttle bus service experience rating
3.5%
32.4%
49.3%
9.2% 5.6%
0.0%
20.0%
40.0%
60.0%
Very good Good Average Poor Very poor
Timetable
2.8%
17.6%
47.9%
21.1%
10.6%
0.0%
20.0%
40.0%
60.0%
Very good Good Average Poor Very poor
Punctuality
10.6%
37.3% 35.2%
14.8%
2.1%
0.0%
10.0%
20.0%
30.0%
40.0%
Very good Good Average Poor Very poor
Routes

134
Figure 1b: Campus shuttle bus service experience rating
The majority of 79.9% respondents are not aware on “UM Bus Tracking”
application and only 31.9% of them has installed the application into their Android
phone. None of them used the application very often and the survey showed
76.1% from 46 respondents used “UM Bus Tracking” application only a few times.
Figure 7 represent on service rating experience on "UM Bus Tracking"
application derived from the respondents that used the tracking. Rating
experience focuses on “route information”, “accuracy of estimated of time
arrival (ETA), “ease of use” and “overall satisfaction”. None of the criteria
achieves “very good” rating and only met “average” rating. The urgency of
improvement need to be focused on “accuracy of estimated of time arrival
(ETA)” where it rated the highest “very poor” experience.
4.2%
32.4%
43.0%
14.8%
5.6%
0.0%
10.0%
20.0%
30.0%
40.0%
50.0%
Very good Good Average Poor Very poor
Hours of operation
3.5%
14.1%
32.4% 31.7%
18.3%
0.0%
10.0%
20.0%
30.0%
40.0%
Very good Good Average Poor Very poor
Bus service frequencyduring peak hours

135
Figure 2: "UM Bus Tracking" experience rating
0.0%
7.7%
13.4%
7.0%
4.2%
0.0%
5.0%
10.0%
15.0%
Very good Good Average Poor Very poor
Route information
0.0%
3.5%
9.9%7.7%
11.3%
0.0%
5.0%
10.0%
15.0%
Very good Good Average Poor Very poor
Accuracy of estimated oftime arrival (ETA)
0.0%
4.9%
12.0%9.9%
5.6%
0.0%
5.0%
10.0%
15.0%
Very good Good Average Poor Very poor
Ease of use
0.0%2.1%
12.7%10.6%
7.0%
0.0%
5.0%
10.0%
15.0%
Very good Good Average Poor Very poor
Overall satisfaction

136
To get more view regarding “UM Bus Tracking”, students’ opinion on the current
application were gauged through open ended question. The responds generally
stated that “UM Bus Tracking” does not function very well to serve information
regarding campus shuttle bus service. The respondents also think that it is not
accurate, and is unable to track moving bus based on the application.
Bus passengers counting
i) Route A
Figure 8 reflects the highest number of passenger boarding for route A is
between 4pm and 5pm. Time period between 9.00 am and 10.00 pm has the least
ridership. Further analysis will focus on time period 4.00 pm to 5.00 pm.
Figure 3: Total number of boarding passenger at all stations in route A in every
hour from 8.00 am to 7.00 pm
Figure 9 shows that UM Central station always has the highest number of
boarding for all bus trip between 4.00 pm and 5.00 pm. UM Central station was
selected to carry out further analysis.
0
100
200
300
400
500
8AM 9AM 10AM 11AM 12PM 1PM 2PM 3PM 4PM 5PM 6PM
No
. o
f P
ass
en
ger
Time
API KK 8/10 FSKTM APM KK 3/4/7
UMC KK 3/4/7 - R APM - R FSKTM - R KK 8/10 - R

137
Figure 4: Number of boarding and alighting passenger of all bus trips between
4.00 pm and 5.00 pm at all stations in route A
Between the time period 4pm to 5pm, the passenger load factors (PLF) for bus
trip 1620 is one, which means the bus is fully packed. Both bus trip at 1600 and
1640 are overloaded, with PLF value 1.4 and 1.2 respectively. Bus trip at 1600
has around 90 passengers in a bus with 63 passengers’ capacity (seat and stand).
Bus trip 1640 has around 80 passengers in a bus with 63 passengers’ capacity
(seat and stand) (Figure 10).
Figure 5: Number of boarding passenger, bus capacity and passenger load factor
(PLF) of all bus trips between 4.00 pm to 5.00 pm at UM Central station for
route A
0102030405060708090
API
FSK
TM
KK
3/4
/7
KK
3/4
/7
FSK
TM
API
KK
8/1
0
APM
UM
C
APM
KK
8/1
0
API
FSK
TM
KK
3/4
/7
KK
3/4
/7
FSK
TM
API
1600 1620 1640
No
. o
f p
ass
en
ger
Bus trip
Boarding Alighting
0.00
0.50
1.00
1.50
2.00
0
20
40
60
80
100
1600 1620 1640
UMC
PL
F
No
. o
f p
ass
en
ger
Bus trip
Passenger Load Capacity PLF

138
ii) Route B
Figure 11 shows that the highest number of passenger boarding for route B is
between 8.00 am to 9.00 am. Time period between 12.00 pm and 1.00 pm has
the least ridership. Further analysis will focus on time period 8.00 am to 9.00am.
Figure 6: Total number of boarding passenger at all stations in Route B in every
hour from 8.00 am and 7.00 pm
Figure 12 states that KK 11 station has the highest number of boarding between
8.00 am and 9.00 am. KK 11 station was selected to carry out further analysis.
Figure 7: Number of boarding and alighting passenger of all bus trips between
8am and 9am at all stations in Route B
0
100
200
300
400
500
600
8AM 9AM 10AM 11AM 12PM 1PM 2PM 3PM 4PM 5PM 6PM
No
. o
f p
ass
en
ger
Time
API KK 11 KK 12 KK 1 UMC PASUM KK 5
020406080
100
API
KK
12
UM
C
KK
5
API
KK
12
UM
C
KK
5
API
KK
12
UM
C
KK
5
API
KK
12
UM
C
KK
5
API
KK
12
UM
C
KK
5
800 810 820 830 840
No
. o
f p
ass
en
ger
Bus trip
Boarding Alighting

139
iii) Bus Operator Insight into peak hour and non-peak hour
Based on contract of service between bus operator and University of Malaya, the
university only requested for 10 buses. Two buses were assigned for each route
with average service frequency for every 20 minutes. Even during peak hour
especially on route A and route B which has high load passengers, the bus
operator will still maintain the service frequency and cannot increase the service
frequency due to manpower restraint. If the service frequency is shortened to
10 minutes, the driver will not have enough time for the next trip preparation.
Nadiputra required more time interval for break and to get NGV refuel because
the buses can only refuel their NGV at the Terminal Bersepadu Selatan (TBS)
due to specification. After a discussion with HEP, to ease the peak hour issue,
UM bus will help to accommodate the service for instance; 7.20 am service by
Nadiputra operator, 7.40 am by University of Malaya shuttle bus and 8.00 am by
Nadiputra operator.
During evening time from 7.00 pm onwards, fewer passengers were found to
take the bus service. The Living Lab team asked if it is possible for Nadiputra to
provide less bus frequency during night shuttle bus service session. Nadiputra
explained that they were merely following the schedule provided by HEP and
they will obey the scheduled time because the contract is based on total lease
bus. Therefore, they are not obligated to save the fuel since UM already paid for
the service.
The Living Lab team believe it will beneficial to have a sustainable and smart
shuttle bus service where, for instance, during peak hours, more bus will be
deployed and likewise less bus during non-peak hours. If University of Malaya
continues with the current method as mentioned above, only Nadiputra will gain
the advantage as UM still need to pay for the bus shuttle contract service.
Discussion and Conclusion Generally, some respondents felt that the service are fairly good but need further
improvement on service punctuality and frequency during peak hours. The
concerns are during peak hours because the bus capacity was not able to cater
for all passengers and some of the users were not able to get into the bus.
Respondents also highlighted the bus service were not punctual and depart early
than the scheduled time.
It is advised that during the peak hour, more bus or more supply should be
provided and not to just follow the bus schedule but by following the demand
trends. The root cause of the problem is the capacity of the bus is simply not
enough to clear out the passengers from the bus stop. It caused passengers
having to wait much longer time for the next bus in order to continue their
journey to their destination. Bus bunching could be a solution to the problem
here.

140
Bus tracking apps is a good tool for students to plan for the journey. Before that,
it is important to make sure that a good, accurate and reliable bus tracking
information are provided to the user. Besides, more publicity should be done to
promote the use of the bus tracking apps and also we can set up a complaint
function in the apps to allow passengers to report to the bus operator about the
delay of the bus, reckless bus driver, sudden case of bus broken down and other
related matters.
Currently the campus bus service is only for students but not for other campus
community. To reduce the use of private vehicle and promote the use of campus
bus, it is strongly suggested that the university management should open the
service to all. Rules and regulations should be made to limit the campus
community using their private vehicle for the internal trips.
To reduce the number of vehicle and resolve traffic congestion problem in
campus, public vehicles should not be allowed from using the campus road as an
alternative road to their destination.
Acknowledgment This research was fully support from University of Malaya Living Lab Grant
(LL024-16SUS) and under supervision by Centre for Transport Research, Civil
Department. The authors received high cooperation from stakeholders which
are The Student Affairs Division, Department of Development and Estate
Maintenance and Information Technology Centre and bus operator, Nadiputra.
The authors also want to express gratitude to everyone that direct or indirectly
contribute to this research.
References Avineri, E. (2012). On the use and potential of behavioural economics from the
perspective of transport and climate change. Journal of Transport Geography,
24, 512-521.
Casello, J. M., Towns, W., Bélanger, J., & Kassiedass, S. (2015). Public engagement
in public transportation projects: Challenges and recommendations.
Transportation Research Record: Journal of the Transportation Research
Board, (2537), 88-95.
Mishalani, R. G., McCord, M. M., & Wirtz, J. (2006). Passenger wait time
perceptions at bus stops: Empirical results and impact on evaluating real-time
bus arrival information. Journal of Public Transportation, 9(2), 5.

141
11
Working Towards a Sustainable Means of
Campus Transport Onn Chiu Chuen1.*, Mohamed Rehan Karim1, Sumiani Yusoff2, Ong Zhi Chao3,
Wan Asma Diana Wan Roselan1 and Lim Zhen Jie2
1 Centre for Transportation Research, Faculty of Engineering, University
Malaya, Kuala Lumpur, Malaysia 2 Department of Civil Engineering, Faculty of Engineering, University Malaya,
Kuala Lumpur, Malaysia 3 Department of Mechanical Engineering, Faculty of Engineering, University
Malaya, Kuala Lumpur, Malaysia
*Corresponding author: [email protected]
Abstract This research aimed to investigate the current status of UM campus
transportation system. University Malaya consists of more than 30,000 university
population and due to strategic location between two developed cities, Kuala
Lumpur and Petaling Jaya caused traffic congestion along the two main gates in
campus. The main objective of this study was to develop a sustainable solution
to solve the traffic and parking problem beside creating awareness to UM
community and forming a partnership with the stakeholders in UM. The research
performed on-site field collection of the traffic conditions and transportation
systems within UM campus by analysing the traffic flow pattern within campus
with on-site traffic sensor and traffic survey thru interviews with UM community.
Our findings show that, approximate 4435 private vehicles used the campus road
as a shortcut to travel between Kuala Lumpur and Petaling Jaya in 12-hour
monitoring period and they contributed 1,087,800g CO2e emissions. More than
1400 campus vehicles conduct internal trips in 12-hour monitoring period, they
contributed more than 676,200g CO2e carbon emission within campus. Thus, a
solution was to introduce to enforce visitor to apply for visitor sticker and
encourage UM community to use other alternatives such as shuttle bus and
walking for traveling within campus.

142
Keywords Traffic Volume and Pattern, Parking audit, Walkability, University Malaya
Introduction Universities worldwide face growing problems of traffic congestion and parking
shortages due to the increased usage of private automobiles and the decline of
public and non-motorized transport systems. University of Malaya is the oldest
university in Malaysia and situated on a 309 hectare (750 acre) campus in the
southwest of Kuala Lumpur, the capital of Malaysia. Nowadays, UM is an
international acclaimed Research University, have 15 academic institutions and
12 residential colleges. University of Malaya is build-up of more than 6km of
campus road and consists of more than 30,000 university population. UM have a
total of 5 road entrances. Out of these 5 entrances, KL gate and PJ gate are the
main entrances where they have the highest daily traffic volume. Traffic
congestion is far worse than expected within UM compound due to UM location
between 2 most developed cities in Malaysia which are Kuala Lumpur (KL) and
Petaling Jaya (PJ). Moreover, the facilities planning within the UM campus are
wide and dispersed creates low level of accessibility and it constricts the
provision of the facilities throughout the campus. UM campus builds by locating
the main facilities in the center of the campus, consequently creates an immense
distance between the main facilities and the residential areas without providing
proper connection of the covered walkway.
Objectives This study aimed to achieve three main objectives;
1. To develop a sustainable solution to solve the traffic and parking
problem within campus,
2. To create awareness and promote unnecessary vehicle trip within
the campus communities and reduce the transportation carbon
footprint,
3. To form strategic partnership with various stakeholders to develop
a sustainable transport policy.
Literature Review Transportation is one of the main facilities that support human movement
around the world. Transportation reliance on fossil fuel is the main factor making
transportation sector one of the core contributors in greenhouse gas emissions
and energy consumption. Environmental impacts of transport have been causing
several of disturbances in the working environment in universities such as
disturbance to teaching, loss of natural environment and greenery, wildlife
disturbance, despoliation of the land use of parking facility, and health effects of

143
pollutants, noise and vibration on staff and students. These impacts are created
through mainly by local traveling vehicles, delivery vehicles, visitor’s vehicles, and
heavy vehicles for construction.
Universities occupy large areas of land, and growing in populations is likely to
increase the traffics with the universities. The trends of motorization in
universities are matching those in society and in some ways are worsened by
changes in higher education itself as the admission of greater numbers of mature
students probably raises the proportion of car-owning students. Car has
demonstrated to have the highest usage of energy per distance travel per
passenger, where it consumes almost four times more energy compared to a bus
and will emit greenhouse gas per passenger per distance two times more than a
motorcycle and five times more than a bus at full load. It is almost certain that
traveling is the largest impact created within university on the environment, so
that transport issue should occupy a vital role in university’s policy.
Sustainable transport or known as green transport and it is any form of transport
that does not use or rely on dwindling natural resources. Instead it relies on
renewable or regenerated energy rather than fossil fuels that have a finite life
expectancy (Michael. E, 2011). Campus sustainability has become a major focus
in global issues; sustainable transportation planning can be seen as a positive
movement towards a contribution to our environment. Sustainable
transportation system provides incentives for walking, bicycling, ridesharing,
discouraging the use of single-occupancy vehicle and Effective land use planning
that accommodate transportation planning. Thus, in line with the launch of
University Malaya Eco-campus blueprint 2015, UM must proclaim their intent by
taking environmental challenges seriously and to be proactive toward mitigating
the effect of global environmental degradation. As a result of it, UM community
need to embark on more sustainable campus planning as dedicated in the
declaration. UM need to find a more comprehensive approach for
institutionalizing ‘green” in the campus from all dimensions including the bridging
of academic content, administrative policies, and facilities development.
Universities as an important hub that enhance learning and research activities for
higher education should welcome all of their stakeholders to endorse
collaboration and partnership in policy making and promote sustainability to
accommodate the necessities of serving the society. As nowadays university
carried an important responsibility in shaping the future generation, therefore it
is important to bleach future policy maker with the awareness of sustainability.
Reducing car dependency will somehow create imperceptible benefits to a
university. ‘Green’ may become a potential attraction for student’s choice of
university; particularly due to prominence of environmental issues have become
not only in the society but also in the curriculum of many schools.

144
A preliminary data collection was made to monitor the amount of vehicle
traveling within UM from the main entrance gate of KL and PJ. The flow of traffic
would make approximately 3km of travelling. 5 types of vehicles were found
travelling within the campus road with the number of private cars topping the
list. Private car found to be the most common vehicle within these roads with
93% of the total number, while motorcycle at 3.5%, gasoline truck 1.5%, diesel
truck 0.85% and diesel bus 0.7%. Innovative sustainable transport policy needs to
be introduced to reduce the dependency of motorized vehicle, especially cars. In
order to put an appropriate transport policy, ground data such as traffic counts
and parking space audit were needed. Data collection will be carried out within
a 6-month period which include on-site. Meanwhile, a project on "park and
ride/walk" system will be carried out within the campus to promote the usage of
other alternatives among the university communities. Each alternative will be
assessed with the utilization of four criteria; reduction of environmental impact,
cost effectiveness, feasibility, and potential student and faculty support.
Methodology i) Networking with Stakeholders and Participants
One of the main objectives in this study is to form a strategic collaboration with
various stakeholders in University Malaya in order to improve decision-making
and implementation of policies. Our main stakeholders are the Information
Technology Centre (PTM), UM Security, and Department of Development &
Estate Maintenance (JPPHB) as their idea and information are important in this
study. The closed-circuit television recording (CCTV) at campus gate is required
and will be obtained from these stakeholders. Other than that, periodical meeting
and discussion with stakeholders will allow us to get more understanding on
traffic pattern, management and enforcement of campus transportation system.
ii) Procedure
The study involved two on-site surveying involved traffic and parking audit. The
parking audit is a data collection method that involved parking counting and
parking interview. Parking count in the study area was divided into 3 main zones
such as faculty/institute/Centre building, facilities/administration building and
residential colleges. Patrol survey was also carried out in this study to identify
the status of parking during office hour in term of occupancy.
The traffic audit appointed 10 enumerators to conduct traffic count at specific
checkpoints of road junctions and 2 campus gates (Damansara and Intan gate).
The traffic count was conducted for 12 hours monitoring session starting from
7.30 am to 7.30 pm in a typical weekday. The enumerators were given briefing
first before executing the survey. This is to ensure that the enumerators
understood on the details of the study and conduct it correctly. The data
obtained was analysed using SPSS statistical tools.

145
Results i) Preliminary data collection
The pilot study on the traffic audit was conducted before the actual run to
familiarize the situation on site and to identify weakness of the method and
overcome it before actual run. The pilot study was based on CCTV recordings
provided by Security Office (Traffic and Control Department). However, only
CCTV-recording of KL, PJ, Damansara and FBL@Sec16 gate were available. Two
enumerators were appointed to analyze the recording. Nevertheless, the data
given was limited due to technical problem. Based on records in one typical
weekday, KL gate has the highest numbers of vehicles entering the campus with
more than a thousand cars in an hour (Table 1).
Table 1: Volume of car, lorry and motorcycle entering the campus every hour
TIME KL GATE PJ GATE FBL GATE
0700 – 0800 1658 562 469
0800 – 0900 1767 581 628
0900 – 1000 1437 472 362
1000 – 1100 1281 392 257
1100 – 1200 1236 381 248
1200 – 1300 1122 336 223
1300 – 1400 1326 413 258
1400 – 1500 1384 414 275
1500 – 1600 980 312 191
1600 – 1700 1101 332 199
1700 – 1800 1223 349 306
1800 – 1900 1460 453 260
1900 – 2000 1455 463 150
TOTAL 17430 5460 3826
ii) Parking Space Audit
Park and ride in campus is a facility that consist of parking lots with public
transport connections which allow people to head to their destinations by leaving
their vehicles and transfer to a bus or carpool for remainder of the journey. In
this study, a parking audit was conducted for all building of administration,
residential college, facilities, faculty, institute and centre in UM zone. The data in
year 2013 was provided by JPPHB. The parking status from JPPHB data are

146
showed in the table below (Table 2) with total of 6319 for car, 5592 for
motorcycle, 21 for OKU (cars), 41 for buses, 9 for lorries, and 69 for bicycle.
Table 2: Numbers of Parking in UM for 2013 (JPPHB’s database)
ZONE CAR MOTOR
CYCLE OKU BUS LORRY
BI-
CYCLE
Faculty / Institute
/ Centre 3000 2073 10 0 4 0
Residential
Colleges 857 2117 4 1 0 69
Facilities /
Administration 2462 1402 7 40 5 0
Total 6319 5592 21 41 9 69
Table 3: Numbers of Parking in UM for 2017 (actual counting)
ZONE CAR MOTOR
CYCLE OKU BUS LORRY
BI-
CYCLE
Faculty / Institute
/ Centre 3580 2512 10 0 4 0
Residential
Colleges 998 2307 4 1 0 69
Facilities /
Administration 2095 1322 7 40 5 0
Total 6673 6141 21 41 9 69
The research team member had conducted a parking audit at all listed zone. The
total number of parking is 12,980 (Table 3). The parking audit was conducted on
early January 2016 during peak hour. The number of parking have been increases
from 12, 051 at year 2013 to 12,980 at year 2017 with car parking increases by
5.6% and motorcycle 9.8%. Other parking for OKU, bus, lorry and bicycle did
not have any changes. Based on observation, most of faculty and administration
parking area are covered by barrier gate system.
iii) Vehicle Sticker
The UM vehicle sticker data were obtained from security office covers the
approval numbers for 2014, 2015 and 2016 for both staff and student. The UM
sticker is required to be renew annually. Based on the 3 years’ database, the
number of UM sticker has exceeded the amount of parking availability in the
campus with a difference of more than 3000 (50%). The number of sticker
approved for car in year 2014 and 2015 showed a decreased from 10,592 to
9068 but slightly increased again in year 2016 with 9800. The number of sticker
for motorcycle also had similar pattern from 2230 in year 2014, decreased to
1731 in year 2015 and increased to 2143 in year 2016.

147
Table 4: Numbers of UM vehicle sticker approved (UM Security database)
Categories 2014 2015 2016
UM Management Car: 146
Motorcycle: 8
Van: 0
Car: 181
Motorcycle: 12
Van : 0
Car: 134
Motorcycle: 18
Van: 6
Academic Staff Car: 2934
Motorcycle: 111
Van: 21
Car: 2932
Motorcycle: 90
Van: 26
Car: 2810
Motorcycle: 88
Van: 23
Non-Academic Staff Car: 4029
Motorcycle: 1519
Van: 26
Car: 3817
Motorcycle: 1388
Van: 17
Car: 3781
Motorcycle: 1430
Van: 31
UM Students Car: 2995
Motorcycle: 543
Car: 1633
Motorcycle: 204
Car: 2608
Motorcycle: 571
RA, RO, Contract
Staff
Car: 307
Motorcycle: 27
Van: 3
Car: 362
Motorcycle: 27
Van: 1
Car: 319
Motorcycle: 28
Van: 1
Contactor, Vendor
& Canteen Operator
Car: 0
Motorcycle: 0
Lorry: 0
Car: 0
Motorcycle: 0
Lorry: 0
Car: 15
Motorcycle: 2
Lorry: 1
Others (Retirees,
PALAPES, Bank Staff,
etc.
Car: 181
Motorcycle: 25
Van: 4
Lorry: 1
Car: 143
Motorcycle: 10
Van: 0
Lorry: 0
Car: 133
Motorcycle: 6
Van: 0
Lorry: 0
Categories 2014 2015 2016
Car 10592 9068 9800
Motorcycle 2230 1731 2143
Van 51 44 61
Lorry 1 0 1
Other 6 0 0
iv) Traffic Volume and Pattern in Campus
The survey involved 12-hour of traffic counts at all campus gates, and three
intersections in the campus. This survey was conducted on 8th November 2016
in one typical weekday (Tuesday) and without any main events that might affect
the traffic flow. The three main intersections were given the coding of A1 (Right
and Left), B2 (Right and Left) and C3 (Right and Left). The checkpoints A1
(3.119249, 101.654650) is the intersection from Kuala Lumpur (KL) gate to
either the Petaling Jaya (PJ) gate or to the centre of campus. The checkpoints B2
(3.121598, 101.654081) is the intersections at UM Library either to UM Central
or Faculty of Science. Lastly is checkpoint C3 (3.121582, 101.660494) which is
the intersections to Damansara gate or KL gate.

148
Figure 1: Data collection locations
The scope of this study is focused on the trip distribution inside the UM campus
during the 12-hours collection period. Other than that, the analysis also is able
to forecast the number of vehicle using UM road as shortcut. The generation of
traffic distribution inside the campus may be derived from the volume of vehicles
passing trough of those checkpoints. Below are the volumes of traffic counts for
selected gates in the campus. The volume of vehicles entering the campus from
KL gate has the highest volume with more than 1000 vehicles at 0730-0830 which
is the peak hour. The volume for PJ and FBL gate were not fully completed as
the CCTV recording had a technical issue during transferring the data (*) and
had been reported to the management party (PTM).
Figure 2: Traffic counts for entry time in campus
0
200
400
600
800
1000
1200
KL IN
Intan IN
Damansara IN
PJ IN
FBL IN

149
Table 5: Traffic counts for entry time in campus
TIME KL IN INTAN IN DAMANSARA IN PJ IN FBL IN
0730 - 0830 1108 79 242 * 105*
0830 - 0930 839 24 165 * *
0930 - 1030 661 54 122 * *
1030 - 1130 618 40 81 * 57*
1130 - 1230 592 57 86 * *
1230 - 1330 573 73 80 * 24*
1330 - 1430 606 80 82 221* 225*
1430 - 1530 360 40 76 366* 52*
1530 - 1630 457 52 43 174* 92*
1630 - 1730 543 64 41 192* 5*
1730 - 1830 509 57 163 211* *
1830 - 1930 390 9 136 * *
Total 7256 629 1317 1164 560
Figure 3: Traffic counts for exit time in campus
0100200300400500600700800900
1000
KL OUT
Intan OUT
Damansara OUT
PJ OUT
FBL OUT

150
Table 6: Traffic counts for exit time in campus
TIME KL OUT INTAN
OUT
DAMAN
SARA
OUT
PJ OUT FBL
OUT
0730 - 0830 597 28 40 * 17*
0830 - 0930 628 24 48 * *
0930 - 1030 381 21 45 * *
1030 - 1130 349 27 51 * 19*
1130 - 1230 550 23 63 * *
1230 - 1330 562 33 71 * 18*
1330 - 1430 475 31 53 247* 104*
1430 - 1530 365 26 75 462* 32*
1530 - 1630 676 40 49 258* 125*
1630 - 1730 924 37 51 538* 7*
1730 - 1830 772 46 372 494* *
1830 - 1930 699 16 161 * *
Total 6978 352 1079 1999 322
v) The Internal Trips and By-Pass Route
The internal trips data referred to the movements of a vehicle inside campus.
The data extracted using SPSS tools focusing on vehicle that product more than
three movements within 12-hour monitoring period. Those movements were
recorded when the campus vehicle moved to one destinations to another and
passing through the monitoring checkpoints. Thus, not all movements were
recoded.
Table 7: The numbers of vehicles conduct internal trips
Number of Vehicles
<3 Movements <4 Movements
1400 569
The by-pass route data referred to the vehicles that used UM route as a shortcut.
There were several possible routes had been identified from traffic count data.
The highest counts were recorded in the morning 7.30 am to 8.30 am follow by
4.30 pm-5.30 pm, and 8.30 am-9.30 am. The table below showed the relationship
between total numbers of vehicles entering the campus in each hour vs the
numbers of by-pass.

151
Table 8: The by-pass vehicles
Time Vehicle Entering
(Total From All Gate) Total By Pass
0730 - 0830 1534 583
0830 - 0930 1028 531
0930 - 1030 837 319
1030 - 1130 796 161
1130 - 1230 735 259
1230 - 1330 750 380
1330 - 1430 1214 293
1430 - 1530 894 243
1530 - 1630 818 377
1630 - 1730 845 581
1730 - 1830 940 463
1830 - 1930 535 245*
Total 10926 4435
Discussion i) Carbon Emission Estimation
From the 12-hours monitoring period, we found that at least 1400 of campus
vehicles conduct internal trips within the campus. Based on assumption that
these vehicles will travel approximately 2.3km (the distance of one circulation on
campus) for every internal trip. According to study published by Duffy, A.,
Crawford, R.(2013), total carbon emission produced by these car will generate
676,200 gCO2e emission. If these trips would be made by using campus buses,
the estimated carbon emission can be reduced to only 14,240g CO2e emissions
by considering a bus with average occupancy of 40 passengers per trip. If these
trips would be made by walking instead of car, the carbon emission can be
reduced to 84,369g CO2e emissions (based on walking distance of 720m). Thus,
it showed that the campus bus can be a suitable alternative mode apart from
walking for UM communities to conduct their internal trips.
The study also found that at least 4435 vehicles conduct a by-pass within the
campus. The possibilities of by-pass were identified based on the traffic counts at
the checkpoints and gates. There are seven possible by-pass routes that had been
identified. The carbon emission was calculated based on each distance of possible

152
route and carbon factor. The results showed that more than 1,087,800g CO2e
was produced by these vehicles within 12-hour period.
Figure 5: Carbon emission per passenger different mode
Table 9: The by-pass carbon emission per passenger
0
100,000
200,000
300,000
400,000
500,000
600,000
700,000
800,000
Car Bus Cycle Walk
Carbon Emission 12-h Per Passenger
gCO2-eq/km
Car
Bus
Cycle
Walk
Possibility By-Pass
Route in UM
Distance
(km) Frequency No/km
Unit/
Value
CO2 per
12-h
KL in A1R
1.51 1,344 2029
210gCO2-
Eq/km
426,090
KL in A1L B2R 2.10 564 1184 248,640
KL in A1L B2L
Intan out 1.79 33 59 12,390
KL in A1L C3L
Damansara out 3.66 40 146 30,660
C3L Damansara out 1.82 266 484 101,640
Damansara in A1R 3.05 121 369 77,490
C3R KL out 0.44 2,067 909 190,890
Total 14.37 4,435 5180 - 1,087,800
gCO2e

153
ii) Walkability
Walkability is an important concept that can gives benefits to health,
environmental and economics. In terms of environmental, the most positive
impact of walkability is to decrease the automobile footprints in the campus.
Carbon emission can be reduced if more people choose to walk rather than
drive to one destination which has short distance. Economically, good plan of
walkability can give benefits which include ease accessibility, cost savings to both
individuals and public, increased efficiency of land use, and increased liveability.
Hence, several improvements are required to make the campus more walkable
such as moving obstructions of the sidewalk, proper quality of maintenance in
lighting and safety on sidewalk, provide covered walkway and improving
crosswalk safety.
Figure 6: Visual observation of an obstruction
on pedestrians near bus stop at Faculty
Engineering and main road to Petaling Jaya gate.
The banner is in the middle of walkway and
limits the space to pedestrians.
iii) Park and Ride/Walk Project
There are many ways that can be taken to advertise other alternatives
transportation mode to the communities such as brochures, poster, article,
news, social media, and events. This study had installed walking sign pole at four
locations in campus which are Faculty of Engineering, UM Central, Dewan Tunku
Canselor (DTC) and Chancellery building. The walking sign pole consists of
arrows that show the numbers of walking steps and time needed to reach the
Place of Interest (POI). The main purpose of these poles are to encourage the
UM community to travel by walking and it can reduce the numbers of cars off
the road. Walking also can relate to numbers of calories burned for every step.
The amount of calories burned per steps varies by the individual; body weight,
height, speed and intensity of the workout. The value of carbon emission and
energy consumption can be reduced greatly if the UM community can reduce
their internal trips by walking or ride university shuttle bus for midday trips on
campus. According to study published by Duffy, A., Crawford, R. (2013). The
effect of physical activity on greenhouse gas emission for common transport
modes in European countries. Transportation Research Part D 19, 13-19 stated

154
a person travel by walking significantly affected by food-energy and indirect shoe
manufacturing emission account for about 43% of emission of 83.7gCO2-
eq/pass.km compared to bus 176.9gCO2-eq/pass.km and travel by car at
205.5gCO2-eq/pass.km of carbon emission. Thus, showed that walking results in
the lowest overall emission from travelling by car, bus and cycling.
Figure 6: Example of promotional measure taken in the study
iv) Education and Enforcement
Based on the number of internal trips and by-pass generated in 12-hour of survey,
a proper planning is required to solve this issue which involved decision maker
from UM stakeholders. Thus, to reduce the internal trips apart encourages UM
staff and students to walk were to increase the frequency of UM shuttle bus
within campus. Based on the carbon emission estimation conclude that the bus
usage had the lowest overall emission than other alternatives. Regarding the
number of by-pass vehicles, this study suggested to introduce paid sticker for
visitor who wish to enter UM campus. A force registration required for them if
they wanted to use UM campus as a shortcut. Thus, current policies must be
improvised for better enforcement.
Conclusion
In this study, car travel was found to have the highest volume and contributions
in carbon emission intensity inside the campus. Unregistered vehicles entering
the campus are causing congestions within campus especially during peak hours.
These vehicles used UM road as by-pass route to shorten their travelling time
from PJ to KL and vice versus. The parking space provided inside the campus
cannot accommodate the huge numbers of vehicles entering the campus. There
are several approach which can be apply to encourage the community to use
non-motorized transport which can helps to reduce carbon emission inside
campus.

155
Acknowledgement This study was conducted with full support from authorities of University Malaya,
Kuala Lumpur. The authors would like to thank to all party who has given their
kind cooperation by providing the information and data needed in this study such
as Information Technology Centre (PTM), UM Security and Department of
Development and Estate Maintenance (JPPHB). This work was funded under UM
Living Lab Grant Programme: (LL026-16SUS) though a grant from Sustainability
Science Research Cluster.The authors also want to show their greats thanks to
UM students and staff that had help us sincerely filling the questionnaire.
References Alisar, A., Maya, A.Z., Isam, K., Cynthia, M. (2013). Transport Policy: Reducing
Parking Demand and Traffic Congestion at the American University of Beirut,
25, 52 – 60.
Carlos, J.L.B. (2003). Transport Policy: Sustainable Transportation Planning on
College Campuses, 10, 35 – 49.
Isiaka, A.A.A., Chin, S.H. (2015). Scientific Research Publishing: Realizing Low
Carbon Emission in the University Campus Towards Energy Sustainability, 4,
15 – 27.
Jalalkamali, N., Fatemeh, M.N.G. (2012). Procedia: Social and Behavioral
Sciences.The Cycling Potentials of Malaysian Students in UiTM Campus, 50,
941 – 949.
Keoy, K.H., Fadzil, H., Masnizan, C.M. (2012). Procedia: Social and Behavioral
Sciences. An Exploratory Study of Readiness and Development of Green
University Framework in Malaysia, 50, 525 – 536.
Habib, M. A., Ismaila, A. (2008). Science Direct: An Integrated Approach to
Achieving Campus Sustainability: Assessment of the Current Campus
Environmental Management Practices, 16, 1777 – 1785.
Liya, G., Shan, H., Adel, W.S. (2013). Transportation Research Part A: A Novel
Agent-Based Transportation Model of a University Campus with Application
to Quantifying the Environmental Cost of Parking Search, 50, 86 – 104.
Michael, E. (2011). Earth Times: Sustainable Transport. Retrieved from:
http://www.earthtimes.org/encyclopaedia/environmental-issues/sustainable-
transport/

156
Notes on Contributors
Dr. Ali Mohammed Alashwal earned his Ph.D. in Building & Construction
Economics from the University of Malaya and currently a Senior Lecturer at his
alma mater. He has a Master Degree in Construction Management from
University Technology of Malaysia and a Bachelor Degree in Architecture from
Ibb University, Yemen. Dr. Alashwal is a certified Project Management
Professional (PMP) from the Project Management Institute (PMI), USA. Prior to
joining the academia, Dr. Alashwal was working as an architect for about 4 years.
During that time, he conducted many architectural designs including consultancy
works for the Social Fund for Development, World Bank, to develop education
infrastructure in rural areas in Yemen. Dr. Alashwal has published two books and
several papers in international refereed journals and conference proceedings.
Dr. Muhammad Azzam Ismail, Ph.D. in Built Environment (UNSW) is a
Graduate Architect and an expert in green architecture and green building rating.
He teaches architecture at the University of Malaya, Kuala Lumpur and is the
current Head of Department of Architecture. His current research through
awarded grants includes building energy consumption management, operational
carbon footprint of residential properties and low carbon cities. At national level,
he was appointed as the Chairman of the Malaysia Council of Heads of
Architecture Schools (COHAS) from 2014-2016. Through his appointment as
Fellow at the Tun Syed Zahiruddin Residential College (9th College), he
supervised and participated in numerous student-led activities including the
yearly college award dinner and the "Global Community Service (GLOCOSE)"
international community service program to Acheh (Indonesia), Kampung Cham
(Cambodia) and Tay Ninh (Vietnam). In line with his interest in Sustainability and
low carbon cities, he actively delivered capacity building lectures through
UMCARES and was awarded UMCARES Certificate of Excellence in Sustainability
2014.
Dr. Karam Mustafa Al-Obaidi is an architect and scholar in the field of
adaptive architecture and sustainable building design. His research primarily
focuses on architectural technology and the future of buildings and cities.
Currently, he is a Senior Lecturer in Department of Architecture, Faculty of Built
Environment, University of Malaya. He received a Doctor of Philosophy in
Sustainable Architecture (Ph.D), a Master of Science (MSc) in Building
Technology from School of Housing Building and Planning at Universiti Sains
Malaysia (USM) and a Bachelor of Engineering Major Architecture from Sana’a
University. He is a member of several international scientific associations and he
has been invited as a speaker in several universities, conferences and events. He
serves as an editorial board member and/or reviewer for various top-ranked
international journals and conferences including Energy and Buildings, Energy

157
Conversion and Management, Indoor and Built Environment and many. He has
published many papers in reputed international journals and conferences.
Sharifah Noor Nazim Syed Yahya is currently a postgraduate student in
occupational safety at the University of Malaya, Malaysia and holds a Master of
Science (Architecture) Degree from the same university. She has thirteen years’
experience in facilities and building management and is a full-time practising
architect in the University of Malaya, Malaysia.
Mohammed Hatim Al-Sabahi is currently a PhD student in sustainable
architecture at University of Malaya - Malaysia. He holds a M.Sc. (Building) in
Project Management from the same university. As an architect, he has 15 years
of experience in the designing and construction field in Yemen and the Arab
region. Dr. Noor Suzaini M. Zaid is currently teaching at the Department of Building
Surveying in Faculty of Built Environment, University of Malaya. Suzaini holds a
PhD degree in Planning and Urban Development from the Faculty of the Built
Environment, University of New South Wales. She has teaching experience in
the fields of building surveying, urban planning, and sustainable development. Her
current research interest focuses on energy efficiency, zero-carbon
development, climate change mitigation and adaptation in built environment.
Suzaini was part of the testing of the United Nations Environment Programme’s
Sustainable Building and Climate Initiative (UNEP-SBCI)’s Common Carbon
Metric and Protocol tool Pilot Test Phase 1 and Phase 2 in the Malaysian context
through her PhD research. Her research was conducted in collaboration of the
Ministry of Higher Education Malaysia, University of New South Wales, UNEP-
SBCI, and the City Hall of Kuala Lumpur. Her current research project includes
SULED-BIM: Sustainability Led Design Through Building Information Modelling
with collaboration with University of Manchester under the 2015 UK Newton
Fund. Other projects she is involved in are within areas of work productivity,
green buildings, acoustic properties of residential buildings, and housing and
rehabilitation.
Dr. Zul Ilham completed his undergraduate degree in University of Malaya
before being awarded with Panasonic Scholarship for masters and JICA
AUN/SEED-Net Scholarship for his doctoral study at the Department of Socio-
Environmental Energy Science, Kyoto University, Japan. His current research
interest is bioenergy, with special focus on production of sustainable biofuel and
bioproduct from biomass and also studying energy efficiency and biomimicry, as
means to reduce impacts of climate change. Among the subjects he coordinated
are Renewable Energy Processes, Climate Change and Energy Science,
Environmental Chemical Analysis and Environmental Biotechnology for the
Environmental Science and Management Program. He was recently selected as

158
the Young South-East-Asian Leaders Initiative (YSEALI) Professional Fellow of
Environmental Sustainability 2017, supported by the US Department of State,
allowing him to experience the environmental sustainability initiatives in the
states of New Hampshire (Hooksett), Maine (Wells National Reserve), Vermont
(White Mountain Biodiesel), Massachusetts (MIT) and Washington D.C.(DOE).
He is also a Certified Energy Manager (CEM), accredited under the ASEAN
Energy Management Scheme (AEMAS) of ASEAN Centre of Energy (ACE). Other
than his academic pursuit, he is fond of reading, backyard gardening and walking
nature trails.
Dr. Mohd Yazed Ahmad received the B.E. degree from the Department of
Electrical Engineering, University of Malaya, Kuala Lumpur, Malaysia, in 2003, the
M.S. degree from the Department of Biomedical Engineering, Faculty of
Engineering, University of Malaya, in 2006, and the Ph.D. degree from the
University of Technology, Sydney, Australia, in 2013. He is currently a Senior
Lecturer with the Department of Biomedical Engineering, Faculty of Engineering,
University of Malaya. His current research interests include wireless power
transfer, RFID, instrumentation systems, Smart space, IOT and Energy
monitoring & management systems.
Professor Dr. Debra Si-Mui Sim is currently a professor in the Department
of Pharmacology, Faculty of Medicine, University of Malaya. She obtained her
B.Sc. (Hons) and Ph.D. in Pharmacology from the University of Liverpool, U.K.,
before joining the present university as a lecturer in 1984. Debra is actively
involved in the teaching-learning activities of the Faculty of Medicine, serving in
the Medical Education and Research Development Unit (MERDU) and as the
faculty Problem-Based Learning (PBL) Coordinator. She is the Secretary of the
Asia-Pacific Association on PBL in Health Sciences (APA-PHS) and the Vice-
President of Malaysian PBL Practitioners (MyPBL). Debra was a 2007-Fellow of
the FAIMER Institute, based in Philadelphia, USA. Her FAIMER project was on
the training of prescribing skills in undergraduate medical students, which later
developed into a module that involves interprofessional learning (IPL) between
final-year medical and pharmacy students. She also chairs the Institutional Animal
Care and Use Committee (IACUC) and sits in the UM Eco-Campus Standing
Committee. Debra’s research interests include pharmacokinetics, snake venom
pharmacology, PBL, prescribing skill training, IPL and action research.
Dr Pauline Lai Siew Mei is an Associate Professor in the Department of
Primary Care Medicine, University of Malaya. She graduated from the Victorian
College of Pharmacy (Melbourne) and obtained her Doctorate from the
University of Malaya (Malaysia). Her area of research is on osteoporosis, vitamin
D inadequacy, improving patient/drug safety, patient education, validation of
instruments of measure (quality of life, knowledge and satisfaction
questionnaires) and antibiotic stewardship projects. Before her switch to the

159
academic line, she practised as an industrial and hospital pharmacist in the field
of medical information, and pharmacy computerisation. She has published several
articles in international peer reviewed journals and presented in many
conferences. Dr Lai has been invited to be an external reviewer for several
journals. She has won several awards for best oral and poster presentations.
Apart from her academic achievements, she also represents the University of
Malaya in the annual UM-NUS golf tournament.
Dr Tan Kit Mun is a consultant geriatrician in the University of Malaya Medical
Centre (UMMC). She received her medical degree MB BCh (II Hons) from
Trinity College, University of Dublin, Ireland in 1999. Dr. Tan is a member of the
Royal College of Physicians Edinburgh, (MRCP) UK since 2002. She completed
her specialist training and received her CSCST in Geriatric Medicine and General
Internal Medicine from the Royal College of Physicians Ireland in 2009. She was
practising as a consultant geriatrician in Dublin from 2009 until she returned
home to Malaysia to work in UMMC in 2013. Dr Tan's special interests include
stroke, atrial fibrillation, dementia, hypertension in the older person,
osteoporosis, patient safety and comprehensive geriatric assessment of the
complex older person. Dr Tan is also a Senior Lecturer in the Department of
Medicine, Faculty of Medicine, University of Malaya.
Mary Lee Hong Gee is a lecturer in the Department of Pharmacy, Faculty of
Medicine, University of Malaya since 2006. She obtained her Bachelor of
Pharmacy degree from Curtin University of Technology, Perth Australia in 1995.
After working for several years, she went for further study and subsequently
obtained her Master of Pharmacy degree (Clinical Pharmacy) from Universiti
Sains Malaysia, Penang, Malaysia in 2004. After graduated from her bachelor
degree, she worked as a pharmacist in community pharmacies in Australia. She
worked in private hospital’s pharmacy and community pharmacies as pharmacist
and purchasing officer when she came back to Malaysia in 1996. She also took
the opportunity to work in a hospital in Singapore after obtaining her Master
degree. She is the member of various Pharmacy professional bodies in Malaysia,
Australia and Singapore. She is actively involved in research and her research
interest is in the field of pharmacy practice and clinical pharmacy; looking at the
use of medicine, and community and hospital pharmacy practices. In year 2012,
she enrolled as a PhD student under the University of Malaya and explored into
the medication-related issues encountered by the caregivers of patients with
neurological disorders.
Che Zuraini Sulaiman is the Chief Pharmacist in the Department of Pharmacy,
University of Malaya Medical Centre. She graduated with a Bachelor of Pharmacy
(Hons) from the University of Science (Malaysia) in 1985 and obtained her
Masters in Clinical Pharmacy from Universiti Kebangsaan Malaysia in 2004. She is
actively involved in several committees in the hospital where she works. She is
the Chairman of Medication Safety Committee and also Secretary to Drug and

160
Therapeutic Committee. She is also the chairman of the SAE subcommittee
under Medical Research and Ethics Committee (MREC) in the UMMC. Since
2015, she has been involved in quality system management where was appointed
as Lead Internal Auditor (ISO 9000) for her hospital. She has co-authored a few
published articles in the field of clinical pharmacy in international peer reviewed
journals throughout her career.
Dr. Sumiani Yusoff is an Associate Professor at the Faculty of Engineering,
UM, specialising in Environmental Engineering and Management. She obtained her
PhD in Environmental Engineering and Management from University of Malaya,
MSc in Public Health and Environmental Control Engineering from University of
Strathclyde, Glasgow, Scotland, United Kingdom and Bachelor of Civil
Engineering (Hons) from Universiti Teknologi Malaysia. Currently she is Dean of
Sustainability Science Research cluster in UM. Prior to that she was the Deputy
Director and Chief Auditor of the Quality Management and Enhancement Centre
(QMEC), UM. A Civil Engineer by training, her research interests and area of
specialisation include environmental management systems, life cycle management
and assessment, environmental impact assessment, environmental planning and
management using Geographical Information System (GIS), integrated solid waste
management, eco-design and sustainable production, eco-labelling, and
environmental reporting.
Jaron Keng is the research officer of UM Zero Waste Campaign. He was the
key person to initiate the campaign since year 2010. He has a bachelor degree in
environmental engineering. Since the final year of his degree, he realized the
importance of waste segregation at source and separate collection. With
determination and enthusiasm, he started several recycling and biowaste
treatment projects in UM. Throughout the journey, Jaron realized the
importance of the policy and economy instruments, technology know how,
behavioral change, public awareness, financial model, legal aspect, etc in solving
environmental issues. Realizing the market failure and negative externalities of
waste management, he continued his Master of Public Policy in INPUMA, UM to
gain knowledge on how to curb environmental issues with multidisciplinary
expertise. Besides his environmental involvement in UM, Jaron is involved in
some NGOs such as AECCOM, Ensearch, MNS, etc and he is the secretary of
Green and Blue Environmental Protection Society and Sustainable Urban Living
Association of Malaysia. Jaron is also aspired to develop integrated waste
management in Malaysia which is an uphill challenge to move forward but with
many promising potentials as well as the saying “In any crisis there is
opportunity”.
Dr. Norbani Che-Ha is an Associate Professor and Head of Department of
Marketing, Faculty of Business and Accountancy, University of Malaya, Kuala
Lumpur. Her research interests are in marketing capabilities, consumer behavior
and small and medium enterprises. She publishes widely in several journals such

161
as Journal of Business Research, Journal of Strategic Marketing, Marketing
Intelligent and Planning and many others. She also contributes to several book
chapters and has many books on her own.
Saad Mohd Said is a Senior Lecturer at Department of Economics, Faculty of
Economics and Administration, University of Malaya, Kuala Lumpur. His
research interests are in small and medium enterprises, macroeconomics
performance and policy, labor productivity and services industry. He has
published several books related to his areas of interest. He is actively involved
in research and consultancy work for various private and public institutions in
and outside Malaysia.
Dr. Yap Soon Poh is a Senior Lecturer at the Department of Civil Engineering
in Faculty of Engineering, University of Malaya. Dr. Yap possess a PhD degree in
Civil and Structural Engineering from the Faculty of the Engineering, University
of Malaya. He has teaching experience in the specialization of concrete and civil
engineering materials, structural designs, structural analysis, and engineering
mechanics. His current research interests are on green concrete, construction
and agricultural wastes recycling, special concrete, and organic structural design.
Dr. Yap is the committee member of the Technical Committee on Earthquake
Jawatankuasa Kecil Penyelarasan Penyelidikan Gempa Bumi dan Tsunami which
prepare the Malaysia Annex for Earthquake design standard. His current research
projects are development of waterproofing concrete mortar, green pervious
concrete, construction wastes recycling in concrete and micro-mechanics
characterization of civil engineering materials.
Hussein Adebayo Ibrahim is a PhD student at the Department of Civil
Engineering in Faculty of Engineering, University of Malaya. His research interest
is Construction Technology and Management. His research interests are on
pervious concrete, waste recycling in concrete materials, structural material
characterizations and more. Mr. Adebayo is currently active in various research
and consultation projects including sustainable structural design, structural
rehabilitation, structural integrity inspection, green concrete and pervious
concrete.
Dr. U. Johnson Alengaram is currently an Associate Professor at the Faculty
of Engineering, University of Malaya. He obtained his Bachelor of Civil
Engineering from University of Madras, India. In his Masters in Structural
Engineering, as part of his MEng thesis, he utilized jute as replacement for wood.
His project was acclaimed as one of the best innovative works and the specimens
of his research project - Jute Sandwiched Plywood were displayed at the
International Exhibition held in Delhi, India. Dr. Manmohan Singh, Prime Minister
of India (then Union Finance Minister) who inaugurated the exhibition had special
word for his work on jute; his current research work includes development of
sustainable concrete using local waste materials. Dr. Johnson has been in

162
teaching, research and administration for over 18 years and contributed to the
society in different capacities in India, Bahrain and Malaysia. His current research
involves material properties, structural behaviour of lightweight concrete,
utilization of waste materials in concrete, functional behaviour etc. He has about
40 articles published in international journals and conferences. He is also
Chartered Civil Engineer of world renowned Institution of Civil Engineers (ICE,
UK) and the Engineering Council (UK); he is also member of American Concrete
Society (ACI-Kuala Lumpur Chapter) and Concrete Society of Malaysia.
Dr. Mo Kim Hung is a Senior Lecturer at the Department of Civil Engineering
in Faculty of Engineering, University of Malaya. Dr. Yap obtained his PhD degree
in Civil and Structural Engineering from the Faculty of the Engineering, University
of Malaya. He has teaching experience in the specialization of concrete and
structural engineering, structural designs, structural analysis, engineering
mechanics and engineering mathematics. His current research interests are on
green concrete, special concrete, cementitious composites, and structural
repairs. Dr. Yap is the committee member of the Jamilus Research Centre (JRC)
- Sustainable Construction and executive committee for American Concrete
Institute (ACI) - Kuala Lumpur Chapter. His current research projects are
development of waterproofing concrete mortar, development of smart concrete
materials, cementitious composites for structural repairs and masonry
structures.
Dr. Ahmad Saifizul Abdullah is currently a Senior Lecturer at the University
of Malaya, Malaysia. He is also a Director of a UM spin-off company called
Integrated Transportation Solutions Sdn. Bhd. which was established to
manufacture and market various R&D outputs related to intelligent transport
system. He is also actively work as a consultant to various government agencies
and private companies locally and internationally. Dr Ahmad Saifizul Abdullah and
his team have been involved in various research topics that deal with intelligent
and sustainable transportation and issues that are pertinent to local predicament.
Recently, his research focus is to contribute towards reducing road accident
fatalities, reducing road pavement damage, and reducing CO2 emission from
vehicular traffic especially those involving heavy vehicles. Dr. Ahmad Saifizul
Abdullah has won many international awards for his R&D works. Among the
prestigious awards he has received are “Best of the best awards” in Malaysian
Technology Expo 2013, “Best Paper Award – Discovering Interesting Facts” at
9th Eastern Asia Society for Transportation Studies Conference 2011, and
“Outstanding paper award” at 17th Intelligent Transportation System (ITS)
World Congress, 2010. He also has collaboration work with researchers across
the region where recently he has been appointed as one of co-researchers for a
grant named Grants-in-Aid for Scientific Research by Japan Society for the
Promotion of Science (JSPS). He has also published more than 50 scientific and
technical papers, secured more than 20 research grants, and filing a number of
patents.

163
Dr. Onn Chiu Chuen is a senior lecturer and researcher at the Department
of Civil Engineering Faculty of Engineering, University of Malaya. He holds a BSc.
in Engineering (Environment), MSc and PhD in Environmental Engineering from
the Department of Civil Engineering, University Malaya. In line with his academic
background, Onn’s research interest is quite wide-ranging under the
Environmental Engineering. However, his main interests are Life Cycle
Assessment and carbon footprint measurement particularly within the context
of waste (WTE, biogas), energy (biofuels) and transportation (energy, modeling).
164
Index
A
Agriculture 89
B
Biofiltration 27
C
Carbon footprint 3, 43, 89, 126,
142
Carbon sequestration 26, 28, 32
Conservation 72, 75, 78
Construction waste 72, 100
D
Development 3, 89, 101
E
Energy management 41
Environmental degradation 143
G
Green building 46
I
Indoor Environmental Quality 1, 2
16
Integrated waste management 75,
78, 80
Intelligent Transportation System
113, 114
M
Medicinal products 59
P
Planning 41, 89, 122, 142, 154
Q
Quality of life 72, 114
S
Sustainable development 27, 36,
61, 76, 82
Sustainable energy 40, 42
T
Traffic congestion 113, 114, 116,
120, 122, 124, 126, 140, 142
U
Urban heat island 26, 27
Urbanisation 27, 126
V
Vertical greenery system 26, 27
W
Waste management 71, 86

