understanding the stock market - smart woman securities 2... · 2009-05-05 · –coca-cola (ko)...
TRANSCRIPT

Understanding the Stock Market
SpeakerPosition
Company
smartwomansecurities
© 2007 Smart Woman Securities. Materials are for
SWS members’ use only. All rights reserved.
Date

Announcements
• Please enter any SWS related announcements here.
Tonight’s Agenda
• Market Update
• Introduction to Stocks
• The Stock Market
• Investing in Stocks
• Investor Behavior
• Lessons from Successful Investors

Market Update
•Have speaker comment on what happened in the markets for past week.
•We encourage speakers to create a slide of important occurrences (see next slide for example).
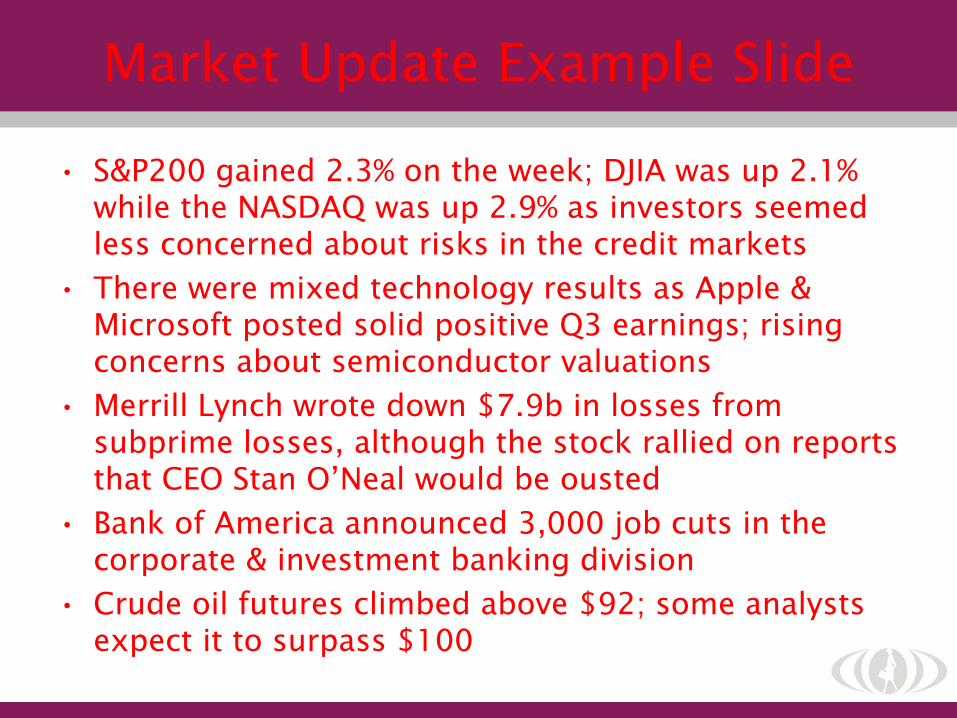
Market Update Example Slide
• S&P200 gained 2.3% on the week; DJIA was up 2.1% while the NASDAQ was up 2.9% as investors seemed less concerned about risks in the credit markets
• There were mixed technology results as Apple & Microsoft posted solid positive Q3 earnings; rising concerns about semiconductor valuations
• Merrill Lynch wrote down $7.9b in losses from subprime losses, although the stock rallied on reports that CEO Stan O’Neal would be ousted
• Bank of America announced 3,000 job cuts in the corporate & investment banking division
• Crude oil futures climbed above $92; some analysts expect it to surpass $100

Introduction to Stocks

What are stocks?
• Stocks are also often referred to as equities• Types of stock:
– Common, Preferred, and Treasury
– Common stock is the most prevalent and is the type most issued by companies for the public to purchase
• Attributes of stocks• Market Capitalization (Size) – Changes everyday
– Large-cap, $5 billion – Mid-cap, $1-5 billion– Small-cap, below $1 billion
• Classification– Growth, Value, Income– Cyclical, Defensive, Blue-Chip– Classification can change with time as a company matures (Microsoft, MSFT) or reinvents
itself (Apple, APPL)
• Domestic and International
Market Cap = How many shares outstanding x Current price of one share of stock
Example: McDonald’s (MCD): 1.12 billion shares x $70/share = $78.4 billion market cap

Stock Classificationstype of stock what kinds of investment example
value
growth
income
Refers to a stock that is undervalued in terms of its trading
price v. book value. Typically, such a stock has been sold off
by investors for reasons such as litigation, product issues,
marketing. Book value of the company based on tangible
assets, however, exceed the current market price
Orleans Homebuilders
(OHB)
A growth stock is a company with incredible growth potential
because of its market, product, segment or situation. For
example, pharmaceutical companies manufacturing specific
drugs may be considered growth stocks. Growth stocks are
generally hard to identify and are usually riskier
Google (GOOG)
Income stocks are companies with a reliable track record of
paying out dividends on a regular basis. Income stocks are
very popular with retirees or investors who want a steady
inflow of income
Southern Company
(SO)
Source: moneyinstructor.com

Stock Classificationstype of stock what kinds of investment example
cyclicalTypically, cyclical stocks are companies whose earnings tend to
follow the business cycle. Cyclical stocks are often more risky
than stocks in companies that are less subject to changes in the
business cycle. Highly cyclical industries include oil and other
natural resources, steel, and housing.
Caterpillar(CAT)
Source: moneyinstructor.com
defensivePrices of these stocks tend to remain stable or perhaps rise
during periods of economic downturn. During economic
upturns, they tend to show poorer results relative to other
companies. Defensive stocks produce goods or services that
are generally still in demand during an economic downturn,
such as food, beverages, and pharmaceuticals.
Clorox (CLX)
blue-chipRefers to a company with a well established reputation that has
a long record of financial stability. Usually these companies
pay out dividends. “Blue-chip” designation is debatable
General Electric
(GE)

Why Do Stock Prices Change?
• Company Specific News– CEO quits– New product launched
• Industry News– US Government sues tobacco industry– Hurricane Katrina and Rita disrupt oil refining/delivery
• Earnings Announcements– Shaw Group (SGR) reports quarterly profits are up because of increased
construction of power plants
• Direct Competitor Makes an Announcement– Coca-Cola (KO) says it will dramatically raise marketing spending. Pepsi
(PEP) stock is affected negatively
• General Investor Confidence– People are concerned with financial crisis, so they begin selling out of
financials and other industries affected

The Stock Market

• ―Stock Market‖ is the Total Market for Stocks / Equities– All Stocks Available to Publicly Buy or Sell
• Supply and Demand and Financials Drive Stock Prices– Focus on Fundamental Analysis of Earnings, Cash Flow, Etc.
But…..
– Herd Behavior and Investment Sentiment are Large Factors
– Behavioral Finance
• The ―Market‖ is Global– Total Global Market Cap. Is Approximately $51 Trillion
– More than 50% of the Market Capitalization of Stocks is Outside the U.S.
The Stock Market
• Buy- Side Refers to Investors Looking to ―Buy‖ / Invest– Individuals
– Mutual Funds
– Endowments and Foundations
– Pension Funds and Retirement Plans
– Buy-Side Research Analysts working for Mutual Funds, etc.
• Sell-Side Refers to Creating and ―Selling‖ Securities– Investment Banks
– Companies looking to raise capital
– Sell-Side Research Analysts working for Investment Banks
Buy-Side and Sell-Side

Stock Exchanges
• Stock Market vs. Stock Exchange– An “Exchange” is Where You Buy or Sell Stocks– The “Market” is ALL Stocks Traded on Exchanges
• Physical and/or Virtual ―Store‖– Sell-Side Stocks the Shelves– Buy-Side Buys and Sells– NYSE Floor and NASAQ Computers Market
• U.S. and Global Stock Exchanges– Major U.S. (NYSE, NASDAQ, AMEX, CBOT / Options)– Regional U.S. (Boston, ICE / Denver, Philadephia)– Asia (Nikkei / Japan, Hang Sang / Hong Kong, etc.)– Europe (London, Frankfurt, Milan, Paris, etc.)

• A Stock Index is a Grouping of Stocks Constructed to Measure Past Performance and Trends
• An Index can be Used for a Proxy for How the “Market” is Performing in Dollar and Percentage Terms
• Indices Are Constructed by Various Financial Firms– Dow Jones Co. – Dow Jone Industrial Average (DJIA)
– Standard and Poors (S&P 500)
– Russell Co. (Russell 1000)
– Wilshire (Wilshire 5000)
– Lehman Brothers (Lehman Brothers Aggregate – Bonds)
Stock Index

• Dow Jones Industrial Average (DJIA)– The “Dow” is 30 “Blue Chip” Stocks Selected by the Wall
Street Journal
(General Electric, Microsoft, etc.)
– Most Widely Quoted in the Press but Narrow Representation of the Broad Market
• Standard & Poor’s 500 (S&P 500)– The “S&P” is 500 primarily Large Cap U.S. Stocks Selected
by Standard & Poors to Give a Broad Representation of the U.S. Stock Market
– The S&P500 is the Standard Institutional Benchmark / Measure of Stock Market Performance
– Most Mutual Funds and other Managers Are Ultimately Compared the S&P500 for Benchmarking
U.S. Broad Stock Indices

Investing in Stocks
$10
$100
$1,000
$10,000
Dec-4
9
Sep-5
3
Jun-5
7
Mar-
61
Dec-6
4
Aug-6
8
May-7
2
Feb-7
6
Nov-7
9
Aug-8
3
May-8
7
Jan-9
1
Oct-
94
Jul-98
Apr-
02
Dec-0
5
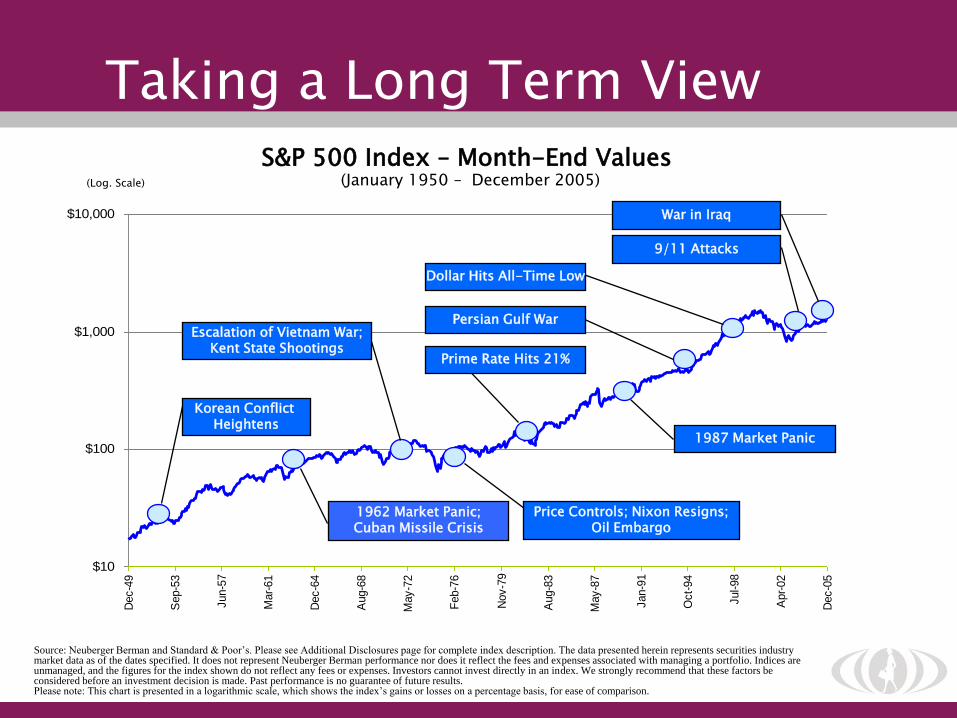
Source: Neuberger Berman and Standard & Poor’s. Please see Additional Disclosures page for complete index description. The data presented herein represents securities industry market data as of the dates specified. It does not represent Neuberger Berman performance nor does it reflect the fees and expenses associated with managing a portfolio. Indices are unmanaged, and the figures for the index shown do not reflect any fees or expenses. Investors cannot invest directly in an index. We strongly recommend that these factors be considered before an investment decision is made. Past performance is no guarantee of future results. Please note: This chart is presented in a logarithmic scale, which shows the index’s gains or losses on a percentage basis, for ease of comparison.
(Log. Scale)
S&P 500 Index – Month-End Values (January 1950 – December 2005)
Escalation of Vietnam War;Kent State Shootings
1962 Market Panic;Cuban Missile Crisis
Prime Rate Hits 21%
Persian Gulf War
1987 Market Panic
9/11 Attacks
Korean Conflict Heightens
Dollar Hits All-Time Low
Price Controls; Nixon Resigns;Oil Embargo
War in Iraq
Taking a Long Term View

0
Year to Date - through December 31, 2002
50 52 54 56 58 60 62 64 66 68 70 72 74 76 78 80 82 84 86 88 90 92 94 96 98 0 2
-30%
-20%
-10%
0%
10%
20%
30%
40%
50%
60%
-30%
-20%
-10%
0%
10%
20%
30%
40%
50%
60%
0.0
%
31
.7%
23
.9%
18
.4%
-1.0
%
52
.6%
31
.6%
6.5
%
-10
.8%
43
.4%
12
.0%
0.5
%
26
.9%
-8.7
%
22
.8%
16
.5%
12
.5%
-10
.1%
24
.0%
11
.1%
-8.5
%
3.9
%
14
.3% 1
9.0
%
-14
.7%
-26
.5%
37
.2%
23
.9%
-7.2
%
6.6
%
18
.6%
32
.5%
-4.9
%
21
.5%
22
.6%
6.3
%
31
.7%
18
.7%
5.3
%
16
.6%
31
.7%
-3.1
%
30
.5%
7.6
% 10
.1%
1.3
%
37
.6%
23
.0%
33
.4%
28
.6%
21
.0%
-9.1
%
-11
.9%
-22
.1%
Percentage Gain or Loss
Copyright © 2003 CRANDALL, PIERCE & COMPANY • All rights reserved. • 14047 West Petronella Drive • Libertyville, Illinois 60048 • 1-800-272-6355 • Internet: www.crandallpierce.com
Sources: Standard & Poor's Corporation; Copyright © 2003 Crandall, Pierce & Company • All rights reserved.This copyright protected illustration is for internal use only. Under no circumstances may this illustration be copied, reproduced or redistributed in whole or in part including the data contained herein, without prior written permission from Crandall, Pierce & Company.
The information presented herein was compiled from sources believed to be reliable. It is intended for illustrative purposes only, and is furnished without responsibility for completeness or accuracy. Past performance does not guarantee future results.
40
53
13
75%
100%
25%
20.94%
13.19%
-10.65%
Positive
All Years
Negative
Numberof Years
Percentageof Years
AverageReturn
0
Stocks Can Be Negative But …

Source: Standard & Poor’s, Neuberger Berman. Please see Additional Disclosures page for complete index description.
The data presented herein represents securities industry market data as of the dates specified. It does not represent Neuberger Berman performance nor does it reflect the fees and
expenses associated with managing a portfolio. Indices are unmanaged, and the figures for the index shown do not reflect any fees or expenses. Investors cannot invest directly in an
index. We strongly recommend that these factors be considered before an investment decision is made. Past performance is no guarantee of future results.
-1%
4%
9%
14%
19%
1935
1937
1939
1941
1943
1945
1947
1949
1951
1953
1955
1957
1959
1961
1963
1965
1967
1969
1971
1973
1975
1977
1979
1981
1983
1985
1987
1989
1991
1993
1995
1997
1999
2001
2003
2005
Best 10 Years:
20.08%
95th Percentile:
18.32%
Median :
11.07%
5th Percentile:
01.50%
Worst 10 Years:
-00.85%
S&P 500: 10-Year Rolling ReturnsAnnualized, 1935-2005
… Make Money Over Time And ...

$0
$1
$10
$100
$1,000
$10,000
$100,000
De
c-2
6
De
c-2
8
De
c-3
0
De
c-3
2
De
c-3
4
De
c-3
6
De
c-3
8
De
c-4
0
De
c-4
2
De
c-4
4
De
c-4
6
De
c-4
8
De
c-5
0
De
c-5
2
De
c-5
4
De
c-5
6
De
c-5
8
De
c-6
0
De
c-6
2
De
c-6
4
De
c-6
6
De
c-6
8
De
c-7
0
De
c-7
2
De
c-7
4
De
c-7
6
De
c-7
8
De
c-8
0
De
c-8
2
De
c-8
4
De
c-8
6
De
c-8
8
De
c-9
0
De
c-9
2
De
c-9
4
De
c-9
6
De
c-9
8
De
c-0
0
De
c-0
2
De
c-0
4
Large Company Stocks Inflation
Small Company Stocks Government Bonds
Cash
$13,706 12.7%
$63 5.3%
EndingValue
AverageReturn
$2,657 10.4%
$18 3.7%
$11 3.0%
Hypothetical value of $1 invested in 1926.
Source: Ibbotson Associates, Neuberger Berman. Past performance is not indicative of future results.
Small Company stocks represented by the fifth capitalization quintile of stocks on the NYSE for 1926-1981 and performance of the Dimensional Fund Advisors (DFA) Small Company
Fund thereafter, Large Company Stocks represented by the S&P 500 Index which is an unmanaged group of securities and considered to be representative of the stock market in general;
Government Bonds represented by 5-year US Government Bonds; Cash is represented by the 30-day U.S. Treasury Bill. Please note that indices are unmanaged and do not take into
account any fees or expenses of investing in the individual securities that they track, and that individuals cannot invest directly in an index. Data about the performance of these indices is
prepared or obtained by Neuberger Berman and includes reinvestment of all dividends and capital gain distributions. See Appendix for complete description of each index.
1926-2005
Over the Long Term Outperform
Investor Behavior

Investing
• Means to an End – Not A Competition– No One Investment or Investment Style Fits All
– Pick “Your” Way
• Have a Long-Term View
• Diversify, Diversify, Diversify– Stocks, Bonds Cash
– Large Cap, Small Cap, International
– Balance of Growth and Value Styles
• Stay Emotionally Balanced– Understand Your Risk

Investment Risks Defined
• Market Risk– Negative Performance in the Stock Market
• Inflation Risk– If Your Returns Do Not Outpace Inflation Your Purchasing
Power Goes Down
– Stocks Can Be A Good Hedge Against Inflation
– Bonds Can Underperform In Periods of High Inflation
• Company Risk– Individual Stock Risk Due to Poor Management or Financials

Risk Considerations
• What Is Your Definition of Risk
– Absolute or Relative
– Volatility (Standard Deviation of Returns) or….
– Money Lost
• Understand Liquidity Needs
• Have a Long-Term View but….
• Time Is On Your Side– Start Early
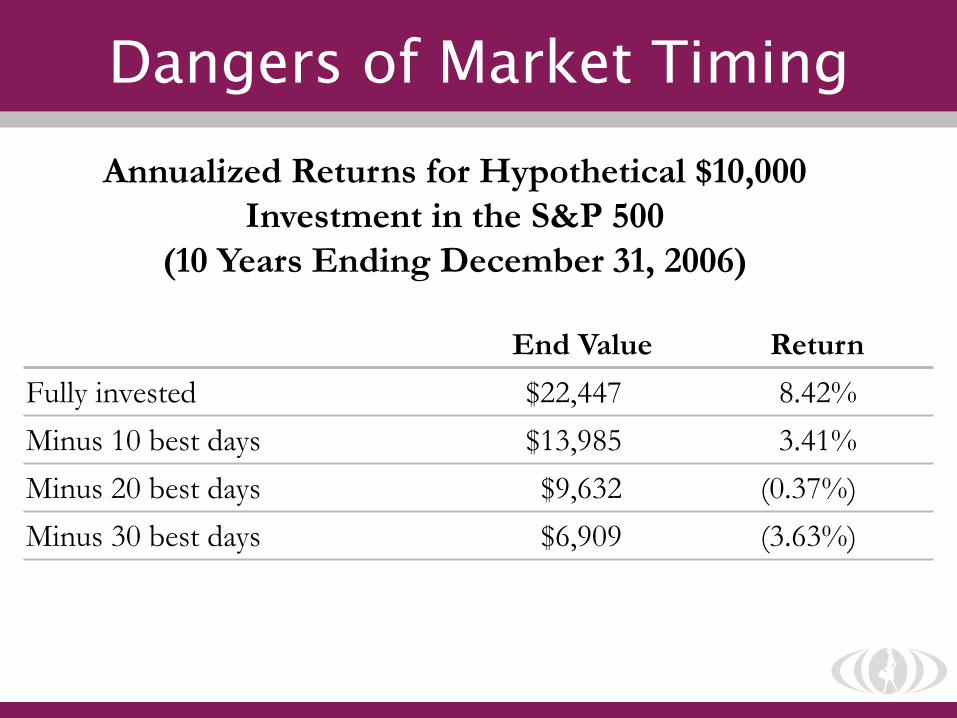
Dangers of Market Timing
End Value Return
Fully invested $22,447 8.42%
Minus 10 best days $13,985 3.41%
Minus 20 best days $9,632 (0.37%)
Minus 30 best days $6,909 (3.63%)
Annualized Returns for Hypothetical $10,000
Investment in the S&P 500
(10 Years Ending December 31, 2006)
Behavioral Finance
• Perceptions and Sentiment Can Effect Stock Prices
• Behavior Finance Considerations– Pain Avoidance (Taking Losses Is Painful)
– Overconfidence (Investors Tend to Overreact to News)
– Anchoring (Don’t Fall In Love)
– Herd Mentality (Bubbles)o Tech
o Tulips
o Housing?

________________Source: Strategic Insight.Indices are unmanaged, and the figures for the index shown include reinvestment of all dividends and capital gain distributions and do not reflect any fees or expenses.Investors cannot invest directly in an index. We strongly recommend that these factors be considered before an investment decision is made. The data presented herein represents securities industry market data as of the date specified. It does not represent Neuberger Berman performance nor does it reflect the fees and expenses associated with managing a portfolio. Past performance is not indicative of future results.
Mutual Fund Flows – Tech / Telecom
– At the height of the technology market bubble, investors flocked to tech funds at precisely the wrong moment
-20
0
20
40
60
Jun-99 Dec-99 Jun-00 Dec-00
($ billions)
March 13, 2000: NASDAQ peaks at 5049
Don’t Follow the Herd

Herds and Bubbles
Source: Bigcharts.com

Diversification in Stocks
• Risks of No Diversification– Large Cap Growth Stocks -22.42%
– Small Cap Growth -22.43%
• Rewards of Prudent Diversification– Small Cap Value Stocks 22.43%
– Bonds - Fixed Income 11.85%
– Large Cap Value 7.01%
1 Year Returns – Period Ending 12/31/00

*Invested from 1986-1995. From 1995-2004 investment grew. This is for illustrative purposes only and not indicative of any investment. Past performance is no guarantee of future results. Source: Ibbotson
Associates. The hypothetical results presented herein are based on historical index returns of the S&P 500. The results do not represent the performance of any Neuberger Berman managed account or product
and do not reflect the fees and expenses associated with managing a portfolio. These returns are used for discussion purposes only. They are not intended to represent, and should not be construed to represent
a prediction of future rates of return. Results are on a pre-tax basis. Investment is made at the beginning of each year.
The data presented herein represents securities industry market data as of the dates specified. It does not represent Neuberger Berman performance nor does it reflect the fees and expenses associated with
managing a portfolio. The material is based upon information that we consider reliable, but we do not represent that it is accurate or complete, and it should not be relied on as such. Indices are unmanaged,
and the figures for the index shown include reinvestment of all dividends and capital gain distributions and do not reflect any fees or expenses. Investors cannot invest directly in an index. We strongly
recommend that these factors be considered before an investment decision is made.
Investor B Investor C
Years Contributing: 10 10*
Annual Amount Contributed: $4,000 $2,000
1996-2005
1986-2005
Start Early - Compounding
$20,000
$40,000
$97,787
$49,436
•$0
•$20,000
•$40,000
•$60,000
•$80,000
•$100,000
•$120,000
•$140,000
Total Amount Invested
Compounded Value atYear-End 2005

Lessons From Successful Investors

Peter Lynch – Fidelity
• Peter Lynch Started Managing the Fidelity Magellan Fund in 1977– $18 million to Start
• Lynch Left Magellan in 1990– $14 billion at the End
– Outperformed the S&P 500 11 out of 13 Years
– Produced an Average Annual Return of 29%
Source: Wikipedia.com

Lynch’s Philosophy
• Know What You Own– Do It Yourself
• Futile to Predict Economy and Interest Rates
• Focus on Individual Companies• Avoid Long Shots• Buy Good Businesses and Good
Managers• Be Flexible and Accept Mistakes• Before You Purchase Have Targets
"Go for a business that any idiot can run – because sooner or later, any idiot is probably going to run it."
"If you stay half-alert, you can pick the spectacular performers right from your place of business or out of the neighborhood shopping mall, and long before Wall Street discovers them."
Lynch chose one company, Hanes,
in the 1970s because his wife bought and loved
its new L’Eggs pantyhose line —
the first department-store-quality pantyhose sold to American
women via supermarkets

Warren Buffett
• After reading “The Intelligent Investor” by Benjamin Graham, decided he wanted to study under Graham
• Started a family investment partnership at age 25– In First Year Tripled His Money ($100,000 to $300,000)
– Over the course of the next five years, the Buffett partnerships racked up an impressive 251.0% profit, while the Dow was up only 74.3%
– Ten years after its founding, the Buffett Partnership assets were up more than 1,156% compared to the Dow's 122.9%
• Today he is the second richest man alive in the US, after Bill Gates, with $52 billion.

Buffett’s Philosophy
• Proponent of Value Investing (buying undervalued assets)
• Investing Style of Discipline, Patience and Value Outperforms Over the Long-Term
• Buffett Invests in What He Calls “Wonderful Businesses”– Good Return on Capital, Low Debt
– Strong Cash Flow
– Strong Brand Recognition with Pricing Power
– Simple Business Models (Easy to Understand and Run)
– Predictable Earnings
– Management Has Shareholder Interest (“skin in the game”)
Source: Wikipedia.com, investopedia.com

Seminar Recap
• There are many different types of companies and stocks, which change with time.
• As an investor, you have to understand what meets your investment goals and invest in those types of stocks and investment vehicles.
• The stock market has many moving parts, but understanding how the process works is important when investing.
• Investors are not always rational, which leaves opportunities for you to invest. Make sure you don’t become an irrational investor.
• Some of the best stock pickers in the world rely on a few fundamental investment rules, which should help guide you as well.

• Week 3– Opening Your Personal Investment Account
– Comparing Brokers, Fees, Etc.
– Understanding Taxes and Other Practical Considerations
– Financial Basics of What Drive Analyst Recommendations
• Week 4-10– Researching stocks: Picking the stocks to invest in
o Financial statement analysis
o Basic valuation
o Making recommendations
“Investing without research is like playing stud poker and never looking at the cards."- Peter Lynch
Coming Up