understanding the role of places and activities on mobile
TRANSCRIPT

1
Understanding the Role of Places and Activities on Mobile PhoneInteraction and Usage Pa�erns
ABHINAV MEHROTRA, University College London, UKSANDRINE R. MULLER, University of Cambridge, UKGABRIELLA M. HARARI, Stanford University, USASAMUEL D. GOSLING, University of Texas at Austin, USA and University of Melbourne, AustraliaCECILIA MASCOLO, University of Cambridge and�e Alan Turing Institute, UKMIRCO MUSOLESI, University College London and�e Alan Turing Institute, UKP. JASON RENTFROW, University of Cambridge, UK
User interaction pa�erns with mobile apps and noti�cations are generally complex due to the many factors involved. Howevera deep understanding of what in�uences them can lead to more acceptable applications that are able to deliver information atthe right time. In this paper, we present for the �rst time an in-depth analysis of interaction behavior with noti�cations inrelation to the location and activity of users. We conducted an in-situ study for a period of two weeks to collect more than36,000 noti�cations, 17,000 instances of application usage, 77,000 location samples, and 487 days of daily activity entries from26 students at a UK university.
Our results show that users’ a�ention towards new noti�cations and willingness to accept them are strongly linked to thelocation they are in and in minor part to their current activity. We consider both users’ receptivity and a�entiveness, and weshow that di�erent response behaviors are associated to di�erent locations. �ese �ndings are fundamental from a designperspective since they allow us to understand how certain types of places are linked to speci�c types of interaction behavior.�is information can be used as a basis for the development of novel intelligent mobile applications and services.
CCS Concepts: •Human-centered computing! HCI design and evaluation methods; Empirical studies in ubiquitous andmobile computing;
Additional Key Words and Phrases: Mobile Sensing, Noti�cations, Application Usage, Context-aware Computing.
ACM Reference format:Abhinav Mehrotra, Sandrine R. Muller, Gabriella M. Harari, Samuel D. Gosling, Cecilia Mascolo, Mirco Musolesi, and P. JasonRentfrow. 2017. Understanding the Role of Places and Activities on Mobile Phone Interaction and Usage Pa�erns. PACMInteract. Mob. Wearable Ubiquitous Technol. 1, 1, Article 1 (July 2017), 22 pages.DOI: 10.1145/nnnnnnn.nnnnnnn
1 INTRODUCTIONMobile phones today have become an indispensable part of our daily lives. Far from being simple calling instru-ments, they are now advanced computing platforms with always-on connectivity, high-speed data processing andadvanced sensing [21]. �ese a�ordances have opened the possibility of implementing novel context-aware andpersonalized applications that are able to assist us in a variety of day-to-day situations. At the same time, they
Permission to make digital or hard copies of all or part of this work for personal or classroom use is granted without fee provided thatcopies are not made or distributed for pro�t or commercial advantage and that copies bear this notice and the full citation on the �rstpage. Copyrights for components of this work owned by others than ACM must be honored. Abstracting with credit is permi�ed. To copyotherwise, or republish, to post on servers or to redistribute to lists, requires prior speci�c permission and/or a fee. Request permissions [email protected].© 2017 ACM. 2474-9567/2017/7-ART1 $15.00DOI: 10.1145/nnnnnnn.nnnnnnn
PACM on Interactive, Mobile, Wearable and Ubiquitous Technologies, Vol. 1, No. 1, Article 1. Publication date: July 2017.

1:2 • Mehrotra et al.
(a) (b) (c) (d)
Fig. 1. The MyLifeLogger application.
represent a unique platform for real-time delivery of information about a variety of events ranging from emailsto updates on online social networks, from advertisements to positive behavior change interventions [5, 20, 31].
�e advent of mobile sensing has provided a great opportunity for researchers and practitioners to investigateusers’ mobile interaction behavior. Mobile apps are now capable of recording information about users’ interactionswith mobile phones and the surrounding context (e.g., location, activity, audio environment, and collocation withother devices). �anks to the availability of this information, researchers have been able to conduct several studieson a variety of aspects of human-smartphone interaction. For example, studies have investigated the diversity inapp usage behavior of individuals [14], the characterization of mobile usage in rural and urban societies [13]or in di�erent socio-economic groups [32]. Others have focussed on the in�uence of personality [10, 11], theassociation between social context and app usage pa�erns [26], and users’ motivations for using di�erent typesof apps [18]. Moreover, some studies have also focused on understanding users’ app usage pa�erns for predictingtheir future interaction with apps [27, 38].Another particular aspect that has a�racted the a�ention of researchers given its practical importance is the
characterization of the reaction of users to noti�cations and the design of mobile noti�cation management systems.For example, some studies have investigated the factors that in�uence users’ a�entiveness and receptivity tonoti�cations [24, 30] and how these are in�uenced by context [28], content [23], and the complexity of an ongoingtask [24]. Other projects have aimed at anticipating users’ a�entiveness [30] and receptivity [22] to noti�cationsby learning their behavioral pa�erns.However, existing work has not considered the impact of the external factors, such as the type of locations
users are in and the activities they are currently carrying out, on their interaction with noti�cations and appusage behavior. A deep understanding of these factors would enable us to improve users’ experience andthe e�ectiveness of noti�cations as well as applications (e.g., marketing and positive behavior interventionapplications). Key challenges for such a study include data collection at a very �ne granularity, which mightrequire frequent inputs from users, and the extraction of high-level information from raw sensor data with thegoal of assigning semantics to it.
PACM on Interactive, Mobile, Wearable and Ubiquitous Technologies, Vol. 1, No. 1, Article 1. Publication date: July 2017.

Understanding the Role of Places and Activities on Mobile Phone Interaction and Usage Pa�erns • 1:3
To bridge this gap, in this paper we present the �rst in-situ study of the impact of location and activities onusers’ interaction with mobile noti�cations and applications. Over a period of two weeks, we collected morethan 36,000 noti�cations, 17,000 instances of application usage, 77,000 location samples, and 487 days of dailyactivity entries (i.e., 2984 activity instances) from 26 students at a UK university. Using this data, we investigateusers’ interaction with mobile noti�cations and apps when they are performing di�erent activities, when theyvisit di�erent types of locations, and locations with di�erent characteristics such as being boring vs. exciting, sadvs. happy, inactive vs. busy, lazy vs. productive, distressing vs. relaxing, and natural vs. urban.
�e key contributions and �ndings of this work can be summarized as follows:• We discuss an in-depth study of the relationships between users’ activities and interaction with noti�ca-tions and apps.• We discuss a quantitative evaluation of users’ interaction with noti�cations and apps when they are at
di�erent types of locations; this is important from a design perspective, since it allows us to understandhow certain types of places are linked to speci�c types of interaction behavior as a basis of the developmentof intelligent applications.• We present an extensive investigation of the impact of location characteristics on users’ a�entivenessand receptivity to noti�cations and app usage pa�ern. We consider di�erent characterization of places(e.g., urban, productive and so on) in relation to users’ interaction with noti�cations. Again, besides theinherent intellectual interest, the �ndings might be used in the design of personalized applications basedonly on the knowledge of the current location.
�rough our analysis we uncover various new insights about the phone usage and noti�cation interactionbehaviors of users and also, quite importantly, con�rm some �ndings of previous studies. More speci�cally, themain novel �ndings of our analysis are:
• Participants were more receptive to noti�cations while they were exercising and doing routine tasks.• Overall communication apps were used the most, except while participants were going to sleep, which iswhen they mostly used lifestyle apps.• Participants were more receptive to noti�cations when they were at college, in libraries, on streets, andthey were least a�entive while being at religious institutions.• �e app usage was highest while participants were at college or in libraries.• Participants used mostly music and reading apps while waiting at bus stops and train stations.• Participants were more a�entive to noti�cations at productive places compared to lazy places.• Participants were less receptive to noti�cations at natural places compared to urban places.• While at lazy, distressing and natural places participants used their phones less compared to productive,relaxing and urban places respectively.
�is study has led to many interesting insights that are discussed in detail in the following sections. First ofall, people pay less a�ention to noti�cations when they are preparing to go to bed (or they are in bed beforesleeping) and while exercising. People accept most noti�cations that are delivered while they are doing exerciseand routine tasks. When people are on streets, or in college, university and residential areas, they not only paymore a�ention towards noti�cations but also accept most of them. Also, people are more a�entive to noti�cationsat places that are characterized as “productive”. �ey accept more noti�cations at productive and urban places.Furthermore, overall phone usage duration as well as usage of speci�c apps vary when people visit speci�c typesof places and while performing speci�c activities. Overall app usage is highest while people are relaxing, atcollege or in libraries, whereas it is lowest while people are doing exercise, routine tasks or going to sleep, andwhen they are at gyms, religious institutions or in parking places.
We believe that the potential applications of this work are many. First of all the �ndings of this paper canbe used as a basis for the development of predictive applications that rely on the analysis of users’ current
PACM on Interactive, Mobile, Wearable and Ubiquitous Technologies, Vol. 1, No. 1, Article 1. Publication date: July 2017.

1:4 • Mehrotra et al.
locations and not only on their past behavioral pa�erns. More speci�cally, this is particularly important in thebootstrapping phase of intelligent applications that are based on learning algorithms that require a large historyof past interactions with the phones in order to make accurate prediction about users’ behavior. Examples includenoti�cation management systems, and pre-caching and pre-launching mechanisms for mobile applications.
2 RELATED WORKIn this section we review the related work in two key areas, namely the studies about the characterization ofusers’ interaction with noti�cations and those about users’ app usage behavior.
2.1 Understanding Users’ Interaction with NotificationsIn recent years the area of mobile interruptibility has received increasing a�ention. Previous studies have exploredvarious aspects of users’ interaction with mobile noti�cations [4, 6, 7, 12, 24, 29, 35]. In particular, in [35] Sahamiet al. show that users deal with around 60 noti�cations per day, and most of these are viewed within a few minutesof arrival. Additionally, by collecting the subjective feedback from mobile users, the authors demonstrate thatusers assign di�erent importance to noti�cations triggered by application from di�erent categories. At the sametime, Pielot et al. [29] show that personal communication noti�cations are responded to quickest because of socialpressure and the exchange of time critical information through communication applications (i.e., Whatsapp).On the other hand, as Iqbal et al. suggest in [19], users are willing to tolerate some disruption in return forreceiving noti�cations that contain valuable information. Similarly, in [24] Mehrotra et al. show that noti�cationscontaining important or useful content are o�en accepted despite the disruption caused by them.Moreover, other studies have also investigated how users’ a�entiveness and receptivity to noti�cations are
in�uenced by their context [28, 30] and content [16, 22, 23]. In [28], the authors show that the a�entivenessof users can be determined by contextual factors including activity, location and time of day. �ey propose amechanism that relies on these context modalities to predict opportune moments for delivering noti�cations.In [30] Pielot et al. propose a model that can predict whether a user will view a noti�cation within a few minuteswith a precision of approximately 81%. On the other hand, in [16] the authors show that users’ receptivity isin�uenced by their general interest in the noti�cation content, entertainment value perceived in it and actionrequired by it, but not the time of delivery. In [23] Mehrotra et al. suggest to use contextual information,sender-recipient relationship and application category that triggered the noti�cation for determining the user’sinterruptibility. In another study [22], the authors demonstrate that users’ receptivity to noti�cations is in�uencedby their location and the content of noti�cations delivered. �e authors propose a system that relies on machinelearning algorithms for the automatic extraction of rules that re�ect user’s preferences for receiving noti�cationsin di�erent situations.
2.2 Understanding Users’ App Usage BehaviorPrevious studies have investigated the association between users’ app usage behavior and various socio-economic [13, 14, 32] and psychological [10, 11, 26] factors. Others have focussed on users’ motivations for usingdi�erent types of apps [8, 18].More speci�cally, in [32], Rahmati et al. present a study that investigates how users with a certain socio-
economic status install and use apps. �eir �ndings con�rm the in�uence of socio-economic status on phoneusage. In [11], the authors show that there is a signi�cant association between users’ personality traits andphone usage. Furthermore, quite interestingly, in [18] Hiniker et al. provide evidence that users’ motivations forengaging with technology can be divided into instrumental and ritualistic.In [8], Bohmer et al. present a large-scale study with the goal of understanding users’ app usage pa�erns
based on their context. �e �ndings of this study demonstrate that users spend around an hour every day usingtheir phones, but their average session using an application lasts for a minute. Overall, communication apps get
PACM on Interactive, Mobile, Wearable and Ubiquitous Technologies, Vol. 1, No. 1, Article 1. Publication date: July 2017.

Understanding the Role of Places and Activities on Mobile Phone Interaction and Usage Pa�erns • 1:5
Group Feature Description
Noti�cation
Arrival time Time at which a noti�cation arrives in the noti�cation bar.Removal time Time at which a noti�cation is removed from the noti�cation bar.Sender application Name and package of the application that triggers the noti�cation.
Application UsageApp Name Name of the application.Launch Time Time at which the application is launched and appeared in the foreground.Background Time Time at which the application use is ended and it is moved from foreground
to background.
Phone Interaction Lock/unlock event Time at which the phone was locked and unlocked.Screen interaction Type of interaction (i.e., single click, long click and scroll), time and the name
of foreground applications (including home screen) with which the interactionhappened.
ContextLocation Geo-location of the places visited.Daily Activity Type and time duration of di�erent activities performed in a day. �ese activ-
ities include sleep, eat, work, physical exercise, social activity and relaxation.Table 1. Description of features from the dataset.
used most, except when users are traveling, in which case they are more likely to use multimedia apps. In [15],Ferreira et. al. conducted a study showing that app usage behavior of users is strongly in�uenced by their socialand spatial context. Also, Xu et al. [37] exploit the network tra�c from apps (based on HTTP signatures) todemonstrate that app usage is in�uenced by spatial and temporal factors including geographical areas and timeof the day. �eir �ndings also show that certain apps have a non negligible likelihood of co-occurrence.An open question in this area remains the impact of locations and activities on users’ interaction with
noti�cations. �e present study aims to bridge this gap by investigating the e�ects of these factors on users’a�entiveness and receptivity to noti�cations as well as on their app usage behavior.
3 METHODOLOGYIn this section we present our approach for investigating the in�uence of daily activities, type and characteristicsof visited locations on users’ app usage, and noti�cation interaction behavior.
3.1 LifeLogger AppGiven the aims of the proposed investigation, we designed and carried out an in-the-wild study [34] to collectusers’ data. More speci�cally, we developed an Android app called MyLifeLogger (shown in Figure 1). �e appperforms continuous sensing in the background to log users’ interaction with noti�cations, app usage, andcontext. Table 1 provides a description of the features captured by MyLifeLogger.
�e app relies on Android’s Noti�cation Listener Service [1] and Usage Stats Manager [2] to trace noti�cationsand application usage. Moreover, the app allows users to provide their daily activity schedules, for which areminder noti�cation is triggered every night at 9pm (local time). As shown in Figure 1(b), users were given a listof six possible daily activities:
• Eat: time period when a user is having food.• Sleep: time period for which a user slept. 1• Work: time period when a user is engaged in an activity involving mental or physical e�ort. Since ourparticipants are students, this activity would mostly consist of or be related to studying.
1It is worth noting that participants did not receive any standard de�nition of these activities before the study. �erefore, for example, someparticipants might have interpreted sleeping as being in bed.
PACM on Interactive, Mobile, Wearable and Ubiquitous Technologies, Vol. 1, No. 1, Article 1. Publication date: July 2017.

1:6 • Mehrotra et al.
• Exercise: time period when a user is performing health and �tness activities.• Social: time period when a user is socializing with others.• Relaxation: time period during which a user is being free from tension and anxiety.
It is worth noting that participants were able to select only one activity for a speci�c time interval. Moreover,they were allowed to enter other activities by selecting the other option, through which they could input anactivity name as free text. Most activities registered through the other activity option were related to routinetasks such as laundry, cooking, ge�ing ready, packing, supermarket and so on. �erefore, we created anothercategory for chores and mapped the routine tasks entered through the other activity option to this new activity.
�e MyLifeLogger app also collected additional data about other contextual features (such as movement, calland SMS logs) as well as mood-related questionnaires. However, we do not discuss those aspects of the databecause they are not used for the analysis presented in this paper.
3.2 Recruitment of the ParticipantsMyLifeLogger was published on Google Play Store2 and advertised to �rst-year undergraduate students at a UKUniversity. It was installed by 28 students and 26 students completed the study by keeping the app running ontheir phone for a minimum of two weeks. �ese participants come from both sexes (16 males and 10 females),with the age span between 18 and 27 years (mean = 19.46 and standard de�iation = 2.18). �e students wereenrolled in 15 di�erent courses and 27% (n=7) were non-British. All participants who completed the study weregiven £25.
3.3 Ensuring Privacy ComplianceIn order to allow the MyLifeLogger application to monitor noti�cations and app usage, the user has to give explicitpermission as required by the Android operating system. Moreover, the application also shows a consent formdetailing the information that is collected. �is ensures that the user goes through a two-level user agreementand is completely aware of the type of information captured by the application.
It is worth noting that we received ethical approval for the study, including all procedures and materials, fromthe Psychology Research Ethics Commi�ee at the University of Cambridge.
3.4 DatasetWe analyzed the data of 26 users who participated for a minimum period of two weeks. �e dataset correspondingto these users includes 36,106 noti�cations, 17,680 instances of application usage, 77,306 location samples, and487 days of daily activity entries (i.e., 2,984 activities).
3.4.1 Characterizing Locations. In order to perform our analysis on the impact of location on noti�cationresponse and application usage, we cannot just rely on sensor (i.e., GPS) data as it only provides the coordinatesof a place rather than its type and characteristics. �erefore, we manually categorized the locations by clusteringthem into signi�cant places, and then characterized the signi�cant places by having coders rate each place onseveral dimensions (e.g., the degree to which a place is inactive vs busy).
Identifying Signi�cant Places. First of all, we discard the location samples with more than 50 meters accuracyso that the estimated location clusters are of be�er quality. We then �nd the location samples that were collectedwhile users were moving and we also discard them. In order to infer such location points, we compute the speedof the user by using the distance and the time between the last and the current location points. If the speed is
2h�ps://play.google.com/store/apps/details?id=com.nsds.mystudentlife
PACM on Interactive, Mobile, Wearable and Ubiquitous Technologies, Vol. 1, No. 1, Article 1. Publication date: July 2017.

Understanding the Role of Places and Activities on Mobile Phone Interaction and Usage Pa�erns • 1:7
less than a certain threshold (i.e., 5 km per hour) we consider that location reading was collected when the userwas not moving.
Now, we use the location clustering approach presented in [36] for grouping the �ltered location samples. Weiterate over all location samples and for each location point we create a new cluster only if the distance of thislocation from the centroid of each existing cluster is more than 200 meters. Otherwise, we add this location tothe corresponding cluster and update its centroid. Finally, we consider all centroids as signi�cant places.
Identifying Place Type and Characteristics. Places can be described in terms of objective information, suchas whether a location is indoor or outdoor, or in a residential or industrial area, and also in terms of informationthat relates to users’ a�ective appraisals of them. Despite people’s experiences of course being subjective, theyon average agree on a variety of characteristics such as liveliness, pleasantness, and naturalness, to name afew [17, 25]. At the same time, we recruited coders belonging to the same demographics of the participants (e.g.,student status, average age, even gender distribution) to reduce the subjectiveness in place ratings. Moreover, wecomputed the similarity in the ratings to ensure that they are reliable.
On average, 53 signi�cant places (per person) were identi�ed in the two-week study period. For each participantwe selected the top ten places in which they had spent most time. We recruited four independent coders whowere undergraduate students themselves but not participants in the study. First, they were trained in person andprovided with a detailed handbook on the location coding process. A�er their training, they were provided witha list of coordinates (i.e., longitude and latitude) of the respective places, and they were asked to categorize andevaluate these places for the given characteristics by looking at them using Google maps.
In order to categorize the place type, we rely on Google’s Place Types [3] as the possible categories. Moreover,coders were provided with an option to enter an additional place type in case it was not present in the given list.In cases where a place type was unclear, coders used an “unclear” category to denote an ambiguous place. Finally,each place type that was classi�ed by four coders was merged by one of the authors. It is worth noting that we�ltered out the categories that appeared rarely or not at all. In order to perform this �ltering, we ensured thatplaces of each category were visited at least once by a minimum of 50% of the participants.
In order to identify the characteristics of signi�cant places, these were also coded for 24 descriptive character-istics that captured the ambience of the place, and the types of people that would visit the place. In this work, wefocused on the four characteristic ratings that describe the ambiance of the place. Speci�cally, we focused on thedegree to which the place was: inactive-busy, lazy-productive, distressing-relaxing, and natural-urban. �ese fourcharacteristics were rated on a 7-point Likert scale. �ese ratings from the four coders were then merged bycomputing their mean. Finally, the merged ratings were centered and rescaled from a 1 to 7 scale to a -3 to 3scale. We then transform these from a 7-point scale to a 3 points scale (-1 to 1) by using these ranges: -3 to -0.5 as-1, -0.5 to 0.5 as 0, and 0.5 to 3 as 1. �is turned the continuous variable into a categorical one and makes it likelythat we have enough data for all levels. Levels �1,0,1 represent the negative, neutral, and positive value of thelocation characteristic respectively. For instance, these ratings for inactive-busy characteristics would convert toinactive, neutral and busy.
3.4.2 App Categories. In order to investigate users’ behavior for interacting with speci�c apps, we categorizedall apps using the categories de�ned on the Google Play store. Overall, the apps belong to 11 categories,namely reading, �tness, business, photography, communication, game, lifestyle, music, social, tools, and travelapplications. However, apps of certain categories are not used by all participants. �erefore, we consider thetype of apps that were used by all participants. Consequently, we came up with the following six categories:communication, lifestyle, music, reading, social, and travel applications.
PACM on Interactive, Mobile, Wearable and Ubiquitous Technologies, Vol. 1, No. 1, Article 1. Publication date: July 2017.

1:8 • Mehrotra et al.
3.5 �antitative Measures for Notification and Phone UsageIn this section we discuss the metrics used in this study for quantifying users’ behavior in terms of theirinteractions with noti�cations and apps. We use two metrics for quantifying interaction with noti�cations –Noti�cation Receptivity and Noti�cation Seen Time, and one metric for interaction with app – App Usage Time.�ese are classic indicators widely adopted for this type of studies by the ubiquitous computing community (seefor example [16, 30]). �e de�nitions of these metrics are reported below.
• Noti�cation Receptivity: the user’s willingness to receive a noti�cation. �is metric represents howwilling a user is to receive interruptions. High receptivity (i.e., more clicks) indicates increase in thewillingness of the user to be interrupted and vice versa. In order to infer the response to a noti�cation, wecheck whether the corresponding app (which triggered the noti�cation) was launched a�er the removaltime of that noti�cation. We are aware that our approach has limitations, because some noti�cations thatdo not require further action might not be clicked rather just seen and dismissed by the user.• Noti�cation Seen Time (Noti�cation Attentiveness): the time from the noti�cation arrival until thetime the noti�cation was seen by the user. �is metric re�ects the user’s a�entiveness towards newnoti�cations. In order to detect the moment at which a noti�cation is seen, we use the unlock event ofthe phone and assume that all newly available noti�cations in the noti�cation bar are seen when the userunlocks the phone. In case a noti�cation arrives when the user is already using the phone (i.e., the phoneis unlocked), the seen time of this noti�cation would be considered equal to zero. To detect the lock andunlock events we use the Phone Interaction data (discussed in Table 1). It is worth noting that we removedall noti�cation instances that were not responded to within 2 hours. As a recent study [29] demonstratedthat people receive noti�cations every hour (from morning to late night), which are handled within a fewminutes. �erefore, we use 2-hour threshold for the maximum seen time to �lter out noti�cations thatarrived when the user was away from the phone or sleeping.• App Usage Time: duration for which an application was in foreground. More speci�cally, it is the time
interval between the launch of an application and the instant of time when it was sent to the background.We compute these metrics for each user when they are performing speci�c activities and when they are
at certain types of places. We then aggregate these metrics to compute their average values. Finally, we usestatistical tests to compare the di�erence in users’ interaction when performing di�erent activities at di�erenttypes of places.It is worth noting that while computing App Usage Time for di�erent activities, we normalize the app usage
value by dividing it by the time spent by the user engaging in the corresponding activity. Similarly, to computethe App Usage Time for di�erent types of places, we normalize the app usage value by dividing it by the timespent by the user at the corresponding place. �is step is necessary in order to avoid biases due to the relativetimes spent in a given location or while engaging in a certain activity. �erefore, the use of a non-normalizedApp Usage Time metric could produce biased results.
3.6 ProcedureWe want to investigate the in�uence of variables, including daily activities, type and characteristics of visitedlocations, on the noti�cation and phone usage behavior of users, so we consider them as the independent variables.On the other hand, our dependent variables should represent the noti�cation and phone usage behavior of users.�erefore, we use the three noti�cation and phone usage metrics (Noti�cation Receptivity, Noti�cation Seen Time,and App Usage Time) as dependent variables. �e analyses were performed for each pair of independent anddependent variables. We perform a one-way ANOVA for quantifying the di�erences in the dependent variables(i.e., Noti�cation Receptivity and Noti�cation Seen Time) that represents noti�cation interaction behavior. However,for quantifying the variability in the dependent variable (i.e., App Usage Time) that represent app usage behavior,
PACM on Interactive, Mobile, Wearable and Ubiquitous Technologies, Vol. 1, No. 1, Article 1. Publication date: July 2017.
Understanding the Role of Places and Activities on Mobile Phone Interaction and Usage Pa�erns • 1:9
●
●
●
●
●
●●
ANOVA (p<0.05)
0
10
20
30
40
work sleep chores relaxation social eat exerciseDaily Activity
Seen
Tim
e (m
ins)
(a)
●
●
●
●
●
●
●
ANOVA (p<0.05)
50
60
70
80
90
work sleep chores relaxation social eat exerciseDaily Activity
Rec
eptiv
ity (%
)
(b)
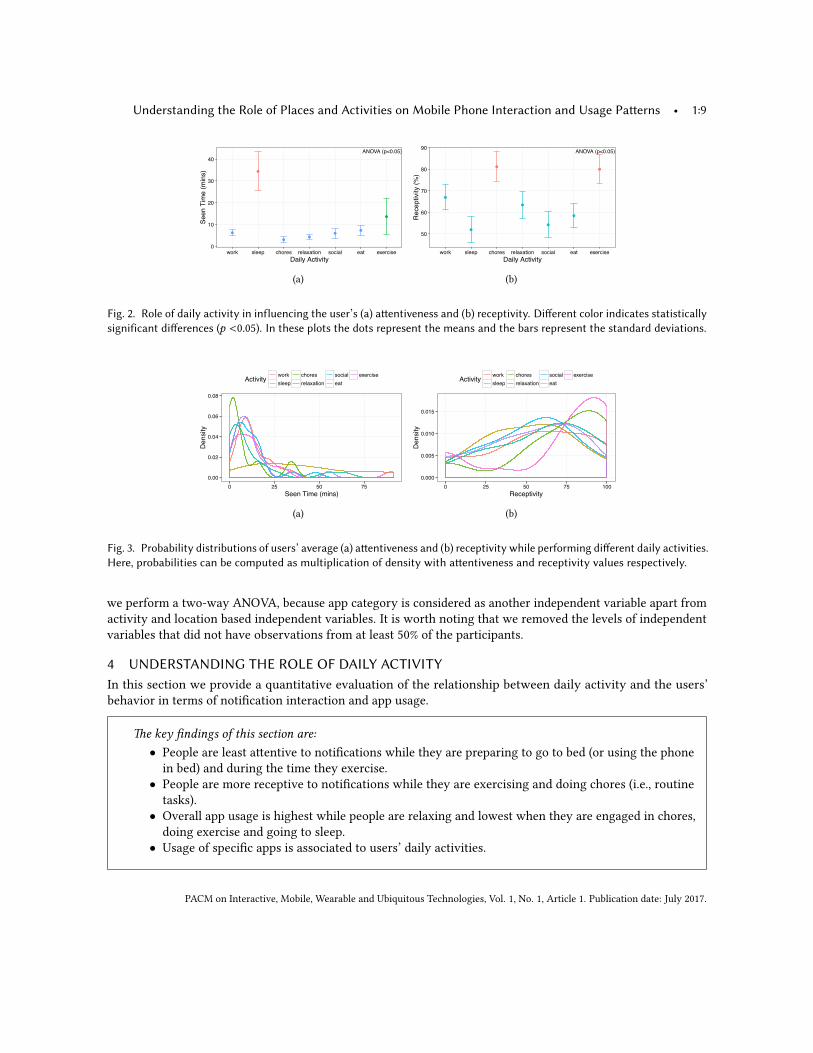
Fig. 2. Role of daily activity in influencing the user’s (a) a�entiveness and (b) receptivity. Di�erent color indicates statisticallysignificant di�erences (p <0.05). In these plots the dots represent the means and the bars represent the standard deviations.
0.00
0.02
0.04
0.06
0.08
0 25 50 75Seen Time (mins)
Den
sity
Activity worksleep
choresrelaxation
socialeat
exercise
(a)
0.000
0.005
0.010
0.015
0 25 50 75 100Receptivity
Density
Activity worksleep
choresrelaxation
socialeat
exercise
(b)
Fig. 3. Probability distributions of users’ average (a) a�entiveness and (b) receptivity while performing di�erent daily activities.Here, probabilities can be computed as multiplication of density with a�entiveness and receptivity values respectively.
we perform a two-way ANOVA, because app category is considered as another independent variable apart fromactivity and location based independent variables. It is worth noting that we removed the levels of independentvariables that did not have observations from at least 50% of the participants.
4 UNDERSTANDING THE ROLE OF DAILY ACTIVITYIn this section we provide a quantitative evaluation of the relationship between daily activity and the users’behavior in terms of noti�cation interaction and app usage.
�e key �ndings of this section are:• People are least a�entive to noti�cations while they are preparing to go to bed (or using the phonein bed) and during the time they exercise.• People are more receptive to noti�cations while they are exercising and doing chores (i.e., routinetasks).• Overall app usage is highest while people are relaxing and lowest when they are engaged in chores,doing exercise and going to sleep.• Usage of speci�c apps is associated to users’ daily activities.
PACM on Interactive, Mobile, Wearable and Ubiquitous Technologies, Vol. 1, No. 1, Article 1. Publication date: July 2017.

1:10 • Mehrotra et al.
●
●
●
●
●
●
●
●
●●
●
●
●
●
●
●●
●
●
● ●●
●
●
●
● ●
●●
●
●
●
●
● ●
●
●
●
●●
●
●
ANOVA App Category (p<0.05) Daily Activity (p<0.05)
Interaction (p<0.05)
0
1
2
3
work eat sleep social chores relaxation exerciseDaily Activity
App
Usa
ge T
ime
(%)
Application Category● ● ● ● ● ●communication lifestyle music reading social travel
Fig. 4. Relation between daily activity and application usage. In this plot the dots represent the means and the bars representthe standard deviations..
4.1 A�entiveness and ReceptivityTo investigate the relationship between daily activity and users’ a�entiveness and receptivity to noti�cations,we perform two separate one-way ANOVAs that quantify the di�erences in the user’s (i) a�entiveness and (ii)receptivity to noti�cations while they perform di�erent activities. �e results of the �rst analysis (i.e., e�ectson a�entiveness) show that there is a signi�cant e�ect of daily activities on the user’s a�entiveness, with F =4.788, p <0.05. In order to �nd which daily activities a�ect users’ a�entiveness, we perform a Tukey post-hoctest (by se�ing � equal to 0.05). As shown in Figure 2(a), the test reveals that the seen time is longest (i.e., lowa�entiveness) when noti�cations arrive while the user is sleeping. However, there is no signi�cant di�erencein a�entiveness of users while they are engaged in any other daily activity, except that they are slightly lessa�entive while exercising.�e results of the second analysis show that there is also a signi�cant e�ect of daily activities on the users’
receptivity to noti�cations, with F = 2.947, p <0.05. As shown in Figure 2(b), a Tukey post-hoc test (by se�ing �equal to 0.05) reveals that users’ are most receptive to noti�cations when they are performing chores or physicalexercise compared to other activities.
Moreover, in order to investigate the diversity in users’ a�entiveness and receptivity, in Figure 3 we present theprobability distribution of users’ average a�entiveness and receptivity while they are performing di�erent dailyactivities. �e results demonstrate that there is some variability in both a�entiveness and receptivity betweenusers. For instance, some users are considerably less a�entive to noti�cations while exercising compared to otherusers. Users’ receptivity varies across all activities.
4.2 App Usage TimeIn order to investigate the relationship between daily activities and the app usage, we perform a two-way ANOVAby se�ing app usage time as dependent variable (DV), and daily activity and app category as independent variable(IVs). Here, we use two IVs as we can quantify both the e�ect of daily activity on overall app usage time andthe e�ect of daily activity of the use of speci�c apps. �e results demonstrate that all e�ects were statisticallysigni�cant at the 0.05 signi�cance level. �e main e�ect for daily activity yielded F = 7.45 (p <0.05), indicating asigni�cant di�erence in the user’s overall app usage time (all categories considered together) while performing
PACM on Interactive, Mobile, Wearable and Ubiquitous Technologies, Vol. 1, No. 1, Article 1. Publication date: July 2017.
Understanding the Role of Places and Activities on Mobile Phone Interaction and Usage Pa�erns • 1:11
Activity work eat sleep social chores relaxation exercise
0.0
0.1
0.2
0.3
0.4
0 5 10 15App Usage Time %
Den
sity
Communication
0
2
4
6
0 2 4 6App Usage Time %
Den
sity
Lifestyle
0
20
40
60
0 2 4 6App Usage Time %
Den
sity
Reading
0.0
0.4
0.8
1.2
0 2 4 6 8App Usage Time %
Den
sity
Social
0
100
200
300
0.0 0.1 0.2 0.3App Usage Time %
Den
sity
Travel
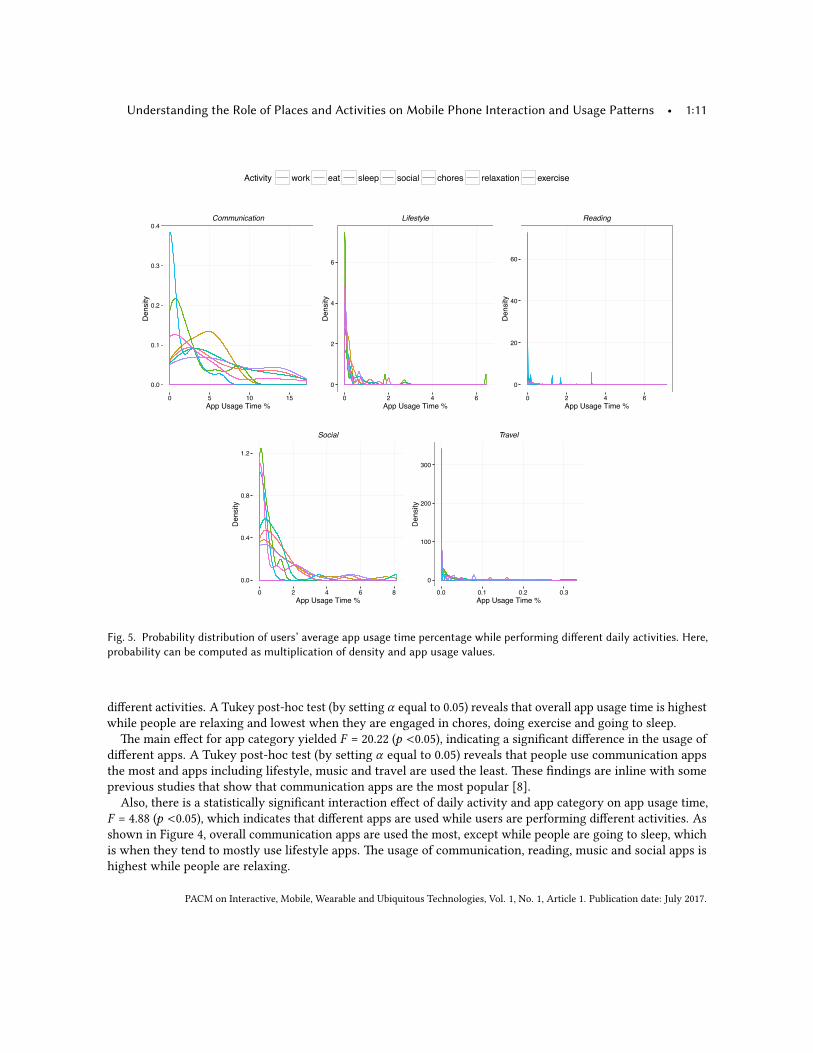
Fig. 5. Probability distribution of users’ average app usage time percentage while performing di�erent daily activities. Here,probability can be computed as multiplication of density and app usage values.
di�erent activities. A Tukey post-hoc test (by se�ing � equal to 0.05) reveals that overall app usage time is highestwhile people are relaxing and lowest when they are engaged in chores, doing exercise and going to sleep.
�e main e�ect for app category yielded F = 20.22 (p <0.05), indicating a signi�cant di�erence in the usage ofdi�erent apps. A Tukey post-hoc test (by se�ing � equal to 0.05) reveals that people use communication appsthe most and apps including lifestyle, music and travel are used the least. �ese �ndings are inline with someprevious studies that show that communication apps are the most popular [8].
Also, there is a statistically signi�cant interaction e�ect of daily activity and app category on app usage time,F = 4.88 (p <0.05), which indicates that di�erent apps are used while users are performing di�erent activities. Asshown in Figure 4, overall communication apps are used the most, except while people are going to sleep, whichis when they tend to mostly use lifestyle apps. �e usage of communication, reading, music and social apps ishighest while people are relaxing.
PACM on Interactive, Mobile, Wearable and Ubiquitous Technologies, Vol. 1, No. 1, Article 1. Publication date: July 2017.
1:12 • Mehrotra et al.
●
●
●●
●
●
●
●
●
●
●
ANOVA (p<0.05)
0
5
10
colleg
e and
librar
y
shop
ping m
all
pub a
nd re
statur
ant
green
spac
e and
lake
side
stree
t
parki
ng lo
t
reside
ntial
area
unive
rsity
area
religio
us in
stituti
on gym
bus s
top an
d trai
n stat
ion
Location Type
Seen
Tim
e (m
ins)
(a)
●
●
●
●
●● ●
●
●
●
●
ANOVA (p<0.05)
20
40
60
80
colleg
e and
librar
y
shop
ping m
all
pub a
nd re
statur
ant
green
spac
e and
lake
side
stree
t
parki
ng lo
t
reside
ntial
area
unive
rsity
area
religio
us in
stituti
on gym
bus s
top an
d trai
n stat
ion
Location Type
Rec
eptiv
ity (%
)
(b)
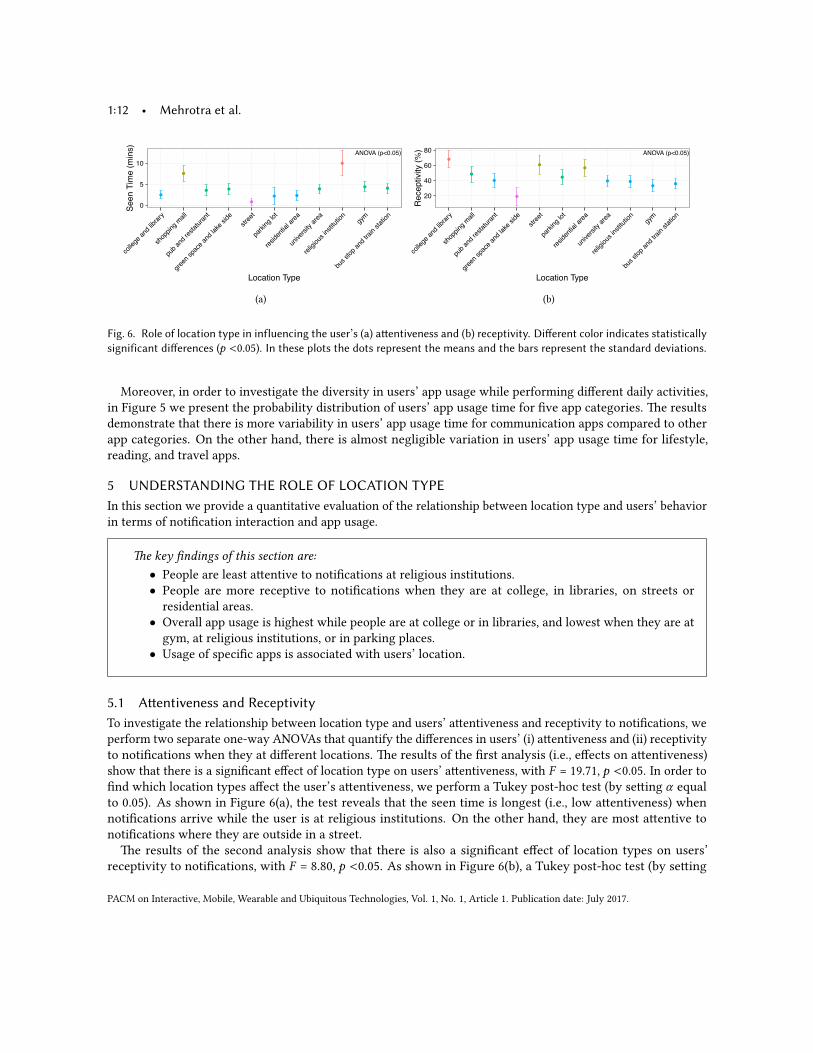
Fig. 6. Role of location type in influencing the user’s (a) a�entiveness and (b) receptivity. Di�erent color indicates statisticallysignificant di�erences (p <0.05). In these plots the dots represent the means and the bars represent the standard deviations.
Moreover, in order to investigate the diversity in users’ app usage while performing di�erent daily activities,in Figure 5 we present the probability distribution of users’ app usage time for �ve app categories. �e resultsdemonstrate that there is more variability in users’ app usage time for communication apps compared to otherapp categories. On the other hand, there is almost negligible variation in users’ app usage time for lifestyle,reading, and travel apps.
5 UNDERSTANDING THE ROLE OF LOCATION TYPEIn this section we provide a quantitative evaluation of the relationship between location type and users’ behaviorin terms of noti�cation interaction and app usage.
�e key �ndings of this section are:• People are least a�entive to noti�cations at religious institutions.• People are more receptive to noti�cations when they are at college, in libraries, on streets orresidential areas.• Overall app usage is highest while people are at college or in libraries, and lowest when they are atgym, at religious institutions, or in parking places.• Usage of speci�c apps is associated with users’ location.
5.1 A�entiveness and ReceptivityTo investigate the relationship between location type and users’ a�entiveness and receptivity to noti�cations, weperform two separate one-way ANOVAs that quantify the di�erences in users’ (i) a�entiveness and (ii) receptivityto noti�cations when they at di�erent locations. �e results of the �rst analysis (i.e., e�ects on a�entiveness)show that there is a signi�cant e�ect of location type on users’ a�entiveness, with F = 19.71, p <0.05. In order to�nd which location types a�ect the user’s a�entiveness, we perform a Tukey post-hoc test (by se�ing � equalto 0.05). As shown in Figure 6(a), the test reveals that the seen time is longest (i.e., low a�entiveness) whennoti�cations arrive while the user is at religious institutions. On the other hand, they are most a�entive tonoti�cations where they are outside in a street.�e results of the second analysis show that there is also a signi�cant e�ect of location types on users’
receptivity to noti�cations, with F = 8.80, p <0.05. As shown in Figure 6(b), a Tukey post-hoc test (by se�ing
PACM on Interactive, Mobile, Wearable and Ubiquitous Technologies, Vol. 1, No. 1, Article 1. Publication date: July 2017.

Understanding the Role of Places and Activities on Mobile Phone Interaction and Usage Pa�erns • 1:13
●
●
●
●
●
●
●
●
●●●●
●
●●●
●
●
●
●●
●
●●
●
●
●
●●●
●
●●●
●
●
●
●●●●●
●
●
●
●●●
●
●●●
●●●●●●●● ●●
●
●
●●
ANOVA App Category (p<0.05) Location Type (p<0.05)
Interaction (p<0.05)
0
2
4
6
colleg
e and
librar
y
pub a
nd re
statur
ant
green
spac
e and
lake
side
shop
ping m
all
unive
rsity
area
stree
t
parki
ng lo
t
reside
ntial
area
religio
us in
stituti
on gym
bus s
top an
d trai
n stat
ion
Location Type
App
Usa
ge T
ime
(%)
Application Category● ● ● ● ● ●communication lifestyle music reading social travel
Fig. 7. Relation between location type and application usage. In this plot the dots represent the means and the bars representthe standard deviations.
� equal to 0.05) reveals that users’ are most receptive to noti�cations when they are at college, in libraries, onstreets or in residential areas. Whereas, their receptivity to noti�cations is least when they are at green spacesand lakes side areas.
5.2 App Usage TimeIn order to investigate the relationship between location type and the app usage, we perform a two-way ANOVAby se�ing app usage time as dependent variable (DV), and location type and app category as independent variables(IVs). Here, we use two IVs as we can quantify both the e�ect of location type on overall app usage time andthe e�ect of location type of the use of speci�c apps. �e results demonstrate that all e�ects were statisticallysigni�cant at 0.05 signi�cance level. �e main e�ect for daily activity yielded F = 6.85 (p <0.05), indicating asigni�cant di�erence in the user’s overall app usage time (all categories considered together) when they are atdi�erent types of locations. A Tukey post-hoc test (by se�ing � equal to 0.05) reveals that overall app usagetime is highest while people are at college or in libraries, and it is the least when they are at gyms, at religiousinstitutions or in parking spaces.
Also, there is a statistically signi�cant interaction e�ect of location type and app category on app usage time,F = 4.56 (p <0.05), which indicates that di�erent apps are used while users are at di�erent types of locations. Asshown in Figure 7, overall communication apps are used the most, except while people are at gyms, religiousinstitutions or bus stops. Interestingly, our results show that people tend to use mostly music and reading appswhile waiting at bus stops and train stations. Similarly, another study has demonstrated that while traveling(in vehicle) people tend to use mostly music apps [8]. On the other hand, our results show that travel apps areused mostly when users are outside on the streets. In a sense, this is in-line with the �ndings of [8] in which theauthors show that when people are commuting at peak hours they tend to use travel apps.
PACM on Interactive, Mobile, Wearable and Ubiquitous Technologies, Vol. 1, No. 1, Article 1. Publication date: July 2017.

1:14 • Mehrotra et al.
●
●
●
ANOVA (p=0.73)
3
4
5
Inactive Neutral BusyPlace Characteristics
Seen
Tim
e (m
ins)
(a)
●
●
●
ANOVA (p=0.87)
35
40
45
50
Inactive Neutral BusyPlace Characteristics
Rec
eptiv
ity (%
)
(b)
Fig. 8. Role of inactive and busy nature of places in influencing users’ (a) a�entiveness and (b) receptivity. In these plots thedots represent the means and the bars represent the standard deviations.
6 UNDERSTANDING THE ROLE OF LOCATION CHARACTERISTICSIn this section we discuss the e�ects of psychological features of a place (i.e., location characteristics) on users’interaction with noti�cations and apps. Our approach is adapted from a framework for studying the psychologicalmeaning of situations (e.g., [33]). As shown in those studies [33], these psychological features of a location areimportant because they re�ect the way people perceive the environment, which could e�ect their phone usagebehavior.�erefore, in this section we analyze the e�ects of location characteristics �rstly on users’ a�entiveness
and receptivity to noti�cations and then on app usage time. In order to investigate the former, two separateone-way ANOVAs are conducted to quantify the e�ect of location characteristics on users’ (i) a�entiveness and(ii) receptivity to noti�cations. For the la�er, we conduct a two-way ANOVA to quantify the association of dailyactivity and app category on the app usage time.
�e key �ndings of this section are:• People’s a�entiveness is associated with the lazy-productive dimension of location characteristics.�ey are more a�entive to noti�cations at productive places compared to lazy places.• People’s receptivity is associated with the lazy-productive, and urban-natural dimensions of location
characteristics. �ey are more receptive to noti�cations at productive and urban places compared tolazy and natural places.• Overall app usage is less at lazy, distressing and natural places compared to productive, relaxing andurban places respectively.
6.1 Inactive vs Busy PlacesIn this sub-section we compare users’ interaction with noti�cations and apps at inactive and busy places. Placesthat were coded as inactive include green spaces, lakes side areas, residential and industrial areas. Places suchas gyms, religious institutions, college and university areas are considered as neutral, whereas places such asshopping malls, pubs and restaurants are rated as busy places.
6.1.1 E�ects on A�entiveness and Receptivity. As shown in Figure 8, our results demonstrate that there is nosigni�cant di�erence in both a�entiveness and receptivity of users when they are at inactive, neutral and busy
PACM on Interactive, Mobile, Wearable and Ubiquitous Technologies, Vol. 1, No. 1, Article 1. Publication date: July 2017.

Understanding the Role of Places and Activities on Mobile Phone Interaction and Usage Pa�erns • 1:15
●
●
●
● ●●
●
● ●
●
●
●
●
● ●
●
●
●
ANOVA App Category (p<0.05)
Place Characteristics (p=0.75) Interaction (p=0.46)
0
2
4
6
Inactive Neutral BusyPlace Characteristics
App
Usa
ge T
ime
(%)
Application Category● ● ● ● ● ●communication lifestyle music reading social travel
Fig. 9. Role of inactive and busy nature of places in influencing users’ application usage behavior. In this plot the dotsrepresent the means and the bars represent the standard deviations.
place. In other words, this indicates that the inactive-busy dimension of the place characteristics have no e�ecton users’ a�entiveness and receptivity to noti�cations.
6.1.2 E�ects on App Usage Time. As shown in Figure 9, our results demonstrate that the main e�ect of placecharacteristics (for inactive-busy dimension) is not statistically signi�cant, indicating no signi�cant di�erence inusers’ overall app usage time (all categories considered together) for inactive, neutral and busy places.
Also, there is no statistically signi�cant interaction between the e�ects of place characteristics (for inactive-busydimension) and app category on app usage time. �is demonstrates that also users’ behavior in terms of theirinteraction speci�c apps does not vary with the inactive-busy dimension of place characteristics.
6.2 Lazy vs Productive PlacesIn this sub-section we compare users’ interaction with noti�cations and apps at lazy, neutral and productiveplaces. Places that were coded as lazy include green spaces, lakes side areas, pubs and residential areas. Placessuch as religious institutions, shopping malls are considered as neutral, whereas places such as libraries, collegeand university areas are rated as productive.
6.2.1 E�ects on A�entiveness and Receptivity. �e results of our analysis show that there is a signi�cantdi�erence in users’ a�entiveness to noti�cations when they are at lazy, neutral and productive places, F = 5.43 (p<0.05). As shown in Figure 10(a), a Tukey post-hoc test (by se�ing � equal to 0.05) reveals that users are morea�entive (i.e., seen time is shortest) to noti�cations at lazy places compared to productive places. Interestingly,these �ndings go inline with one of our recent study [24] in which we have shown that people become morea�entive to noti�cations when they are engage in complicated tasks. People’s a�entiveness is high at productiveplaces could be explain with the fact that they are engaged in more complicated tasks at such places compared tothe tasks they perform at other places.
Similarly, our results demonstrate that there is a signi�cant di�erence in users’ receptivity at lazy, neutral andproductive places, F = 5.77 (p <0.05). As shown in Figure 10(b), a Tukey post-hoc test (by se�ing � equal to 0.05)reveals that users are least receptive to noti�cations at lazy places, and they are most receptive at productiveplaces. �ese �ndings indicate that people are not only paying more a�ention but also accepting more mobilenoti�cations at productive places compared to other places. �is could be due to the fact that they receive
PACM on Interactive, Mobile, Wearable and Ubiquitous Technologies, Vol. 1, No. 1, Article 1. Publication date: July 2017.

1:16 • Mehrotra et al.
●
●
●
ANOVA (p<0.05)
1
2
3
4
5
Lazy Neutral ProductivePlace Characteristics
Seen
Tim
e (m
ins)
(a)
●
●
●
ANOVA (p<0.05)
20
30
40
50
60
Lazy Neutral ProductivePlace Characteristics
Rec
eptiv
ity (%
)
(b)
Fig. 10. Results for role of lazy and productive nature of places in influencing users’ (a) a�entiveness and (b) receptivity.Di�erent color indicates statistically significant di�erences (p <0.05). In these plots the dots represent the means and thebars represent the standard deviations.
●●
●
●●
●
●
● ●
●
●
●
●
●
●
●
●
●
ANOVA App Category (p<0.05)
Place Characteristics (p<0.05) Interaction (p<0.05)
0
2
4
6
8
Lazy Neutral ProductivePlace Characteristics
App
Usa
ge T
ime
(%)
Application Category● ● ● ● ● ●communication lifestyle music reading social travel
Fig. 11. Results for role of lazy and productive nature of places in influencing users’ application usage behavior. In this plotthe dots represent the means and the bars represent the standard deviations.
important noti�cations (for example, while communicating with their colleagues), which they do not want tomiss at such place.
6.2.2 E�ects on App Usage Time. �e analysis for measuring the e�ects of place characteristics (for lazy-productive dimension) and app category on app usage time reveals that all e�ects are statistically signi�cant at the0.05 signi�cance level. As shown in Figure 11, our results demonstrate that the main e�ect of place characteristics(for lazy-productive dimension) yields F = 6.38 (p <0.05), indicating a signi�cant di�erence in users’ overall appusage time (all categories considered together) for lazy, neutral and productive places. A Tukey post-hoc test (byse�ing � equal to 0.05) reveals that users’ overall app usage time is less at lazy places compared to other places.Moreover, there is also a statistically signi�cant interaction between the e�ects of place characteristics (for
lazy-productive dimension) and app category on app usage time, F = 1.91 (p <0.05). �is indicates that peopleuse di�erent apps at lazy, neutral and productive places. For instance, our results show that people tend to use
PACM on Interactive, Mobile, Wearable and Ubiquitous Technologies, Vol. 1, No. 1, Article 1. Publication date: July 2017.

Understanding the Role of Places and Activities on Mobile Phone Interaction and Usage Pa�erns • 1:17
●
●
●
ANOVA (p=0.71)
2
3
4
Distressing Neutral RelaxingPlace Characteristics
Seen
Tim
e (m
ins)
(a)
●
●
●
ANOVA (p=0.92)
35
40
45
50
Distressing Neutral RelaxingPlace Characteristics
Rec
eptiv
ity (%
)
(b)
Fig. 12. Results for role of distressing and relaxing nature of places in influencing users’ (a) a�entiveness and (b) receptivity.In these plots the dots represent the means and the bars represent the standard deviations.
●
●●
●
●●
●
●●
●●
●
●
●
● ●
●
●
ANOVA App Category (p<0.05)
Place Characteristics (p<0.05) Interaction (p=0.09)
0
2
4
6
Distressing Neutral RelaxingPlace Characteristics
App
Usa
ge T
ime
(%)
Application Category● ● ● ● ● ●communication lifestyle music reading social travel
Fig. 13. Results for role of distressing and relaxing nature of places in influencing users’ application usage behavior. In thisplot the dots represent the means and the bars represent the standard deviations.
music apps the most at lazy places, whereas social and reading apps are used the most at productive places.Interestingly, communication and travel apps are used mostly at neutral (neither lazy nor productive) places.
6.3 Distressing vs Relaxing PlacesIn this sub-section we investigate users’ interaction with noti�cations and apps at distressing and relaxing places.Places that were coded as distressing include shopping mall and train stations. Places such as restaurants, collegesand university areas are considered as neutral, whereas places such as green spaces, lakeside areas and pubs arerated as relaxing places.
6.3.1 E�ects on A�entiveness and Receptivity. As shown in Figure 12, our results demonstrate that there is nosigni�cant di�erence in users’ a�entiveness to noti�cations when they are at distressing, neutral and relaxingplaces. Similarly, their receptivity to noti�cations shows no signi�cant di�erence at these places.
PACM on Interactive, Mobile, Wearable and Ubiquitous Technologies, Vol. 1, No. 1, Article 1. Publication date: July 2017.

1:18 • Mehrotra et al.
●
●
●
ANOVA (p=0.89)
2
3
4
5
Natural Neutral UrbanPlace Characteristics
Seen
Tim
e (m
ins)
(a)
●
●
●
ANOVA (p<0.05)
20
40
60
Natural Neutral UrbanPlace Characteristics
Rec
eptiv
ity (%
)
(b)
Fig. 14. Results for role of urban and natural nature of places in influencing users’ (a) a�entiveness and (b) receptivity.Di�erent color indicates statistically significant di�erences (p <0.05). In these plots the dots represent the means and thebars represent the standard deviations.
●
● ●
●●
●
●
● ●
●
●
●
●
●
●
●
●
●
ANOVA App Category (p<0.05)
Place Characteristics (p<0.05) Interaction (p=0.72)
0
1
2
3
4
5
Natural Neutral UrbanPlace Characteristics
App
Usa
ge T
ime
(%)
Application Category● ● ● ● ● ●communication lifestyle music reading social travel
Fig. 15. Results for role of urban and natural nature of places in influencing users’ application usage behavior. In this plotthe dots represent the means and the bars represent the standard deviations.
6.3.2 E�ects on App Usage Time. As shown in Figure 13, our results demonstrate that there is a statisticallysigni�cant main e�ect of place characteristics (for distressing-relaxing dimension) and app category on app usagetime, F = 3.82 (p <0.05). However, there is no statistically signi�cant interaction between the e�ects of placecharacteristics (for distressing-relaxing dimension) and app category on app usage time. �is indicates that onlythe overall app usage time varies depending on the place is distressing or relaxing, rather than users’ behaviorfor using speci�c apps. Finally, a Tukey post-hoc test (by se�ing � equal to 0.05) reveals that users’ overall appusage time is lower at distressing places compared to other places.
6.4 Urban vs Natural PlacesIn this sub-section we compare users’ interaction with noti�cations and apps at urban and natural places. Placesthat were coded as urban include shopping malls, train stations, residential and industrial areas. Places such as
PACM on Interactive, Mobile, Wearable and Ubiquitous Technologies, Vol. 1, No. 1, Article 1. Publication date: July 2017.

Understanding the Role of Places and Activities on Mobile Phone Interaction and Usage Pa�erns • 1:19
pubs, restaurants, college and university areas are considered as neutral, whereas places such as green spacesand lake side areas are rated as natural.
6.4.1 E�ects on A�entiveness and Receptivity. �e analysis for measuring the e�ects of place characteristics(for urban-natural dimension) on users’ interaction with noti�cations reveals that there is a statistically signi�cantdi�erence only in their receptivity (F = 16.09, p <0.05), but not in their a�entiveness to noti�cations. As shown inFigure 14, a Tukey post-hoc test (by se�ing � equal to 0.05) reveals that users are least receptive to noti�cationswhen they are spending time at nature related places, and they are most receptive at urban places. �is can bedue to the fact that people do not want to engage with mobile noti�cations while spending time at natural spaces.
6.4.2 E�ects on App Usage Time. As shown in Figure 15, our results demonstrate that the main e�ect of placecharacteristics (for urban-natural dimension) is statistically signi�cant, F = 4.19 (p <0.05). However, there is nostatistically signi�cant interaction between the e�ects of place characteristics (for urban-natural dimension) andapp category on app usage time. �is indicates that there is a signi�cant di�erence only in users’ overall appusage time (all categories considered together), rather than their behavior for using speci�c apps at urban, neutraland natural places. Finally, a Tukey post-hoc test (by se�ing � equal to 0.05) reveals that users’ overall app usagetime is lower at natural places compared to other places, indicating that they do not engage with phones at suchplaces.
7 DISCUSSION AND LIMITATIONSIn this paper we have presented an in-situ study for investigating users’ interaction with mobile noti�cationsand apps while performing di�erent activities and at locations with di�erent characteristics. To the best of ourknowledge, this is the �rst study that analyzes the interactions with real-world noti�cations and app usage atsuch a �ne-grained level. We believe that the �ndings of this work can be used to build e�ective noti�cationmechanisms. Moreover, the �ndings of this paper can be used as a basis for the development of predictiveapplications for personalization that rely on the analysis of users’ current locations and not only on their pastbehavioral pa�erns.However, we do not have su�cient evidence to claim that our �ndings are generalizable as they are based
on a speci�c demographics, i.e., university students. In the future, we plan to conduct the same analysis on alarger scale with di�erent demographics in order to understand if there are statistically signi�cant di�erencesin the general population. It is worth noting that the methodology proposed in this paper can be applied toheterogeneous populations. �is will require a su�ciently large number of participants for each demographicgroup. It is also interesting to point out that in the study presented in this paper the coders are from the samedemographic group. If we aim to introduce diversity in our dataset, we also have to recruit coders of similardemographics, which is not trivial in general.
On the other hand, it is also worth noting that a similar analysis of non-homogeneous population based on theaggregation of the results would not be correct either. �is is because users of di�erent demographics wouldhave variability in terms of app usage and noti�cation interaction behaviors, which could not be aggregated. Onemay consider recruiting alarger and more diverse group of participants to study how certain user behaviors mayremain (statistically) stable or di�er along speci�c demographicdimensions.Similar to other studies in this area, our investigation also has some limitations that stem from our decision
to collect data in-the-wild with minimum interaction with users. When it comes to the computation of users’sa�entiveness (i.e., seen time) to a noti�cation, we can only detect it if a user unlocked the phone. We assumethat all noti�cations are seen when a user unlocks the phone, which is a realistic assumption. However, itmight happen that a noti�cation arrives when the user is already engaged with the phone. In such a case, weassume that the user will see the noti�cation immediately and consider its seen time as zero. �is is a commonlimitation in most of the interruptibility studies relying on passive sensing [23, 30]. In our dataset 6.85% of the
PACM on Interactive, Mobile, Wearable and Ubiquitous Technologies, Vol. 1, No. 1, Article 1. Publication date: July 2017.

1:20 • Mehrotra et al.
overall noti�cations were delivered when users were already engaged with their phones. However, 62% of thesenoti�cations arrived with high priority and, for this reason, they were forced to appear as popups on the top ofthe phone’s screen; this indicates that these noti�cations were de�nitely seen immediately. As a consequence,there are only 2.6% of the overall noti�cations that were assumed as seen immediately as they arrived with lowpriority when users were engaged with their phone. At the same time, it is very unlikely that users take a longtime to view noti�cations while using their phones. �erefore, the impact on our results related to noti�cationseen time could be considered negligible.
Similarly, for computing users’ receptivity to noti�cations, it is possible that some noti�cations were misclassi-�ed as dismissed. In fact, they might have been actually a�ended by the users on another device or they mighthave been just read on the lock screen and ignored because they did not require further actions. It is worth notingthat we have removed noti�cations from reminder apps as they always trigger alerts that do not require anyfurther actions. We computed the percentage of noti�cations clicked for each app and those that have this valueas zero are considered as reminder apps. Our dataset contained 1.45% of such noti�cations, and given such asmall amount of uncertain labels (i.e., whether these noti�cation were actually clicked or not), we believe thatour results for receptivity of noti�cations would have a negligible impact of this limitation. Moreover, identifyingnoti�cations of other apps that were dismissed because they do not require any further action is not possible inthe current mobile platforms.Finally, another limitation is that we relied on users’ daily self-reported activities through questionnaire
responses. Since this is not a controlled lab experiment, there might be some cases where users’ recollectionmight not be completely precise. �is is a common problem of in-the-wild diary-based studies [9].
8 CONCLUSIONSIn this paper we have presented an in-situ study with the aim of investigating a series of �ne-grained contextualfactors, including daily activities and characteristics of places visited, which in�uence users’ interaction withmobile phones. �e contributions of this study are twofold. First, we focused on identifying the factors thatimpact the user’s a�entiveness and receptivity to noti�cations. Second, we investigated how users’ app usagebehavior changes when they are at places re�ecting di�erent characteristics such as boring, happy and naturalplaces, to name a few.
�rough a mixed method of automated mobile phone logging and ESM sampling we have obtained a datasetof in-the-wild noti�cations, app usage events and ESM reports about daily activities from 26 students at a UKuniversity. We have analyzed the data to show that users’ a�entiveness and receptivity are associated to theirdi�erent daily activities as well as the characteristics of locations visited. Moreover, we have shown that userinteraction and usage pa�erns are associated to di�erent place characteristics and activities.Our research agenda includes a larger study involving di�erent cohorts of participants and the analysis of
causal relationships in our dataset using the methodology described in [36].
9 ACKNOWLEDGEMENTS�is work was supported by�e Alan Turing Institute under the EPSRC grant EP/N510129/1, at UCL throughthe EPSRC grants EP/L018829/2, at Cambridge and UCL through the EPSRC grant EP/I032673/1, and at Austinthrough NFS grant BCS-1520288.
REFERENCES[1] 2016. Android’s Noti�cation Listener Service. (2016). h�p://developer.android.com/reference/android/service/noti�cation/
Noti�cationListenerService.html.[2] 2016. Android’s Usage Stats Manager. h�ps://developer.android.com/reference/android/app/usage/UsageStatsManager.html. (2016).[3] 2016. Google’s Place Types. h�ps://developers.google.com/places/supported types. (2016).
PACM on Interactive, Mobile, Wearable and Ubiquitous Technologies, Vol. 1, No. 1, Article 1. Publication date: July 2017.

Understanding the Role of Places and Activities on Mobile Phone Interaction and Usage Pa�erns • 1:21
[4] Piotr D Adamczyk and Brian P Bailey. 2004. If not now, when?: the e�ects of interruption at di�erent moments within task execution.In CHI’04.
[5] Gediminas Adomavicius and Alexander Tuzhilin. 2015. Context-aware recommender systems. In Recommender Systems Handbook.[6] Brian P Bailey and Joseph A Konstan. 2006. On the need for a�ention-aware systems: Measuring e�ects of interruption on task
performance, error rate, and a�ective state. Computers in Human Behavior 22, 4 (2006), 685–708.[7] Brian P Bailey, Joseph A Konstan, and John V Carlis. 2001. �e e�ects of interruptions on task performance, annoyance, and anxiety in
the user interface. In INTERACT’01.[8] Ma�hias Bohmer, Brent Hecht, Johannes Schoning, Antonio Kruger, and Gernot Bauer. 2011. Falling asleep with Angry Birds, Facebook
and Kindle: a large scale study on mobile application usage. In MobileHCI’11.[9] Niall Bolger, Angelina Davis, and Eshkol Rafaeli. 2003. Diary methods: Capturing life as it is lived. Annual Review of Psychology 54, 1
(2003), 579–616.[10] Sarah Bu� and James G Phillips. 2008. Personality and self reported mobile phone use. Computers in Human Behavior 24, 2 (2008),
346–360.[11] Gokul Chi�aranjan, Jan Blom, and Daniel Gatica-Perez. 2013. Mining large-scale smartphone data for personality studies. Personal and
Ubiquitous Computing 17, 3 (2013), 433–450.[12] Edward Cutrell, Mary Czerwinski, and Eric Horvitz. 2001. Noti�cation, disruption, and memory: E�ects of messaging interruptions on
memory and performance. In INTERACT’01.[13] Nathan Eagle, Yves-Alexandre de Montjoye, and Luıs MA Be�encourt. 2009. Community computing: Comparisons between rural and
urban societies using mobile phone data. In CSE’09.[14] Hossein Falaki, Ratul Mahajan, Srikanth Kandula, Dimitrios Lymberopoulos, Ramesh Govindan, and Deborah Estrin. 2010. Diversity in
smartphone usage. In MobiSys’10.[15] Denzil Ferreira, Jorge Goncalves, Vassilis Kostakos, Louise Barkhuus, and Anind K Dey. 2014. Contextual experience sampling of mobile
application micro-usage. In MobileHCI’14.[16] Joel E Fischer, Nick Yee, Victoria Bello�i, Nathan Good, Steve Benford, and Chris Greenhalgh. 2010. E�ects of content and time of
delivery on receptivity to mobile interruptions. In MobileHCI’10.[17] Kazunori Hanyu. 2000. Visual properties and a�ective appraisals in residential areas in daylight. Journal of Environmental Psychology
20, 3 (2000), 273–284.[18] Alexis Hiniker, Shwetak N Patel, Tadayoshi Kohno, and Julie A Kientz. 2016. Why would you do that? predicting the uses and
grati�cations behind smartphone-usage behaviors. In UbiComp’16.[19] Shamsi T Iqbal and Eric Horvitz. 2010. Noti�cations and awareness: a �eld study of alert usage and preferences. In CSCW’10.[20] Predrag Klasnja and Wanda Pra�. 2012. Healthcare in the pocket: mapping the space of mobile-phone health interventions. Journal of
Biomedical Informatics 45, 1 (2012), 184–198.[21] Nicholas D. Lane, Emiliano Miluzzo, Hong Lu, Daniel Peebles, Tanzeem Choudhury, and Andrew T. Campbell. 2010. A Survey of Mobile
Phone Sensing. IEEE Communications Magazine 48, 9 (2010), 140–150.[22] Abhinav Mehrotra, Robert Hendley, and Mirco Musolesi. 2016. PrefMiner: Mining User’s Preferences for Intelligent Mobile Noti�cation
Management. In Proceedings of UbiComp’16.[23] Abhinav Mehrotra, Mirco Musolesi, Robert Hendley, and Veljko Pejovic. 2015. Designing Content-driven Intelligent Noti�cation
Mechanisms for Mobile Applications. In UbiComp’15.[24] Abhinav Mehrotra, Veljko Pejovic, Jo Vermeulen, Robert Hendley, and Mirco Musolesi. 2016. My Phone and Me: Understanding People’s
Receptivity to Mobile Noti�cations. In CHI’16.[25] Jack L Nasar. 1998. �e evaluative image of the city. Sage Publications.[26] Panagiotis Papapetrou and George Roussos. 2014. Social context discovery from temporal app use pa�erns. In UbiComp’14 Adjunct.[27] Abhinav Parate, Ma�hias Bohmer, David Chu, Deepak Ganesan, and Benjamin M Marlin. 2013. Practical prediction and prefetch for
faster access to applications on mobile phones. In UbiComp’13. Zurich, Switzerland.[28] Veljko Pejovic and Mirco Musolesi. 2014. InterruptMe: designing intelligent prompting mechanisms for pervasive applications. In
UbiComp’14.[29] Martin Pielot, Karen Church, and Rodrigo de Oliveira. 2014. An in-situ study of mobile phone noti�cations. In MobileHCI’14.[30] Martin Pielot, Rodrigo de Oliveira, Haewoon Kwak, and Nuria Oliver. 2014. Didn’t you see my message?: predicting a�entiveness to
mobile instant messages. In CHI’14.[31] Mika Raento, An�i Oulasvirta, Renaud Petit, and Hannu Toivonen. 2005. ContextPhone: A prototyping platform for context-aware
mobile applications. IEEE Pervasive Computing 4, 2 (2005), 51–59.[32] Ahmad Rahmati, Chad Tossell, Clayton Shepard, Philip Kortum, and Lin Zhong. 2012. Exploring iPhone usage: the in�uence of
socioeconomic di�erences on smartphone adoption, usage and usability. In MobileHCI’12.[33] John F Rauthmann, Ryne A Sherman, and David C Funder. 2015. Principles of situation research: Towards a be�er understanding of
psychological situations. European Journal of Personality 29, 3 (2015), 363–381.
PACM on Interactive, Mobile, Wearable and Ubiquitous Technologies, Vol. 1, No. 1, Article 1. Publication date: July 2017.

1:22 • Mehrotra et al.
[34] Yvonne Rogers and Paul Marshall. 2017. Research in the Wild. Morgan & Claypool Publishers.[35] Alireza Sahami Shirazi, Niels Henze, Tilman Dingler, Martin Pielot, Dominik Weber, and Albrecht Schmidt. 2014. Large-scale assessment
of mobile noti�cations. In CHI’14.[36] Fani Tsapeli and Mirco Musolesi. 2015. Investigating causality in human behavior from smartphone sensor data: a quasi-experimental
approach. EPJ Data Science 4, 1 (2015), 1–15.[37] Qiang Xu, Je�rey Erman, Alexandre Gerber, Zhuoqing Mao, Je�rey Pang, and Shobha Venkataraman. 2011. Identifying diverse usage
behaviors of smartphone apps. In IMC’11.[38] Ye Xu, Mu Lin, Hong Lu, Giuseppe Cardone, Nicholas Lane, Zhenyu Chen, Andrew Campbell, and Tanzeem Choudhury. 2013. Preference,
context and communities: A multi-faceted approach to predicting smartphone app usage pa�erns. In ISWC’13.
PACM on Interactive, Mobile, Wearable and Ubiquitous Technologies, Vol. 1, No. 1, Article 1. Publication date: July 2017.