influence of places of resident activities on spatial
TRANSCRIPT

Social Sciences 2021; 10(3): 101-112
http://www.sciencepublishinggroup.com/j/ss
doi: 10.11648/j.ss.20211003.14
ISSN: 2326-9863 (Print); ISSN: 2326-988X (Online)
Influence of Places of Resident Activities on Spatial Distribution of Drug-Related Crimes
Yimeng Liu1, Weihong Li
2, *, Guoqing Liu
1, Xiaorui Yang
1, Yunjian Guo
1, Kewen Zhang
1
1School of Geography, South China Normal University, Guangzhou, China 2SCNU Qingyuan Institute of Science and Technology Innovation Co., Ltd., Qingyuan, China
Email address:
*Corresponding author
To cite this article: Yimeng Liu, Weihong Li, Guoqing Liu, Xiaorui Yang, Yunjian Guo, Kewen Zhang. Influence of Places of Resident Activities on Spatial
Distribution of Drug-Related Crimes. Social Sciences. Vol. 10, No. 3, 2021, pp. 101-112. doi: 10.11648/j.ss.20211003.14
Received: May 10, 2021; Accepted: May 24, 2021; Published: May 31, 2021
Abstract: Drug-related crimes have become a common worldwide concern, and studies have considered the influence of
different types of land use on such crimes. However, the dynamic visitor flow rate has rarely been taken into consideration when
analyzing the cause of drug-related crimes, with most studies only using static population distribution data. Differences between
the main factors associated with drug-related crimes on different streets have also rarely been discussed. In this study, the spatial
distribution of and factors associated with drug-related crimes were explored from the perspective of residents’daily activities, and
the main factors associated with such crimes on different streets were compared and analyzed. The results indicate that
drug-related crimes are characterized by significant spatial heterogeneity and clustering; the spatial distribution of drug-related
crimes is closely correlated with places of resident activity. More specifically, the denser the distribution of restaurant services and
recreational facilities (e.g., cyber cafes and bars) on a street, the more likely drug-related crimes are to occur there. Drug-related
crimes on different streets are associated with different factors those on commercial-oriented streets are mainly distributed in areas
with dense restaurant services and recreational facilities, while those on streets dominated by industrial parks, residential areas,
and woodlands primarily occur where there are high-density traffic facilities and cyber cafes or areas with a high visitor flow rate.
Keywords: Drug-Related Crimes, Land Use Type, Dynamic Visitor Flow Rate, Crime Geography
1. Introduction
According to the 2018 Report on China’s Drug Control
Situation, approximately 275 million people worldwide have
used opium, heroin, cocaine, marijuana, ice and other drugs
at least once, and nearly 31 million of them have become
addicted. Drug abuse not only brings serious harm to the
drug users themselves and their families, but is also likely to
trigger a number of illegal activities, such as theft. Through
recognizing, analyzing, and understanding the spatial
distribution of drug-related crimes, we can provide a basis for
decision-making to address these issues. This analysis can
also offer a data reference for the complete management and
planning of urban development.
Environmental criminology has its origins in 19th-century
studies of dangerous places. After [1] Jacobs initiated the theory
of “eyes on the street,” further studies focused on the geography
of crime [2]. Empirical findings support Jacobs’ perspectives
that compact urban characteristics, such as walkability, density,
and land-use diversity tend to attract more people onto the
streets and generate more interactions between inhabitants, thus
nurturing a stronger sense of community and reducing crime by
increasing natural surveillance and informal social control [3, 4].
However, there is also relevant criminological literature
suggesting that mixed land use exerts a deleterious impact on
neighborhood crime by weakening both residents’ inclination
and effectiveness in performing social control [5, 6]. Specifically,
mixed land use can attract more people to the community, while
greater population numbers and density likely increase the
number of potential offenders and targets, thus leading to more
crime and forming more crime hotspots [7-9]. Studies have also
found that different types of land use have different degrees of
attraction to crime [10, 11]. Different places of interest (POIs),
such as retail, abandoned buildings, and gas stations, can attract
more criminal activities [12-14]. In geographic criminology, it is

Social Sciences 2021; 10(3): 101-112 102
increasingly recognized that the appropriate spatial unit of
analysis needs to be considered explicitly and carefully chosen
[15]. At different spatial scales, crime concentration (specifically,
burglary and family theft) differs [16]. Researchers have found
that crimes are more concentrated when smaller geographic
units were used for analysis, and recent research has focused on
addresses [17, 18], street segments [19-22], and houses [23, 24].
There is an internal relationship between drug-related crimes
and geographical factors. Most of the targets of drug sales, for
example, are drug addicts, so the areas where drug addicts
gather will form the main areas for drug sales. Drug traffickers
generally choose places with low supervision and a relatively
high concentration of buyers. To ensure that the drug caches are
not found, safety and concealment of traffic between where
drugs are sold and where they are stored are also considered by
drug traffickers. Eck compared the characteristics of points with
and without drug trafficking in an area of San Diego in the
United States and found that places with characteristics
including lack of monitoring and easy access are prone to
drug-related crimes [25]. Weisburd and Green pointed out that
similar drug markets have similar boundaries, which are usually
formed by drug trafficking activities in various locations. If there
are enough objects near the offender’s residence, the dealer
usually does not have to travel far between the crime location
and residence [26]. Xu used spatial analysis technology to
analyze the spatial and temporal distribution characteristics of
drug crimes and found a concentrated distribution [27]. Such
studies suggest that geographic information can reflect the
unique regularity of drug-related crimes [28-30]. In recent years,
with rapid social and economic development, population
mobility has become increasingly frequent, which has led to the
frequent occurrence of urban drug-related crimes. The
relationship between residents’ activities, urban facilities, and
such crimes has become a focus of academic research, but the
dynamic visitor flow rate [31-37] has rarely been taken into
consideration for the analysis of this association, which tends to
use only static population distribution data. Existing studies have
also rarely considered whether there are differences in the
factors associated with drug-related crimes between different
regions. This study therefore explores the spatial distribution of
and factors associated with drug-related crimes from the
perspective of residents' daily activities and makes a
comparative analysis of the main factors related to such crimes
on different streets. By understanding the spatial distribution and
related factors of drug crimes, we can formulate different
prevention and control policies for different streets and achieve
more targeted regional management.
2. Study Area and Data
2.1. Study Area
This article uses initials to anonymize the study area.
District Z of City A was the study area (see Figure 1). As part
of a relatively developed coastal city in China. District Z is a
fast-developing urban district with convenient transportation
and large population mobility within City A. District Z
covers an area of 78.75 km2, with an estimated total
population of 1,039,900, and it has the largest concentration
of drug-related crimes in City A. With many large-area urban
villages, District Z is home to traditional crimes, such as
violent assault, theft, pornography, gambling, drug abuse, and
trafficking, which made it a suitable choice as a study area.
Figure 1. Study area.

103 Yimeng Liu et al.: Influence of Places of Resident Activities on Spatial Distribution of Drug-Related Crimes
2.2. Data
2.2.1. Case Data
The drug-related crime data in this paper were composed
of records of emergency calls received by the police and
were obtained from the City A Public Security Bureau in
2017. The drug-related crimes analyzed in this paper refer to
all kinds of drug crimes (including smuggling, trafficking,
transporting, manufacturing, and illegally possessing drugs).
Through preliminary screening, 5,287 drug crime incidents
were identified; each crime had a clear case address and case
category, as well as including the coordinates and time of the
crime. Before the formal analysis, criminal cases outside the
study area were manually corrected based on the case address
description and removed. Incompletely recorded cases were
also removed. After processing, the data from 5,233
drug-related crimes were considered.
2.2.2. Traffic Data
The traffic data primarily covered information regarding
bus stations, subway stations, and roads. The road data came
from a 2018 high-definition satellite map provided by
BIGEMAP, and the road vector data of District Z were
obtained by vectorization and clipping. Information for the
bus stations and subway stations was obtained through the
2018 API of Amap using Python code from 2018; data from
this source was then cropped to get the District Z bus station
point data and subway station data. Table 1 shows the
cropped traffic data for District Z.
2.2.3. Resident Activity Data
Resident activity data largely included location
information for resident activities and the dynamic visitor
flow rate. In this paper, the land type for the residential
activities was classified by POI data, which refer to the
point with the name, category, longitude, and latitude (i.e.,
navigation map information). POI data were also obtained
through the API of Amap using Python code. Simple
pre-processing was performed to eliminate invalid POI data,
and locations for resident activities were divided into eight
land-use types according to the daily travel of the residents
[38] (see Table 1). The dynamic traffic data for this study
were obtained using Tencent and Python code. The Tencent
travel data came from the Tencent location big data service
window (http://heat.qq.com/index.php). Based on the large
number of users of Tencent products, this service records
the real-time location of active users of Tencent products
such as QQ (800 million users), WeChat (350 million users),
Qzone (600 million users), Tencent Games (200 million
users), and Tencent website (130 million users), with a
coverage of about 99.3% of the total population in China;
this means that this data can accurately reflect the spatial
distribution of the population in the study area. Network
crawling of the real-time location data of users had certain
restrictions on the size and amount of data obtained.
Therefore, based on the restrictions, we selected November
12, 2018 as the data extraction node. November 12 was a
normal workday, so it was likely representative of typical
patterns. Using Python code, we obtained suitable travel
thermal data in District Z for 23 periods from 01:00 to
24:00 on November 12, 2018, with a time interval of 10
minutes. The higher the thermodynamic value, the denser
the population (see Figure 2).
Figure 2. Heat map of the dynamic visitor flow rate.

Social Sciences 2021; 10(3): 101-112 104
Table 1. Description of variables.
Variables Mean Std dev. Min Max Description
Total number of drug-related crime cases
within blocks 523.3 851.6 15 2724
The number of drug-related crimes in the blocks was taken as the
dependent variable
Traffic data within blocks The numbers for three types of traffic data were taken as the independent
variables. Further, data about bus stations and subway stations were
obtained by counting the number of facilities in the block. The road
network density was obtained by calculating the ratio of the total length
of all of the roads in the block to the total area of the block.
Bus stations 216.8 61.2 135 264
Subway stations 3.7 2.5 0 8
The road network density (km/km2) 19.4 8.3 4.6 30.5
Locations of resident activities within blocks
The numbers for eight types of locations of resident activities data
were taken as the independent variables. The data were obtained by
counting the number of facilities within the block.
Markets 4.6 2.1 2 9
Shopping malls 84 50.8 35 840
Restaurant services 363.8 244.2 162 987
Karaoke TV establishments (KTVs) 7 9.1 0 32
Cinemas 3 2.7 0 9
Bars 13 21.0 0 74
Cyber cafes 8 6.1 3 25
Accommodation services 304.2 165.5 117 709
Average value of the dynamic visitor flow
rate within blocks 930.6 254.9 590 1477
The dynamic visitor flow rates were taken as the independent variables.
The daily average visitor flow density value for each block was obtained
by calculating the 24-hour dynamic visitor value of the blocks.
3. Methods
In this study, the factors associated with drug-related
crimes were primarily explored from the perspective of
residents’ daily activities. Research has shown that the most
comfortable walking distance for most people is 300–500 m
[39]. Hence, to facilitate matrix calculation, a 21 (row) × 31
(column) grid was generated according to the size of the
study area, with each grid being 500 m × 500 m, to ensure
the data accuracy and spatial distribution continuity of
drug-related crimes. We used the Geodetector method to
explore and analyze the differences in the main associated
factors present on different blocks (see Table 1). Figure 3
shows the specific process.
Figure 3. Flow map of the methodology.

105 Yimeng Liu et al.: Influence of Places of Resident Activities on Spatial Distribution of Drug-Related Crimes
3.1. Global Moran’s I
Proposed by Moran in 1948, Global Moran’s I reflects
spatial adjacency or the similarity between the attribute
values of adjacent regional units. The degree of spatial
autocorrelation is represented by Global Moran’s I, which
can be calculated using Equation (1):
i,j1 1
20
1
ω zn n
i ji j
n
ii
nI
z
S z
= =
=
=∑∑
∑
(1)
where Zi denotes the difference between an attribute value of
event i and its average value, ωi,j is the weight between event
i and event j, and n is the number of events. Global Moran’s I
ranges from −1 to +1. The closer the value is to −1, the
greater the difference between the units or the less
concentrated the distribution. The closer the value is to 1, the
closer the relationship between the units, and the more
similar these units are to each other (high-value aggregation
or low-value aggregation). If the value is close to 0, there is
no correlation between units [40].
3.2. Getis-Ord Gi*
Getis-Ord Gi* was specifically used to calculate the
clustering of crime hot spots. By calculating the local G
statistic of each element in the weight set, the location where
the high-value or low-value elements cluster was determined
using Equation (2):
i,j ,* 1 1
2 2
, i,j1
[ ( ) ]
1
ω ω
ω ω
n n
j i jj j
i n n
i jj j
X
n
Sn
xG
= =
=
−
=
−
−
∑ ∑
∑ ∑
(2)
where xi is the attribute value of element j, ωi,j is the spatial
weight between elements i and j, n is the total number of
elements, and
1
n
jj
Xn
x==∑
(3)
2
1 2( )
n
jj
S Xn
x== −∑
(4)
The Gi* returned by each element is the Z statistic value.
For statistically significant positive Z values, the higher the Z
value, the more significant the clustering effect of the hot
spots. For statistically significant negative Z values (the
lower the Z value) the closer the cold spots are clustered. The
so-called cold spots are areas with a significantly lower
concentration of criminal acts than the surrounding areas.
3.3. Geodetector
The spatial distribution of drug-related crimes is restricted
by different spatial and geographic factors. Geodetector can
effectively identify different geographical factors and the
impact of the interaction between different geographical
factors on drug-related crimes. The principle is to test the
coupling of the two spatial distributions—that is, attribute
and factor spatial differentiation [41]. The Geodetector q
statistic can be used to measure spatial heterogeneity, identify
explanatory factors, and analyze the interaction among
variables. The q value was calculated as follows:
212
1q 1
nσ
mi i in σ== − ∑ (5)
where is the index of factor X on drug-related crime Y,
the variance of Y is composed of m strata (i=1, 2, …, m),
is the variance of drug-related crimes in the entire region, n
represents the number of samples in the study area, m
denotes the number of secondary regions, and is the
variance of the number of drug-related crimes in secondary
regions. When ≠0, the model is tenable. ∈[0, 1]; when
= 0, the number of drug-related crimes is not affected by
the factors. The larger the value for , the greater the
factor’s explanatory power. The explanatory effect is best
when =1.
There were two reasons we chose Geodetector to analyze
factors correlated with drug crimes. First, the sample size was
under 30 for analysis of the factors associated with
drug-related crimes in the block, but a sample size greater than
30 is needed for multiple regression, but Geodetector can
detect correlations when the sample size is under 30 and
achieve the accuracy that other models need a larger sample
size to achieve. Second, the correlation between drug-related
crime and the surrounding environment is complex, not
simply linear and there is a strong correlation between
independent variables. The commonly used correlation
coefficient analysis method must make linear assumptions,
but Geodetector makes no linear assumption for the variable
because it belongs to the category of variance analysis. The
value of q reflects the explanatory percentage of independent
variable x to dependent variable y(100 * q)%. Unlike multiple
regression analysis, the Geodetector model is not affected by
the collinearity of multiple independent variables; however, it
should be noted that any continuous factors needs to be
discretized. The advantages and disadvantages of the
discretization algorithm directly affect the accuracy of the
evaluation results. The independent variables and dependent
variable in this paper are discrete factors, so we used
Geodetector to carry out the correlation analysis.
q
2σ
2
iσ
2
iσ q
q
q
q
Social Sciences 2021; 10(3): 101-112 106
4. Results
4.1. Spatial Distribution of Drug-Related Crimes
Global Moran’s I was used to analyze the sites of
drug-related crimes in District Z; the resulting value was
0.7210, which indicates a significant spatial correlation. The
value of Z was 16.6360, which is much larger than the
critical Z-score of 2.58 at a confidence level of 99%.
Therefore, the spatial distribution of drug-related crimes in
District Z of City A was characterized by a clustering pattern.
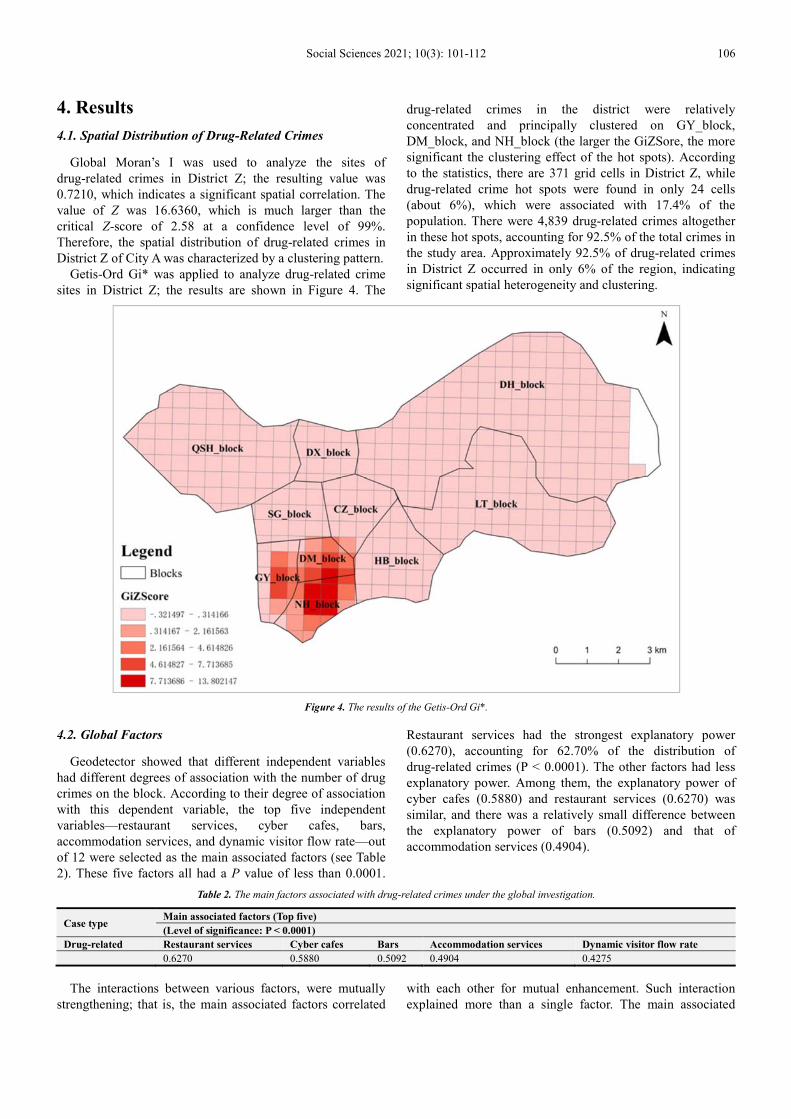
Getis-Ord Gi* was applied to analyze drug-related crime
sites in District Z; the results are shown in Figure 4. The
drug-related crimes in the district were relatively
concentrated and principally clustered on GY_block,
DM_block, and NH_block (the larger the GiZSore, the more
significant the clustering effect of the hot spots). According
to the statistics, there are 371 grid cells in District Z, while
drug-related crime hot spots were found in only 24 cells
(about 6%), which were associated with 17.4% of the
population. There were 4,839 drug-related crimes altogether
in these hot spots, accounting for 92.5% of the total crimes in
the study area. Approximately 92.5% of drug-related crimes
in District Z occurred in only 6% of the region, indicating
significant spatial heterogeneity and clustering.
Figure 4. The results of the Getis-Ord Gi*.
4.2. Global Factors
Geodetector showed that different independent variables
had different degrees of association with the number of drug
crimes on the block. According to their degree of association
with this dependent variable, the top five independent
variables—restaurant services, cyber cafes, bars,
accommodation services, and dynamic visitor flow rate—out
of 12 were selected as the main associated factors (see Table
2). These five factors all had a P value of less than 0.0001.
Restaurant services had the strongest explanatory power
(0.6270), accounting for 62.70% of the distribution of
drug-related crimes (P < 0.0001). The other factors had less
explanatory power. Among them, the explanatory power of
cyber cafes (0.5880) and restaurant services (0.6270) was
similar, and there was a relatively small difference between
the explanatory power of bars (0.5092) and that of
accommodation services (0.4904).
Table 2. The main factors associated with drug-related crimes under the global investigation.
Case type Main associated factors (Top five)
(Level of significance: P < 0.0001)
Drug-related Restaurant services Cyber cafes Bars Accommodation services Dynamic visitor flow rate
0.6270 0.5880 0.5092 0.4904 0.4275
The interactions between various factors, were mutually
strengthening; that is, the main associated factors correlated
with each other for mutual enhancement. Such interaction
explained more than a single factor. The main associated
107 Yimeng Liu et al.: Influence of Places of Resident Activities on Spatial Distribution of Drug-Related Crimes
factors and the other factors were tested in pairs to calculate
the degree of correlation (q value), and the three factors with
the highest q values were selected as the main correlated
factors (see Table 3).
Table 3. Main related factors of the associated factors.
Case type Main associated factor Main related factor 1 (q values) Main related factor 2 (q values) Main related factor 3 (q values)
Drug-related
Restaurant services Cyber cafes KTVs Shopping malls
0.7239 0.7238 0.7201
Cyber cafes Bars Shopping malls KTVs
0.8575 0.8204 0.7977
Bars Cyber cafes Accommodation services KTVs
0.8575 0.7820 0.7208
Accommodation services Bars KTVs Cyber cafes
0.7820 0.7417 0.7037
Dynamic visitor flow rate Cyber cafes KTVs Restaurant services
0.7513 0.7041 0.6940
Note: Frequently appearing factors are shown in bold.
Overall, the main associated factors for drug-related
crimes were often correlated factors of the main factors. This
was especially the case for cyber cafes and bars (0.8575).
Additionally, karaoke TV establishments (KTVs) and cyber
cafes were the most frequently correlated among the main
associated factors. Based on the global analysis, the places
where drug-related crimes are concentrated are often places
with densely distributed restaurant services and recreational
facilities that can gather a large number of people.
4.3. Associated Factors of Each Block
With blocks in District Z as the statistical unit, the main
associated factors for drug-related crimes on different blocks
were comparatively analyzed (see Table 4). The results
showed that on DM_block, DX_block, GY_block, and
NH_block, all of the associated factors tended to have a
strong power in explaining the distribution of drug-related
crimes. On DM_block, DX_block, and GY_block, the main
associated factors were similar, most of which were shopping
malls, restaurant services, accommodation services, and the
dynamic visitor flow rate. Recreational facilities (KTVs, bars,
and cyber cafes), shopping malls, and restaurant services
were the main associated factors on NH_block. On other
blocks, the explanatory power of various factors was
relatively low, but the main associated factors mostly
included restaurant services, accommodation services, and
dynamic visitor flow rate. In other words, on the blocks
where drug-related crimes were weakly related to various
factors, the explanatory power of restaurant services,
accommodation services, and dynamic visitor flow rate on
drug-related crimes was relatively weak; however, they were
still the most correlated factors for drug-related crimes.
Table 4. The main associated factors of drug-related crimes for each block.
Block Main associated factors (Top five) (Level of significance: P < 0.0001)
CZ_block Cinemas Accommodation services Restaurant services Dynamic visitor flow rate Bars
0.3288 0.328 0.3214 0.2559 0.2368
DH_block Dynamic visitor flow rate Restaurant services Bus stations Shopping malls Road network density
0.0801 0.0660 0.0434 0.0362 0.0312
DM_block Bus stations Cyber cafes Accommodation services Shopping malls Dynamic visitor flow rate
0.9034 0.8957 0.6812 0.5724 0.5373
DX_block Shopping malls Dynamic visitor flow rate Cyber cafes Restaurant services Accommodation services
0.9506 0.9259 0.7135 0.6666 0.5556
GY_block Cyber cafes Dynamic visitor flow rate Road network density Shopping malls Accommodation services
0.8007 0.6625 0.3729 0.2196 0.2076
HB_block Dynamic visitor flow rate Restaurant services Cinemas Accommodation services Cyber cafes
0.7053 0.6328 0.5965 0.5912 0.3986
LT_block Dynamic visitor flow rate Accommodation services Restaurant services Shopping malls Bus stations
0.5822 0.4585 0.3211 0.1923 0.1548
NH_block KTVs Bars Cyber cafes Shopping malls Restaurant services
0.8693 0.8377 0.709 0.7915 0.7911
QSH_block Dynamic visitor flow rate Restaurant services Cyber cafes Road network density Accommodation services
0.4446 0.3062 0.2283 0.1744 0.1658
SG_block Cyber cafes Bars Accommodation services Road network density Dynamic visitor flow rate
0.3234 0.3182 0.2376 0.2136 0.2012
There appeared to be a mutually strengthening interaction
between the factors associated with drug-related crimes on
each block was detected (see Table 5); that is, the main
associated factors correlated with each other for mutual
enhancement. On DM_block, the main associated factors
were also the primary correlated factors. Restaurant services
and recreational facilities (bars, KTVs, and cyber cafes) were
the most frequently correlated factors among the main
associated factors, indicating that areas on DM_block where
drug-related crimes were relatively concentrated usually had

Social Sciences 2021; 10(3): 101-112 108
densely distributed restaurant services and recreational
facilities. On DX_block, restaurant services and the dynamic
visitor flow rate were the most frequently correlated factors
among the main associated factors, indicating that
drug-related crimes were often concentrated in places where
people gather. On GY_block, the main associated factors
were closely related to traffic factors (e.g., the density of bus
stations and road networks) and the density of recreational
facilities (KTVs, bars and cyber cafes), which means that
convenient transportation and concentrated recreational
facilities were the primary factors that led to the clustering of
drug-related crimes on GY_block. On NH_block, among the
main associated factors, recreational facilities (KTVs, bars,
cyber cafes and cinemas), were the correlated factor that
appeared most frequently, indicating that the main reason for
the aggregation of drug-related crimes on NH_block was the
existence of many such facilities. Because the correlation
coefficient of the main associated factors of drug-related
crimes was comparatively low on the other blocks, only the
first correlated factors, which are few in number (see Table 5)
are discussed here. On CZ_block and DH_block, the main
associated factors were most closely correlated with traffic
factors (the density of bus stations and road networks). On
HB_block and LT_block, they were most closely correlated
with the dynamic visitor flow rate while on QSH_block and
SG_block, they were most closely related to cyber cafes.
Table 5. Main factors related to the associated factors.
Case type Main associated factor Main related factor 1 (q values) Main related factor 2 (q values) Main related factor 3 (q values)
CZ_block
Cinemas KTVs Restaurant services Subway stations
0.9078 0.9058 0.8895
Accommodation services Road network density Restaurant services KTVs
0.955 0.9437 0.9366
Restaurant services Bus stations Accommodation services Dynamic visitor flow rate
0.9783 0.9437 0.9117
Dynamic visitor flow rate Road network density Restaurant services KTVs
0.92 0.9117 0.8944
Bars Bus stations Cinemas Accommodation services
0.7513 0.7041 0.6194
DH_block
Dynamic visitor flow rate Road network density Restaurant services Bars
0.135 0.1151 0.1041
Restaurant services Road network density Dynamic visitor flow rate Accommodation services
0.1177 0.1151 0.0964
Bus stations Road network density Dynamic visitor flow rate Restaurant services
0.132 0.1012 0.0953
Shopping malls Dynamic visitor flow rate Restaurant services Bus stations
0.092 0.0855 0.0826
Road network density Dynamic visitor flow rate Bus stations Restaurant services
0.135 0.132 0.1177
DM_block
Bus stations Bars Accommodation services Shopping malls
0.9812 0.9703 0.9703
Cyber cafes Road network density Restaurant services Accommodation services
0.9824 0.9703 0.9703
Accommodation services Restaurant services KTVs Bus stations
0.9703 0.9703 0.9703
Shopping malls Road network density Bars Restaurant services
0.9803 0.9802 0.9704
Dynamic visitor flow rate Bus stations Restaurant services Markets
0.9347 0.9347 0.9347
DX_block
Shopping malls Restaurant services Bars Dynamic visitor flow rate
0.9824 0.9675 0.9567
Dynamic visitor flow rate Road network density Restaurant services Shopping malls
0.9856 0.983 0.9567
Cyber cafes Shopping malls Cinemas Dynamic visitor flow rate
0.9567 0.9567 0.9566
Restaurant services Dynamic visitor flow rate Shopping malls Accommodation services
0.9568 0.9567 0.9435
Accommodation services Restaurant services Dynamic visitor flow rate Shopping malls
0.9435 0.9327 0.9214
GY_block
Cyber cafes Bus stations Restaurant services Bars
0.9846 0.9808 0.9671
Dynamic visitor flow rate Bus stations Bars Cyber cafes
0.9998 0.9996 0.9524
Road network density KTVs Cyber cafes Accommodation services
0.9996 0.8874 0.8811
Shopping malls Bars Cyber cafes Road network density
0.9568 0.9567 0.6272
Accommodation services Bars Dynamic visitor flow rate Road network density

109 Yimeng Liu et al.: Influence of Places of Resident Activities on Spatial Distribution of Drug-Related Crimes
Case type Main associated factor Main related factor 1 (q values) Main related factor 2 (q values) Main related factor 3 (q values)
0.9848 0.8855 0.8811
HB_block
Dynamic visitor flow rate Cinemas Accommodation services Markets
0.9934 0.8417 0.8417
Restaurant services Markets Cinemas Road network density
0.8886 0.8605 0.8066
Cinemas Dynamic visitor flow rate Restaurant services Shopping malls
0.9934 0.8605 0.799
Accommodation services Dynamic visitor flow rate Shopping malls Cinemas
0.8417 0.8171 0.768
Cyber cafes Dynamic visitor flow rate Restaurant services Markets
0.748 0.7304 0.6967
LT_block
Dynamic visitor flow rate Restaurant services Accommodation services Road network density
0.9291 0.9246 0.6554
Accommodation services Dynamic visitor flow rate Road network density Bus stations
0.9246 0.9244 0.9158
Restaurant services Dynamic visitor flow rate Road network density Bus stations
0.9291 0.9266 0.9218
Shopping malls Dynamic visitor flow rate Accommodation services Road network density
0.6268 0.479 0.454
Bus stations Restaurant services Accommodation services Dynamic visitor flow rate
0.9218 0.9158 0.6368
NH_block
KTVs Cyber cafes Bars Road network density
0.9972 0.9972 0.9962
Bars KTVs Cyber cafes Cinemas
0.9972 0.9958 0.9932
Cyber cafes KTVs Bars Cinemas
0.9972 0.9958 0.9958
Shopping malls KTVs Cinemas Bars
0.9798 0.9792 0.9403
Restaurant services Cinemas Cyber cafes Bus stations
0.9933 0.9518 0.9146
QSH_block
Dynamic visitor flow rate Cyber cafes Bus stations Restaurant services
0.8921 0.7414 0.6894
Restaurant services Cyber cafes Dynamic visitor flow rate Bus stations
0.8522 0.6894 0.5011
Cyber cafes Dynamic visitor flow rate Restaurant services Accommodation services
0.8921 0.8522 0.8176
Road network density Cyber cafes Bus stations Dynamic visitor flow rate
0.8156 0.7133 0.4786
Accommodation services Cyber cafes Bus stations Dynamic visitor flow rate
0.8176 0.4692 0.466
SG_block
Cyber cafes Accommodation services Bus stations Dynamic visitor flow rate
0.9829 0.9826 0.9801
Bars Cyber cafes Markets Dynamic visitor flow rate
0.8598 0.8004 0.7646
Accommodation services Cyber cafes Bus stations Bars
0.8921 0.8522 0.8176
Road network density Cyber cafes Bus stations KTVs
0.9829 0.8059 0.5504
Dynamic visitor flow rate Cyber cafes Bars Bus stations
0.9801 0.7646 0.6744
Note: Frequently appearing factors are shown in bold.
5. Discussion
By conducting a global analysis of drug-related crimes
using Moran’s I index, we found that they feature strong
spatial autocorrelation; that is, there is a significant
aggregation phenomenon in the distribution of drug-related
crimes. The local index Gi* was used to carry out a hot spot
analysis of drug-related crimes. According to the analysis,
there are 371 grid cells in District Z, and we found
drug-related crime hot spots in only 24 cells (about 6%).
There were altogether 4,839 drug-related crimes in these hot
spots, accounting for 92.5% of the total crimes in the study
area. In other words, about 92.5% of drug-related crimes in
District Z occurred in only 6% of the region; which indicates
the presence of clear hot spots for drug-related crimes [42,
43], This means that, with efforts on drug control being
constantly strengthened, drug traffickers are becoming
increasingly cautious and choose locations with slack
supervision and relatively concentrated buyers. Moreover,
because drug-related crimes involve high risk, criminals tend
to commit crimes in places with a higher success rate but a
lower risk coefficient, so these crimes are characterized by

Social Sciences 2021; 10(3): 101-112 110
significant spatial heterogeneity and clustering. Drug-related
crimes are not irregular. Eck argued that drug-related crimes
often occur in places with characteristics such as lack of
monitoring and easy access. Xu used big data integration
analysis and determined that about 30% to 40% of drug crimes
are concentrated in less than 5% of police service areas. And J
Hibdon found a high degree of concentration of drug calls
across all street segments in Seattle. Due to the influence of
geographical location, natural and economic conditions,
different cultural levels, and inconsistent anti-drug efforts in
different regions, there are differences in the spatial
distribution of drug-related crimes. Understanding this spatial
distribution can help to deter drug-related crimes effectively.
By analyzing the global associated factors of drug-related
crimes, we found that restaurant services (0.6270) and
recreational facilities (cyber cafes, 0.5880; bars, 0.5092) have
the strongest explanatory power; that is, restaurant services
were able to explain 62.70% of the distribution of
drug-related crimes at a confidence level of 99.99%, while
cyber cafes and bars were able to explain 58.80% and
50.92%, respectively, of the distribution at a confidence level
of 99.99%. Moreover, the interaction between various factors
appears to be mostly mutual strengthening. The most
frequent correlated factors are KTVs, cyber cafes, and bars,
suggesting that the concentration of drug-related crimes is
closely related to locations of resident activities and that the
areas with concentrated distribution of drug-related crimes
are usually where restaurant services and recreational
facilities are densely distributed [44]. Featuring long business
hours, mixed populations, and a lack of standardized
management, these places are the main breeding grounds for
drug-related crimes. The denser the distribution of restaurant
services and recreational facilities (e.g., cyber cafes and bars)
in an area, the more likely drug-related crimes are to occur in
that area, which further supports the viewpoint that criminal
acts are closely correlated with geographical factors [45].
Studies have found that the drug markets were not randomly
distributed and were particularly likely to form near schools.
In District Z (10 blocks), drug-related crimes on
DM_block, DX_block, GY_block, and NH_block were
strongly correlated with the locations of resident activities,
while such a correlation was relatively weak for the
remaining blocks. DM_block, GY_block, and NH_block are
close to each other; with a large number of commercial
department stores, squares, and shopping malls, these are the
most economically prosperous blocks in District Z, resulting
in a high population density throughout the day. Although
DX_block also has shopping malls and squares, the block
covers a smaller area and is less prosperous than DM_block,
GY_block, and NH_block, and drug-related crimes are
accordingly less concentrated. The remaining blocks are
mostly dominated by industrial parks, buildings, residential
areas, and woodlands, where there are fewer services to
attract people, so the concentration of drug-related crimes is
accordingly relatively low. The main associated factors of
drug-related crimes vary from one block to another, because
the main functional facilities differ. On commercially
oriented blocks (DM_block, GY_block, DX_block, and
NH_block), drug-related crimes are mainly distributed in
areas with dense restaurant services and recreational facilities,
which can gather a large number of people. Blocks
dominated by industrial parks and residential areas
(CZ_block, SG_block, HB_block, and LT_block) are
equipped with convenient transportation, and drug-related
crimes are mainly distributed in areas with dense
transportation facilities and cyber cafes as well as a high
dynamic visitor flow rate. On woodland-based blocks
(QSH_block and DH_block), residents’ daily activities are
restricted, and there are fewer places where crowds gather, so
drug-related crimes are mainly found in areas where
transportation facilities and cyber cafes are densely
distributed.
Drug-related crimes do not happen irregularly. Their
spatial distribution shows an obvious aggregation—that is,
there are “crime hotspots.” This spatial distribution is also
closely correlated with places of resident activity.
Specifically, the denser the distribution of restaurant services
and recreational facilities (e.g., cyber cafes and bars) on a
street, the more likely drug-related crimes are to occur.
Moreover, affected by the geographical location, natural
conditions, economic conditions, different cultural levels,
and inconsistent anti-drug efforts, the characteristics of drug
crimes differ widely by region. Countermeasures should be
put forward according to the facilities on different streets. On
commercially oriented blocks (DM_block, GY_block,
DX_block, and NH_block), drug-related crimes are mainly
distributed in areas with dense restaurant services and
recreational facilities; it is necessary to strengthen the key
investigations of KTVs, bars, and other entertainment places
within the jurisdiction, conduct surprise inspections, urge
those in charge and the employees of all entertainment places
to comprehensively strengthen drug-control management,
standardize the system of responsibility for drug control, and
resolutely prevent such places from becoming hideouts for
drug abuse and drug trafficking activities. On blocks
dominated by industrial parks and residential areas
(CZ_block, SG_block, HB_block, and LT_block),
drug-related crimes are primarily found in areas with
high-density traffic facilities and cyber cafes or areas with a
high visitor flow rate, so it is necessary to strengthen
detection at bus and subway stations, as well as strengthening
anti-drug publicity and preventive education among key
groups such as residents and employees in the jurisdiction.
For woodland-based blocks (QSH_block and DH_block),
drug-related crimes mainly happen in areas where traffic
facilities and cyber cafes are densely distributed, so it is
necessary to increase the deployment of the police force,
increase the frequency of public security patrols, and enhance
the role of surveillance to deter crime in those areas. It is
important to grasp the geographical differences in drug
crimes and rationally allocate resources to reduce the crime
rate and provide people with a safe and secure urban
environment.

111 Yimeng Liu et al.: Influence of Places of Resident Activities on Spatial Distribution of Drug-Related Crimes
6. Conclusions
Based on the 2017 data on drug-related crimes in District Z of
City A, spatial analysis and geographical factors were used to
analyze the distribution of drug-related crimes and associated
factors in District Z from the perspective of residents’ daily
activities. Three main conclusions were drawn. First,
drug-related crimes are characterized by significant spatial
heterogeneity and clustering. About 92.5% of drug-related
crimes in District Z occurred in only 6% of the region. Second,
the spatial distribution of drug-related crimes is closely related to
the locations of resident activities. Locations supporting
different resident activity have different explanatory power on
the concentration of drug-related crimes. Restaurant services
(0.6270) and recreational facilities (cyber cafes, 0.5880; bars,
0.5092) have the strongest explanatory power, so the more
densely restaurant services and recreational facilities (e.g., cyber
cafes and bars) are distributed in an area, the more likely
drug-related crimes are to occur in that area. Third, the
distribution of drug-related crime varies from block to block. On
commercially oriented blocks (DM_block, GY_block,
DX_block, and NH_block), drug-related crimes mainly occur in
areas with dense restaurant services and recreational facilities;
on blocks dominated by industrial parks and residential areas
(CZ_block, SG_block, HB_block, and LT_block), such crimes
are primarily found in areas with high-density traffic facilities
and cyber cafes or areas with a high visitor flow rate; while on
woodland-based blocks (QSH_block and DH_block),
drug-related crimes mainly happen in areas where traffic
facilities and cyber cafes are densely distributed.
In this study, the factors associated with drug-related crimes
were quantitatively analyzed based on the dynamic visitor flow
rate from the perspective of residents’ daily activities, to
determine how the distribution of such crimes is affected by
different locations. The associated factors were also
comparatively analyzed for different blocks, providing a
reference for reasonably allocating police resources. In the
future research work, we will carry out supplementary research
from two aspects. On the one hand, we will refine the locations
of resident activities to further explore the areas where
drug-related crimes are more concentrated and distributed. On
the other hand, it is to supplement the sex, age, education and
other related factors of the criminal, to further enrich the
research. Based on the conclusions reached in this study, by
rationally allocating police resources to major places crowded
with people, it would be possible to crack down effectively on
drug-related crimes, reduce their incidence, and provide urban
residents with a more comfortable and healthier living
environment. Attaching importance to spatial prevention and
control is a fundamental and effective way to alleviate or
fundamentally solve the problem of urban crime.
References
[1] Li WH, Tong HX. Improved K-Means-Boosting BP model that targets unbalanced police intelligence data. Journal of Image and Graphics. 2017; 22 (09): 1314-24.
[2] Harries KD. Geography of crime and justice. Bureau of Justice Statistics. 1974; 66 (1): 104-5.
[3] Fowler EP. Street Management and City Design. Social Forces. 1987; 66 (2): 365.
[4] Newman O. Defensible Space: Crime Prevention through Urban Design. American Political Science Association. 1972; 69 (1): 279-80.
[5] Kurtz EM, Koons BA, Taylor RB. Land use, physical deterioration, resident-based control, and calls for service on urban streetblocks. Justice Quarterly. 1998; 15 (1): 121-49.
[6] Taylor RB, Koons BA, Kurtz EM, Greene JR, Perkins DD. Street blocks with more non-residential land use have more physical deterioration: Evidence from Baltimore and Philadelphia. Urban Affairs Review. 1995; 31 (1): 120-36.
[7] Bowers, Kate. Exploring links between crime and disadvantage in north-west England: an analysis using geographical information systems. International Journal of Geographical Information Science. 1999; 13 (2): 159-84.
[8] Hipp JR, Aaron R. Micro- and Macro-Environment Population and the Consequences for Crime Rates. Social Forces. (2): 563-95.
[9] Hirschfield A, Bowers KJ. The Effect of Social Cohesion on Levels of Recorded Crime in Disadvantaged Areas. Urban Studies. 1997; 34 (8): 1275-95.
[10] Browning CR, Byron RA, Calder CA, Krivo LJ, Kwan MP, Lee JY, et al. Commercial Density, Residential Concentration, and Crime: Land Use Patterns and Violence in Neighborhood Context. Journal of Research in Crime & Delinquency. 2015; 47 (3): 329-57.
[11] Toomey TL, Erickson DJ, Carlin BP, Lenk KM, Quick HS, Jones AM, et al. The association between density of alcohol establishments and violent crime within urban neighborhoods. Alcoholism: Clinical and Experimental Research. 2012; 36 (8): 1468-73.
[12] Stucky TD, Ottensmann JR. Land use and Violent crime. Criminology. 2010; 47 (4): 1223-64.
[13] Braga AA, Papachristos AV, Hureau DM. The effects of hot spots policing on crime: An updated systematic review and meta-analysis. Justice quarterly. 2014; 31 (4): 633-63.
[14] Chaney RA, Rojas-Guyler L. Spatial patterns of adolescent drug use. Applied Geography. 2015; 56: 71-82.
[15] Weisburd D, Gerben B, Wim B. Units of Analysis in Geographic Criminology: Historical Development, Critical Issues and Open Questions. Ssrn Electronic Journal. 2015.
[16] Musah A, Umar F, Yakubu KN, Ahmad M, Babagana A, Ahmed A, et al. Assessing the impacts of various street-level characteristics on the burden of urban burglary in Kaduna, Nigeria. Applied Geography. 2020; 114: 102-26.
[17] Sherman LW, Gartin PR, Buerger ME. Hot spots of predatory crime: Routine activities and the criminology of place. Criminology. 1989; 27 (1): 27-56.
[18] Gill C, Wooditch A, Weisburd D. Testing the “law of crime concentration at place” in a suburban setting: Implications for research and practice. Journal of Quantitative Criminology. 2017; 33 (3): 519-45.

Social Sciences 2021; 10(3): 101-112 112
[19] Davies T, Johnson SD. Examining the relationship between road structure and burglary risk via quantitative network analysis. Journal of Quantitative Criminology. 2015; 31 (3): 481-507.
[20] Weisburd D, Bushway S, Lum C, Yang SM. Trajectories of crime at places: A longitudinal study of street segments in the city of Seattle. Criminology. 2004; 42 (2): 283-322.
[21] Davies T, Bowers KJ. Street networks and crime. The Oxford Handbook of Environmental Criminology 2018.
[22] Frith MJ, Johnson SD, Fry HM. Role of the street network in burglars’spatial decision-making. Criminology. 2017; 55 (2): 344-76.
[23] Umar F, Johnson SD, Cheshire JA. Assessing the Spatial Concentration of Urban Crime: An Insight from Nigeria. Journal of Quantitative Criminology. 2020; (1): 1-20.
[24] Schnell C, Braga AA, Piza EL. The influence of community areas, neighborhood clusters, and street segments on the spatial variability of violent crime in Chicago. Journal of quantitative criminology. 2017; 33 (3): 469-96.
[25] Eck JE, Wartell J. Reducing Crime and Drug Dealing by Improving Place Management: A Randomized Experiment. Bureau of Justice Statistics. 1999.
[26] Weisburd D, Eck JE. What Can Police Do to Reduce Crime, Disorder, and Fear? Annals of the American Academy of Political & Social Science. 2004; 593 (1): 42-65.
[27] Xu H. Research on Taiwan New Taipei City Regional Distribution of Drug Crime by the Application of Big Data Information. Journal of Henan Police College. 2018; v. 27; No. 159 (02): 41-58.
[28] Friman HR. Drug markets and the selective use of violence. Crime Law & Social Change. 2009.
[29] Lum, C. Violence, Drug Markets and Racial Composition: Challenging Stereotypes through Spatial Analysis. Urban Stud. 2011; 48 (13): 2715-32.
[30] Ajzenman N, Galiani S, Seira E. On the distributive costs of drug-related homicides. The Journal of Law and Economics. 2015; 58 (4): 779-803.
[31] Luo F, Cao G, Mulligan K, Li X. Explore spatiotemporal and demographic characteristics of human mobility via Twitter: A case study of Chicago. Applied Geography. 2016; 70: 11-25.
[32] Ma X, Liu C, Wen H, Wang Y, Wu Y-J. Understanding commuting patterns using transit smart card data. Journal of Transport Geography. 2017; 58: 135-45.
[33] Wu H, Liu L, Yu Y, Peng Z, Jiao H, Niu Q. An agent-based model simulation of human mobility based on mobile phone data: how commuting relates to congestion. ISPRS International Journal of Geo-Information. 2019; 8 (7): 313.
[34] Li M, Gao S, Lu F, Zhang H. Reconstruction of human movement trajectories from large-scale low-frequency mobile phone data. Computers, Environment and Urban Systems. 2019; 77: 101346.
[35] Guo S, Yang G, Pei T, Ma T, Song C, Shu H, et al. Analysis of factors affecting urban park service area in Beijing: Perspectives from multi-source geographic data. Landscape and urban planning. 2019; 181: 103-17.
[36] Feng D, Tu L, Sun Z. Research on Population Spatiotemporal Aggregation Characteristics of a Small City: A Case Study on Shehong County Based on Baidu Heat Maps. Sustainability. 2019; 11 (22): 6276.
[37] Zhang Z, Xiao Y, Luo X, Zhou M. Urban human activity density spatiotemporal variations and the relationship with geographical factors: An exploratory Baidu heatmaps-based analysis of Wuhan, China. Growth and Change. 2020; 51 (1): 505-29.
[38] Song G, Xiao L, Zhou S, Long D, Liu K. Impact of residents' routine activities on the spatial-temporal pattern of theft from person. Acta Geographica Sinica. 2017; 72 (02): 356-67.
[39] Wu JS, Qin W, Peng J, Li WF. The Evaluation of Walkability and Daily Facility Distribution Reasonability of Futian District, Shenzhen Based on Walk Score [J]. Urban Development Studies. 2014; 10: 49-56.
[40] Chen YG. Reconstructing the mathematical process of spatial autocorrelation based on Moran’s statistics. Geographical Research. 2009; 28 (6): 1449-63.
[41] Wang J, Xu C. Geodetector: Principle and prospective. Acta Geographica Sinica. 2017; 72 (1): 116-34.
[42] Barnum JD, Campbell WL, Trocchio S, Caplan JM, Kennedy LW. Examining the environmental characteristics of drug dealing locations. Crime & Delinquency. 2017; 63 (13): 1731-56.
[43] Xu C, Liu L, Zhou SH. Patterns of near-repeat street robbery in DP peninsula. Geographical Research. 2015; 34 (2): 384-94.
[44] Liu YM, Li WH, Wang X. Spatiotemporal distribution of drug crimes at micro- scale: Taking NH and DM residential communities in SZ City as an example. Progress in Geography. 2020; 39 (5): 841-52.
[45] Li XK, Yu C. On the Construction and Application of Geographic Models in the Prevention and Control of Drug Crimes. Journal of Beijing Police College. 2013; 06: 94-100.